global perspectives on milk production, dairy demand ... · pdf fileglobal perspectives on...
TRANSCRIPT

5/6/16
1
06/05/2016 © IFCN 2016
Global Perspectives on Milk Production, Dairy Demand, Prices and Risk Changing Perspective of IFCN- On Milk Production, Prices and India
IFCNDairyResearchNetworkGermany,associated with UniversityKielPrashantTripathi,[email protected]
06/05/2016 © IFCN 2016
Milk production 2014 by regions
Country data: Milk production 2014 (cow and buffalo) in ECM. Regional data: Milk production 2014 (cow and buffalo) in natural fat and protein content. If not available 2013 data was taken for IN, NZ,2011 for AR.
Source: D3.2 - Dairy Sector Analysis with Base Line Projection 2025
India157

5/6/16
2
06/05/2016 © IFCN 2016
Worlds milk production growth2006- 1/2016 and estimates for Feb-April 2016
Change in global milk supply (YoY)
Key findings
1. Milk supply growth reacts on dairy farm economics but with a substantial delay.
2. EU Post quota supply was stronger than expected and counted for ca. 1% point growth since 4/2015
3. IFCN estimated world milk supply growth for April 2016 at 1,5%
Key facts of this data base
1. 60 countries (>90% worlds milk)
2. ECM corrected (4% fat, 3,3% protein)
3. Leap year adjusted
4. Real time estimates (last 1-3 month)
5. Updates real time (mid of each month)
06/05/2016 © IFCN 2016
Deviation of national milk price from world milk price April 2016 (estimation)
60 countr ies analysed: EU-28, CIS: Armenia, Azerbaijan, Belarus, Kazakhstan, Kyrgyzstan, Moldova, Russia, Tajikistan, Ukraine , Uzbekistan,USA & Canada: Canada, USA, Latin America: Argentina , Brazil , Chile , Colombia , Mexico, Peru, Uruguay, Oceania: Australia, New Zealand, Asia: Bangladesh, China, India, Indonesia, Japan, Pakistan, Afr ica: Egypt, South Africa. Other: Switzerland, Turkey, Iran. Countries included represent 92% of world milk production. Data is preliminary or estimated.
10
13
13
11
8
12
7EUweightedaverageis9USDaboveworldmilkprice
389
-2.3-2.2
-1 2.4
10
5/6/16
3
06/05/2016 © IFCN 2016
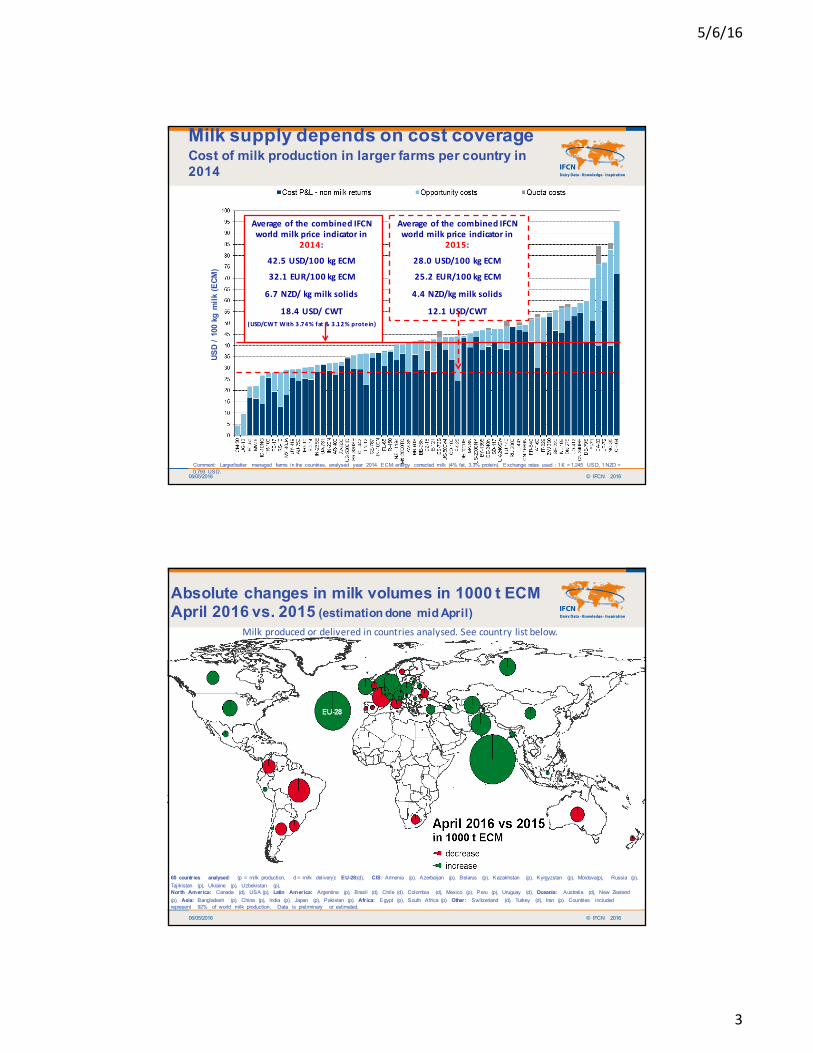
Milk supply depends on cost coverage Cost of milk production in larger farms per country in 2014
USD
/ 100
kg
milk
(ECM
)AverageofthecombinedIFCNworldmilkpriceindicatorin
2014:
42.5USD/100kgECM
32.1EUR/100kgECM
6.7NZD/kgmilksolids
18.4USD/CWT(USD/CWTWith3.74%fat&3.12%protein)
Comment: Larger/better managed farms in the countries, analysed year: 2014. ECM: energy corrected milk (4% fat, 3.3% protein). Exchange rates used : 1 € = 1.245 USD, 1 NZD = 0.793 USD.
AverageofthecombinedIFCNworldmilkpriceindicatorin
2015:
28.0USD/100kgECM
25.2EUR/100kgECM
4.4NZD/kgmilksolids
12.1USD/CWT
06/05/2016 © IFCN 2016
Absolute changes in milk volumes in 1000 t ECMApril 2016 vs. 2015 (estimation done mid April)
60 countr ies analysed: (p = milk production, d = milk delivery): EU-28:(d), CIS: Armenia (p), Azerbaijan (p), Belarus (p), Kazakhstan (p), Kyrgyzstan (p), Moldova(p), Russia (p), Tajikistan (p), Ukraine (p), Uzbekistan (p),North America: Canada (d), USA (p), Latin America: Argentina (p), Brazil (d), Chile (d), Colombia (d), Mexico (p), Peru (p), Uruguay (d), Oceania: Australia (d), New Zealand (p), Asia: Bangladesh (p), China (p), India (p), Japan (p), Pakistan (p), Afr ica: Egypt (p), South Africa (p). Other: Switzerland (d), Turkey (d), Iran (p). Countries included represent 92% of world milk production. Data is preliminary or estimated.
Milkproducedordeliveredincountriesanalysed.Seecountrylistbelow.

5/6/16
4
06/05/2016 © IFCN 2016
Source: IFCN database
Where are the farms located?Number of dairy farms 2014, incl. estimates
Source: D3.2 - Dairy Sector Analysis with Base Line Projection 2025
Total number of dairy farms in 2014: 123.6 million- 1% decrease vs 2013
PK7mill
India76mill
06/05/2016 © IFCN 2016
India milk price developments 2006-16and the three phases
Source: D3.2 - Dairy Sector Analysis with Base Line Projection 2025
10
20
30
40
50
60
Jan-0
6
Jan-0
7
Jan-0
8
Jan-0
9
Jan-1
0
Jan-1
1
Jan-1
2
Jan-1
3
Jan-1
4
Jan-1
5
Jan-1
6
US-$
/ 100
kg EC
M 4%
fat /
3.3%
prote
in
Farm gate milk price in India
IFCN World Milk Price Indicator
1
2
31
22

5/6/16
5
06/05/2016 © IFCN 2016
India milk price and dairy trade 2006-15
Source: D3.2 - Dairy Sector Analysis with Base Line Projection 2025
10
20
30
40
50
60
Jan-0
6
Jan-0
7
Jan-0
8
Jan-0
9
Jan-1
0
Jan-1
1
Jan-1
2
Jan-1
3
Jan-1
4
Jan-1
5
Jan-1
6
US-$
/ 100
kg EC
M 4%
fat /
3.3%
prot
ein
Farm gate milk price in India
IFCN World Milk Price Indicator
1
2
31
22
-0.1
0.1
0.3
0.5
0.7
0.9
2006
2007
2008
2009
2010
2011
2012
2013
2014
2015
Million
ton
milkequ
ivalents
Export
Import
Nettrade1
2
3
1
22
Milk prices Dairy Trade in milk equivalants
06/05/2016 © IFCN 2016
IFCN Baseline outlook for India -2025
Source: D3.2 - Dairy Sector Analysis with Base Line Projection 2025

5/6/16
6
06/05/2016 © IFCN 2016Source: D3.2 - Dairy Sector Analysis with Base Line Projection 2025
ME: Milk equivalentBubbles magnified by ratio 2:1 to increase visibility
-3.2
2.74.0
3.9
29.8
-14.0
-4.3
-2.7
EU-2826.3
World milk balance 2025Milk surplus and deficit in mill t ME
06/05/2016 © IFCN 2016
Sum up
1. The third world dairy crisis is the longest one in the last 15 years due to EU post quota reaction. Nevertheless we have indicators to monitor it in real time.
2. Long term average world milk price will continue as in the last years – Ø 40 USD/100 kg ECM
3. India to become a net importer in future.

5/6/16
7
06/05/2016 © IFCN 2016
Thank you for your attention
Dairy Research Center
in Kiel
Network of researchers
Conference 2015 hosted by GEA
Network of companies
Conference 2015 hosted by Cargill and Elanco
This presentation is the result of a large number of people working together since 2000.
06/05/2016 © IFCN 2016
Additional slides once needed

5/6/16
8
06/05/2016 © IFCN 2016
0
10
20
30
40
50
60
70
1996
1999
2002
2005
M 0
6J
06S
06
D 0
6M
07
J 07
S 0
7D
07
M 0
8J
08S
08
D 0
8M
09
J 09
S 0
9D
09
M 1
0J
10S
10
D 1
0M
11
J 11
S 1
1D
11
M 1
2J
12S
12
D 1
2M
13
J 13
S 1
3D
13
M 1
4J
14S
14
D 1
4M
15
J 15
S 1
5D
15
in U
SD /
100 k
g EC
M
Range of IFCN milk price indicators (SMP&butter, cheese&whey, WMP)
Combined IFCN world milk price indicator
World milk price monthly since 2006
Monthlydata2006- 2016
+40%
-50%
+40%
-50%
Combined IFCN world milk price indicator: weighted average of 3 IFCN world milk price indicators: 1. SMP & butter (35%), 2. Cheese & whey (45%), 3. WMP (20%)
$/CWT
26.0
21.6
17.3
13.0
8.7
4.3
0.0
06/05/2016 © IFCN 2016
Oil, feed & milk prices 1981-2016
$/CWT
21.6
17.3
13.0
8.7
4.3
0.0

5/6/16
9
06/05/2016 © IFCN 2016Source: D3.4 - IFCN Monthly real time data
Dairy farm economics – milk/feed prices drive milk production growth 2006-2016Worldmilk/feed pricesinUS$/100kg
Farmeconomic indicatorinUS$/100kgmilk
Prices in USD/100 kg (ECM) Margin over compound feed costs in USD/100kg Change in milk production on monthly basis
farm economics: Production: Leap year adjustment. February adjusted to 28 days
How to use this sheet:For selecting countries for the charts, please type in the numbers (country codes) into the yellow boxes below.
0
5
10
15
20
25
30
35
40
45
50
Jan
07
Jan
08
Jan
09
Jan
10
Jan
11
Jan
12
Jan
13
Jan
14
Jan
15
Jan
16
Margin over compound feed costs (0.3 kg/kg milk)
Bound - average 2007-2015
0
10
20
30
40
50
60
Jan
07
Jan
08
Jan
09
Jan
10
Jan
11
Jan
12
Jan
13
Jan
14
Jan
15
Jan
16
IFCN combined world milk price indicatorIFCN world feed price indicator
-2%
-1%
0%
1%
2%
3%
4%
5%
Jan
07
Jan
08
Jan
09
Jan
10
Jan
11
Jan
12
Jan
13
Jan
14
Jan
15
Jan
16
% change to previous yearAverage annual % change
Globalgrowth milkproduction%year to year
06/05/2016 © IFCN 2016
Change in global milk supply (including estimates for the last 3 months)
Source: Data product - Monthly real time data of milk production, milk & feed prices, status 5/2014
Ex planation: Relativ e c hange of the 12-months ro l ling s um of mi lk production express es the rela tiv e deviation of mi lk produc tion in a 12 month period compared to the s ame period one year before. Countries inc luded represent 92% of world mi lk production. Data is adjusted for leap year effect.
Key facts of this data base
1. 60 countries (>90% worlds milk)
2. ECM corrected (4% fat, 3,3% protein)
3. Leap year adjusted
4. Real time estimates (1-3 month)
5. Updates (mid of each month)
IFCN Dairy Data – Milk supply