global peer pressure - energy information administration · 17 • all manufacturers of record...
TRANSCRIPT

© 2017 IHS Markit. All Rights Reserved.
Global Peer PressureHow California, China & Europe Will Continue To Push The U.S. Towards Vehicle CO2 Reduction
Devin Lindsay, Principal AnalystNorth American Powertrain and Compliance [email protected]+1 248 465 2811
2017 EIA Conference
Washington D.C. | June 27, 2017

© 2017 IHS Markit. All Rights Reserved. 2
Presentation Outline
• New Seven-Stars of Alignment Paradigm
• Global Regulations and Impact on Powertrain Options
1. Right Amount of Electrification For the Right Region
2. Regional 2025 Outlook
3. ZEV Mandate
• VPaC Sales xEV Outlooks
• Autonomous Vehicles and New Definition of Mobility
• Summary
© 2017 IHS Markit
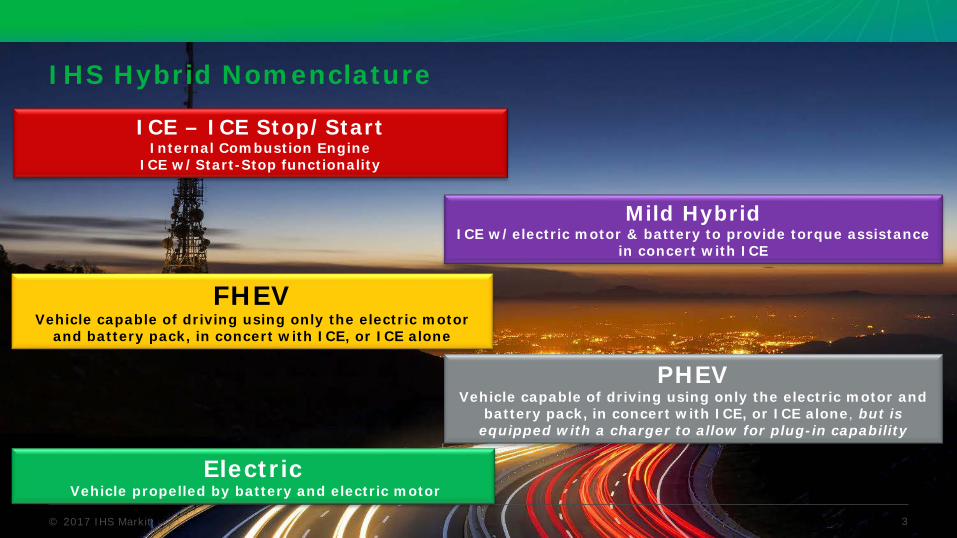
IHS Hybrid Nomenclature
3
ICE – ICE Stop/StartInternal Combustion Engine
ICE w/Start-Stop functionality
FHEVVehicle capable of driving using only the electric motor
and battery pack, in concert with ICE, or ICE alone
PHEVVehicle capable of driving using only the electric motor and
battery pack, in concert with ICE, or ICE alone, but is equipped with a charger to allow for plug-in capability
ElectricVehicle propelled by battery and electric motor
Mild HybridICE w/electric motor & battery to provide torque assistance
in concert with ICE

© 2017 IHS Markit
The Seven Stars of EV Expansion• No single factor will determine the fate of EVs
• The interrelated factors compound one another
• The automotive industry carries great inertia, overcoming it is a constant challenge
• Each global region balances these factors differently
For example:
Fuel prices / USA
Regulation & Incentives / China and Europe
Infrastructure / Japan
4
EV Sales Expansion
Consumer Price
Driving Range
Infra-structure
and Charging
Time
R&D Life CycleFuel Price
Regulation and
Incentives
Battery Cell
Supply Chain

© 2017 IHS Markit 5
US China EU Japan
CAFE/GHG CA. ZEV CAFC NEV CO2 Emission Incentive
FHEV ✔ ✔ ✔ ✔ ✔
PHEV ✔✔ ✔ ✔✔ ✔ ✔✔ ✔✔ ✔✔
EV ✔✔ ✔✔ ✔✔ ✔✔ ✔✔ ✔✔ ✔✔
FCV ✔✔ ✔✔ ✔✔ ✔✔ ✔✔ ✔✔ ✔✔
高い低い。ただし増加傾向低い。また停滞傾向低い。今後需要を押し上げる為のハードルも高いほぼない
消費者需要 規制対応への効果✔: 効果あり✔✔: 効果高い
Technology needed to meet the regulations and current demand for such technologies

© 2017 IHS Markit
Global propulsion design islands in 2025
ElectricMHEV FHEVICEStop-start PHEVVPaC – March 2017

© 2017 IHS Markit 7
4.57
9.512
14.517
19.522
Total ZEV Credit Percentage
Requirement 2018+
Source: CARB Advanced Clean Cars
Is California’s Zero Emission Vehicles Mandate the Missing CO2 Piece?

© 2017 IHS Markit 8
50 to 70 miles of range per 20
minutes of
charging
Level 3 Charging
10 to 20 miles of range
per one hour of
charging
Level 2 Charging
2 to 5 miles of range
per one hour of
charging
Level 1 Charging
Compare to 3-5
minutesGasoline Hydrogen
Are We There Yet?
Source: Alternative Fuels Data Center
© 2017 IHS Markit
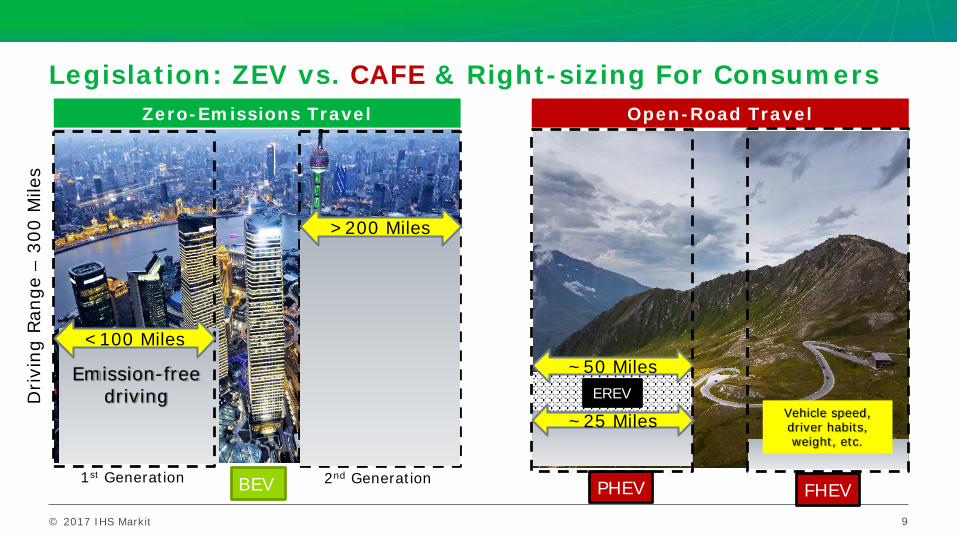
Legislation: ZEV vs. CAFE & Right-sizing For Consumers
9
Drivi
ng R
ange
–30
0 M
iles
Emissions freedriving
Emissions freedriving
Zero-Emissions Travel
1st Generation 2nd GenerationBEV
Emission-freedriving
<100 Miles
>200 Miles
Open-Road Travel
PHEV FHEV
Vehicle speed, driver habits, weight, etc.
EREV
~50 Miles
~25 Miles
© 2017 IHS Markit. All Rights Reserved. 10
Presentation Outline
• New Seven-Stars of Alignment Paradigm
• Global Regulations and Impact on Powertrain Options
1. Right Amount of Electrification For the Right Region
2. Regional 2025 Outlook
3. ZEV Mandate
• VPaC Sales xEV Outlooks
• Autonomous Vehicles and New Definition of Mobility
• Summary

© 2017 IHS Markit
Cumulative Expected EV VolumesGlobal volumes from 2018–25 EV production
11Source: IHS May 2017 powertrain forecast
0.0 M
0.5 M
1.0 M
1.5 M
2.0 M
2.5 M
3.0 M
3.5 M
4.0 M
GM Ford FCA Toyota Honda Nissan Hyundai BMW Daimler VW Tesla Lucid FaradayFuture
1.2M
4.5M
5.5M 4.5M
© 2017 IHS Markit 12
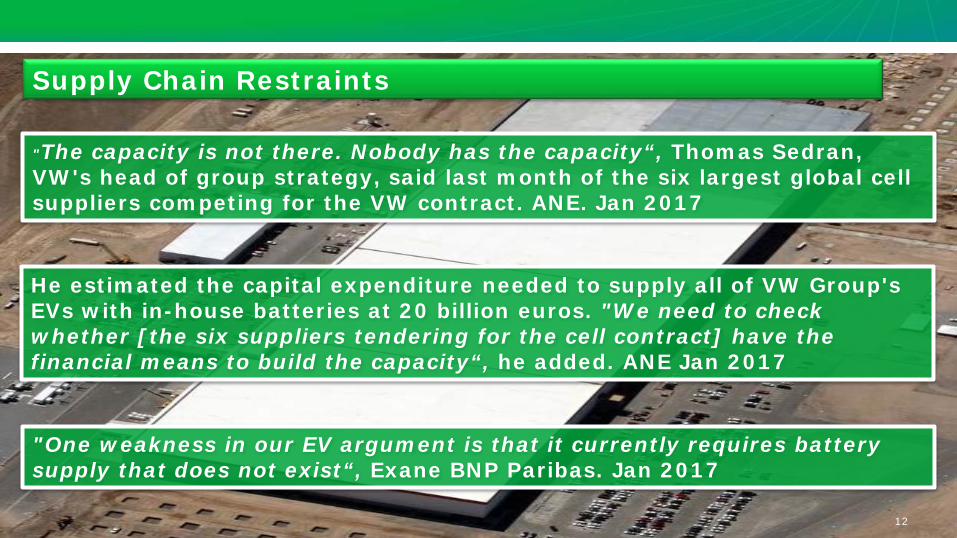
"The capacity is not there. Nobody has the capacity“, Thomas Sedran, VW's head of group strategy, said last month of the six largest global cell suppliers competing for the VW contract. ANE. Jan 2017
He estimated the capital expenditure needed to supply all of VW Group's EVs with in-house batteries at 20 billion euros. "We need to check whether [the six suppliers tendering for the cell contract] have the financial means to build the capacity“, he added. ANE Jan 2017
"One weakness in our EV argument is that it currently requires battery supply that does not exist“, Exane BNP Paribas. Jan 2017
Supply Chain Restraints
© 2017 IHS Markit
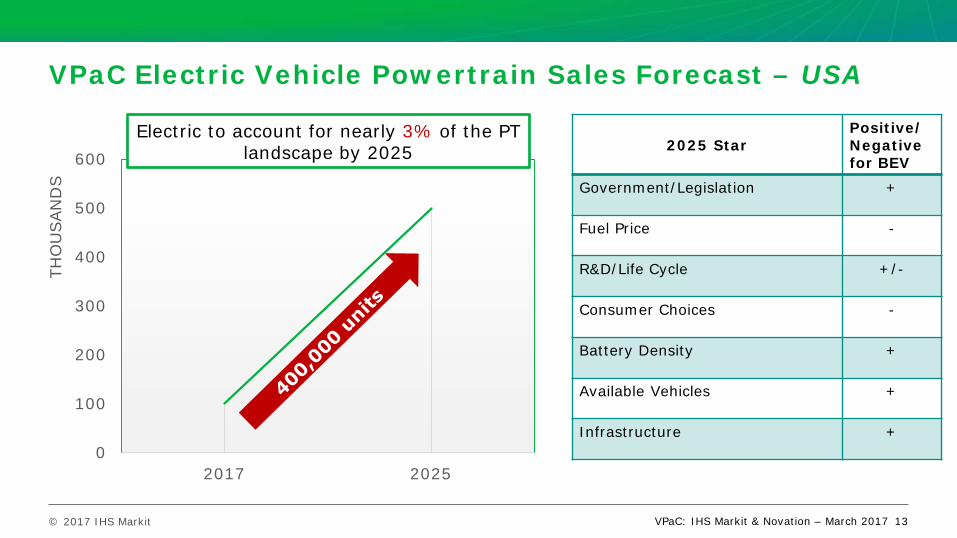
VPaC Electric Vehicle Powertrain Sales Forecast – USA
13
0
100
200
300
400
500
600
2017 2025
THO
USAN
DS
ElectricElectric to account for nearly 3% of the PT
landscape by 2025 2025 StarPositive/Negative for BEV
Government/Legislation +
Fuel Price -
R&D/Life Cycle +/-
Consumer Choices -
Battery Density +
Available Vehicles +
Infrastructure +
VPaC: IHS Markit & Novation – March 2017

© 2017 IHS Markit
VPaC Electric Vehicle Powertrain Sales Forecast – EU28
14
0
100
200
300
400
500
600
700
800
2017 2025
THO
USAN
DS
Electric
Electric to account for nearly 5% of the PT landscape by 2025 2025 Star
Positive/Negative for BEV
Government/Legislation +
Fuel Price +/-
R&D/Life Cycle +/-
Consumer Choices +/-
Battery Density +
Vehicles +
Infrastructure +/-
VPaC: IHS Markit & Novation – March 2017

© 2017 IHS Markit
VPaC Electric Vehicle Powertrain Sales Forecast – China
15
0
0.2
0.4
0.6
0.8
1
1.2
1.4
1.6
1.8
2017 2025
MIL
LIO
NS
ElectricElectric to account for nearly 5% of the PT
landscape by 2025 2025 StarPositive/Negative for BEV
Government/Legislation +
Fuel Price +
R&D/Life Cycle +
Consumer Choices +/-
Battery Density +
Available Vehicles +
Infrastructure +/-
VPaC: IHS Markit & Novation – March 2017

© 2017 IHS Markit
Compliance LandscapeRegulatory VPAC Compliance Passenger Car: 2025 - CAFE & GHG credits
excluded
- The baseline does not envisage a softening or delay to the targets as part of the new final determination. More flexibilities and credits expected to be given to automakers
- All Manufacturers of Record could fall short without considerable credits and/or more electrification on high volume models.
16VPaC: IHS Markit & Novation – March 2017
© 2017 IHS Markit
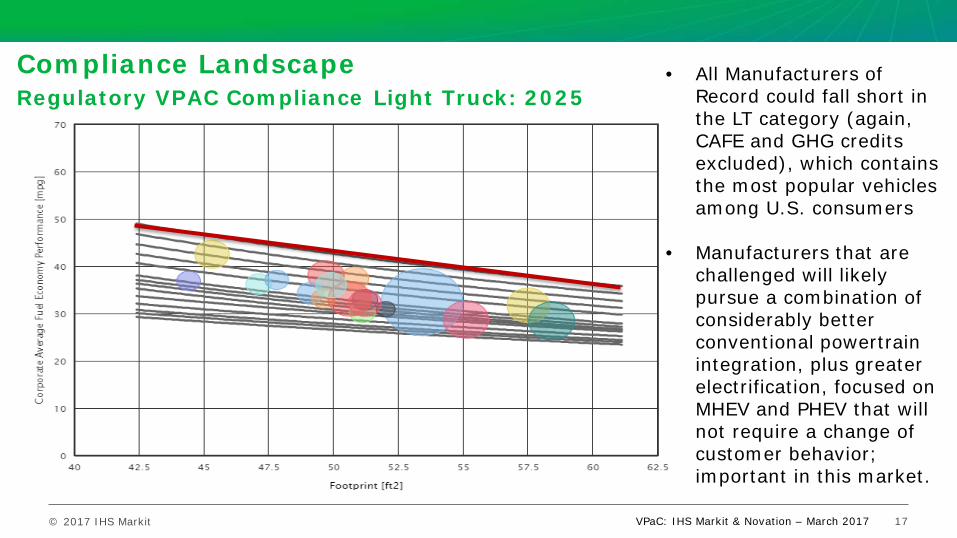
Compliance LandscapeRegulatory VPAC Compliance Light Truck: 2025
17
• All Manufacturers of Record could fall short in the LT category (again, CAFE and GHG credits excluded), which contains the most popular vehicles among U.S. consumers
• Manufacturers that are challenged will likely pursue a combination of considerably better conventional powertrain integration, plus greater electrification, focused on MHEV and PHEV that will not require a change of customer behavior; important in this market.
VPaC: IHS Markit & Novation – March 2017
© 2017 IHS Markit. All Rights Reserved. 18
Presentation Outline
• New Seven-Stars of Alignment Paradigm
• Global Regulations and Impact on Powertrain Options
1. Right Amount of Electrification For the Right Region
2. Regional 2025 Outlook
3. ZEV Mandate
• VPaC Sales xEV Outlooks
• Autonomous Vehicles and New Definition of Mobility
• Summary
© 2017 IHS Markit
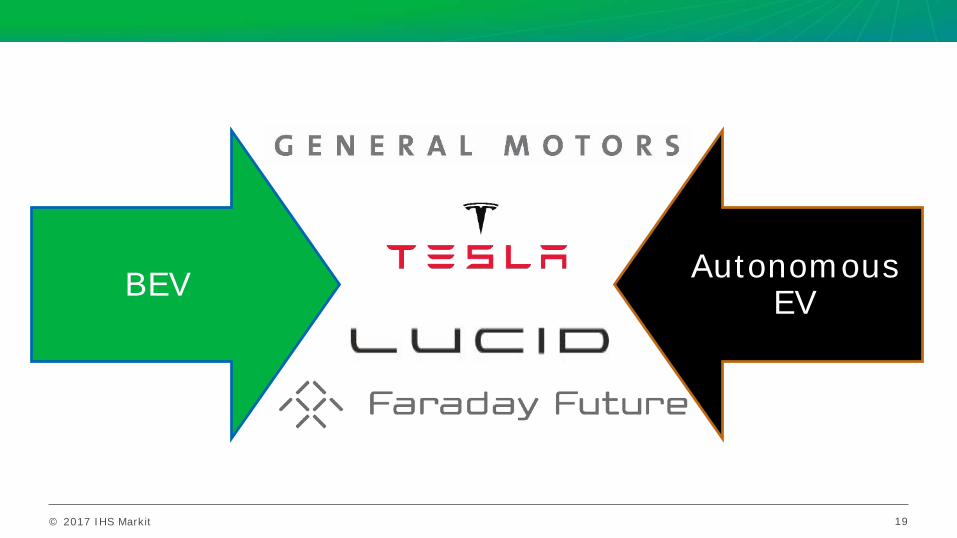
BEV Autonomous EV
19

© 2017 IHS Markit
Language defined – Real-world examples of SAE LevelsAutonomous = Level 4 and Level 5
20
June 2017
Based on Society of Automotive Engineers levels of automation (SAE J3016)
No AutomationL0
Driver AssistanceL1
High AutomationFull autonomy | Self-driving carL4
Partial AutomationL2
Conditional AutomationL3
Full AutomationFull autonomy | Driverless carL5
Collision warningLane departure warningBlind spot information
Adaptive cruise controlLane keep assistAutonomous parking
AutopilotTraffic jam assist
Advanced autopilotsDrivers intermittently re-engage
Fully autonomous autopilotsDrivers disengage in more situations
Fully autonomous driverless fleetsMobility service business model
2010 2015 2020 2025 2030
Long-term, fully electric (including
fuel cell) powertrains will be the desired
propulsion source by Governments and Consumers

© 2017 IHS Markit
Autonomous vehicle sales growth accelerates post-2025Maturity of technology, manufacturing, regulation and business models converge
21
Global Autonomous Vehicle Sales Forecast
© 2017 IHS MarkitSource: IHS Markit
0
5
10
15
20
25
2020 2025 2030 2035
Mill
ions
June 2016

© 2017 IHS Markit
Autonomous capability will blur the lines between today’s mobility business models and use cases
22
June 2017
TaxiTaxi
Owner/ Driver
Owner/ Driver
Autonomous on-demand
mobility service
Owner/ Driver
Past Present Future
For-Hire
RentalRental
For-HireRide-hailing
Car sharing
© 2017 IHS Markit
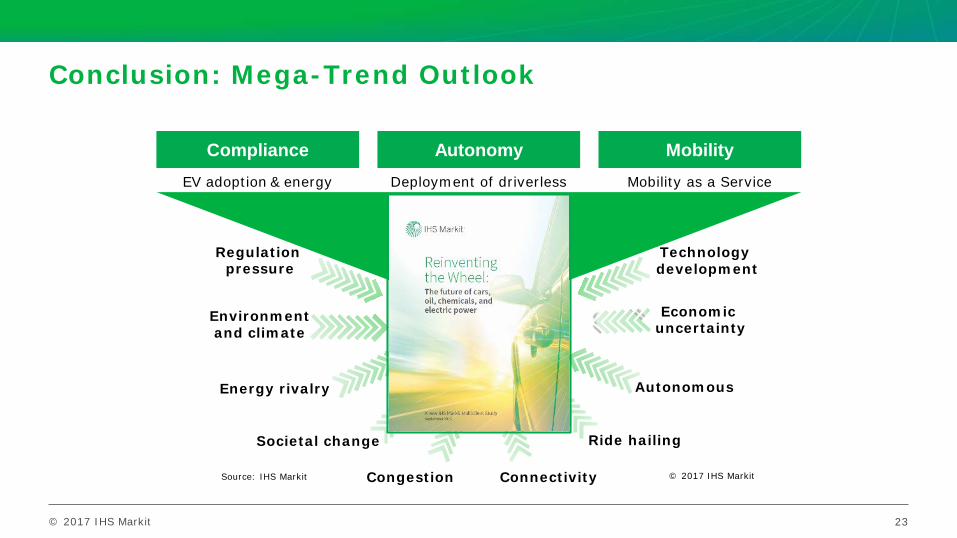
Conclusion: Mega-Trend Outlook
23
Compliance Autonomy MobilityEV adoption & energy
demandDeployment of driverless
carsMobility as a Service
© 2017 IHS Markit
Regulation pressure
Energy rivalry
Technology development
Connectivity
Societal change
Economic uncertainty
Environment and climate
Source: IHS Markit
Ride hailing
Autonomous
Congestion

© 2017 IHS Markit
Summary The Peers
• China and Europe continue vehicle CO2reduction initiatives
• Increased market penetration for PHEV and BEVs
• Global expansion of Ride sharing and Ride hailing
• Levels of Autonomy for vehicles favor all-electric powertrains
The Pressure
• U.S. Consumer’s desire for CUVs and Pick-up trucks
• Battery supply chain and charge times
• CAFE and ZEV standards
EV Sales Expansion
Consumer Price
Driving Range
Infra-structure
and Charging
Time
R&D Life CycleFuel Price
Regulation and
Incentives
Battery Cell
Supply Chain

© 2017 IHS Markit. All Rights Reserved.
Thank You!
Devin Lindsay, Principal Analyst
North American Powertrain and Compliance Forecasting
+1 248 465 2811