global overview of middle distillate supply and demand · global overview of middle distillate...
TRANSCRIPT

© OECD/IEA 2014 © OECD/IEA 2014
Global Overview of Middle Distillate
Supply and Demand
19 January 2015
Matt Parry

© OECD/IEA 2014
The total medium-term supply outlook carries a premium to demand
- 1
0
1
2
3
4
5
6
7
2004 2005 2006 2007 2008 2009 2010 2011 2012 2013 2014 2015 2016 2017 2018 2019
mb/d
Implied spare capacity
Effective OPEC spare
capacity
World demand growth
World supply capacity
growth
Medium-term oil market balance

© OECD/IEA 2014
Oil demand nears 100 mb/d by 2019, but peak oil demand growth is in sight
Average 1.3%/yr growth on tentative macroeconomic gains
Overall progress slows on fuel switching and efficiency gains
Global oil demand 2001-07 Average Global Oil Demand Growth 2004-2009/2009-2014/2014-2019 2007-13 thousand barrels per day
2013-19
2001-07 1 102 1.3%
2007-13 727 0.8%
2013-19 1 272 1.3% Source: IEA, Medium-Term Oil Market Report 2014
This map is w ithout prejudice to the status of or sovereignty over any territory, to the delimitation of international frontiers and boundaries and to the name of any territory, city or area.
Average global demand growth
(kb/d)
28
-327
-30 39 82100
71
-91
70
127262 307
58101
170
Americas
Africa
Middle East
Europe FSU
779
700
655
Asia/Pacific

© OECD/IEA 2014
Oil’s place in the energy mix is changing
With a few exceptions, oil is being pushed out of the power generation and residential sectors
More than 5 in every 10 barrels of oil are used for transport, including 4 for road transport
Non-energy use of oil – petrochemicals – rising steeply
54.6%
54.8%
55.0%
55.2%
55.4%
55.6%
0
10
20
30
40
50
60
2010 2011 2012 2013 2014 2015 2016 2017 2018 2019
mb/
d
Shipping
Jet
Rail
Road diesel
Gasoline
Transport (rhs)
Relative share of transport use is global oil demand

© OECD/IEA 2014
Latest data shows a notable weakening in middle distillate demand
Slower gasoil demand led the global 2H13-2014 slowdown
Jet/kerosene held up better
-4%
-3%
-2%
-1%
0%
1%
2%
3%
4%
-4
-3
-2
-1
0
1
2
3
4
1Q2008 1Q2010 1Q2012 1Q2014
mb/d Global y-on-y absolute growthTotal products growth rate
LPG Naphtha GasolineJetKero Diesel RFOOther Total (RHS)
© OECD/IEA 2014
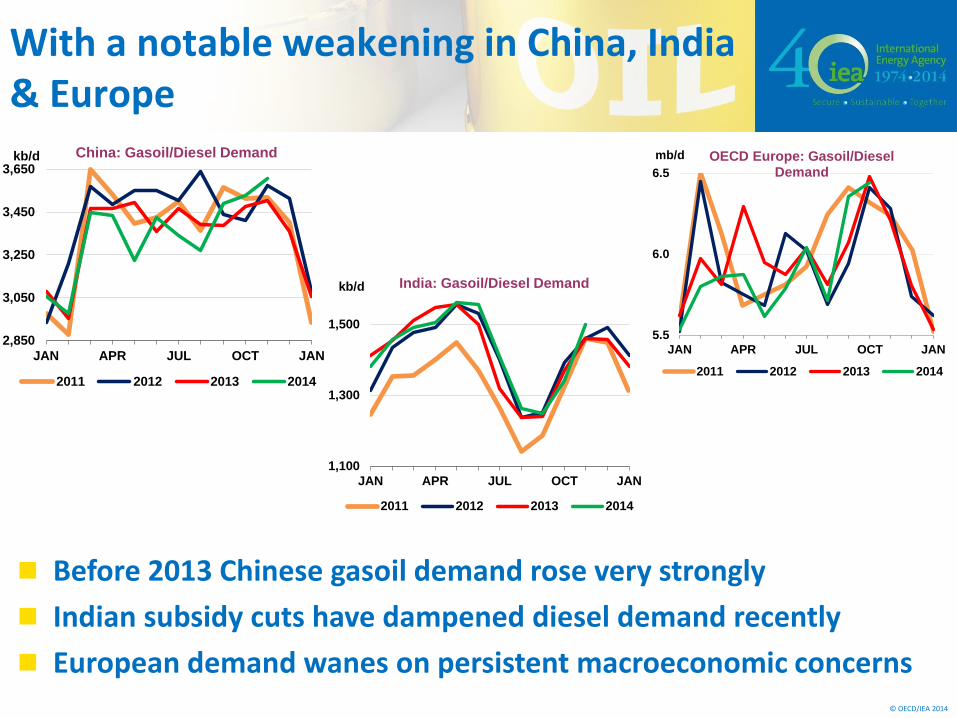
With a notable weakening in China, India & Europe
Before 2013 Chinese gasoil demand rose very strongly
Indian subsidy cuts have dampened diesel demand recently
European demand wanes on persistent macroeconomic concerns
5.5
6.0
6.5
JAN APR JUL OCT JAN
mb/d OECD Europe: Gasoil/Diesel Demand
2011 2012 2013 2014
2,850
3,050
3,250
3,450
3,650
JAN APR JUL OCT JAN
kb/d China: Gasoil/Diesel Demand
2011 2012 2013 2014
1,100
1,300
1,500
JAN APR JUL OCT JAN
kb/d India: Gasoil/Diesel Demand
2011 2012 2013 2014

© OECD/IEA 2014
…changing shipping regulations provide an additional fillip to gasoil
Tightening sulphur emission standards should encourage some product shifting
0
1 000
2 000
3 000
4 000
5 000
6 000
2007 2008 2009 2010 2011 2012 2013 2014 2015
kb/d
Marine gasoil,
domestic
navigation
Fuel oil,
domestic
navigation
Marine gasoil,
international
marine bunkers
Fuel oil,
interntaional
marine bunkers

© OECD/IEA 2014
Oil supply growth is bifurcated - robust in non-OPEC, facing headwinds in OPEC
2014 Medium-Term Outlook envisaged total oil supply capacity growth of 9 mb/d, to 105 mb/d by 2019
Strong non-OPEC growth, slowing later in the forecast period
-0.5
0.0
0.5
1.0
1.5
2.0
2013 2014 2015 2016 2017 2018 2019
mb/d
OPEC Crude capacity OPEC NGLsGlobal Biofuels Non-OPEC (excl. Biofuels)World
Global oil supply capacity growth

© OECD/IEA 2014
MENA turmoil, weak investment climate weigh on OPEC capacity growth
OPEC capacity seen growing by 2.1 mb/d to 37.1 mb/d in 2019
Iraq to supply 60% of growth
Worsening political stability and security issues add major downside risk in Iraq, Libya, others
Incremental OPEC crude production capacity 2013-19 (mb/d)
OPEC crude production capacity
32
33
34
35
36
37
38
2013 2014 2015 2016 2017 2018 2019
mb/d
Current data May 2013 -0.6 -0.4 -0.2 0.0 0.2 0.4 0.6 0.8 1.0 1.2 1.4
1
Iraq
UAE
Angola
Venezuela
Ecuador
Saudi Arabia
Iran
Qatar
Libya
Nigeria
Algeria
Kuwait

© OECD/IEA 2014
The unconventional revolution comes of age
N. America continues to lead non-OECD supply growth
But growth slows in N. America and diversifies later in the period
Annual non-OPEC supply growth
-1.5
-1.0
-0.5
0.0
0.5
1.0
1.5
2.0
2003 2005 2007 2009 2011 2013 2015 2017
mb/d
PG and
biofuelsOther Asia
China
Middle
EastAfrica
Latin
AmericaFSU
OECD
Pacif icOECD
EuropeOECD
AmericasTotal

© OECD/IEA 2014
NGLs, field condensate account for growing share of global supply
NGL capacity grows jumps 18% to 10.7 mb/d in 2019
OPEC NGLs rise by 13% to 7 mb/d, fuelled by quest for natural gas for utilities, water desalination and industry
Iran accounts for ~40% of OPEC NGL growth, followed by Libya, Saudi Arabia, UAE and Qatar
0
2
4
6
8
10
12
2013 2014 2015 2016 2017 2018 2019
mb/d
Pentanes
LPG
Ethane
World NGLs production
5.25
5.50
5.75
6.00
6.25
6.50
6.75
7.00
7.25
2013 2014 2015 2016 2017 2018 2019
mb/d
Current data May 2013
OPEC NGLs production

© OECD/IEA 2014
In crude trade, all roads lead to Asia
Asia imports surge 16% to more than 22 mb – 65% of the inter’l crude market – as North America swings over to net oil exporter
Crude Exports in 2019 and Growth in 2013-19 for Key Trade Routes1
(million barrels per day)
0.2 0.3
(0) 2.0 (0.2)
(-0.6) 4.1(-0.6)
0.1(-0.7)
3.1
1.2 (0.3)
1.0 (+0.1)
-0.6
2.2
1.8 (+0.8)
(-0.6)
1.1(+0.3)
Red number in brackets denotes growth in period 2013-19 1.21Excludes Intra-Regional Trade (+0.6)2 Includes Chile3 Includes Israel
5.2
(+0.3)
Other Asia
China
OECD Europe
1.6(-0.2)
1.3 (+0.6)
OECD Asia
Oceania3
0.5 (-0.0)
0.7(+0.4)
3.6 (-0.5)
OECDAmericas2

© OECD/IEA 2014
Refinery capacity growth sets stage for new round of consolidation
Almost all growth come from non-OECD, including half from Asia
Plans are getting scaled back in the face of rising over-capacity
CDU Expansions 2013-2019 by Region Refinery utilization rates
70.0%
75.0%
80.0%
85.0%
90.0%
1Q06 1Q09 1Q12 1Q15 1Q18
World OECD Non-OECD

© OECD/IEA 2014
Total Chinese product output to balance demand as projects scaled back
Apparent slowdown in gasoil demand growth sees surpluses emerging. Indeed, China turned net gasoil exporter in 2013
Chinese gasoil refinery output vs. demand Chinese refinery output vs. demand
6.0
7.0
8.0
9.0
10.0
11.0
12.0
13.0
1Q06 1Q09 1Q12 1Q15 1Q18
mb/d
Reported output Modelled output Demand
1.5
2.0
2.5
3.0
3.5
4.0
4.5
5.0
1Q06 1Q09 1Q12 1Q15 1Q18
mb/d
Reported output Modelled output Demand

© OECD/IEA 2014
Atlantic Basin product trade to increase
European middle distillate deficit likely balloons
US refinery industry renaissance increases export potential
OECD America’s key product balances Europe’s key product balances
-2 000
-1 500
-1 000
- 500
0
500
1 000
1 500
2008 2010 2012 2014 2016 2018
kb/d
Naphtha/gasoline Jet/gasoil
Imports
Exports
-1 000
- 500
0
500
1 000
1 500
2008 2010 2012 2014 2016 2018kb
/d
Naphtha/gasoline Jet/gasoil
Imports
© OECD/IEA 2014
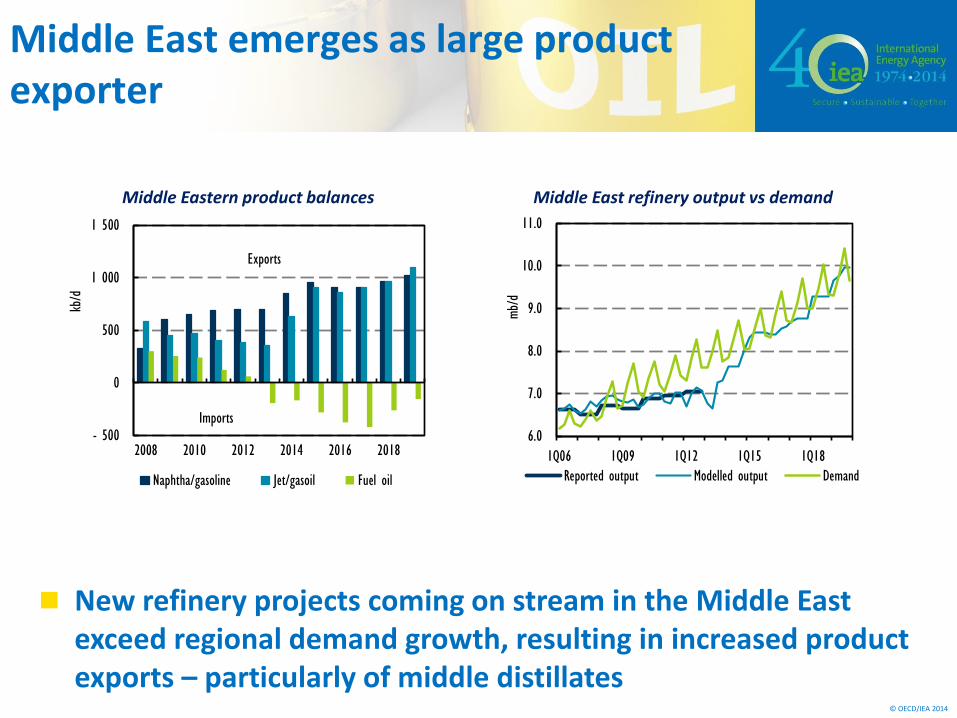
Middle East emerges as large product exporter
New refinery projects coming on stream in the Middle East exceed regional demand growth, resulting in increased product exports – particularly of middle distillates
Middle East refinery output vs demand Middle Eastern product balances
- 500
0
500
1 000
1 500
2008 2010 2012 2014 2016 2018
kb/d
Naphtha/gasoline Jet/gasoil Fuel oil
Imports
Exports
6.0
7.0
8.0
9.0
10.0
11.0
1Q06 1Q09 1Q12 1Q15 1Q18
mb/d
Reported output Modelled output Demand

© OECD/IEA 2014
Europe faces growing import dependence for middle distillates…
Europe’s middle distillate deficit balloons to 1.6 mb/d by 2019
Increased supplies coming from Middle East, N. America, Russia
Product Supply Balances - Gasoil/Kerosene
Regional Balances in 2013 and 20191
Thousand barrels per day
897 1167
FSU
-1057 -1592
Europe
9841377
OECD Americas
-559 -548
Latin America
3581094
Middle East
1280801
Asia
-657-998
Africa
Refinery production and supplies from other sources vs. end-user demand. Regional total does not add to zero due to feedstock trade and differences in product classifications.
1. Positive number indicates net-export potential, negative number net-import requirement
