global outsourcing and fdi can the least developed...
TRANSCRIPT

1
Working Paper No. 229
Global Outsourcing and FDI Can the Least Developed Countries participate in the Process?
by
David Bigman
Stanford University John A. and Cynthia Fry Gunn Building
366 Galvez Street | Stanford, CA | 94305-6015

2
reduction in transport costs, the wide range of international agreements to facilitate trade and, in particular, by the spread of global and highly effective information and communication technologies. These changes contributed, in turn, to wider changes in the structure of international trade. The paper examines the forces that drove these changes and their impact on the less developed countries.
ABSTRACT Today’s corporations have a much wider set of options how and where to organize their production and sales, including options to outsource the supply of certain parts to external producers – either in their home country or offshore. These changes in the structure, scale and geographical distribution of the production and supply chain of the multinational corporations, were set off by the rapid technological progress, the sharp

3
Global Outsourcing and FDI
Can the Least Developed Countries participate in the Process?
I. Introduction
Economic theory suggests that the abundance of capital in the developed countries and
the low wages in the developing countries should have triggered large flows of capital
from the developed to the developing countries where its marginal product should be
much higher. In a widely quoted and influential paper, Lucas (1990) asked why in
practice the flows of capital from the developed to the developing countries are so scanty
even though the wage gap remains large.
Today, nearly fifteen years later, the paradox seems even more glaring: On the one hand,
the wage gap between the developed and the developing countries actually widened
during the 1990s and continues to grow even today (Figure 1). In 2003, labor costs in the
major auto-producing manufacturers were $33.0 per hour in Germany, $22.5 in the US,
but only $2.7 in Mexico and around 90 cents or less in China. On the other hand, despite
the huge increase in the worldwide flows of capital during the 1990s, and although the
wage differential widened, the gap in the rate of return to capital did not fall by much,
and both financial and direct investments in the developing countries are still only a small
fraction of the total flow of capital worldwide. Most capital flows to and between the
developed countries, the flows of capital to the developing countries are still only a
fraction of the total, and most of these investments concentrate in only a handful of
developing countries (Figure 2). Given the restrictions on labor migration to the
developed countries and the pressures of market competition, the flow of capital to the

4
developing countries should have been much larger. Rodrik (1997) emphasized also that
the asymmetries between the high international mobility of capital and the constraints on
labor mobility further skew the income distribution, placing the less mobile factors and
the developing countries that have abundance of low-skilled labor, at a disadvantage.
INSERT FIGURES 1 AND 2 AROUND HERE
Lucas explained the paradox by the large differences in the skills and human capital
content of labor between developed and developing countries. Firms in the developed
countries would continue to employ more capital per labor even when the rate of return to
capital would be equalized as an effect of these flows of capital, and wages in the
developed countries would remain higher than in the developing countries. With this
explanation, however, the paradox seems even more puzzling today, since the skill
differential between workers in the developed and the developing countries narrowed
during the past decade, particularly in manufacturing, with the spread of education in
many developing countries, and the significant increase in the skills and expertise of local
workers who work and are trained in enterprises owned by trans-national corporations
(TNCs) or in the developed countries. As a result, the share of the developing countries
in world exports in medium- and high-technology manufactured products more than
doubled during the 1990s.
In recent years, a number of papers examined different directions of explaining the
seeming paradox that Lucas pointed out. Most of the explanations that have been put
forward are rooted in the commercial considerations of the firms as they weigh the
options how and where to organize their production so that they can best meet the

5
demand for their products and maximize their profits.1 These and other papers
highlighted, in particular, the fact that much of the increase in world trade in recent years
was in intermediate inputs. Feenstra and Hanson (1996) showed on the basis of U.S.
input-output tables that the share of imported intermediate inputs increased from 5.3% of
total purchases of intermediate inputs in 1972 to 11.6% in 1990. Yeats (2001) showed
that international trade in intermediate inputs increased at a much faster rate than the
trade in final goods.
Today’s structure of global trading offers firms a much wider set of options:
• Produce the final product and all its components and intermediate inputs in the firm’s
own plant.
• Outsource the supply of certain components and intermediate inputs by sub-
contracting producers either in the firm’s home country or offshore and assemble the
final product in the firm’s own plant.
• Gain control over the production of certain parts through merger, acquisition or direct
investments in the firms’ home country or offshore, but assemble the final product in-
house.
• Transfer the entire production offshore.
The objective of the paper is to develop a model that provides a direct extension of the
Lucas’ model, but, at the same time, can describe the commercial considerations of firms
as they weigh these options and their criteria as they make their decisions. These criteria
suggest an explanation why most firms still concentrate most of their investments and the
1 See, for example, Grossman and Helpman, 2003; Helpman, Melitz and Yeaple 2003; Antràs and Helpman 2003; Razin, Rubinstein, and Sadka, 2003. Some of these papers will be discussed in more detail later on.
6
bulk of their outsourcing and other business activities in the developed countries (though
not necessarily in their home country) and in only a small number of developing
countries. On the basis of the operational criteria and guiding principles of private
enterprises derived from this model, the paper then evaluates the driving forces of
outsourcing in the coming years and the factors that will determine the countries’
comparative advantage in global trading and their capacity to attract a larger share of the
global FDI.
II. Incentives and constraints to FDI in the developing countries
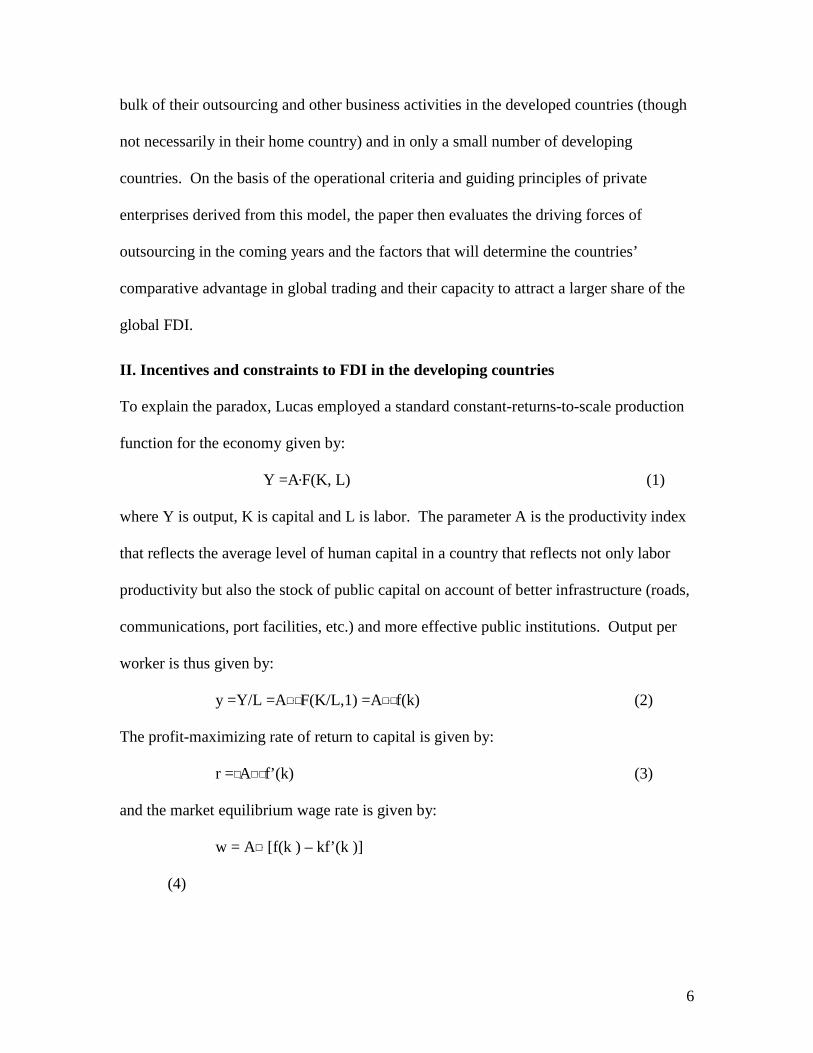
To explain the paradox, Lucas employed a standard constant-returns-to-scale production
function for the economy given by:
Y =A•F(K, L) (1)
where Y is output, K is capital and L is labor. The parameter A is the productivity index
that reflects the average level of human capital in a country that reflects not only labor
productivity but also the stock of public capital on account of better infrastructure (roads,
communications, port facilities, etc.) and more effective public institutions. Output per
worker is thus given by:
y =Y/L =A·F(K/L,1) =A·f(k) (2)
The profit-maximizing rate of return to capital is given by:
r =A·f’(k) (3)
and the market equilibrium wage rate is given by:
w = A· [f(k ) – kf’(k )]
(4)

7
Lucas assumed the production function to be the same in the two (groups of) countries in
order to focus on the differences in the human capital content. The only difference
between countries is thus the level of the productivity index. The relative abundance of
capital in the developed country implies that, in the absence of capital flows to the
developing countries, the rate of return to capital in the developed country is likely to be
lower: r* < r, where asterisks indicate variables in a developed country. Higher labor
productivity in the developed country, indicated by: A * > A, leads to a larger human-
capital externality for producers in these countries, and higher gains from producing in
their home country. As a consequence, even when capital can move freely between
countries and the rate of return to capital is equalized, firms in the developed countries
may still prefer to employ more capital per worker in their in-house production, and their
wages still remain higher than the wages in the developing countries.2 This wage
differential attracts migrants from the developing countries to the developed countries
and creates pressure to reduce wages, but political counter-pressures in the developed
countries to prevent a fall in local wages and a host of other considerations force the local
authorities to take measures to stop or slow down the inflow of workers even when it
may, in fact, have some beneficial effects on their economies, primarily by mitigating the
inflationary pressures.
In the early 1990s, when Lucas raised the question about the meager flow of capital from
rich to poor countries despite the opportunities that corporations seem to have to reduce
their labor costs, this may have not been such a paradox. At that time, prior to the
2 The high labor-capital ratio may also be due to labor market inflexibility as an effect of organized labor restrictions on the rise in employment, particularly in large companies. In smaller companies the substitution between labor and capital is less rigid because they are less restricted by unions and by labor laws.
8
creation of the WTO and the conception of a host of multinational and regional trade
agreements, including agreements on Trade-related Intellectual Property Rights (TRIPs)
and Investment and trade-related Investment Measures (TRIMs), the flows of capital
between countries and the investments of corporations outside their home country were
on a relatively small scale. The main reason was the risks of investing in developing
countries that deterred the TNCs despite the low wages.
Even today, the nominal or real wage differential by itself does not show the higher
profits that firms in the developed countries can reap by transferring part or all of their
production to a developing country. In practice, their actual profits are likely to be
smaller due to the additional operational costs in their production offshore on account of
transport costs, higher financial expenses, and other additional costs associated with the
larger distance and additional time involved in each transaction and with transactions,
operations and investments in many developing countries due to ineffective
administration and corruption. Firms must also take account for the political costs
associated with the higher risks in producing and investing in developing countries.
Indeed, in many developing countries the attraction of low wages is far outweighed by
the high investment risks. Once all these additional costs are taken into account, the cost
differential is likely to be much smaller than the difference indicated by the wage
differential in itself.
Razin, Rubinstein and Sadka (2003) suggested another explanation for the “Lucas”
paradox. They considered cases in which the migration of firms from their home country
to another country involves high set-up costs; these “lumpy” adjustment costs may
prevent firms from making the transition unless the wage differential is high enough to
9
provide adequate compensation. These adjustment costs will, in turn, limit the
phenomenon that Bhagwati (1997) termed “kaleidoscope” or “knife-edge” comparative
advantage, whereby small changes in production costs can lead to shifting comparative
advantage between countries and to gyrations in the attractiveness of different countries
as a production base.
Razin et al. considered in their analysis a firm that weighs the decision whether to divide
a vertically integrated production process and where to invest offshore given the fixed
set-up costs involved. These fixed costs will not affect the firm’s operating costs and will
therefore leave unchanged the firm’s marginal profit maximization conditions that
determine its level of output and employment, but they will determine whether or not this
firm can remain profitable after making the transition to another country. Hence, the
guiding principle for the firm’s decision is whether the present value of the stream of net
additional profits as a result of the transfer, due to the lower wages in the host country,
can cover the fixed set-up costs.
Earlier it was noted, however, that the firms has other options than transferring its entire
operations offshore. The firm can also outsource the supply of only certain components/
parts that it had previously produced in-house by sub-contracting suppliers offshore, thus
avoiding the adjustment costs altogether, or by merger, acquisition, or direct investments
offshore for the production of only some parts in which the firm has a comparative
disadvantage, instead of transferring the firm’s entire operation, thus reducing the
“lumpy” adjustment costs. The following figures are indicative: In the production of a
typical American car, 30 percent of the car’s value originates in Korea, 17.5 percent in
Japan, another 15.5 percent in Germany, Taiwan, Singapore, the U.K., Ireland and

10
Barbados, and only 37 percent in the US (WTO 1998 report, p.36).3 Outsourcing to
developing countries the supply of components in which production is labor intensive has
become an increasingly more attractive alternative for the TNCs given the large wage
differential.
Outsourcing is by no means a new phenomenon, however, and it has been common for
many years. Corporations, including the large US car manufacturers, have always found
advantages in contracting outside suppliers that have a comparative advantage in
producing certain parts or providing certain services due to economies of scale, specific
expertise as a result of specialization in production, availability of specialized equipment,
etc. In the past, outsourcing was common primarily in manufacturing, concentrated
mostly on blue-collar jobs and certain services, and was restricted mainly to local
suppliers due the high transport costs or to suppliers in other developed countries due to
the poor communication and very high risks in offshoring to developing countries. The
high share of trade in manufactured goods between the industrial countries and the high
share of intra-industry trade, (trade in goods produced by the same industry, that in the
1970s and 1980s accounted for approximately 40 percent of world trade), was in large
part due to outsourcing. 4
The steep reduction in communication and transportation costs, the standardization of
software packages and other technological innovations in ICT made it possible to
outsource many more business functions, including certain customer services,
3 The production of a pair of jeans, to take another example, can be broken down into more than a dozen stages and allocated among more than ten producers in different countries before the final product is shipped off to consumers. 4 Another explanation was that international trade in manufactured goods occurred mainly between countries at the same stage of economic development that shared the same consumer preferences; see Mahoney, Trig, Griffin, Pustay, 1998.

11
telemarketing, and document management that affect a growing number of white collar
professions, including many services that previously seemed country-specific, e.g.
medical transcription, tax preparation, and financial services. Corporations find
particular benefits in outsourcing these segments of production (and jobs) because set-up
costs are relatively low and the wage differentials in these professions is very high.
Intense competition worldwide has forced corporations to outsource larger segments of
their production offshore or push their local suppliers to do the outsourcing for them by
subcontracting certain functions to suppliers abroad. Local producers and suppliers in the
developed countries are forced to outsource a larger share of their own production or
transfer their entire operation overseas under a growing pressure to match the prices that
producers overseas are offering. US suppliers to the car industry, for example, are
increasingly pressured by the parent companies to close a cost gap between the US and
China, leading to an increase in the imports of automobile parts to the US from China
from less than $200 million in 1997 to over a $1 billion in 2003.5
Nevertheless, in many finished products that are produced in the developed countries the
share of components that are outsourced overseas is still quite small. Although this share
is likely to grow in the coming years, many companies in the developed countries still
find it profitable to keep a large portion of their production in-house for several reasons:
First, economies to scale and externalities in a vertically integrated production that
increase their comparative advantage in maintaining key segments of production in their
5 The cost difference between the US and China in the production of many parts in the car industry, currently estimated to be in the order of over 20%, takes into account the higher efficiency of US workers on the one hand and the complicated logistics and transport costs involved in the production of these components overseas on the other hand.

12
own plant and the added costs of dividing production into individual parts and
outsourcing their supply offshore; second, certain structural rigidities in their operations
and management, including pressures of their labor union, trade agreements and political
pressures, and third, the set-up costs and risks involved in offshore investments.
These factors still leave unexplained, however, why the share of most developing
countries in the worldwide flows of capital and FDI remains small and essentially
stagnant. In fact, the changes in the structure of world production and trade during the
past decade, and the establishment of multinational institutions and agreements to
facilitate the flow of commodities and capital between countries should have contributed
to increase their share, and the decline in the labor-productivity differential between
many developing countries and the developed countries with the spread of advanced
technologies should have precipitated this process. The models of Lucas and of Razin et
al. also leave unexplained the reasons why the TNCs still exercise great caution in
making any direct investments in most developing countries or in outsourcing to
producers in these countries any part of their production despite the large and growing
wage differential and other advantages that these countries can offer. The objective of
the next section is to develop a micro-economic model of the firm that clarifies the
considerations of enterprises in the developed countries when they make their decisions
how and where to organize their production, whether to outsource the production of
certain parts or intermediate inputs to external suppliers in their home country or
offshore, or choose any other option that today’s structure of world trade and investments
offers.

13
III: The Corporations’ Criteria for outsourcing
In the Heckscher-Ohlin model, countries gain a comparative advantage and export the
goods that make more intensive use of their more abundant and relatively less expensive
factor of production. With trade, the production of labor-intensive goods is therefore
shifting to countries that have abundance of labor and relatively low wages, while the
production of capital-intensive goods is shifting to the capital-abundant countries.6 The
structure of trade may change, however, if it is technically feasible and economically
profitable to divide a vertically integrated production process into several segments. This
division will give the firm the option of either maintaining the production process fully
integrated and produce all the parts of the final product in its own plant or outsource the
supply of some parts to external producers. These parts are intermediate inputs in the
production process and they are assembled into the final product and shipped to
consumers in the final stage of that process. Today’s intense competition, the rapid
technological progress and a sharp reduction in transport and communication costs
pressure firms to divide their production process into separate segments and outsource the
supply of many parts to external suppliers whenever it is technically feasible and
economically profitable. These adjustments brought about a steep rise in the share of
intermediate inputs in international trade: Ng and Yeats (200l) found that in East Asia
imports and exports of manufactured components grew annually between 1984 and 1996
two to three times faster than imports and exports of traditional production; Yeats (2001)
6 The traditional Heckscher–Ohlin model has a number of quite restrictive assumptions: • Two factors -- capital and labor; • Two countries; • Two final(or finished) goods; • Immobile factors: • Perfect competition; • Constant returns to scale. Some of these assumptions will be discussed later on.

14
estimated that about 30 percent of global manufactured goods trade takes the form of
trade in parts and components. The firm’s competitive advantage relative to other firms
and the country’s comparative advantage relative to other countries are therefore
determined for the different parts and different stages of the production process.
The organization of production at the firm level would then require three key decisions:
First, what are the pros and cons of dividing a vertically integrated production process
into several segments and outsourcing to external suppliers the production of some parts
of the final product.7 Second, if the firm decides to divide the production process, which
parts should it continue to produce in its own plant and which parts should it outsource to
external suppliers? Third, how should the firm select the external suppliers and what
criteria should it use in making the choice between the different suppliers – in the firm’s
home country or offshore. When the firm makes these decisions, it must take into
account the following considerations:
The direct costs of producing the parts in the firm’s own plant relative to the costs of
purchasing these parts from external suppliers and transporting them to the firm’s
plant;
The indirect benefits (or costs) of producing the part in the firm’s own plant due to
returns to scale and possible externalities (positive or negative) in a vertically
integrated production process;
The firm’s market shares and its capacity to exercise monopolistic and/or
monopsonistic powers in the production, sales or purchases of certain parts and/or the
final product;
7 Throughout this discussion, the terms “intermediate inputs” “components” and “parts” will be used interchangeably since all these terms have been used in the different writings on the subject.

15
The efficiency and relative production costs of the firm’s assembly line.
The direct costs of producing the parts or the final product in the firm’s own plant relative
to the costs of purchasing them from external suppliers that were the focus of Lucas’
analysis are therefore only part of the overall considerations that the firm must take into
account when it makes its decisions.
To determine criteria for the firm’s decisions, the firm’s production process is segmented
into the production of the intermediate inputs and of the assembly line. The output level
of the final product as function of these intermediate inputs and of the assembly line is
thus given by:
Y = F(Y1,…,Yn; A(LA, KA)) (5)
where Y1,…,Yn are the n segments or intermediate inputs and A(LA,KA) is the production
function of the assembly line. The firm’s structure of production thus requires a series of
decisions for each of these segments. To simplify the analysis, the production functions
of the individual segments and of the assembly line are assumed here to be functions of
labor and capital, and labor is assumed to be a homogeneous factor of production; the
possibility of distinguishing between skilled and unskilled labor will be discussed later
on. The shares of labor and capital in production vary widely, however, between the
different segments; in addition, the firm has different proficiencies and expertise in the
production of the different intermediate inputs. The firm’s efficiency in the production of
these parts is indicated by productivity indices αj: j=1,…,n, and the firm’s production
functions for the individual intermediate inputs thus have the following form:
Yj = (1+αj) •Gj(Lj,Kj): j=1,…,n (6)
16
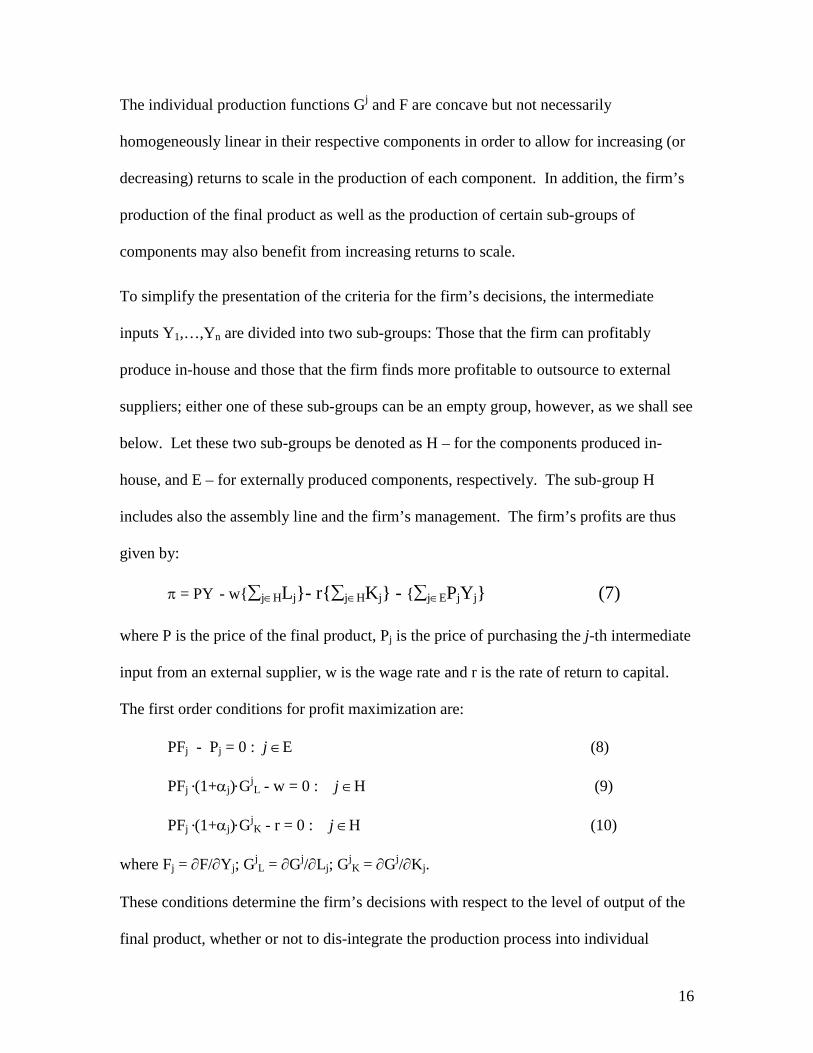
The individual production functions Gj and F are concave but not necessarily
homogeneously linear in their respective components in order to allow for increasing (or
decreasing) returns to scale in the production of each component. In addition, the firm’s
production of the final product as well as the production of certain sub-groups of
components may also benefit from increasing returns to scale.
To simplify the presentation of the criteria for the firm’s decisions, the intermediate
inputs Y1,…,Yn are divided into two sub-groups: Those that the firm can profitably
produce in-house and those that the firm finds more profitable to outsource to external
suppliers; either one of these sub-groups can be an empty group, however, as we shall see
below. Let these two sub-groups be denoted as H – for the components produced in-
house, and E – for externally produced components, respectively. The sub-group H
includes also the assembly line and the firm’s management. The firm’s profits are thus
given by:
π = PY - w{∑j∈HLj}- r{∑j∈HKj} - {∑j∈EPjYj} (7)
where P is the price of the final product, Pj is the price of purchasing the j-th intermediate
input from an external supplier, w is the wage rate and r is the rate of return to capital.
The first order conditions for profit maximization are:
PFj - Pj = 0 : j ∈E (8)
PFj •(1+αj)• GjL - w = 0 : j ∈H (9)
PFj •(1+αj)• GjK - r = 0 : j ∈H (10)
where Fj = ∂F/∂Yj; GjL = ∂Gj/∂Lj; Gj
K = ∂Gj/∂Kj.
These conditions determine the firm’s decisions with respect to the level of output of the
final product, whether or not to dis-integrate the production process into individual

17
components, and how to choose between alternative sources of supply of the intermediate
inputs. These conditions determine the level of the intermediate input that will be used in
the production of the final product by equating the firm’s marginal costs on either
producing or purchasing that input to the marginal products of that input in the
production of the final output. Condition (8) and (9) determines the firm’s decision
whether to outsource the supply of a given intermediate input to an external supplier by
equating the firm’s marginal costs of producing that input in the firm’s own plant, given
by {w/[(1+αj)• GjL]}, to the price of purchasing the input from and external???, Pj,
calculated at the firm’s gate and including the price paid to the external producer plus all
freight and inland transport costs, insurance, storage, financing and any other related
costs. Condition (8) and a comparison of the purchase price from alternative suppliers
are pivotal in determining the firm’s choice of the external supplier.
The elasticity of substitution between the different components (Y1,…,Yn) need not be
zero, but in the short run this substitution is bound to be quite limited and production is
likely to require nearly fixed proportions of the different components. In the longer run,
some substitution is technically feasible and the firm will have incentives to increase the
share of those parts that became relatively less costly either due to outsourcing or as an
effect of technical progress, thus reducing the share of the other parts. It may also be
possible to substitute labor for capital in the production of the different components, but
the elasticities of substitution are different in the different production functions of the
intermediate inputs. These substitution possibilities are important forces that drive and
guide the firm’s R&D and its continuous search for alternative sources of supply.

18
Likewise, the substitution between labor and capital in the production of individual
components is likely to be rather limited in the short-run; however, if the firm decides to
outsource offshore the production of more labor-intensive components, it reduces its own
labor inputs in the production of the final product, thus raising the relative share of capital
in the firm’s own production. These changes in the relative shares of labor and capital
are, however, not the result of changes in the structure of production along the production
possibilities frontier (i.e., changes in the decision how to produce), but the result of the
firm’s decision to outsource offshore the production of the more labor-intensive
intermediate inputs (i.e., changes in the decision where to produce). For the same reason
there is also likely to be a rise in the relative share of skilled labor in the production costs
of firms in the developed countries as they shed some of their unskilled labor by
offshoring the supply of parts that require mostly unskilled labor. In the longer-run,
however, the substitution of capital for labor and of skilled for unskilled labor is first and
foremost due to the changes in the production methods as an effect of labor-saving
technological innovations. These innovations are not constrained to the production
process and they range from containerization that replaces longshoremen to the dial
phones that replace switchboard operators to the factory-floor robots that replace
assembly-line workers to the automatic teller machines that replace bank tellers. 8
Consider first the firm’s decision whether or not to divide a vertically integrated
production process into individual segments. This decision can be made with respect to
the entire production process of the final product or with respect to a certain segment of
8 The following figures are indicative: From 1980 to 2002 manufacturing output per hour in the US rose by 103 percent whereas output per hour in the overall non-farm business sector rose by only 50 percent. As a result, the number of workers in manufacturing declined from an average of 18 million in the late-1980s to an average of 16 million in the early 2000s.

19
the production process that can still be divided into smaller segments. By dividing the
production process into the production of individual parts and outsourcing the supply of
some parts to producers offshore the firm can take advantage of the lower wages and
other variable costs offshore; the disadvantages of that division are due to the transport
costs from the host to the home country, the loss of the increasing returns to scale and the
positive externalities in an integrated production process and the set-up costs that may be
required to establish a production line for the individual parts offshore.
Economies to scale and positive externalities in an integrated production process reduce
the production costs of the individual segments in a vertically integrated production
process.9 The firm’s marginal costs on each segment therefore differ depending on
whether the production process is segmented into individual components or remains
vertically integrated. In some products or some segments of production the efficiency of
an integrated process may be high to the extent that even when it is technically possible
to divide the process into smaller segments and outsource the supply of some parts to
external producers at much lower marginal costs, this division is inefficient and
unprofitable.10 In making the decision whether or not to divide the production process,
the firm must therefore take into account these economies to scale and externalities, as
we see below. These externalities change the profit maximizing conditions for producing
the j-th intermediate input, and they are then given by:
P(Fj+ F2j +… + Fnj + FAj) ≥ Pj : j ∈E (11)
9 In the words of Alfred Marshall, these effects are due to knowledge spillovers, advantages of the agglomeration of specialized skills, and the backward and forward linkages associated with an integrated production process. In terms of the analytical framework, positive externalities in an integrated production of the i-th and j-th inputs are indicated by: Fij > 0 and/or Fji > 0. 10 In certain segments, particularly certain services, their production by the firm may have negative externalities due to pollution or congestion.
20
P{Fj •(1+αj)• GjL+F1j•(1+α1)• G1
L+…+Fnj•(1+αn)• GnL+FAj•(1+αA)• GA
L}≥ w : j ∈H (12)
High efficiency of the local labor force, positive externalities and large economies to
scale of an integrated production process may therefore motivate the firm to keep the
production process vertically integrated in its own plant despite the high local wages.
These results are in line with the analysis of Grossman and Helpman (1991) who
demonstrated in their endogenous growth model that positive production externalities in
import-competing sectors reduce the gains from trade and may lead to market failure that
reduces the incentives to trade and can even justify some trade restrictions. Figure 3
describes the different options that the firm has when it makes the decision whether to
divide the production process into individual segments or keep it vertically integrated:
INSERT FIGURE 3
The curve OD indicates the production costs of a vertically integrated process; the
‘curvature’ of the curve, i.e., the vertical distance between this curve and the straight line
OA, shows the cumulative gains due to the increasing returns to scale and the cost
savings in an integrated process. By dividing the production process into individual
segments, the firm loses that advantage; in the Figure this is illustrated by assuming that
the production of each of the separate components is then constant returns to scale (c.r.s.)
function of the corresponding inputs; the marginal costs of a segmented production
process therefore remain unchanged at all levels of output. The set-up costs of
establishing one or several lines of production of the individual components offshore are
given by OS, and the line OSB summarizes the total production costs of a dis-integrated
production process. These are the costs at the parent company’s plant and they include
all transport and other indirect costs; the line OSC summarizes the company’s costs of

21
purchasing the parts from the external suppliers and the horizontal difference between
OSB and OSC measures the transport costs of the parts that were outsourced to external
suppliers.11 If the firm’s output (of the final product or of a specific intermediate input)
falls below Y1, then the set-up costs make outsourcing unprofitable; if the firm’s output
exceeds Y2, then the firm’s additional costs as an effect of losing the economies to scale
with the segmentation of the production process exceed the gains due to the lower
marginal costs offshore and the division is therefore unprofitable. At all intermediate
output levels: Y1 < Y < Y2, the firm’s gains due to the lower marginal production costs
make the division and the outsourcing profitable.12
Consider now the firm’s decision whether to outsource the production of an individual
part to an external supplier or to produce it in its own plant. This decision is made by
comparing the firm’s marginal costs of producing that part in-house to the price of
purchasing that part from an external supplier (calculated at the firm’s plant and includes
the cost of purchasing the part at the country of origin + insurance + freight). The first
order conditions (8) – (10) imply that the firm will outsource the supply of the part if:
w/[(1+αj)• GjL] = MCH(Yj) ≥ Pj (13)
In practice, when the firm selects the external producer of that part, it compares not only
the price of the part, but also the quality of the product, the reliability of supply and a host
of other considerations that must be taken into account in order to secure the quality of
11 Jones and Kierzkowski (2001) call these the costs associated with the service link activities and they include communication and coordination services that are required to establish a functioning network among fragments of production blocks that are located in different geographical locations. 12 See also Jones and Kierzkowski (2003) for another diagrammatical illustration of the firm’s options.

22
the final product and prevent disruptions in the assembly line. Figure 4 illustrates the
firm’s different options:
INSERT FIGURE 4
The curve PFj in the Figure shows the value of the marginal product of the j-th
intermediate input in the production of the final product; the shape of the curve is
determined by the concavity of the production function F. PEj is the cost of purchasing
that part from the external supplier. The firm’s marginal costs are determined by its labor
costs and given by: MCH(Yj) = w/[(1+αj)• GjL], where [(1+αj)• Gj
L] is the marginal product
of labor in the production of one unit of that part. Wage difference is therefore only one
of the considerations and differences in labor productivity is another important factor.
1. If the firm’s marginal costs are given by the solid curve MCH(Yj), then the profit
maximizing level of output in in-house production is YHj. In this case, the firm’s
marginal costs are higher than the cost of purchasing the part from an external
supplier PEj at all levels of output, and the firm will therefore outsource to that
supplier the entire production of the part.
2. If the firm’s marginal costs of producing the part are given by the curve MCH#(Yj), the
profit maximizing level of output in in-house production is higher than the cost of
sub-contracting an external supplier, PEj. At lower levels of output, however, the
firm’s marginal costs are lower than PEj. In that case, the firm will produce the
quantity YH#j in-house and outsource the supply of the quantity (YE
j - YH#j) to the
external producer.

23
3. If the firm’s marginal costs are given by the curve MCH*(Yj), then the profit
maximizing level of output in in-house production is YH*j. The contract price of the
external supplier is, in this case, higher than the firm’s marginal costs at all levels of
output below YH*j and the firm will elect to produce that part in-house.
These conditions extend the conditions put forward by Lucas in (3) and (4) in several
directions, but they strengthen the main conclusion: Even when capital can move freely
between countries and the rate of return to capital is equalized, firms in the developed
countries may still prefer to take advantage of the higher efficiency of the local labor
force; by maintaining higher capital/labor ratio in their home production, the wages in the
developed countries will remain higher than the wages in the developing countries
despite the flows of capital. The following more general observations can be drawn from
these conditions:
The pressure to lower production costs by offshoring supply to producers in
developing countries and the shift of companies to a globally integrated production is,
in most cases, restricted to segments of production, products and/or services in which
the wage differences are large enough to outweigh the productivity differences and
cover all transport costs and investment risks, thus making the transition profitable.
These shifts are not restricted, however, to segments of production that use mostly
unskilled labor, and may include segments, products and services in which wages of
the specialized skilled labor in the firm’s home country are considerably higher than
the wages abroad; offshoring high-tech services to India was triggered by the large
differences in the wages of high-tech professionals.

24
Economies to scale and positive externalities in an integrated production process tend
to restrict outsourcing; proximity to the firm’s central units and its management, the
risks of losing control over the firm’s intellectual property, concerns about workers’
safety and investment risks are also significant constraints on outsourcing.
The process of outsourcing is two-directional: As firms in the developed countries
outsource the supply of parts in which production is labor-intensive to producers in
developing countries, many firms in the developing countries outsource the supply of
parts in which production requires specialized machinery and/or skilled labor to the
US or the EU. It is estimated that more than 6.4 million jobs have been in-sourced
into the US in recent years, and the US has a trade surplus in the categories of IT
services that were most directly affected by offshoring;13 moreover, that surplus has
risen from $2.1 billion in 1995 to $4.2 billion in 2002.
Offshoring was a major contributor to the rise in international trade during the past
decade by promoting trade in intermediate inputs. In addition, the pressures of
competition combined with the supply of cheaper imported alternatives of final
products to consumers and of intermediate inputs to producers contributed to curb
inflation, particularly in the developed countries despite the rise in business expenses
on security and the climbing oil prices.
Offshoring also contributed to a rapid increase in productivity due to the growing
specialization of companies in all countries in segments of production in which they
are the most efficient and have the greatest competitive advantage, and to the
13 Including "computer and data processing services" and "database and other information services."

25
acceleration in the transfer of advanced technologies from developed countries to
developing countries.
Lucas’ assumption in his model that the free flow of capital between countries will
equalize the rate of return to capital was clearly made in order to simplify his
presentation. In practice, important factors contribute to maintain large differences
between the rates of return on both direct and financial investments in developed and
developing countries and between developing countries; perhaps the most important
factor is the risk associated with investments in the developing countries. In the
formal analysis the risk factor is introduced by assuming that the flow of capital will
reduce the gap in the certainty equivalent rate of return to capital, rather than the
nominal or the real rates. The risks in most developing countries are particularly high
and they are due not only to production and supply risks but also to policy instability,
security uncertainties, the absence of law and order, etc. As a result, the flow of
capital to the majority of the developing countries, particularly in SSA, remains rather
limited and in many of these countries foreign direct investments tend to concentrate
in the production of primary products, particularly oil, rather than in manufacturing.
The inclusion of all the indirect and set-up costs associated with production offshore
considerably narrows down the cost differential. Thus, for example, whereas the
wage gap in car manufacturing between China and Germany exceeds 95 percent, the
cost difference, after taking into account all the transport and indirect costs, is in the
order of magnitude of only 20 to 40 percent – still large enough to outsource the
production of parts that are particularly labor-intensive, but not large enough to
motivate the transfer of production of many other parts. In a large number of
26
products and countries, the indirect costs are particularly high and the TNCs refrain
altogether from outsourcing to or investing in these countries despite their low wages.
In SSA, high indirect costs plus high investment risks are the main deterrents of most
potential investors (see below).
Other considerations may also be part of the firm’s considerations whether or not to
segment its production process and where to outsource the supply of certain parts:
Suppliers specializing in the production of specific parts or services can often be
more cost-efficient due to economies of scale -- since they typically service several
companies, high proficiency in the production of these parts or services and special
skills and equipment.14
External suppliers even in the firm’s home country often pay lower wages -- partly
because they are less constrained by agreements with labor unions and partly because
they are located in areas where wages are lower (including designated industrial
zones in border areas). The firm’s decision to reduce the number of employees on its
payroll by replacing a labor contract by a commercial contract may also reduce the
influence and negotiating power of the firm’s own labor union over wage increases.
Outsourcing offshore can also save the firm costs of maintaining various
environmental and employment standards that companies in the developed countries
must observe. These considerations are all taken into account by today’s CEOs,
whether or not they stand on the moral high ground. On the other hand, when
14 This higher productivity can be incorporated into the above profit maximization conditions by comparing the labor efficiency of external suppliers, indicated by the values of αE
j and αH(o)j with the firm’s own labor
efficiency αHj in that segment of production.
27
companies shed part of their labor force as they outsource production, they must bear
the costs of settling all their outstanding labor agreements as part of their set-up costs.
By outsourcing the production of some components, the firm may be able to reduce
its stocks of these components and plan its production so that these components are
supplied “just-in-time,” thus pushing some or all of the storage costs to their
suppliers. Outsourcing may also enable the firm to better adjust its own supply of the
final product in order to meet fluctuations in demand without building up large stocks
and/or a large production capacity that may otherwise be necessary to meet peak
demand.
The experience of some firms shows that outsourcing enabled them to trim down,
simplify and rationalize their management, in part because beyond a certain level, in-
house production may raise certain costs due to logistic difficulties, congestion and
other negative externalities.
By reducing the number and variety of parts that the firm produces in its own plant
and outsourcing their supply the firm can have more freedom to select the location of
its plant and thus reduce transport costs to its wholesalers or retailers, by making the
proper selection of their suppliers.
Antràs (2003) and Antràs and Helpman (2003) analyzed the choice of producers in a
developed country between vertical integration and outsourcing offshore.15 Their
analysis led them to the following conclusion:
“In choosing between a domestic and a foreign supplier of parts, a final good
producer trades off the benefits of lower variable costs in the South against the
15 See also Helpman, Melitz, and Yeaple (2003) for a different analysis of this choice.

28
benefits of lower fixed costs in the North. On the other hand, in choosing
between vertical integration and outsourcing, the final good producer trades off
the benefits of ownership advantage from vertical integration against the benefits
of better incentives for the independent supplier of parts” (p. 30).
These conclusions summarize very succinctly the benefits and opportunity costs of these
options, but they leave out a number of key considerations. To use their terminology,
these considerations can be summarized as follows: First, the decisions of a final good
producer are not only between vertical integration and outsourcing, but also between
different alternative of restructuring the production process: What segments of the
production process should the firm outsource to external suppliers and what segments
should it produce in its own plant. Second, the benefits of ownership advantage from
vertical integration include economies to scale and externalities in a vertically integrated
production as well as lower investment risks. Third, perhaps the most important outcome
of the technological feasibility and economic profitability of segmenting the production
process and outsourcing the supply of certain intermediate inputs to external producers is
the choice it gives to the producers of the final good to select suppliers of parts and
services according to their competitive advantage, thus requiring firms to focus on their
core competencies and outsource activities and segments of production in which they
have less expertise and no comparative advantage. Finally, although the choice between
a domestic and a foreign supplier of parts is also influenced by investment risks, it does
not necessarily imply that fixed costs in the North are lower due to high local taxes, high
construction costs, etc. At the same time, a critical consideration in this choice is the
efficiency of the labor force in the North and in the South which determines the variable

29
costs per unit of output. The choice of either a domestic or a foreign supplier need not
therefore involve any trade-offs since in many cases variable costs per unit of output in
the South are higher due to low labor efficiency, and in many other cases fixed costs in
the North are higher. In all these cases the choice therefore need not involve any trade-
off and producers in all countries are better off.
The growing pressures of an increasingly integrated world trade are forcing firms in both
developed and developing countries to restructure their operations, improve their
production structure and supply chain by, among other measures, taking advantage of the
possibilities to outsource some of their less profitable activities and thereby increase their
competitiveness. All too often, however, the objectives of privately owned and
increasingly globalized corporations are not commensurate with the goals of the national
economy. Although the growing opportunities to trade in an integrated global economy
can increase these economies’ gains from trade in the long-run and open up opportunity
to leverage intellectual capital and advanced technologies wherever significantly they are
available, thus accelerating their growth, the process of restructuring and re-allocating
productive resources that global trade requires is slow and agonizing for large segments
of the labor force. Shifting jobs from one sector to another and from one country to
another leaves many people unemployed and many communities lose their main source
of livelihood. While the gains from trade are spread throughout the economy, the pains
for the structural adjustments concentrate on specific sectors and population groups and
are often translated into strong political pressures to restrict free trade and oppose
outsourcing. Amidst rising public concerns, several governments in the North responded
to these pressures by launching national efforts against outsourcing and often even
30
against free trade. In France, the government offers hefty subsidies to companies that
pledge to keep jobs at home for at least three years; in the US, public opinion polls show
that some three-quarters of Americans believe that outsourcing has a negative impact on
the economy and around two-thirds support direct and drastic actions of the federal
government to constrain free trade and penalize companies that offshore jobs.
Among the developing countries the gains from the integrated global economy tend to
concentrate among a relatively small number of countries and relatively narrow segments
of the population. In India, less than 20 percent of the population benefited from their
booming economy during the past decade and most of the gains concentrated among the
highly educated segments of the population. Most of the least developed countries,
particularly in SSA, are lagging behind. As a result, income inequalities between and
within developing countries are on the rise and the sharp fall in poverty that took place
during the 1990s has slowed down and in most SSA countries leveled off. These
developments and their driving forces are reviewed in the next section.
IV. The impact on the less developed countries
For both the developed and the developing countries, outsourcing can be a significant
boon by enabling all countries to reap much larger gains from international trade with
greater specialization in products and services in which they have their largest
comparative advantage. In the past, firms were constrained in their production and trade
decisions to the production of final products due to high transport costs, high import
tariffs and many administrative and technical restrictions on trade. Their options were
either to produce the final product in their home country or transfer its entire production
offshore to the country that has the comparative advantage in its production. Countries

31
that have a comparative advantage in the production of the final product need not have,
however, an advantage in the production of all its parts. If it is technically possible and
economically desirable to divide the production process into several segments, then
countries that have abundance of capital and skilled-labor firms can increase their gains
from trade by outsourcing the production of parts that require relatively more unskilled
labor to countries that have abundance of unskilled labor and low wages and in-source
the production of parts that require relatively more capital or skilled labor. This, in
principle, is what the Heckscher-Ohlin model predicts, but with outsourcing trade can be
expanded to include not only the final products but also the intermediate inputs.
The technical feasibility to divide the production process into separate segments and
outsource the production of certain parts and/or services to external suppliers enables
firms to specialize in the production of those parts in which they have the highest
comparative advantage and thereby reap larger gains from trade. With the development
of better means of communication and transportation, the gradual dismantling of policy
and administrative barriers to trade and the rapid technological progress, firms in all
countries have much greater flexibility in restructuring their production and are therefore
able to take a greater advantage of trade and obtain larger gains from the low wages in
the developing countries and the skilled labor and advanced technologies in the
developed countries. In the developing countries, firms can increase their integration into
the global trading system by specializing in the production of parts and/or services in
which they have comparative advantage due to their low wages even when they do not
have an advantage in the production of the final products. In the developed countries,
outsourcing the production of labor-intensive parts reduces the dependence of local firms
32
on unskilled labor in their own in-house production, mostly migrant workers from the
developing countries, for the production of labor-intensive parts that they can now
offshore. Outsourcing can therefore significantly increase the range of products and
services in which all firms in all countries can compete in the world’s markets and
consequently also the volume of their production and trade.
In the developed countries, outsourcing some production activities, including certain
services, to specialized companies is by no means a new phenomenon; until the early
1990s, however, it was mostly constrained to the firms’ home countries whereas
outsourcing to the developing countries was very limited and concentrated in blue-collar
jobs. Since the mid-1990s, the share of the developing countries has continuously
increased and in recent years it included also services, white collar and skilled-labor jobs.
The process of trade and specialization is highly dynamic, however, and driven by
continuous efforts to reduce production costs and increase profits by adopting more
advanced and innovative technologies and marketing strategies. These are the main
forces that drive both their R&D, their search for new markets for their final products and
less expensive sources of supply of primary and intermediate inputs they need for
production, and their continuous re-assessments how and where to organize their
production. These re-assessments are essential due to continuous changes in market
conditions that are partly due to decisions of their competitors how and where to organize
their production and due to policy changes at home or abroad and trade agreements that
open access to new markets and/or reduce tariffs, changes in exchange rates, etc. Policy
changes are, in principle, external to the firm but they must be taken into account in
planning the firm’s future strategies. Moreover, with the proliferation and growing scale

33
of the global operations of the TNCs, they have an increasing effect on countries’
policies, both in their home country, as demonstrated by the confrontation over the tariff
on steel imports to US.
These changes led to a strong opposition to outsourcing in many developed countries,
particularly the US, even though surveys conducted by the US Labor Bureau suggest the
main reason for the loss of white-collar jobs was not the transfer of jobs to developing
countries but the rapid technical changes and the increase in labor productivity.16
Nevertheless, the political discussions in the US often include combative declarations
against outsourcing and recently France announced generous subsidies to corporations
that do not transfer jobs abroad. Fears that blue- and white-collar jobs will be ‘sucked
out’ of the developed countries as the TNCs transfer larger segments of their operations
offshore touched a raw nerve and demands to ‘keep the jobs home,’ even though, in
practice, they were not supported by the facts.17
One reasons for the very emotional tones and the passion of the political debate in the
developed countries and the opposition to outsourcing is that whereas the benefits from
trade are spread over the entire economy in the form of lower prices and higher growth
rates, the losses concentrate in relatively specific sectors and affect a relatively small
number of communities that lose their income sources and the main local employer cease
16 A recent study quoted in The Wall Street Journal of June 10, 2004, suggests that over the past four years 133,000 jobs, or 16% of the labor pool in the American parts industries, were eliminated, mostly because part suppliers improved productivity and partly because they shifted jobs to lower-cost countries such as China and Mexico. By 2010, the same study predicts that additional 127,000 jobs, or 18% of the remaining labor pool, will be eliminated or move overseas. 17 In the US, for example, the number of jobs that have been in-sourced into the country in recent years has been larger than the number of jobs that have been outsourced. The US Bureau of Labor Statistics, also estimated that high paying management, business, financial, and professional positions in the US has actually increased from 23.4 percent of total employment in 1983 to 31.5 percent in 2002 (see Lindsay, 2004).

34
its operations there and in other communities that changed their character as an effect of a
flood of migrant workers that settled there. Everybody gains from cheaper textile
products made in China, India or Bangladesh, but communities that stand to lose their
entire livelihood strong opposition of when local companies go either bankrupt or abroad
as an effect of cheap imports strongly oppose free trade. In both the EU and the US, the
highly concentrated political pressure of farmers has thus far prevented an international
trade agreement in textile and farm products within the framework of the WTO;18
Ducking the issue of farm subsidies by political parties and politicians in the US and the
EU cost the American tax-payers over $15 billion a year and forces more than 95 percent
of the European consumers to pay much higher prices for their fruits, vegetables and milk
products in order to allow the 5 percent of the population who work in farming to keep
their businesses, while placing crippling burden on farmers in the developing countries.
The great danger of the escalation of the political debate within the developed countries
over outsourcing is that their governments will be under increasing pressured to resort to
protectionism and slow down the process of trade liberalization despite its potential gains
to both the developed and the developing countries. The coalition of certain industries,
farm and labor groups that call to put some restrictions on trade do not necessarily
support a policy of economic isolationism. Some of their complaints are against what
they perceive as unfair trade practices of China, particularly accusations that China
18 Recently, the WTO ruled, however, in favor of Brazilian complaints against the US cotton and the EU sugar programs and WTO members agreed, in principle, to start rolling back direct export subsidies – although no time frame has been set.
35
manipulates its currency to gain trade advantages against U.S. firms and pursue unfair
labor practices.19
The developed countries also resort to protectionist measures that are seemingly within
the rules of the WTO to protect certain industries and particularly sensitive segments of
the labor market.20 These measures include:
⇒ Export and domestic subsidies. In theory, subsidies are designed to address market
failures; in practice they are often used under the pressure of interest groups in order
to protect certain sectors and certain regions.
⇒ Anti-dumping. Anti-dumping duties have become the most popular tool of
protectionism in the developed countries and a number of developing countries have
also started to use anti-dumping duties.
⇒ Labor standards. Despite the economic and moral arguments for adopting minimum
labor standards, the imposition of these standards tend to benefit the developed
countries and harm the poorest ones both because many of their industries may be left
out of world trade as an effect of these regulations, and because many of the poor
people in these countries would prefer to be employed even if these standards are not
imposed than being unemployed.
⇒ Environmental standards. These standards are usually beyond the reach of the least
developed countries and the sanctions imposed by these standards effectively restrict
the capacity of these countries to compete in the export markets.
19 Their claims are that China, by pegging the yuan to the U.S. dollar, was keeping the value of its currency at least 40 percent below where it would be if the yuan's value were set by market forces, giving the country a tremendous competitive advantage. 20 These measures are not targeted specifically against outsourcing and many of them were designed specifically for farm products. With an increase in the political pressures to curtail outsourcing there is danger that these measures will be applied to increase protection on local production and local jobs.
36
The developing countries as a group can be the main beneficiaries from outsourcing due
to the possibilities it opens for them to increase their production for exports and their
share in global trade and to attract large flows of foreign direct investments that can
further accelerate their industrialization, their technical progress, and their overall
economic growth. Not all countries and all economic sectors and population groups were
certain, however, to benefit from these changes in the structure of global trade. Table 1
highlights these differences by showing the trends in the share of the developing
countries in global trade. The first two rows in the Table highlight the very small
changes in the share of the developing countries in the world’s economy during the
1990s; in part the reason is that most of the economic growth of these countries
concentrated in East Asia whereas in most other developing countries growth was at a
much lower pace and the economies of many SSA remained stagnant. The table also
reflects the impact of the financial and economic crisis in 1998 and 1999 that affected
several East Asian and Latin American countries. The decline in the market share of
exports of primary products from the developing countries is primarily due to the fall in
their prices; this decline affected mostly the SSA countries where 17 of the 20 most
important non-fuel export items are primary commodities and resource-based semi-
manufactured goods while their share in the production and exports of more advanced
manufactured products has continuously declined. In contrast, the sharp rise in the
market share of the developing countries in the world exports of low, medium and high-
technology manufacturing products reflect the rapid growth of the East Asian countries
and the sharp changes in the structure of their economies.

37
In all countries, however, the structural adjustments imposed a heavy toll on sectors,
regions and population groups that had to bear the main burden during the transition
period. Even in the East Asian countries, the population that migrated from rural to
urban areas in search of higher incomes, had to go through difficult times until they
managed to settle and their family members that remained in their villages often had to
carry a much heavier burden to keep their farms.
Table 1: SHARE OF DEVELOPING COUNTRIES
IN THE WORLD ECONOMY 1990 1999
Gross domestic product (current dollars) 22.3 23.8 Gross domestic product (purchasing power parity) 43.6 46.9 Export market shares 1985 2000 Primary products 62.0 59.6 Resource-based manufactures 31.3 31.8 Low-technology manufactures 33.6 50.3 Medium-technology manufactures 10.8 21.4 High-technology manufactures 16.8 36.6 Source: Calculations based on World Bank Indicators in various years.
When the TNCs consider possible destinations to outsource the production of certain
final products or intermediate inputs, they compare prices – after including all transport
and other related costs – as well as quality, reliability and timeliness of supply, and
investment risks. Transaction costs include also the costs of financing such as banking
fees, insurance costs to secure against violation of contracts or default (usually in the
form of letter of credit or export guarantees), local taxes, etc. If outsourcing involves
investments in certain lines of production in the host country, they must also take into
account the investment risks that vary widely between countries. Their investment costs
include also the time and physical resources needed to transfer know-how and advanced
technology, training local workers and assimilating knowledge of local markets,

38
institutions and administrative rules and regulations. In addition to costs, foreign
investors must also take into account the efficiency of the local labor force, the
availability of skilled labor that may still be needed even for the production of goods that
require mostly unskilled labor and the economies to scale in an integrated production
process. Low wages of the local workers offshore are therefore only part, and often not
even the most important part, of the overall considerations that the TNCs must take into
account when they decide whether to dis-agglomerate their production, how to structure
their supply chain and where to outsource the production of certain segments of
production.
The high concentration of foreign direct investments in a relatively small number of
developing countries is therefore due not only to the low wages of local workers but also
to the large differences between countries in the effectiveness of their financial system,
the quality of their inland and port infrastructure, the risks involved in long-term
investments that are strongly influenced by their economic policies and the stability of
their political regime, the efficiency and proficiency of their labor force, the availability
of high-skilled professionals, particularly in ICT, the incentives offered by the local
authorities to foreign investors, etc. In most of these areas, the countries of SSA are at a
comparative disadvantage relative to the East Asian countries and they therefore did not
fare well in the competitive global market, and, as a result, did not succeed to attract a
significant volume of foreign private investments (Table 2).
Table 2: FDI Flows to major regions and countries: 2001-2002
(In billion US$)

39
Source: UNCTAD FDI database
The changes in the structure of trade between the developed and the developing countries
with the rapid increase in outsourcing and in the share of intermediate inputs in global
trade is changing also the entire structure of the supply chain from the producers in the
developing countries to traders, to wholesalers and to retailers in the developed countries.
Corporations from developed countries that transfer some or even most of their
production to developing countries usually retain management, marketing, accounting,
and several other units in their home country. As a result, producers and sub-contractors
in the developing countries often have a rather limited impact on the corporations’
decisions. In fact, local producers and, in many cases, also their governments tend to
deliberately restrict their interference with the TNCs decisions in light of an implicit but
omnipresent threat of these corporations to transfer their operations to another country.
Agricultural producers are particularly vulnerable to this structure of the supply chain
because they have difficulties to meet the demands of strict food safety and other
standards, both those that are required by the SPS and TBT agreements and those that are
required by wholesalers in the developed country. As a result, even when the entire
production is transferred to a developing country, the TNC and the wholesaler in the
developed country often have exclusive rights on the purchases of the final product and
full responsibility and ownership over marketing and management. This structure of
Host Region 2001 2002 World 824 651 Developed Countries 589 460 Developing Countries 209 162 Africa 19 11 LAC 84 56 Asia & Pacific 107 95 China 47 53 Central and Eastern Europe 25 29

40
trade restricts competition and determines clear boundaries on the capacity of local
producers in the developing country to take advantage of its comparative advantage and
compete in the world’s markets.
The discussion in this section highlights the fact that a complete answer to Lucas’
question also has significant institutional and political dimensions. Although the basic
production and marketing strategies of companies in the developed countries are based on
economic criteria that, in the final analysis, determine the bottom line in their current and
expected profit and loss accounts, in practice their decisions are all too often constrained
by various rules and regulations that restrict their choices and limit their capacity or
incentives to invest in many developing countries even when economic considerations
alone seem to offer high rates of return on investments in these countries. The next
section discusses these considerations in the countries of SSA, where political constraints
often play a dominant role.
V. Can the SSA countries expand their role in global outsourcing?
For the countries of SSA, outsourcing can offer significant opportunities to develop some
of their economic sectors. So far, however, the countries of SSA have benefited very
little from outsourcing, despite their very low wages and despite several other advantages
that they can offer to potential investors. Many African countries offer significant
advantages in the production of a considerable number of high-value, non-traditional
agricultural products due to their favorable agro-climatic conditions and cheap labor.
The introduction of these crops to rural areas in these countries, particularly to small
farms, requires, however, concerted efforts and investments of these countries’ extension
services and agricultural R&D institutes, their semi-public marketing agencies, their

41
relevant government ministries, local NGOs and the private sector. Some countries have
already made considerable inroads in production and exports of tropical fruits and
vegetables. In some cases, large wholesalers from developed countries contracted local
producers to produce these crops; in other cases, large trading companies made direct
investments to produce these products. That potential and the possibilities to increase the
local value added through further processing is far from being exhausted, however. A
number of African countries also offer significant advantages in the manufacturing of
products that require natural resources that are available in these SSA countries.
All too often, these advantages and the low wages of local workers in SSA fail, however,
to provide sufficiently strong incentive to attract foreign investors. Although the costs of
producing products that require these raw materials and exporting them to the EU are
certain to be much lower in the SSA countries than in the EU countries themselves, for
the TNCs this is not the relevant consideration: For them, the selection of producers and
suppliers along the supply chain is made by comparing the costs of producing or
outsourcing the supply of each part at each stage of the production process between
alternative producers and suppliers in different countries. In SSA, the high costs of in-
land transport due to poor infrastructure in the hinterland and in their air and seaports, the
high financial costs, the high local tariffs and taxes on trade,21 the high investment risks
and the web of red tape that wrap all administrative decisions reduce the incentives of the
TNCs to invest in these countries, particularly in more advanced stages of production that
require further processing and more capital-intensive technologies, and make it
worthwhile for them to transfer these stages of the production process to other countries 21 In the African countries, trade taxes are still very high: In 1995 these taxes exceeded 5 per cent of their GDP compared to an average of 3 per cent of GDP in other developing-countries and less than 0.5 percent in the developed countries.

42
or to their own home country even when they use raw materials from SSA and despite the
low wages there. Moreover, wages of unskilled labor in most East Asian countries,
particularly in China, are still very low, often as low as the wages in SSA, but the quality
of infrastructure and other business services in these countries is far better. In other
countries that became a Mecca for foreign investments, such as Brazil and Singapore,
wages are higher than in SSA, but these countries offer far better services, better
infrastructure, larger supply of skilled labor and a wide range of other incentives to
investors that give them considerable advantage. As a result, the main exports of most
SSA countries are still raw materials, (oil and unprocessed agricultural goods), while
further processing that raises the products’ value-added is done elsewhere.
The profit maximization conditions in Section III focused on the labor costs and labor
productivity. Using the criteria that were determined by these conditions, it can be
concluded that when potential investors make the decision where to invest, they compare
first the labor costs per unit of output, thus taking into account the differences in labor
productivity. The comparison of the production costs in two countries ε; τ ∈ E, that can
be potential suppliers of that product, is thus based on the comparison of the difference:
{ wε/[(1+αεj)•Gε
jL] - wτ/[(1+ατj)•Gτ
jL]} : ε; τ ∈ E
If this difference is not very large, then the other costs that are part of the production
process, as well as the various administrative incentives or constraints, may well
outweigh the significance of the direct costs criteria associated with low wages and labor
productivity. The large difference between labor costs in SSA and in the EU is therefore
not very relevant for these decisions because producers in the EU determine their

43
decision by comparing the labor costs in SSA with labor costs in other developing
countries to which they can outsource the production these products. In these
comparisons, the balance has not been favorable so far for the SSA countries. Despite
their relative proximity to Europe and the availability of many raw materials and
agricultural products, a host of other factors – economic, political and institutional – deter
the TNCs from subcontracting local producers or make direct investments in these
countries.
Even in agricultural products, Africa’s trade performance was influenced adversely by
the difficulties of local producers and exporters to integrate into the global distribution
and marketing chains, tap into cheaper finance, organize efficient logistics, and meet the
standards demanded by consumers in the developed countries and market exigencies such
as the sanitary and phytosanitary (SPS) measures required by the WTO for food exports.
African traders often have difficulties to compete in world markets also because they lack
accurate market information and fail to meet timely delivery. The continent’s
underdeveloped and unreliable road and railway networks, the cumbersome customs
formalities, and the lack of centrally organized services to assist producers and exporters
further increase transaction costs for businesses.
Small agricultural producers and traders in many developing countries also suffer from
the far-reaching changes in the structure of the world’s markets for these products that
has become increasingly oligopolistic. Producers and traders in these countries must
export most of their products through a supply chain system that is largely dominated by
the TNCs. Although the share of SSA in world agricultural trade has not declined during
the past decade, the share of small farmers has declined very sharply and as a result, more

44
of them resort to production for self consumption or to their local markets.22 The control
of the TNCs over the supply chain and over the flow of goods from production to
delivery enables the intermediaries to appropriate a growing share of the profits. In
commodities such as coffee and tea business in the markets of the developed countries
has been booming in recent years and the prices in the retail stores have risen sharply, but
this has not been reflected in the prices received by producers in developing countries. In
the early 1990s, earnings by coffee-producing countries (export prices f.o.b.) were some
$10–12 billion, while the value of retail sales was about $30 billion; ten years later the
value of retail sales jumped to $70 billion, but producers received only $5.5 billion.
World market prices for coffee have actually fallen from about 120 US cents per pound
in the 1980s to around 55 US cents, reaching their lowest levels in real terms in 2002.
The growing share of wholesalers and retailers in the importing countries in the incomes
accrued in the coffee supply chain also met little objection because farming and local
trading in the producing countries are highly fragmented and the destruction of their local
marketing boards further reduced the capacity of farmers to maintain their share. In
addition, the declining terms of trade for the SSA commodity-dependent countries was
exacerbated by high price volatility of their major exports such as coffee, cocoa, tea and
cotton.23
The most important factors that inhibit investments in many SSA countries are the
unstable macroeconomic environment, ineffective and often corrupt public institutions, 22 They often find it difficult, however, to compete even in their local markets with the highly subsidized agricultural products imported from the EU or the US. 23 The World Bank estimates that the cumulative loss resulting from adverse terms of trade over the period 1970–1997 for the African non-oil-exporting countries (excluding South Africa) amounted to 119 per cent of their combined GDP in 1997 (World Bank, 2000: 21–22).

45
highly unstable business environment and, in many countries, the absence of a basic rule
of law. Collier and Gunning (1999) made the following pessimistic observations on the
impact of these factors on would-be investors:
“Today, the chief problem is those policies which are ostensibly domestically-oriented, notably
poor delivery of public services. These problems are much more difficult to correct than exchange
rate and trade policies, and so the policy reform effort needs to be intensified. However, even
widespread policy reforms in this area might not be sufficient to induce a recovery in private
investment, since recent economic reforms are never fully credible. Investment rating services list
Africa as the riskiest region in the world. Indeed, there is some evidence that Africa suffers from
being perceived by investors as a “bad neighborhood.” Analysis of the global risk ratings shows
that while they are largely explicable in terms of economic fundamentals, Africa as a whole is
rated as significantly more risky than is warranted by these fundamentals (Haque et al., 1999).
Similarly, private investment appears to be significantly lower in Africa than is explicable in terms
of economic fundamentals (Jaspersen et al., 1999). “Africa” thus seems to be treated as a
meaningful category by investors. The perception of high risk for investing in Africa may partly
be corrected by the passage of time, but reforming African governments can also take certain steps
to commit themselves to defend economic reforms. Internationally, governments may increasingly
make use of rules within the World Trade Organization, and shift their economic relations with the
European Union from unreciprocated trade preferences to a wider range of reciprocated
commitments. Domestically, there is a trend to freedom of the press, and the creation of
independent centers of authority in central banks and revenue authorities, all of which should
generally help to reinforce a climate of openness and democracy, which is likely to be supportive
of economic reform” (Collier and Gunning 1999, 20).
In recent years there has been an encouraging increase in the number of SSA countries
that manage to create a more stable economic and business environment, including South
Africa, Uganda, Senegal, and Ghana, to some extent also Nigeria can offer new
opportunities to investors. An important outcome of these developments was the rise in
merchandise exports from the Sub-Saharan African countries by 3.6 percent in 2002. 24
Although this rise is smaller than the rise by 7.8 percent from the entire group of
24 Some of the increase is in trade between the African countries that is mainly attributed to the transfer of unrecorded trade into the recorded or formal sector.
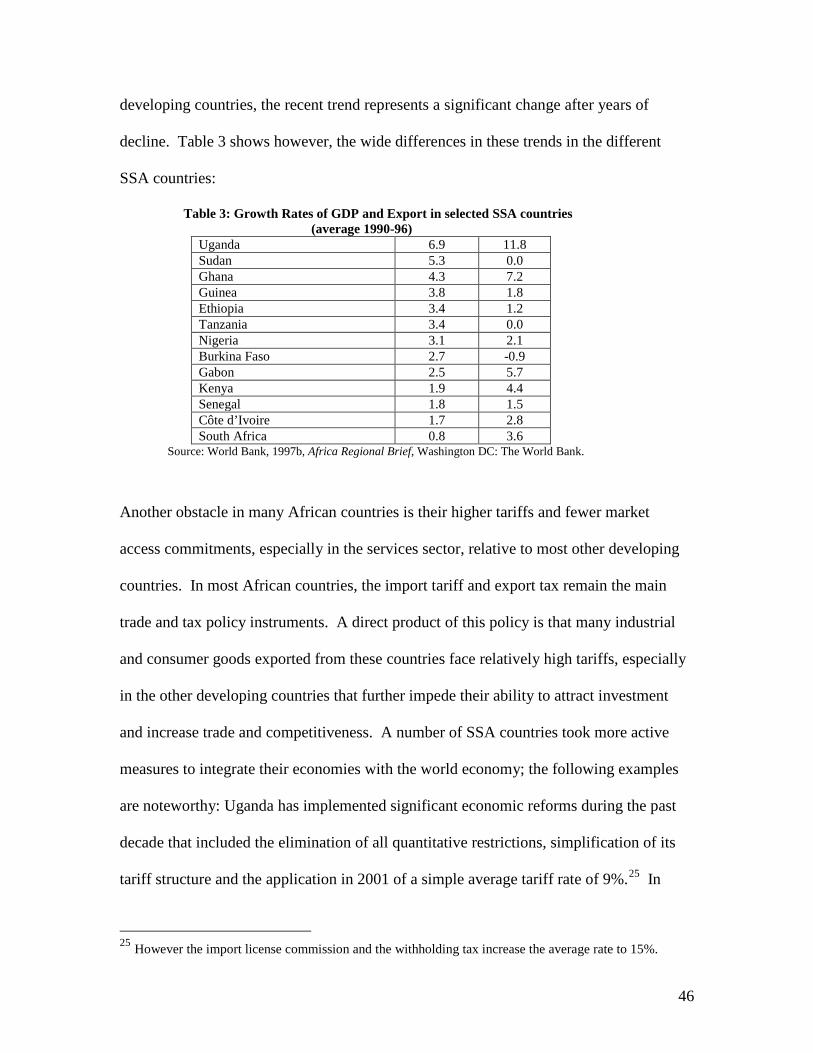
46
developing countries, the recent trend represents a significant change after years of
decline. Table 3 shows however, the wide differences in these trends in the different
SSA countries:
Table 3: Growth Rates of GDP and Export in selected SSA countries (average 1990-96)
Uganda 6.9 11.8 Sudan 5.3 0.0 Ghana 4.3 7.2 Guinea 3.8 1.8 Ethiopia 3.4 1.2 Tanzania 3.4 0.0 Nigeria 3.1 2.1 Burkina Faso 2.7 -0.9 Gabon 2.5 5.7 Kenya 1.9 4.4 Senegal 1.8 1.5 Côte d’Ivoire 1.7 2.8 South Africa 0.8 3.6
Source: World Bank, 1997b, Africa Regional Brief, Washington DC: The World Bank.
Another obstacle in many African countries is their higher tariffs and fewer market
access commitments, especially in the services sector, relative to most other developing
countries. In most African countries, the import tariff and export tax remain the main
trade and tax policy instruments. A direct product of this policy is that many industrial
and consumer goods exported from these countries face relatively high tariffs, especially
in the other developing countries that further impede their ability to attract investment
and increase trade and competitiveness. A number of SSA countries took more active
measures to integrate their economies with the world economy; the following examples
are noteworthy: Uganda has implemented significant economic reforms during the past
decade that included the elimination of all quantitative restrictions, simplification of its
tariff structure and the application in 2001 of a simple average tariff rate of 9%.25 In
25 However the import license commission and the withholding tax increase the average rate to 15%.

47
Ghana the simple average tariff was reduced from 17% in 1992 to 13% on January 2000,
but was raised again to nearly 15% in February 2000 when a “special import tax” of 20%
was re-introduced. Another obstacle that deter would-be investors is that due to the small
share of the SSA countries in world trade they do not have much to offer to their trading
partners by way of market access concessions, thus limiting their capacity to engage in
reciprocal bargaining that is central to the operation of the WTO and regional trade
organizations, and to offer advantages to would-be investors and exporters from foreign
countries (Mattoo and Subramanian, 2004).
These examples highlight the limited significance of the wage gap between the countries
of SSA and the developed countries in attracting would be investors or contractors from
the developed countries. In fact, during the past decade the wage gap between the SSA
countries and all developed countries and most developing countries has actually widened
but their share in world trade has declined (Table 4). Moreover, the SSA countries
benefited very little from the sharp increase in the flow of FDI from the developed to the
developing countries and only a trickle of this flow, less that 2% of the total in 2001 and
2002, reached their shores.26
TABLE 4: SHARES OF DEVELOPING REGIONS IN WORLD MERCHANDISE TRADE, 1980–2000
(Percent) 1980 1985 1990 1995 2000
Exports World 100.0 100.0 100.0 100.0 100.0 Sub-Saharan Africa 3.7 2.5 1.9 1.5 1.5 Developing Asia 17.9 15.6 16.9 21.6 24.3
Imports World 100.0 100.0 100.0 100.0 100.0 Sub-Saharan Africa 3.1 2.1 1.6 1.6 1.3 Developing Asia 13.1 15.2 15.9 21.9 21.1
Source: UNCTAD, Handbook of Statistics.
26 Moreover, with the exception of SSA, most of these investments were oil exploration and production.

48
VI: Can SSA increase its share in FDI?
The main answer to Lucas’ paradox is, however, in the numbers themselves. Since the
early 1980s, world flows of FDI have grown faster than both world trade and world
output. The flows to developing countries grew at an average annual rate of over 30% in
the first half of the 1990s and 15% in the late 1990s -- from less than $35bn per year in
1990 to over $210 billion in 2001. More than half of these investments were in the East
Asian countries, primarily in China, Hong Kong, Singapore and, until the Asian crisis of
1998, Indonesia; investments in LAC countries were at a lower pace and concentrated
mainly in Chile, Brazil and, until the financial and economic crisis since 1999, also in
Argentina. A considerable portion of these investments was associated with mergers and
acquisitions (M&As) of the TNCs that increased their global role and the geographical
spread of their operations. Figures 5 and 6 highlight the changes in the flows of direct
and portfolio investments to the 25 emerging economies during the 1990s and the
relatively small share of SSA.
INSERT FIGURES 5 & 6
The surge in FDI to the developing countries, had a number of key characteristics: 27
First, more than 70 percent of the total worldwide flow of FDI was to the developed
countries themselves (Table 4); second, of the total flow of FDI into the developing
countries, more than two-thirds went to only five countries: Brazil, Mexico, China, Hong-
Kong and Singapore.28 Third, the total amount of FDI worldwide in 2000 stood at an all-
time historical high -- almost six times higher than the level recorded only five years 27 The main sources of the data in this review and of the charts and tables are UNCTAD 2003 report and the OECD Global Forum on International Investment (2003) Attracting International Investment for Development. 28 Until the financial crises in Indonesia and Argentina in the late 1990s, these countries were also the recipients of large flows of foreign capital.

49
earlier. In 2001 and 2002 there was a significant decline in the flow of international
investments following the “bubble” of 1999 and 2000; nevertheless, their level was still
twice their level in the mid-1990s. The hike in FDI inflows and outflows, particularly in
1999 and 2000, affected mostly the largest OECD economies, and it was mainly driven
by the large and rapidly growing number of M&As in both the developed and the
developing countries, and by the wave of global restructuring and repositioning among
the TNCs.
In the developing countries, stepped-up privatization measures of the authorities in many
countries, primarily the previously centrally planned economies, and direct investments
of the TNCs in China, Hong Kong and Mexico played the most significant role in the
large increase in FDI. Investment risks was one of the most important guiding principles
that guided foreign businesses and investors in their investments decisions in the
developing countries and their main criteria were dependable and open regulatory
regimes, competitive and investor- friendly environment, and political and economic
stability; other criteria included the indirect costs associated with the level of
development of the local infrastructure, the efficiency of the local workforce and the
availability of more proficient human capital. Intense competition drove the TNCs to
increase their investments in new markets and seek access to low-cost resources and
factors of production. At the same time, there was also intense competition between the
developing countries to attract FDI, and the governments of these countries were
pressured to adjust their policies making them more open and stable, offer more
incentives to foreign investors and implement various other investment promotion
strategies. Many of these governments also accelerated the liberalization of their trade
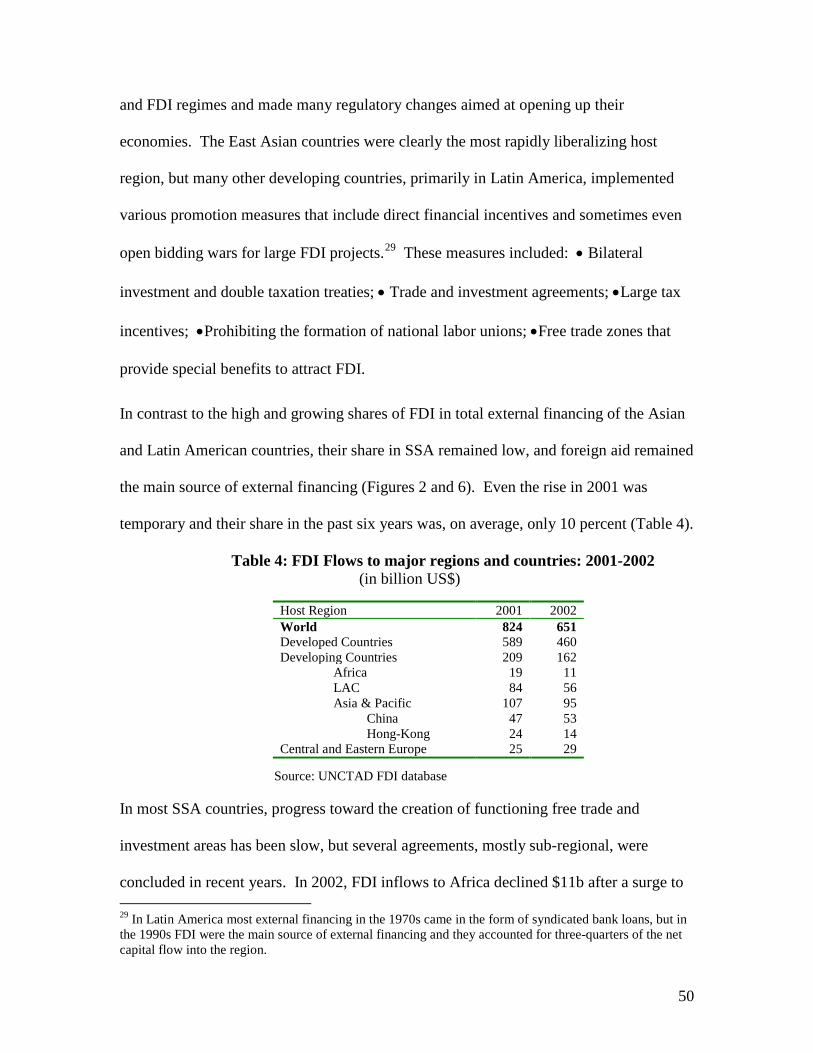
50
and FDI regimes and made many regulatory changes aimed at opening up their
economies. The East Asian countries were clearly the most rapidly liberalizing host
region, but many other developing countries, primarily in Latin America, implemented
various promotion measures that include direct financial incentives and sometimes even
open bidding wars for large FDI projects.29 These measures included: • Bilateral
investment and double taxation treaties; • Trade and investment agreements; •Large tax
incentives; •Prohibiting the formation of national labor unions; •Free trade zones that
provide special benefits to attract FDI.
In contrast to the high and growing shares of FDI in total external financing of the Asian
and Latin American countries, their share in SSA remained low, and foreign aid remained
the main source of external financing (Figures 2 and 6). Even the rise in 2001 was
temporary and their share in the past six years was, on average, only 10 percent (Table 4).
Table 4: FDI Flows to major regions and countries: 2001-2002 (in billion US$)
Source: UNCTAD FDI database
In most SSA countries, progress toward the creation of functioning free trade and
investment areas has been slow, but several agreements, mostly sub-regional, were
concluded in recent years. In 2002, FDI inflows to Africa declined $11b after a surge to 29 In Latin America most external financing in the 1970s came in the form of syndicated bank loans, but in the 1990s FDI were the main source of external financing and they accounted for three-quarters of the net capital flow into the region.
Host Region 2001 2002 World 824 651 Developed Countries 589 460 Developing Countries 209 162 Africa 19 11 LAC 84 56 Asia & Pacific 107 95 China 47 53 Hong-Kong 24 14 Central and Eastern Europe 25 29

51
$19b in 2001, mostly to South Africa as a consequence of cross border M&A. The
region’s share in global FDI inflows fell from 2.3% in 2001 to 1.7% in 2002 (Table 4 and
Figure 5). U.S. companies had the largest share in total investments in the region, but
these investments accounts for less than one percent of the US FDI position worldwide.
US investments in South Africa were largely in manufacturing, while the rest was
dominated by investment in the petroleum sector, primarily oil explorations in several oil
rich countries.
Investment Policy Reviews for the African countries conducted by UNCTAD show some
developments in the regulation and promotion of FDI. Standards of treatment and
protection of foreign investors have become the norm even in countries without FDI
laws. Privatization with the participation of foreign firms has become an important
practical measure to attract foreign investors and increase their stakes in the local
economy. But the UNCTAD reports also indicate that the majority of the African
countries are still lagging behind most other developing countries. While FDI-specific
standards are far better now and generally sound, the regulatory measures for businesses
are still quite erratic and all too often discriminatory and arbitrary. Limited
competitiveness in most export industries further reduces their attraction to foreign
investors, and these countries also lack of adequate labor regulation and effective
arrangements for industrial dispute resolutions. The 2004 report highlights the fact that
the concerns that many government in SSA still have about liberalizing FDI and giving
more freedom to TNCs have a great deal of similarity to the concerns that these
governments have about the impact of trade liberalization (p. 104-105). On the one hand,
these governments became increasingly aware of the potential impact of free trade and of

52
FDI on improving the allocation of their countries economic resources; on the other hand,
there were concerns that the inefficiency of local markets and local institutions may
hamper these effects of free trade and FDI. In particular, inefficient, rigid and often
corrupt local institutions and legal system are likely to saddle the effective functioning of
local markets and obstruct the efficiency of competitive free trade. The UNCTAD report
recognizes that while the benefits from FDI rests on an effective exploitation of the
advantages of free trade and perfect competition, there may be a case for restricting free
trade and foreign investments if these conditions do not exist since attempts to exploit
these advantages can then only harm rather than benefit the host economy. This, for
example, can be the case if the TNCs are engaged in anticompetitive business practices,
or when there is a divergence between the social and economic goals. Even where
market failures make free trade and FDI harmful rather than beneficial, however, the
report argues that the case for restricting FDI can be made only if the host government
can design and implement effective interventions that can lead to better results for
consumers.
Other arguments that are often raised in favor of some controls over the inflow of FDI
include:
• Infant domestic entrepreneurship: Strong foreign presence may crowd out local
entrepreneurship30 -- similar to the effect of free trade on infant industries. South Korea
and Taiwan are two examples of countries that in their early development restricted FDI
in order to give an advantage to domestic entrepreneurship. As with free trade, however,
protection is not always helping infant industries to grow and political pressures oppose
30 This was the case in the automotive components industry in Brazil and Mexico

53
the removal of this protection even when the case for maintaining it no longer exists.
Beyond that stage, further restrictions may impose high costs on the host economy.
• Deepening of local technological: The superior technologies that the TNCs bring with
them often deters local investments in R&D and encourage local industries to buy ready-
made technologies or skills from abroad even when these technologies are not entirely
suitable to the local conditions. Moreover, the spillover (or positive externality)
generated by FDI include not only technological diffusion but also human capital
building. Foreign-owned enterprises provide their suppliers with technical assistance,
information, training and other information to raise the quality of their products, and
assistance in modernizing and upgrading their production facilities.
• Risks of relocation: Foreign investors may decide to relocate their plants and activities
in another country or possibly back in their own home country if conditions change in
either the host country or their home country.
V: Concluding Remarks
In the past decade, only a handful of developing countries gained significantly from
outsourcing or managed to attract substantial foreign direct investments. The potential
gains due to low wages that most other developing countries offer to foreign investors are
outweighed by high transaction costs and investment risks. As a result, most developing
countries were not able to compete with the advantages that China and few other
emerging economies could offer to foreign investors. Indeed, throughout the 1990s and
even before the financial crisis of the late 1990s, capital flows from the developed to the

54
developing countries fell considerably short of what theoretical models predicted on the
basis of the difference in the production costs.31
The developing countries that were able to attract foreign investors and in-source a large
volume of production accelerated their growth and significantly raised local incomes.
The TNCs brought advanced technologies, improved marketing strategies of local
producers, gave them access to international clients, and made large investments in local
R&D and human capital through extensive training of their workers. By offering much
higher wages to skilled workers, they also gave strong incentives to the local youth to
acquire higher education and better skills.
In principle, outsourcing and FDI can make a significant contribution to expanding
international trade and increase the gains that all countries, particularly the developing
countries, receive by integrating into the global trading system. Even though these gains
are positive-sum and all countries can profit, the potential for net gains for all is,
however, not the principle that guides the TNCs in their trade investments. The larger
gains that trade between a sub-group of countries can offer while excluding many other
countries, and the higher profits that the TNCs can extract by targeting their investments,
outsourcing their production, and restricting their supply chain to this sub-group of
countries, leave the other countries largely outside that chain. As a result, although the
total gains from trade still have a positive sum, the distribution of these gains may not
bring about win-win outcomes that benefit all countries. The relatively more powerful
actors along the supply chain, primarily the TNCs, have a strong impact on the
31 Rodrik (2000) noted also that real interest rates were not driven so far to equality even among advanced countries with integrated financial markets, in contrast to the Lucas model; investment portfolios in the advanced industrial countries typically exhibit large amounts of “home bias” that seems to reflect risk aversion.
55
distribution of these gains between producers and consumers and between countries; as a
result, the dismal share of producers, consumers and traders in many developing
countries may reduce their incentives to engage in and support free trade. One result of
these developments during the 1990s and early 2000s was a growing income gap between
the least developed countries and the emerging and developed countries; another result
was a growing income gap between different sub-groups of the population in the
developed countries and some of the emerging economies, due to the unequal distribution
of the gains from trade. These income gaps may tilt the political balance and strengthen
the opposition to outsourcing and FDI, and can lead to a lose-lose outcome that the
countries and population groups that were left out or may have lost will still find better
off than the free trade outcome.
56
References Antràs, P. (2003) “Firms, Contracts, and Trade Structure.” Quarterly Journal of
Economics 118 (November 2003): 1374-1418.
Antràs, P. and E. Helpman (2003) “Global Sourcing,” Harvard University, Tel Aviv University, CIAR and NBER.
Arndt, Sven and Henryk Kierzkowski, eds., (2001), Fragmentation: New Production and Trade Patterns in the World Economy, (Oxford University Press, Oxford.)
Brown, D., A. Deardorff, and R. Stern. 2002. "The Effects of Multinational Production on Wages and Working Conditions in Developing Countries," in R. E. Baldwin and L. A. Winters, eds., Challenges to Globalization, manuscript under review
Feenstra, R. C., and Hanson, G. H. (1996) “Globalization, Outsourcing, and Wage Inequality.” American Economic Review 86 (May 1996): 240-245.
Feenstra, R. C. and Hanson, G. H. (1998) “Impact of Outsourcing and High Technology Capital or Wages: Estimates for the United States, 1979-1990”, Quarterly Journal of Economics, 114 (3), 907-940.
Fujita, M., P. Krugman and A. Venables (1999): The Spatial Economy: Cities, Regions and International Trade (MIT Press).
Grossman, G.M. and E. Helpman (1991), Innovation and Growth in the Global Economy, Cambridge, Mass.: MIT Press.
Grossman, G. and E. Helpman (1994), “Protection for Sale”, American Economic Review 84(4): 833-50, September.
Grossman, G. M., and E. Helpman, (2002) “Integration versus Outsourcing in Industry Equilibrium.” Quarterly Journal of Economics 117 (February 2002): 85-120.
Grossman, Gene M., and Helpman, Elhanan (2003), “Managerial Incentives and the International Organization of Production.” Journal of International Economics, 2003.
Helpman, E., M. Melitz, and S. Yeaple, (2003) “Export versus FDI with Heterogeneous Firms.” American Economic Review, 2003.
Jones, R. and H. Kierzkowski (2003), “International Trade and Agglomeration: An Alternative Framework.”
Jones, Ronald W. and Henryk Kierzkowski, (2001), “A Framework for Fragmentation” in S. Arndt and H. Kierzkowski (2001).
Krugman, P, 2000. "Technology, Trade, and Factor Prices," Journal of International Economics, 51-72.
Lucas, R. E. (1990), ”Why Doesn’t Capital Flow from Rich to Poor Countries?”, American Economic Review: Papers and Proceedings, 80(2), 92-96 (May).
Melitz, M. J. (2003) “The Impact of Trade on Intra-Industry Reallocations and Aggregate Industry Productivity.” Econometrica 71 (November 2003): 1695-1725.
57
Ng, Francis and Alexander Yeats, (2001), “ Production Sharing in East Asia: Who Does What for Whom and Why?” in Cheng and Kierzkowski (2002).
Razin, A., Rubinstein, Y. and Sadka, E. (2003), “Which Countries Export FDI, and How Much?” Working Paper No. 200, Stanford Center for International Development.
Rodric, D. (1997) " Has Globalization gone too far?", California Management Review.
____ (2000) “How far will international economic integration go?” Journal of Economic Perspectives, 14(1), 177–186
UNCTAD (1996). Trade and Development Report 1996.
UNCTAD (2003). Trade Performance and Commodity Dependence, United Nations publication, New York and Geneva.
____ (2004). The Least Developed Countries Report 2004: Linking International Trade with Poverty Reduction.
World Bank, 1993, The East Asian Miracle: Economic Growth and Public Policy, Washington DC: The World Bank.
World Bank, 2002, "Globalization, Growth and Poverty," A World Bank Policy Research Report.
World Bank (2003), “Global Economic Prospects 2004: Realizing the Development Promise of the Doha Agenda,” Washington D.C.
World Trade Organization. Annual Report. Geneva: World Trade Organization, 1998.
Yeats, A. J. (2001) “Just How Big Is Global Production Sharing?” In Arndt, S.W., and Kierzkowski, H. eds., Fragmentation: New Production Patterns in the World Economy, Oxford University Press, 2001.
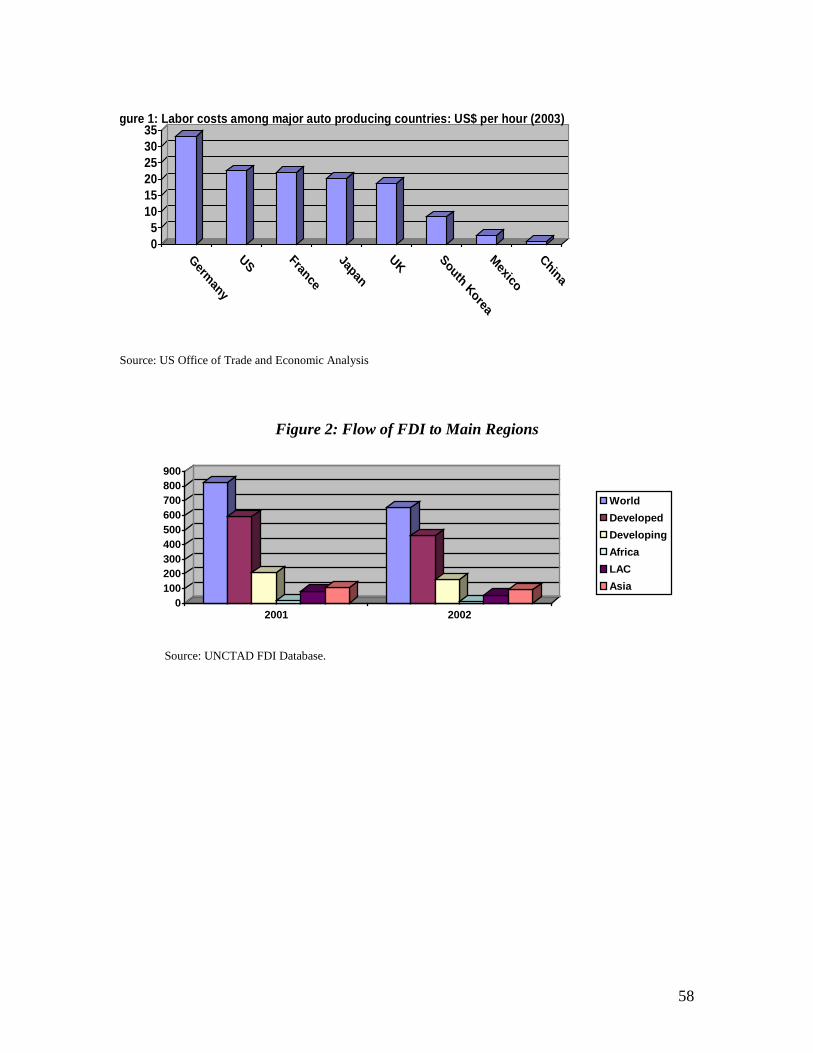
58
05
101520253035
Germany
US France
Japan
UK South Korea
Mexico
China
gure 1: Labor costs among major auto producing countries: US$ per hour (2003)
Source: US Office of Trade and Economic Analysis
Figure 2: Flow of FDI to Main Regions
0100200300400500600700800900
2001 2002
WorldDevelopedDevelopingAfricaLACAsia
Source: UNCTAD FDI Database.

59
Figure 3: The firm’s Decision whether and when to dis-agglomerate a Vertically Integrated Production
Costs
Output
A
B
C
D
O Y2
S
Y1
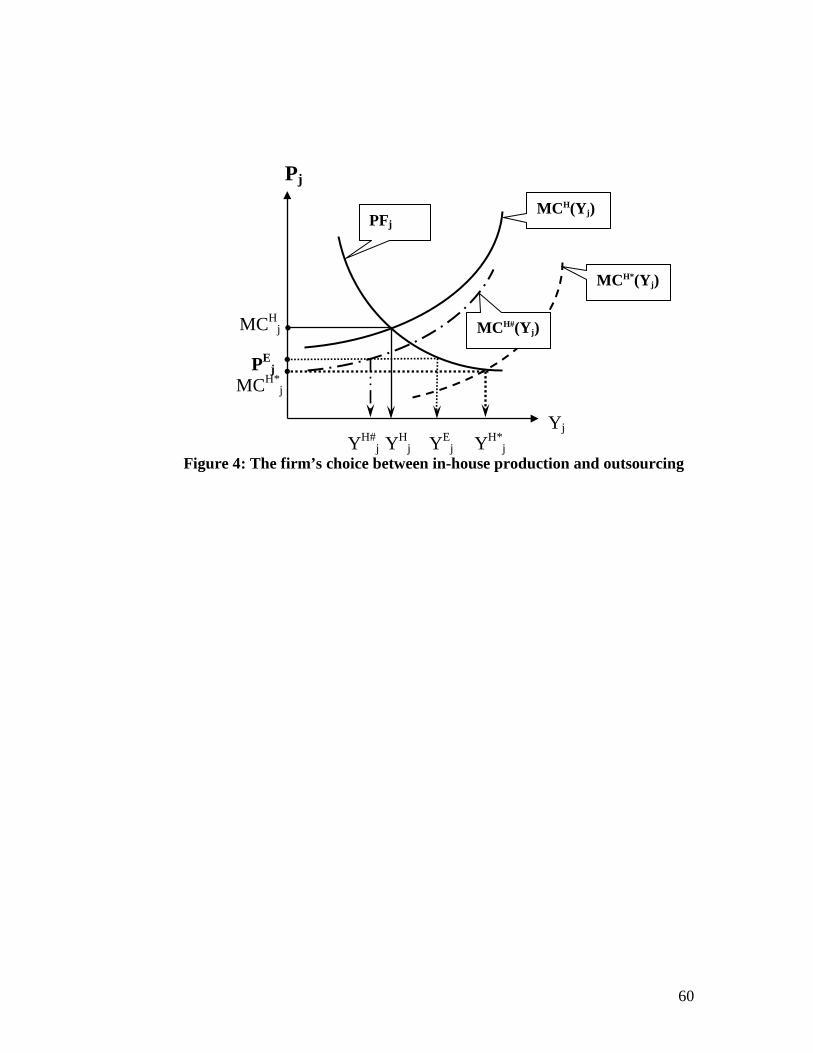
60
MCH
j PE
j MCH*
j YH#
j YHj YE
j YH*j
Figure 4: The firm’s choice between in-house production and outsourcing
MCH(Yj) PFj
MCH*(Yj)
MCH#(Yj)
Pj
Yj

61
05
101520253035
Bill
ion
US$
1990 1995 1999 2000 2001
Figure 5:External Resource Flows to Africa 1990-2001
TotalOfficialPortfolioBank LoansFDI
Source: UNCTAD, based on World Bank, 2003
Figure 6: Direct and Portfolio Investments in 25 Emerging Economies and in SSA: 1991-2000
020406080
100120140160180
1991 1993 1995 1997 1999
Emerging--FDI
Emerging-PortfolioInvestmentsSSA--FDI
Sources: J. P. Morgan and UNCTAD FDI Database