global outlook - standard life investments · global outlook february 2018 ... this means for asset...
TRANSCRIPT

Global OutlookMay 2018


Foreword
Craig HoydaSenior Quantitative Analyst, Multi-Asset Investing
If a week is a long time in politics (and a lifetime in markets) then six months can seem like an eternity. In November of 2017, we witnessed the last missile test by North Korea during its strained rhetoric with the US. In Europe, meanwhile, the looming Italian election placed political risk back on investors’ radar. Fast forward to May, and an historic summit between the US and North Korea is expected to take place; however, despite hopes of an orderly formation of an Italian government, another trip to the polls could still occur by summer. While a more benign global environment can allow investors to have some breathing space to examine macroeconomics and markets from a fundamental viewpoint, we must remember that this climate could alter quickly.
Politics and profits were major points of discussions at the recent quarterly meeting of our Global Investment Group. Andrew Milligan, Head of Global Strategy, argues that investors should pay close attention to the drivers of corporate profits. While earnings are determined by the global macroeconomic environment, changes to US tax policy, regulation and trade policy all play a supporting role.
Investors asset allocate based on their assessment of current, as well as their projection of future, economic variables that influence market fundamentals. Once their baseline view of the world has been established, they must also be cognisant that a variety of factors, such as politics, may drive economies away from their expected path. Lucy O’Carroll, Chief Economist, outlines multiple such scenarios; models their impact on our growth and inflation projections; and details the probability distribution of the direction of any shock.
Politics is a potential driver, or dampener, for markets. However, politics can be the catalyst for the efficient allocation of capital.
Andrew Allen, Head of Global Property Research and Strategy, Real Estate, examines the shortage of low-cost housing, a global issue, though the lens of the UK market. He proposes action whereby policy can encourage capital to flow into the provision of such housing.
Fundamental drivers of inflation vary across developed economies. Katy Forbes, Investment Director, Inflation-Linked Bonds, examines the outlook in the US, UK, and the Eurozone with regards to the idiosyncratic nature of inflation generation in each area, and also the expectations priced in by forward markets.
Finally, we examine the value of corporate credit as a component of the multi-asset universe in our absolute returns strategies article. Myself and Jennifer Catlow, Investment Director, Multi-Asset Investing, highlight the potential headwinds to corporate bonds in the form of an improving macroeconomic environment harming returns on fixed-rate securities, and examine pockets of value that remain within the asset class.

House View
Tensions between profits and politicsAs long as trade tensions die down, then investors should turn their attention back to favourable corporate fundamentals.
Andrew MilliganHead of Global Strategy
House View Tensions between profits and politics
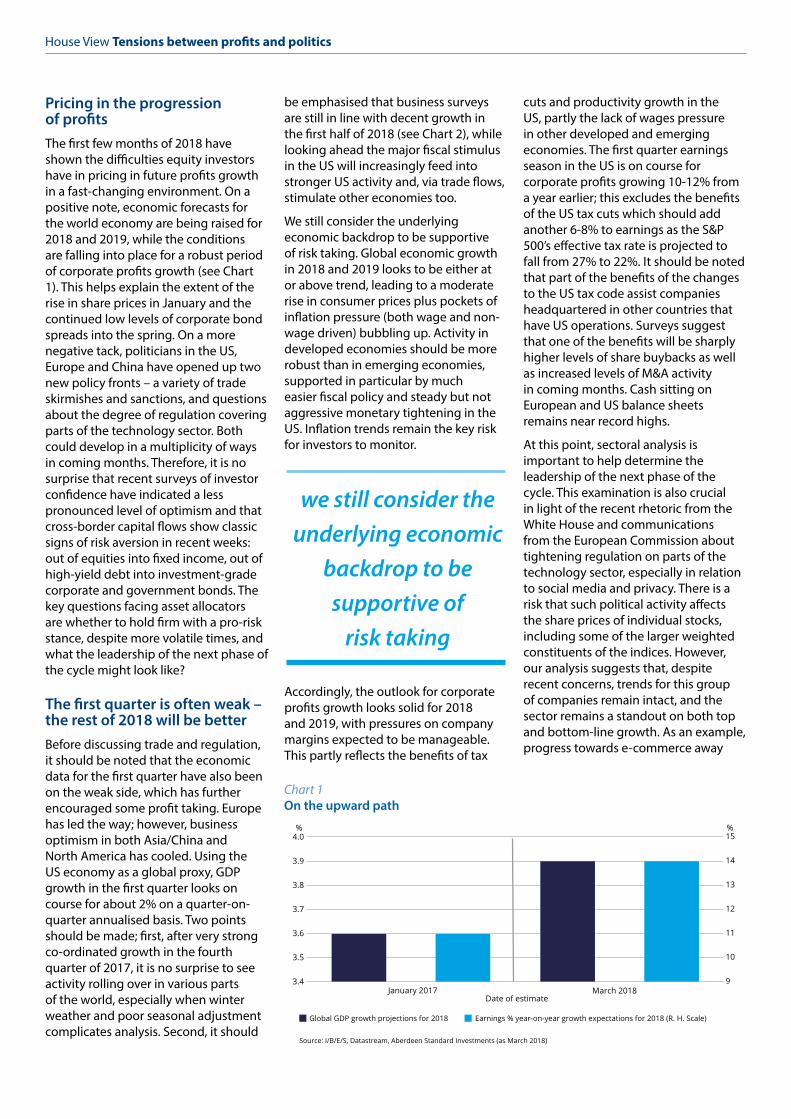
Pricing in the progression of profitsThe first few months of 2018 have shown the difficulties equity investors have in pricing in future profits growth in a fast-changing environment. On a positive note, economic forecasts for the world economy are being raised for 2018 and 2019, while the conditions are falling into place for a robust period of corporate profits growth (see Chart 1). This helps explain the extent of the rise in share prices in January and the continued low levels of corporate bond spreads into the spring. On a more negative tack, politicians in the US, Europe and China have opened up two new policy fronts – a variety of trade skirmishes and sanctions, and questions about the degree of regulation covering parts of the technology sector. Both could develop in a multiplicity of ways in coming months. Therefore, it is no surprise that recent surveys of investor confidence have indicated a less pronounced level of optimism and that cross-border capital flows show classic signs of risk aversion in recent weeks: out of equities into fixed income, out of high-yield debt into investment-grade corporate and government bonds. The key questions facing asset allocators are whether to hold firm with a pro-risk stance, despite more volatile times, and what the leadership of the next phase of the cycle might look like?
The first quarter is often weak – the rest of 2018 will be better Before discussing trade and regulation, it should be noted that the economic data for the first quarter have also been on the weak side, which has further encouraged some profit taking. Europe has led the way; however, business optimism in both Asia/China and North America has cooled. Using the US economy as a global proxy, GDP growth in the first quarter looks on course for about 2% on a quarter-on-quarter annualised basis. Two points should be made; first, after very strong co-ordinated growth in the fourth quarter of 2017, it is no surprise to see activity rolling over in various parts of the world, especially when winter weather and poor seasonal adjustment complicates analysis. Second, it should
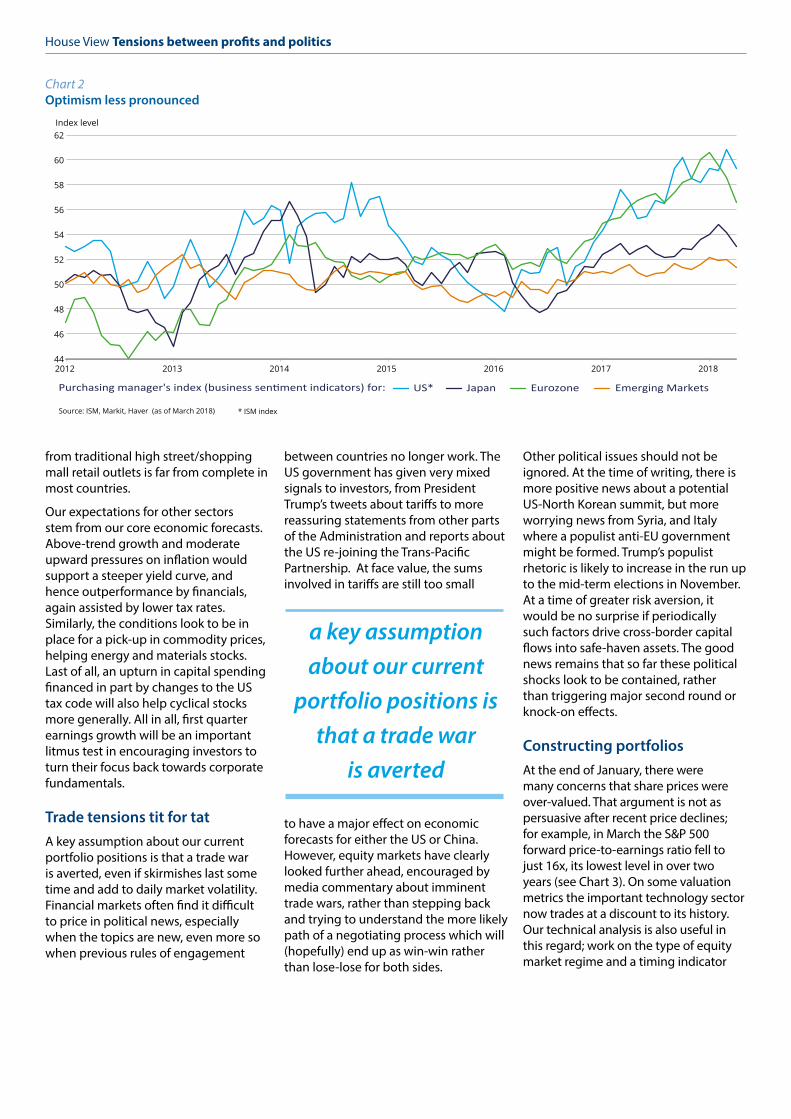
be emphasised that business surveys are still in line with decent growth in the first half of 2018 (see Chart 2), while looking ahead the major fiscal stimulus in the US will increasingly feed into stronger US activity and, via trade flows, stimulate other economies too.
We still consider the underlying economic backdrop to be supportive of risk taking. Global economic growth in 2018 and 2019 looks to be either at or above trend, leading to a moderate rise in consumer prices plus pockets of inflation pressure (both wage and non-wage driven) bubbling up. Activity in developed economies should be more robust than in emerging economies, supported in particular by much easier fiscal policy and steady but not aggressive monetary tightening in the US. Inflation trends remain the key risk for investors to monitor.
Accordingly, the outlook for corporate profits growth looks solid for 2018 and 2019, with pressures on company margins expected to be manageable. This partly reflects the benefits of tax
cuts and productivity growth in the US, partly the lack of wages pressure in other developed and emerging economies. The first quarter earnings season in the US is on course for corporate profits growing 10-12% from a year earlier; this excludes the benefits of the US tax cuts which should add another 6-8% to earnings as the S&P 500’s effective tax rate is projected to fall from 27% to 22%. It should be noted that part of the benefits of the changes to the US tax code assist companies headquartered in other countries that have US operations. Surveys suggest that one of the benefits will be sharply higher levels of share buybacks as well as increased levels of M&A activity in coming months. Cash sitting on European and US balance sheets remains near record highs.
At this point, sectoral analysis is important to help determine the leadership of the next phase of the cycle. This examination is also crucial in light of the recent rhetoric from the White House and communications from the European Commission about tightening regulation on parts of the technology sector, especially in relation to social media and privacy. There is a risk that such political activity affects the share prices of individual stocks, including some of the larger weighted constituents of the indices. However, our analysis suggests that, despite recent concerns, trends for this group of companies remain intact, and the sector remains a standout on both top and bottom-line growth. As an example, progress towards e-commerce away
we still consider the underlying economic
backdrop to be supportive of
risk taking
9
10
11
12
13
14
15
3.4
3.5
3.6
3.7
3.8
3.9
4.0
Global GDP growth projections for 2018 Earnings % year-on-year growth expectations for 2018 (R. H. Scale)
% %
January 2017 March 2018Date of estimate
Source: I/B/E/S, Datastream, Aberdeen Standard Investments (as March 2018)
Chart 1 On the upward path
from traditional high street/shopping mall retail outlets is far from complete in most countries.
Our expectations for other sectors stem from our core economic forecasts. Above-trend growth and moderate upward pressures on inflation would support a steeper yield curve, and hence outperformance by financials, again assisted by lower tax rates. Similarly, the conditions look to be in place for a pick-up in commodity prices, helping energy and materials stocks. Last of all, an upturn in capital spending financed in part by changes to the US tax code will also help cyclical stocks more generally. All in all, first quarter earnings growth will be an important litmus test in encouraging investors to turn their focus back towards corporate fundamentals.
Trade tensions tit for tat A key assumption about our current portfolio positions is that a trade war is averted, even if skirmishes last some time and add to daily market volatility. Financial markets often find it difficult to price in political news, especially when the topics are new, even more so when previous rules of engagement
between countries no longer work. The US government has given very mixed signals to investors, from President Trump’s tweets about tariffs to more reassuring statements from other parts of the Administration and reports about the US re-joining the Trans-Pacific Partnership. At face value, the sums involved in tariffs are still too small
to have a major effect on economic forecasts for either the US or China. However, equity markets have clearly looked further ahead, encouraged by media commentary about imminent trade wars, rather than stepping back and trying to understand the more likely path of a negotiating process which will (hopefully) end up as win-win rather than lose-lose for both sides.
Other political issues should not be ignored. At the time of writing, there is more positive news about a potential US-North Korean summit, but more worrying news from Syria, and Italy where a populist anti-EU government might be formed. Trump’s populist rhetoric is likely to increase in the run up to the mid-term elections in November. At a time of greater risk aversion, it would be no surprise if periodically such factors drive cross-border capital flows into safe-haven assets. The good news remains that so far these political shocks look to be contained, rather than triggering major second round or knock-on effects.
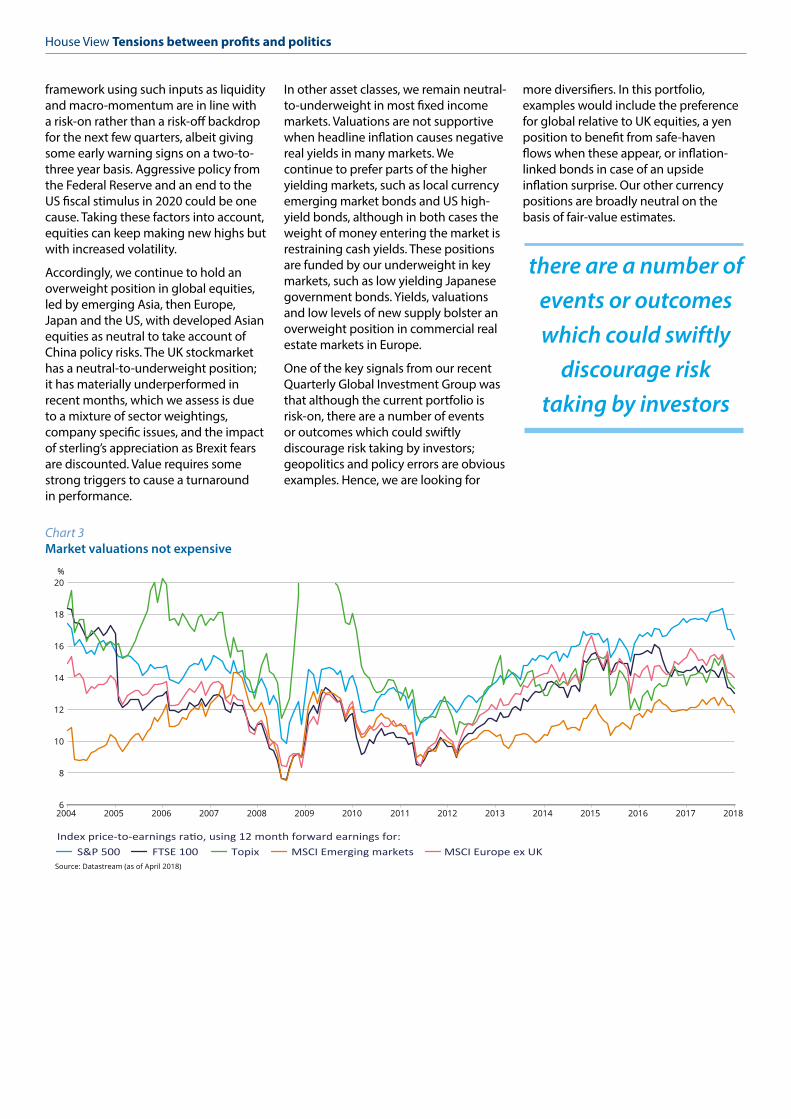
Constructing portfolios At the end of January, there were many concerns that share prices were over-valued. That argument is not as persuasive after recent price declines; for example, in March the S&P 500 forward price-to-earnings ratio fell to just 16x, its lowest level in over two years (see Chart 3). On some valuation metrics the important technology sector now trades at a discount to its history. Our technical analysis is also useful in this regard; work on the type of equity market regime and a timing indicator
House View Tensions between profits and politics
a key assumption about our current
portfolio positions is that a trade war
is averted
2012 2013 2014 2015 2016 2017 2018 44
46
48
50
52
54
56
58
60
62 Index level
US* Japan Eurozone Emerging Markets
Source: ISM, Markit, Haver (as of March 2018)
Purchasing manager's index (business sentiment indicators) for:
* ISM index
Chart 2 Optimism less pronounced
framework using such inputs as liquidity and macro-momentum are in line with a risk-on rather than a risk-off backdrop for the next few quarters, albeit giving some early warning signs on a two-to-three year basis. Aggressive policy from the Federal Reserve and an end to the US fiscal stimulus in 2020 could be one cause. Taking these factors into account, equities can keep making new highs but with increased volatility.
Accordingly, we continue to hold an overweight position in global equities, led by emerging Asia, then Europe, Japan and the US, with developed Asian equities as neutral to take account of China policy risks. The UK stockmarket has a neutral-to-underweight position; it has materially underperformed in recent months, which we assess is due to a mixture of sector weightings, company specific issues, and the impact of sterling’s appreciation as Brexit fears are discounted. Value requires some strong triggers to cause a turnaround in performance.
In other asset classes, we remain neutral-to-underweight in most fixed income markets. Valuations are not supportive when headline inflation causes negative real yields in many markets. We continue to prefer parts of the higher yielding markets, such as local currency emerging market bonds and US high-yield bonds, although in both cases the weight of money entering the market is restraining cash yields. These positions are funded by our underweight in key markets, such as low yielding Japanese government bonds. Yields, valuations and low levels of new supply bolster an overweight position in commercial real estate markets in Europe.
One of the key signals from our recent Quarterly Global Investment Group was that although the current portfolio is risk-on, there are a number of events or outcomes which could swiftly discourage risk taking by investors; geopolitics and policy errors are obvious examples. Hence, we are looking for
more diversifiers. In this portfolio, examples would include the preference for global relative to UK equities, a yen position to benefit from safe-haven flows when these appear, or inflation-linked bonds in case of an upside inflation surprise. Our other currency positions are broadly neutral on the basis of fair-value estimates.
House View Tensions between profits and politics
there are a number of events or outcomes which could swiftly
discourage risk taking by investors
2004 2005 2006 2007 2008 2009 2010 2011 2012 2013 2014 2015 2016 2017 2018 6
8
10
12
14
16
18
20
S&P 500 FTSE 100 Topix MSCI Emerging markets MSCI Europe ex UK Source: Datastream (as of April 2018)
%
Index price-to-earnings ratio, using 12 month forward earnings for:
Chart 3 Market valuations not expensive

2017 was a ‘Goldilocks’ year: combining healthy global growth, subdued inflation and cautious central banks. The consensus for 2018 so far is that Goldilocks will continue, underpinned by both the US fiscal stimulus and the benefits of a weak US dollar for emerging markets. On this basis, global GDP growth is projected to rise to 3.9%, its strongest reading since 2011..
A long goodbye to Goldilocks Over the next few years, however, we are expecting the environment to change. Growth looks set to moderate in 2019-20, as economies run up against capacity constraints; central
banks tighten monetary policy; the US fiscal boost gradually fades; and China continues to rebalance its economy towards a lower, more sustainable growth path. As spare capacity dwindles, inflation is likely to rise. In response, the US Federal Reserve could
increase interest rates once a quarter over the next year at least. Other central banks will probably be more cautious, but by the time we head into 2019 we anticipate that global asset purchase programmes, or overall quantitative easing (QE), will have reversed into gradual quantitative tightening (QT).
Testing the baseline This is our baseline view of the world economy’s path over the next few years, but that path is not guaranteed. In an uncertain world, forecasting errors are inevitable. Predictions can be knocked off course by events that are familiar but cannot necessarily be anticipated in advance, such as changes in the supply of oil, fluctuating harvests or political surprises. Projections can also go awry because of technical errors, where forecasting models exclude variables that turn out to have a strong influence on economic behaviour. Over time, we would hope to learn from such mistakes and improve accuracy – much as UK weather forecasters did after the October 1987 storms.
Other sources of forecast error are more challenging because they are, by definition, harder to assimilate. They include Nassim Nicholas Taleb’s ‘black swans’ – events that occur without precedent – and structural breaks in relationships previously treated as constants, such as that between unemployment and wage inflation.
In the aftermath of the global financial crisis, economists have put much greater effort into focusing on the risks around well-anchored and articulated baselines. Central banks, firms and investors can then explore how well policy, business and investment strategies perform across a range of potential states of the world. Where these scenarios turn out (with hindsight) to be closer to reality than baseline projections, their implications can be incorporated into future forecasts, hopefully enhancing performance.
What could go wrong with Goldilocks? Goldilocks has, so far, been supported by a substantial amount of spare capacity in the world economy. This has allowed countries to expand at an above-trend pace without triggering rising inflationary pressures. But our latest estimates of the major economies’ output gaps – the difference between actual output and its potential level – suggest these gaps are close to closure in a number of cases. So unless wage behaviour remains completely unresponsive to falling unemployment, the lack of spare capacity will begin to feed through into a higher inflation scenario. Investors may be sensitive to the risk that central banks have to tighten policy more rapidly in response, leading to a ‘tantrum’ in financial markets.
Global Spotlight
Scenarios to spoil Goldilocks’ porridge We examine our projections for the global economy with regards to shocks or events that could cause growth or inflation to differ from our baseline estimates, and their respective drivers.
Lucy O’CarrollChief Economist
the consensus for 2018 so far is that
Goldilocks will continue

However, inflation could also turn out to be weaker than anticipated in our baseline forecast, for a variety of reasons. The forces that have borne down on price pressures in recent years – including the success of central banks in anchoring wage- and price-setting behaviour close to target inflation rates - could prove to be surprisingly persistent. If so, Goldilocks’ combination of strong growth and subdued inflation could prove more durable than in our baseline – a lowflation scenario. Alternatively, productivity growth could finally rebound as the diffusion of innovation spreads across firms. Another variant could involve the synchronised
global economic upswing of the past 18 months continue virtually unabated, with a scenario where trade and investment are boosted in a non-inflationary way by expanding growth potential.
On the other hand, there are some tentative signs of growth momentum coming off the boil. Recent Eurozone purchasing managers’ index (PMI) surveys have turned down, though they remain at historically high levels. Our ‘Nowcast’ of Chinese activity – which estimates current conditions using a variety of data sources – has also dropped recently. China’s growth rate could conceivably continue to
slow more rapidly than in our baseline, now that the 19th Party Congress is out of the way and President Xi has consolidated power. Our macro-momentum indicator, which gauges the pace of economic expansion, is pointing to a similar, modestly slowing outlook at a global level.
The political context also matters. Two recent developments could have a bearing on Goldilocks’ future: the US fiscal stimulus and moves towards trade protectionism. On the former, our baseline projections assume fiscal multipliers – the ratio of the additional national income created in response to the initial boost in government
-3 -2 -1 0 1 2 3 -2.0
-1.5
-1.0
-0.5
0.0
0.5
1.0
1.5
2.0
2.5
CPI deviation (ppt)
GD
P gr
owth
dev
iatio
n (p
pt)
Source: Oxford Economics, Aberdeen Standard Investments (as of April 2018)
Tightening tantrum
Global tradewar
Lowflation
China reins in credit
Europe political risk
Productivity strikes back
High US fiscal multipliers
Trade & investment
rebound
Upturn Non-inflationary growth
Downturn Stagflation
Inflation overshoot
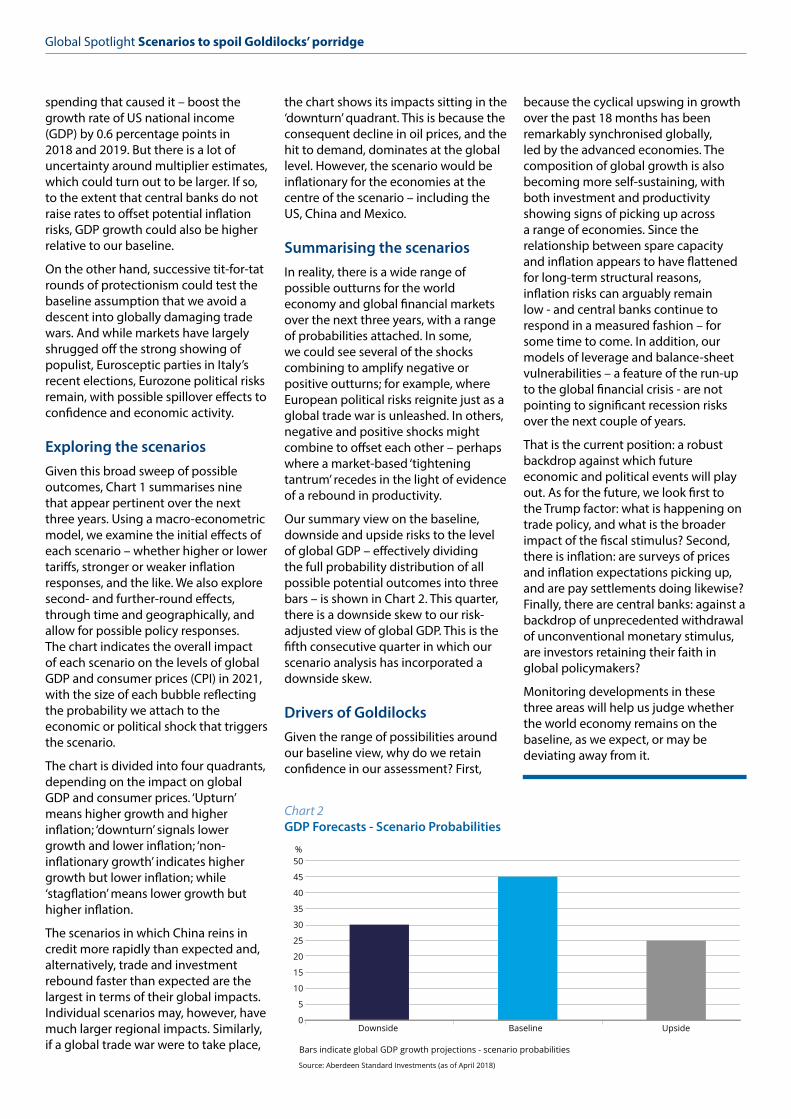
Deviation of GDP growth and CPI inflation in 2021 from baseline under various scenarios, size of bubbles indicate their probability of event
Chart 1 Differences from the baseline
spending that caused it – boost the growth rate of US national income (GDP) by 0.6 percentage points in 2018 and 2019. But there is a lot of uncertainty around multiplier estimates, which could turn out to be larger. If so, to the extent that central banks do not raise rates to offset potential inflation risks, GDP growth could also be higher relative to our baseline.
On the other hand, successive tit-for-tat rounds of protectionism could test the baseline assumption that we avoid a descent into globally damaging trade wars. And while markets have largely shrugged off the strong showing of populist, Eurosceptic parties in Italy’s recent elections, Eurozone political risks remain, with possible spillover effects to confidence and economic activity.
Exploring the scenariosGiven this broad sweep of possible outcomes, Chart 1 summarises nine that appear pertinent over the next three years. Using a macro-econometric model, we examine the initial effects of each scenario – whether higher or lower tariffs, stronger or weaker inflation responses, and the like. We also explore second- and further-round effects, through time and geographically, and allow for possible policy responses. The chart indicates the overall impact of each scenario on the levels of global GDP and consumer prices (CPI) in 2021, with the size of each bubble reflecting the probability we attach to the economic or political shock that triggers the scenario.
The chart is divided into four quadrants, depending on the impact on global GDP and consumer prices. ‘Upturn’ means higher growth and higher inflation; ‘downturn’ signals lower growth and lower inflation; ‘non-inflationary growth’ indicates higher growth but lower inflation; while ‘stagflation’ means lower growth but higher inflation.
The scenarios in which China reins in credit more rapidly than expected and, alternatively, trade and investment rebound faster than expected are the largest in terms of their global impacts. Individual scenarios may, however, have much larger regional impacts. Similarly, if a global trade war were to take place,
the chart shows its impacts sitting in the ‘downturn’ quadrant. This is because the consequent decline in oil prices, and the hit to demand, dominates at the global level. However, the scenario would be inflationary for the economies at the centre of the scenario – including the US, China and Mexico.
Summarising the scenariosIn reality, there is a wide range of possible outturns for the world economy and global financial markets over the next three years, with a range of probabilities attached. In some, we could see several of the shocks combining to amplify negative or positive outturns; for example, where European political risks reignite just as a global trade war is unleashed. In others, negative and positive shocks might combine to offset each other – perhaps where a market-based ‘tightening tantrum’ recedes in the light of evidence of a rebound in productivity.
Our summary view on the baseline, downside and upside risks to the level of global GDP – effectively dividing the full probability distribution of all possible potential outcomes into three bars – is shown in Chart 2. This quarter, there is a downside skew to our risk-adjusted view of global GDP. This is the fifth consecutive quarter in which our scenario analysis has incorporated a downside skew.
Drivers of GoldilocksGiven the range of possibilities around our baseline view, why do we retain confidence in our assessment? First,
because the cyclical upswing in growth over the past 18 months has been remarkably synchronised globally, led by the advanced economies. The composition of global growth is also becoming more self-sustaining, with both investment and productivity showing signs of picking up across a range of economies. Since the relationship between spare capacity and inflation appears to have flattened for long-term structural reasons, inflation risks can arguably remain low - and central banks continue to respond in a measured fashion – for some time to come. In addition, our models of leverage and balance-sheet vulnerabilities – a feature of the run-up to the global financial crisis - are not pointing to significant recession risks over the next couple of years.
That is the current position: a robust backdrop against which future economic and political events will play out. As for the future, we look first to the Trump factor: what is happening on trade policy, and what is the broader impact of the fiscal stimulus? Second, there is inflation: are surveys of prices and inflation expectations picking up, and are pay settlements doing likewise? Finally, there are central banks: against a backdrop of unprecedented withdrawal of unconventional monetary stimulus, are investors retaining their faith in global policymakers?
Monitoring developments in these three areas will help us judge whether the world economy remains on the baseline, as we expect, or may be deviating away from it.
Global Spotlight Scenarios to spoil Goldilocks’ porridge
Downside Baseline Upside 0
5
10
15
20
25
30
35
40
45
50 %
Source: Aberdeen Standard Investments (as of April 2018)
Bars indicate global GDP growth projections - scenario probabilities
Chart 2 GDP Forecasts - Scenario Probabilities


In recent months we have observed continued strong global growth, progress on US tax plans amid a broader fiscal stimulus, and indications that business investment will increase. Coupled with this, commodity prices have also pushed higher. This is all helping to lift headline inflation across the globe but the speed of recovery in underlying inflation varies significantly between different geographies. Accordingly, our portfolio positions vary between markets.
A little discretion The US is in an advanced stage of recovery and moderate inflation pressures are evident. Higher US rates are a headwind to US inflation but the gradual, well-telegraphed nature of hikes has not placed undue downward pressure on consumer prices. Six-month annualised core US CPI is now a strong 2.6% per annum and above headline CPI at 2.4%. The shorter-term measure is consistent with core personal consumption expenditures (PCE) inflation slightly above the Federal Reserve’s (Fed) 2% target. The increase has been broad-based across non-discretionary inflation items, such as food, medical services, transportation and education services, while shelter inflation has remained strong. Wages are increasing slowly and the trade-weighted US dollar is down over 10%
from early 2017. Combined with looser fiscal policy, the potential for tariffs and higher commodity prices, this suggests that the uplift in US inflation can be sustained for now.
However, we do have lingering concerns regarding the longevity of this uplift on a longer horizon, in the absence of major shocks, such as a trade war. The inflationary pressures outlined above are, to some extent, either prescriptive in nature, whereby consumers have little choice but to pay the higher prices, or are the results of a depreciating US dollar which have a transitory impact. The lack of participation from most discretionary inflation items, such as furniture, vehicles and recreation, is acting as a drag on the headline number and is particularly concerning in the context of a steadily declining savings rate among US consumers. This can be observed in Chart 1 where discretionary inflation has been around zero for several years now. It is likely that technological drivers play a role here alongside the very long-term drivers of globalisation and demographics, potentially limiting the extent of future increases in US inflation.
Market pricing has returned to the levels observed in the aftermath of the 2016 election. Breakeven yields have risen as macroeconomic improvements have outweighed the drag on inflation from
tighter monetary policy. The 5-year forward 5-year inflation swap rate of 2.4% is consistent with the Fed attaining its core PCE target, but levels are below their historic average and very little term premium is factored into the inflation swap curve. We are therefore long US inflation in portfolios.
Core EuropeIn Europe the landscape is different. The European Central Bank (ECB) is transitioning between quantitative easing and tapering, but rate hikes are not anticipated imminently. Growth is strong and inflation is expected to rise but at a fairly slow pace. Core inflation is still only around the 1% level and has printed in a range of 0.6% to 1.2% per annum since April 2013. We do not envisage a sudden breakout to the upside despite the better-than-anticipated growth data and apparent optimism surrounding the region.
High unemployment and labour market slack are important for the inflation outlook in Europe. The IG Metall and public sector pay settlements are being seen as evidence that wage growth is materialising. However, we are not of that opinion: corporate desire to maintain competitiveness by keeping labour costs low and the ease of moving production to Central and Eastern European countries puts
Katy Forbes Investment Director, Inflation-Linked Bonds
Inflation-Linked Bonds Multi-speed inflation We examine the inflation outlook in major developed markets and the implication for inflation-related bond markets.

downward pressure on wage demands from labour unions. The recent oil price move will be supportive for European inflation but euro appreciation broadly offsets this. The ECB has made reference to the influence a stronger currency potentially has on the macroeconomic environment and our opinion is that continued strength may have some bearing on its policy outlook.
All in all, markets are pricing in inflation to return to ‘close to but below 2%’ over the medium term. The long end of the market is pricing in above target inflation, and therefore we are positioned short in portfolios.
Britain is an islandIn the UK the story is different again. Data have held up relatively well and the Bank of England revised up its growth forecasts in February although potential growth is still viewed to be just 1.5% per annum. UK inflation has been elevated but has now started to turn down as past currency effects, which have driven goods prices up with little impact on services, are starting to fade. Despite the recent downward path for UK inflation, the Bank of England Monetary Policy Committee has focused on the positive data as the justification for tighter policy, while recognising that as the implications of Brexit become clearer, it will need
to be pragmatic in its approach. On the basis of its current policy stance, however, we believe higher rates are likely to lead inflation back to target sooner rather than later. We view UK inflation as optimistically priced given we expect it to decline sharply as past currency effects fade, and as such, we are positioned short in portfolios.
The overall picture is one of inflation rising (except in the UK) at different speeds across the globe but nowhere so fast that policy will need to adjust rapidly. We still see value in US inflation relative to Europe given recent momentum and currency movements.
2005 2006 2007 2008 2009 2010 2011 2012 2013 2014 2015 2016 2017 -1.0
-0.5
0.0
0.5
1.0
1.5
2.0
2.5
3.0
3.5
4.0
4.5 %
Discretionary Inflation Non Discretionary Inflation
Source: US Bureau of Labor Statistics, UBS (as of February 2018)
US inflation components:
Chart 1 Little discretion in inflation

On the lookout for jagged rocksThe credit ship sailed through 2017 with modest positive total returns in both the investment grade and high-yield universes. Navigation through 2018 is proving more turbulent, as a volatility spike with an epicentre in equity markets reverberated through to negative returns in credit. Fundamentals are no source for alarm as increasing leverage levels are offset by a healthy macroeconomic environment, yet this backdrop itself is not favourable: rising interest rates and a pickup in inflation are both headwinds for fixed-rate instruments, while spreads over government bonds are historically unattractive. We identify two strategies which in varying ways can benefit from a solid macro environment and allow investors to pick up extra yield versus investment grade and high-yield bonds.
ABSolutely fabulousOne such source is AA rated sterling-denominated floating-rate asset-backed securities (ABS). These have had negative connotations with investors since the financial crisis. This has been in part due to the complexity of their structure and their (lack of ) liquidity, and partly because the regulatory regime implemented in the interim
period has imposed punishing capital charges against holding the securities for institutional investors. These factors have led to banks and asset management firms dominating the investor base.
However, the changing market environment makes holding these securities attractive once again. Monetary conditions are supportive: as floating-rate bonds, their coupons will rise in line with interest rates - our economists expect the Bank of England to hike interest rates three times by the end of 2019 - and the securities currently offer an attractive yield versus similarly rated investment-grade corporate and government bonds. A supportive macroeconomic environment also reduces default risk in the underlying securities.
Importantly, behavioural biases against holding ABS are now ebbing. The European Central Bank’s buying of euro-denominated ABS has given the asset class street credibility, and the resulting shortage in supply can encourage investors to switch demand to sterling-denominated assets. The regulatory burden is also under review: the European Securities and Markets Authority is examining securitisation requirements, while in the UK the
Financial Conduct Authority is due to make recommendations regarding ABS origination in the auto sector, which we anticipate providing a more favourable report on the practice. These factors are a step in the right direction of reducing the cost of holding ABS on balance sheets.
A supportive macroeconomic environment is also beneficial for assets lower down the capital structure, for which a higher premium must be demanded to relative to the risk of holding them. Examining so-called ‘fallen angels’ is one such strategy in this area.
Catching a fallen angelFallen angels are bonds within an investment-grade universe that have their credit rating downgraded to high yield status; as a result these bonds are generally excluded from investment-grade indices at the next index rebalance. Due to reasons such as mandate requirements that constrain the holding of non-investment grade securities, and capital charges imposed by regulation on insurance companies holding high-yield bonds, many institutional investors are required to sell these bonds if they are holding them as part of their investment-grade allocation.
Jennifer CatlowInvestment Director, Multi-Asset Investing
Craig HoydaSenior Quantitative Analyst, Multi-Asset Investing
Absolute Returns Angels and ABSolute returns Corporate bonds face a more challenging environment in 2018; however, even with a supportive macroeconomic and rising interest rate backdrop there are still pockets of value to be found.
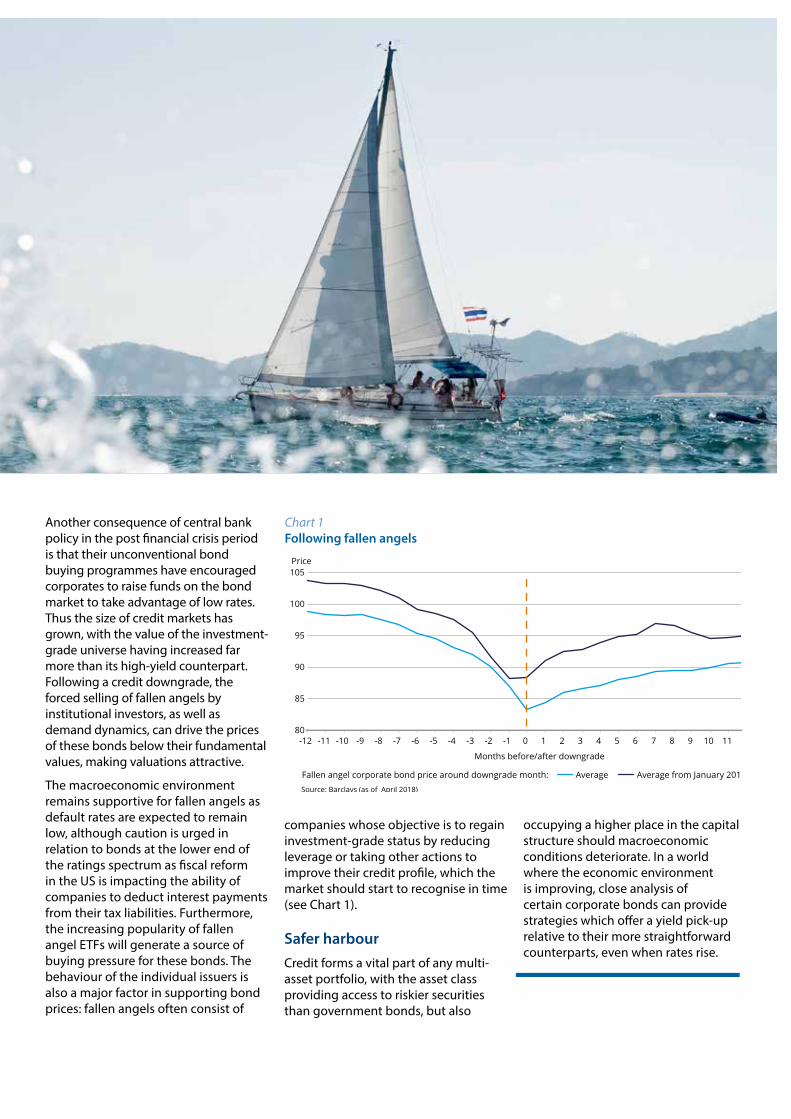
Another consequence of central bank policy in the post financial crisis period is that their unconventional bond buying programmes have encouraged corporates to raise funds on the bond market to take advantage of low rates. Thus the size of credit markets has grown, with the value of the investment-grade universe having increased far more than its high-yield counterpart. Following a credit downgrade, the forced selling of fallen angels by institutional investors, as well as demand dynamics, can drive the prices of these bonds below their fundamental values, making valuations attractive.
The macroeconomic environment remains supportive for fallen angels as default rates are expected to remain low, although caution is urged in relation to bonds at the lower end of the ratings spectrum as fiscal reform in the US is impacting the ability of companies to deduct interest payments from their tax liabilities. Furthermore, the increasing popularity of fallen angel ETFs will generate a source of buying pressure for these bonds. The behaviour of the individual issuers is also a major factor in supporting bond prices: fallen angels often consist of
companies whose objective is to regain investment-grade status by reducing leverage or taking other actions to improve their credit profile, which the market should start to recognise in time (see Chart 1).
Safer harbourCredit forms a vital part of any multi-asset portfolio, with the asset class providing access to riskier securities than government bonds, but also
occupying a higher place in the capital structure should macroeconomic conditions deteriorate. In a world where the economic environment is improving, close analysis of certain corporate bonds can provide strategies which offer a yield pick-up relative to their more straightforward counterparts, even when rates rise.
-12 -11 -10 -9 -8 -7 -6 -5 -4 -3 -2 -1 0 1 2 3 4 5 6 7 8 9 10 11 12 80
85
90
95
100
105
Average Average from January 2012 Source: Barclays (as of April 2018)
Price
Fallen angel corporate bond price around downgrade month:
Months before/after downgrade
Chart 1 Following fallen angels

The problem of low-cost housingThe shortage of low-cost housing is an issue of global relevance, and one which is garnering more attention. Resolution of the problem would be hugely rewarding for resident populations of towns and cities, for social cohesion and economic productivity, and could also potentially help meet the return requirements of long-term investors. In this article, we highlight the issues around low-cost housing and explore a potential resolution to the current shortage, using the UK as an example. We also look to encourage further debate given solutions could be led by the investment community.
Lack of living spaceThere are few, if any, major cities that can be identified as having a surplus of suitable low-cost accommodation. We see the same issue in cities from North America through Europe to Asia. Not only is the provision of low-cost housing insufficient in terms of the number of homes being built, but also in the type of homes being built (see Chart 1). While the number of new dwellings across all tenures has been in decline since the mid-1970s, low-cost housing now accounts for less than 15% of new
dwellings compared with nearly 25% in 1991. The scope of the problem implies that any resolution should embrace investment on a considerable scale, probably from sources not typically associated with the sector.
Concurrently, we see large pools of pension fund and insurance company capital searching for long-term investments that can provide stable incomes to meet their long-term liabilities. Our experience of managing rented residential properties across Europe suggests they can provide stable and durable incomes. Residential tenants in Germany typically stay for between eight-to-ten years. Not only are there benefits from residents seeing their apartment as a home, but also this longer duration of stay assists with operational management efficiency as well as a better rental structure.
The rule of three However, in considering the problem and proposing a solution, we must also bring into scope a pool of rental property operators, such as housing associations and local authorities, which has experience in managing low-cost housing on a day-to-day basis. These groups have a key role to play: operators with the experience of
managing properties, seeking to bolster or diversify their sources of capital, can be matched with investors who need to deploy capital but who lack the experience of managing such assets. These so-called ‘asset light’ models are well established in other UK real estate sectors, such as hotels, supermarkets and student housing.
The conversation must also include the government, in order to facilitate and provide the public policy framework to make the requisite progress. Housing policies that are bias towards a private-ownership model have philosophical merits but can inflate pricing and further exaggerate the issues for those in need of low-cost housing. The economics of constructing and managing lower-cost housing imply that some form of government subsidy may be required, but the current UK housing benefit budget is £28 billion. The increasing relevance of the topic to voters may help them to convince policymakers of the merits of more action.
Building a solutionSuch government support could take the form of selling part of the public estate of land. The windfall gains from such sales and the subsequent impact on government finances certainly need
Andrew AllenGlobal Head of Investment Research, Real Estate
Real Estate
The importance of solving a global low-cost housing problemThe shortage of low-cost housing is an issue of global relevance, which potentially could be solved by tapping into large pools of investor capital.

to be considered, but a worthwhile compromise may be found between the cost of the land versus the value of the solution.
The residential units would be purpose-built blocks, using modern construction techniques. As they would be permanently for rent, not subject to disaggregation through schemes which permit private ownership, this would lead to real economies of scale. This is demonstrated by our experience of managing entire blocks of flats as German residential investments. Nor would it be in the interests of long-term investors to break up the residential
blocks, as such housing can more easily be managed for its long-term income, ensuring a large pool of prospective investors. It should be noted that that UK real estate has already attracted US, Canadian and Dutch capital, all markets where institutional residential rental models are more advanced.
Finance for such investment could involve a variety of approaches. One might be a form of private markets model. As an example, capital from pension funds and insurance companies could be used to finance diversified purchases of residential blocks from housing associations, who continue to manage the tenants, with the rental
income (on an inflation-plus basis) returned to the long-term investor over a 10-15 year period. Others could involve more use of debt; for example, along the lines of infrastructure debt.
The issues are necessarily complex and there is no ‘one size fits all’ solution. However, real estate managers, long-term capital owners, housing associations, local and central government could profitably combine their resources to engage in a potential solution to a long-standing problem in the housing sector in the UK and many other countries. In our opinion, it time to open this debate and work towards mutually beneficial solutions.
1978 1982 1986 1990 1994 1998 2002 2006 2010 2014 0
50
100
150
200
250
300
350
Private Enterprise Housing Associations Local Authorities Housing TargetSource: Ministry of Housing, Communities & Local Government (as of Q4 2017)
Thousands
UK new build completions by source:
Chart 1 Not building up to target

About Aberdeen Standard InvestmentsAberdeen Standard Investments is a leading global asset manager dedicated to creating long-term value for clients. To achieve this, we offer a comprehensive range of investment capabilities, as well as the highest levels of service.
Overall, we manage £583 billion* on behalf of clients in 80 countries. In managing these assets, we employ over 1,000 investment professionals and provide client support from 50 client relationship offices globally.
The Aberdeen Standard Investments brand was created in connection with the merger of Aberdeen Asset Management PLC and Standard Life Plc on 14 August 2017 to form Standard Life Aberdeen plc.
*Standard Life AUM/AUA data as at 30 June 2017, Aberdeen Asset Management AUM data as at 31 March 2017, all other data as at 30 June 2017
Our industry-leading publicationsOur global strategists combine valuable experience, thorough research and analysis to tackle major issues of the moment.
To provide first-hand insight into the issues that are currently driving markets, we produce a series of flagship publications.
Publications
Weekly Economic Briefing
A regular analysis of major cyclical developments and structural themes in leading advanced and emerging economies.
Thinking Aloud
Opinion, thoughts and insight on the economic and market developments affecting investors.
Global Outlook
A monthly publication which includes a series of articles that examine investment trends and developments in each of the major asset classes, rotating between macro, country and sector or company-specific insights.
Global Horizons
An occasional report that captures the in-depth research of longer-term themes. We also periodically examine the major changes that are likely to influence financial markets in the coming years.
Long-Term Investment Outlook & Strategic Asset Allocation
A regular update of our in-depth analysis of long-term investment returns across a wide range of asset classes and different time periods, including suggestions for the strategic asset allocation implications for clients.

Important information Investors should be aware that past performance is not a guide to future results. The value of investments, and the income from them, can go down as well as up and investors may get back less than the amount invested.
Aberdeen Standard Investments is a brand of the investment businesses of Aberdeen Asset Management and Standard Life Investments.
This document should not be considered as an offer, investment recommendation, or solicitation, to deal in any investments or funds mentioned herein and does not constitute investment research. Aberdeen Standard Investments does not warrant the accuracy, adequacy or completeness of the information and materials contained in this document and expressly disclaims liability for errors or omissions in such information and materials.
Any research or analysis used in the preparation of this document has been procured by Aberdeen Standard Investments for its own use and may have been acted on for its own purpose. The results thus obtained are made available only coincidentally and the information is not guaranteed as to its accuracy. Some of the information in this document may contain projections or other forward looking statements regarding future events or future financial performance of countries, markets or companies. These statements are only predictions and actual events or results may differ materially.
All information, opinions and estimates in this document are those of Aberdeen Standard Investments, and constitute our best judgement as of the date indicated and may be superseded by subsequent market events or other reasons. Aberdeen Standard Investments reserves the right to make changes and corrections to any information in this document at any time, without notice.
The reader must make their own assessment of the relevance, accuracy and adequacy of the information contained in this document and make such independent investigations, as they may consider necessary or appropriate for the purpose of such assessment. This material serves to provide general information and is not meant to be investment, legal or tax advice for any particular investor. No warranty whatsoever is given and no liability whatsoever is accepted for any loss arising whether directly or indirectly as a result of the reader, any person or group of persons acting on any information, opinion or estimate contained in this document.
This material is not to be reproduced in whole or in part without the prior written consent of Aberdeen Standard Investments.
Any data contained herein which is attributed to a third party (“Third Party Data”) is the property of (a) third party supplier(s) (the “Owner”) and is licensed for use by Standard Life Aberdeen**. Third Party Data may not be copied or distributed. Third Party Data is provided “as is” and is not warranted to be accurate, complete or timely. To the extent permitted by applicable law, none of the Owner, Standard Life Aberdeen** or any other third party (including any third party involved in providing and/or compiling Third Party Data) shall have any liability for Third Party Data or for any use made of Third Party Data. Past performance is no guarantee of future results. Neither the Owner nor any other third party sponsors, endorses or promotes the fund or product to which Third Party Data relates.
**Standard Life Aberdeen means the relevant member of Standard Life Aberdeen group, being Standard Life Aberdeen plc together with its subsidiaries, subsidiary undertakings and associated companies (whether direct or indirect) from time to time
Risks of investing:This document is not a complete list or explanation of the risks involved and investors should read the relevant offering documents and consult with their own advisors before investing.
This document is available for distribution by the following Aberdeen Asset Management affiliates in the relevant countries:
In the United States, Aberdeen Standard Investments™ is the marketing name for the following affiliated, registered investment advisers: Aberdeen Asset Management Inc., Aberdeen Asset Managers Ltd, Aberdeen Asset Management Ltd, Aberdeen Asset Management Asia Ltd and Aberdeen Capital Management, LLC.
Aberdeen Standard Investments™ is the marketing name in Canada for the following affiliated registered entities: Aberdeen Asset Management Inc., Aberdeen Fund Distributors, LLC, and Aberdeen Asset Management Canada Limited. Aberdeen Asset Management Inc. is registered as a Portfolio Manager in the Canadian provinces of Ontario, New Brunswick, and Nova Scotia and as an Investment Fund Manager in the provinces of Ontario, Quebec, and Newfoundland and Labrador. Aberdeen Asset Management Canada Limited is registered as a Portfolio Manager in the province of Ontario. Aberdeen Fund Distributors, LLC, operates as an Exempt Market Dealer in all provinces and territories of Canada.
Aberdeen Standard Investments™ is the marketing name in Brazil for Aberdeen Asset Management Inc. and Aberdeen do Brasil Gestão de Recursos Ltda. Aberdeen do Brasil Gestão de Recursos Ltda. is an entity duly registered with CVM as an investment manager.
United Kingdom, Norway, South Africa and EU Countries by Aberdeen Asset Managers Limited. Authorised and regulated by the Financial Conduct Authority in the United Kingdom. Registered Office: 10 Queen’s Terrace, Aberdeen AB10 1YG. Registered in Scotland No. 108419.
Switzerland by Aberdeen Asset Managers Switzerland AG (AAMS).Registered in Switzerland No. CH-020.3.033.962-7. Registered Office: Schweizergasse 14, 8001 Zurich. Authorised by the Swiss Financial Market Supervisory Authority (FINMA).

Aberdeen Asset Managers Limited (AAML) holds a Category I financial services provider (FSP) licence in terms of the Financial Advisory and Intermediary Services Act, 2002, (FAIS) under licence 43675 and also holds professional Indemnity Insurance. The FSP licence entitles AAML to provide “intermediary services” (as defined in FAIS) to South African clients in relation to shares; money market instruments; debentures and securitised debt; warrants, certificates and other instruments; derivative instruments; participatory interests in Collective Investment Schemes; foreign currency denominated investment instruments; long-term deposits; and short-term deposits.
Abu Dhabi Global Market (“ADGM”) by Aberdeen Asset Middle East Limited. Regulated by the ADGM Financial Services Regulatory Authority. Aberdeen Asset Middle East Limited, Al Sila Tower, 24th Floor, Abu Dhabi Global Market Square, Al Maryah Island, PO Box 5100737, Abu Dhabi, United Arab Emirates.
Singapore by Aberdeen Asset Management Asia Limited, Registration Number 199105448E.
Hong Kong by Aberdeen International Fund Managers Limited. This document has not been reviewed by the Securities and Futures Commission.
The People’s Republic of China (“PRC”) by Aberdeen Asset Management (Shanghai) Co., Ltd in the PRC only.
Australia and New Zealand by Aberdeen Asset Management Limited ABN 59 002 123 364, AFSL No. 240263. In New Zealand to wholesale investors only as defined in the Financial Markets Conduct Act 2013 (New Zealand).
Malaysia by Aberdeen Asset Management Sdn Bhd, Company Number: 690313-D and Aberdeen Islamic Asset Management Sdn Bhd, Company Number: 827342-W.
Thailand by Aberdeen Asset Management Company Limited.
Japan by Aberdeen Standard Investments (Japan) Limited
Taiwan by Aberdeen International Securities Investment Consulting Company Ltd (101Jin-Guan-Tou-Gu-Xin-Zi-Di No.33), which is operated independently, 8F, No.101, Songren Rd., Taipei City, Taiwan, Republic of China Tel: +886 2 87224500.
This document is available for distribution by the following Standard Life Investments companies:
Standard Life Investments Limited is registered in Scotland (SC123321) at 1 George Street, Edinburgh EH2 2LL. Standard Life Investments Limited is authorised and regulated in the UK by the Financial Conduct Authority.
Standard Life Investments (Hong Kong) Limited is licensed with and regulated by the Securities and Futures Commission in Hong Kong and is a wholly-owned subsidiary of Standard Life Investments Limited.
Standard Life Investments Limited (ABN 36 142 665 227) is incorporated in Scotland (No. SC123321) and is exempt from the requirement to hold an Australian financial services licence under paragraph 911A(2)(l) of the Corporations Act 2001 (Cth) (the ‘Act’) in respect of the provision of financial services as defined in Schedule A of the relief instrument no.10/0264 dated 9 April 2010 issued to Standard Life Investments Limited by the Australian Securities and Investments Commission. These financial services are provided only to wholesale clients as defined in subsection 761G(7) of the Act. Standard Life Investments Limited is authorised and regulated in the United Kingdom by the Financial Conduct Authority under the laws of the United Kingdom, which differ from Australian laws.
Standard Life Investments Limited, a company registered in Ireland (904256) 90 St Stephen’s Green Dublin 2, is authorised and regulated in the UK by the Financial Conduct Authority.
Standard Life Investments (USA) Limited is registered as an Exempt Market Dealer with the Ontario Securities Commission and as an Investment Adviser with the US Securities and Exchange Commission. Standard Life Investments (Corporate Funds) Limited is registered as an Investment Adviser with the US Securities and Exchange Commission.
Standard Life Investments (Singapore) Pte. Ltd is regulated by the Monetary Authority of Singapore and licensed under the Securities and Futures Act (License No.: CMS100581-1), and is a wholly-owned subsidiary of Standard Life Investments Limited.
Investment involves risk. The value of investments, and the income from them, can go down as well as up and an investor may get back less than the amount invested. Past performance is not a guide to future results.
Aberdeen Standard Investments is a brand of the investment businesses of Aberdeen Asset Management and Standard Life Investments.
Visit us online
aberdeenstandard.comGB-301017-50078-2 ASI_0066_Global Outlook_May_TCM