global office highlights 2nd half 2011
TRANSCRIPT
7/31/2019 Global Office Highlights 2nd Half 2011
http://slidepdf.com/reader/full/global-office-highlights-2nd-half-2011 1/6
HIGHLIGHTSGLOBAL OFFICE
WWW.COLLIERS.COM
SECOND HALF 2011 | OFFICE
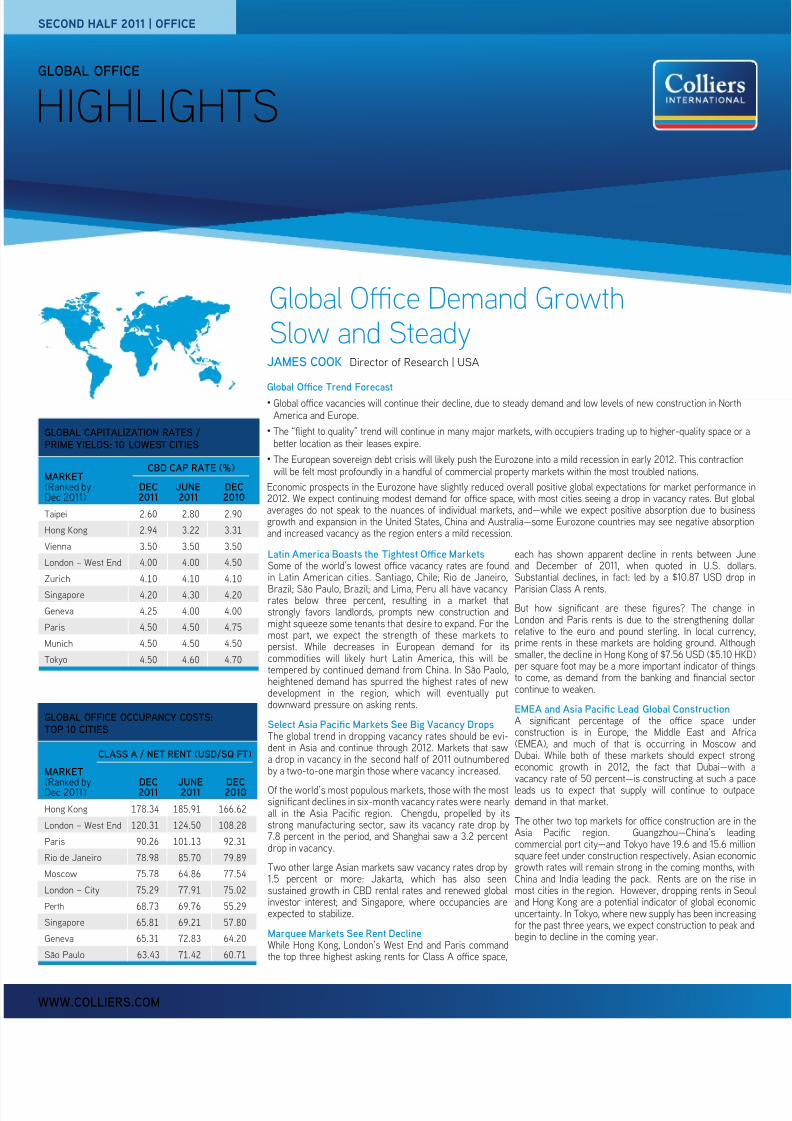
JAMES COOK Director o Research | USA
Global Oce Trend Forecast
•Global oce vacancies will continue their decline, due to steady demand and low levels o new construction in NorthAmerica and Europe.
•The “ight to quality” trend will continue in many major markets, with occupiers trading up to higher-quality space orbetter location as their leases expire.
•The European sovereign debt crisis will likely push the Eurozone into a mild recession in early 2012. This contractionwill be elt most prooundly in a handul o commercial property markets within the most troubled nations.
Economic prospects in the Eurozone have slightly reduced overall positive global expectations or market perormance2012. We expect continuing modest demand or oce space, with most cities seeing a drop in vacancy rates. But gloaverages do not speak to the nuances o individual markets, and—while we expect positive absorption due to busingrowth and expansion in the United States, China and Australia—some Eurozone countries may see negative absorptand increased vacancy as the region enters a mild recession.
Global Ofce Demand GrowthSlow and Steady
GLOBAL CAPITALIZATION RATES /PRIME YIELDS: 10 LOWEST CITIES
MARKET(Ranked byDec )
DEC2011
JUNE2011
DEC2010
Taipei 2.60 2.80 2.90
Hong Kong 2.94 3.22 3.31
Vienna 3.50 3.50 3.50
London – West End 4.00 4.00 4.50
Zurich 4.10 4.10 4.10
Singapore 4.20 4.30 4.20
Geneva 4.25 4.00 4.00
Paris 4.50 4.50 4.75
Munich 4.50 4.50 4.50
Tokyo 4.50 4.60 4.70
GLOBAL OFFICE OCCUPANCY COSTS:TOP 10 CITIES
MARKET
(Ranked byDec ) DEC2011 JUNE2011 DEC2010
Hong Kong 178.34 185.91 166.62
London – West End 120.31 124.50 108.28
Paris 90.26 101.13 92.31
Rio de Janeiro 78.98 85.70 79.89
Moscow 75.78 64.86 77.54
London – City 75.29 77.91 75.02
Perth 68.73 69.76 55.29
Singapore 65.81 69.21 57.80
Geneva 65.31 72.83 64.20
São Paulo 63.43 71.42 60.71
CBD CAP RATE (%)
Latin America Boasts the Tightest Oce MarketsSome o the world’s lowest oce vacancy rates are oundin Latin American cities. Santiago, Chile; Rio de Janeiro,
Brazil; São Paulo, Brazil; and Lima, Peru all have vacancyrates below three percent, resulting in a market thatstrongly avors landlords, prompts new construction andmight squeeze some tenants that desire to expand. For themost part, we expect the strength o these markets topersist. While decreases in European demand or itscommodities will likely hurt Latin America, this will betempered by continued demand rom China. In São Paolo,heightened demand has spurred the highest rates o newdevelopment in the region, which will eventually putdownward pressure on asking rents.
Select Asia Pacic Markets See Big Vacancy DropsThe global trend in dropping vacancy rates should be evi-dent in Asia and continue through 2012. Markets that sawa drop in vacancy in the second hal o 2011 outnumberedby a two-to-one margin those where vacancy increased.
O the world’s most populous markets, those with the mostsignifcant declines in six-month vacancy rates were nearlyall in the Asia Pacifc region. Chengdu, propelled by itsstrong manuacturing sector, saw its vacancy rate drop by7.8 percent in the period, and Shanghai saw a 3.2 percentdrop in vacancy.
Two other large Asian markets saw vacancy rates drop by1.5 percent or more: Jakarta, which has also seensustained growth in CBD rental rates and renewed globalinvestor interest; and Singapore, where occupancies areexpected to stabilize.
Marquee Markets See Rent DeclineWhile Hong Kong, London’s West End and Paris commandthe top three highest asking rents or Class A oce space,
each has shown apparent decline in rents between Jand December o 2011, when quoted in U.S. dollSubstantial declines, in act: led by a $10.87 USD drop
Parisian Class A rents.
But how signifcant are these fgures? The changeLondon and Paris rents is due to the strengthening dorelative to the euro and pound sterling. In local currenprime rents in these markets are holding ground. Althosmaller, the decline in Hong Kong o $7.56 USD ($5.10 Hper square oot may be a more important indicator o thito come, as demand rom the banking and fnancial seccontinue to weaken.
EMEA and Asia Pacic Lead Global ConstructionA signifcant percentage o the oce space unconstruction is in Europe, the Middle East and A(EMEA), and much o that is occurring in Moscow Dubai. While both o these markets should expect streconomic growth in 2012, the act that Dubai—withvacancy rate o 50 percent—is constructing at such a pleads us to expect that supply will continue to outpdemand in that market.
The other two top markets or oce construction are in Asia Pacifc region. Guangzhou—China’s leadcommercial port city—and Tokyo have 19.6 and 15.6 milsquare eet under construction respectively. Asian econogrowth rates will remain strong in the coming months, wChina and India leading the pack. Rents are on the rismost cities in the region. However, dropping rents in Seand Hong Kong are a potential indicator o global econouncertainty. In Tokyo, where new supply has been increasor the past three years, we expect construction to peak abegin to decline in the coming year.
CLASS A / NET RENT (USD/SQ FT)
7/31/2019 Global Office Highlights 2nd Half 2011
http://slidepdf.com/reader/full/global-office-highlights-2nd-half-2011 2/6COLLIERS INTERNATIONAL | P
HIGHLIGHTS | SECOND HALF 2011 | OFFICE | GLOBAL
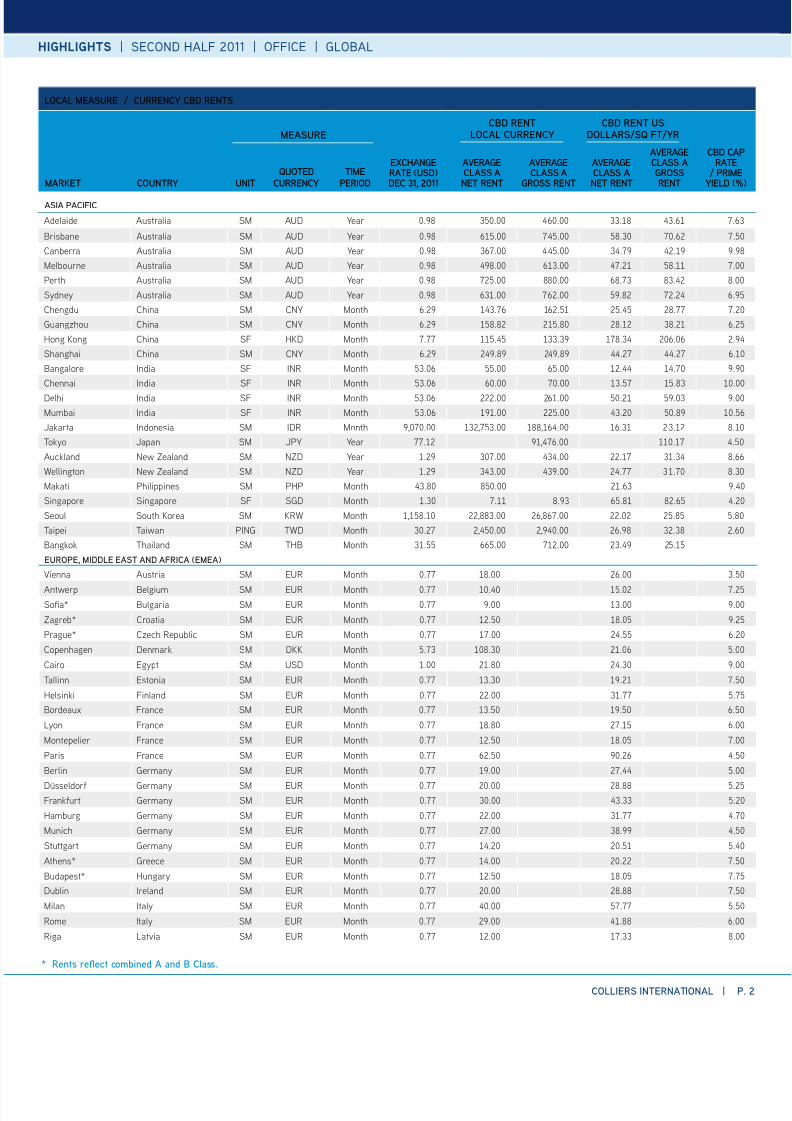
LOCAL MEASURE / CURRENCY CBD RENTS
MARKET COUNTRY UNITQUOTED
CURRENCYTIME
PERIOD
EXCHANGERATE (USD)DEC 31, 2011
AVERAGECLASS ANET RENT
AVERAGECLASS A
GROSS RENT
AVERAGECLASS ANET RENT
AVERAGECLASS AGROSSRENT
CBD CAPRATE
/ PRIMEYIELD (%
ASIA PACIFIC
Adelaide Australia SM AUD Year 0.98 350.00 460.00 33.18 43.61 7.6
Brisbane Australia SM AUD Year 0.98 615.00 745.00 58.30 70.62 7.5
Canberra Australia SM AUD Year 0.98 367.00 445.00 34.79 42.19 9.9
Melbourne Australia SM AUD Year 0.98 498.00 613.00 47.21 58.11 7.0
Perth Australia SM AUD Year 0.98 725.00 880.00 68.73 83.42 8.0
Sydney Australia SM AUD Year 0.98 631.00 762.00 59.82 72.24 6.9
Chengdu China SM CNY Month 6.29 143.76 162.51 25.45 28.77 7.2
Guangzhou China SM CNY Month 6.29 158.82 215.80 28.12 38.21 6.2
Hong Kong China SF HKD Month 7.77 115.45 133.39 178.34 206.06 2.9
Shanghai China SM CNY Month 6.29 249.89 249.89 44.27 44.27 6.1
Bangalore India SF INR Month 53.06 55.00 65.00 12.44 14.70 9.9
Chennai India SF INR Month 53.06 60.00 70.00 13.57 15.83 10.0
Delhi India SF INR Month 53.06 222.00 261.00 50.21 59.03 9.0
Mumbai India SF INR Month 53.06 191.00 225.00 43.20 50.89 10.5
Jakarta Indonesia SM IDR Month 9,070.00 132,753.00 188,164.00 16.31 23.12 8.1
Tokyo Japan SM JPY Year 77.12 91,476.00 110.17 4.5
Auckland New Zealand SM NZD Year 1.29 307.00 434.00 22.17 31.34 8.6
Wellington New Zealand SM NZD Year 1.29 343.00 439.00 24.77 31.70 8.3
Makati Philippines SM PHP Month 43.80 850.00 21.63 9.4
Singapore Singapore SF SGD Month 1.30 7.11 8.93 65.81 82.65 4.2
Seoul South Korea SM KRW Month 1,158.10 22,883.00 26,867.00 22.02 25.85 5.8
Taipei Taiwan PING TWD Month 30.27 2,450.00 2,940.00 26.98 32.38 2.6
Bangkok Thailand SM THB Month 31.55 665.00 712.00 23.49 25.15
EUROPE, MIDDLE EAST AND AFRICA (EMEA)
Vienna Austria SM EUR Month 0.77 18.00 26.00 3.5
Antwerp Belgium SM EUR Month 0.77 10.40 15.02 7.2Soa* Bulgaria SM EUR Month 0.77 9.00 13.00 9.0
Zagreb* Croatia SM EUR Month 0.77 12.50 18.05 9.2
Prague* Czech Republic SM EUR Month 0.77 17.00 24.55 6.2
Copenhagen Denmark SM DKK Month 5.73 108.30 21.06 5.0
Cairo Egypt SM USD Month 1.00 21.80 24.30 9.0
Tallinn Estonia SM EUR Month 0.77 13.30 19.21 7.5
Helsinki Finland SM EUR Month 0.77 22.00 31.77 5.7
Bordeaux France SM EUR Month 0.77 13.50 19.50 6.5
Lyon France SM EUR Month 0.77 18.80 27.15 6.0
Montepelier France SM EUR Month 0.77 12.50 18.05 7.0
Paris France SM EUR Month 0.77 62.50 90.26 4.5
Berlin Germany SM EUR Month 0.77 19.00 27.44 5.0
Düsseldor Germany SM EUR Month 0.77 20.00 28.88 5.2Frankurt Germany SM EUR Month 0.77 30.00 43.33 5.2
Hamburg Germany SM EUR Month 0.77 22.00 31.77 4.7
Munich Germany SM EUR Month 0.77 27.00 38.99 4.5
Stuttgart Germany SM EUR Month 0.77 14.20 20.51 5.4
Athens* Greece SM EUR Month 0.77 14.00 20.22 7.5
Budapest* Hungary SM EUR Month 0.77 12.50 18.05 7.7
Dublin Ireland SM EUR Month 0.77 20.00 28.88 7.5
Milan Italy SM EUR Month 0.77 40.00 57.77 5.5
Rome Italy SM EUR Month 0.77 29.00 41.88 6.0
Riga Latvia SM EUR Month 0.77 12.00 17.33 8.0
MEASURECBD RENT
LOCAL CURRENCYCBD RENT US
DOLLARS/SQ FT/YR
* Rents reect combined A and B Class.
7/31/2019 Global Office Highlights 2nd Half 2011
http://slidepdf.com/reader/full/global-office-highlights-2nd-half-2011 3/6
HIGHLIGHTS | SECOND HALF 2011 | OFFICE | GLOB
COLLIERS INTERNATIONAL | P
Vilnius Lithuania SM EUR Month 0.77 13.10 18.92 8.5
Amsterdam Netherlands SM EUR Month 0.77 17.10 24.70 6.5
Oslo Norway SM NOK Year 5.98 3,250.00 50.49 5.5
Warsaw* Poland SM EUR Month 0.77 22.60 32.64 6.2
Lisbon Portugal SM EUR Month 0.77 15.00 21.66 7.5
Bucharest* Romania SM EUR Month 0.77 15.00 21.66 8.2
Moscow Russia SM USD Month 1.00 68.00 75.78 9.5
Saint Petersburg Russia SM USD Month 1.00 30.70 34.21 11.0
Riyadh Saudi Arabia SM SAR Year 3.75 1,200.00 29.72 10.0
Belgrade* Serbia SM EUR Month 0.77 13.00 18.77 9.0
Bratislava* Slovakia SM EUR Month 0.77 11.45 16.54 7.5
Madrid Spain SM EUR Month 0.77 24.00 34.66 5.7
Stockholm Sweden SM SEK Year 6.91 4,500.00 60.52 5.0
Geneva Switzerland SM CHF Month 0.94 55.00 65.31 4.2
Zurich Switzerland SM CHF Month 0.94 40.00 47.50 4.1
Istanbul Turkey SM USD Month 1.00 31.05 34.60 7.0
Kyiv* Ukraine SM USD Month 1.00 33.00 36.78 11.0
Abu Dhabi United Arab Emirates SM USD Month 1.00 33.10 36.89 10.0
Dubai United Arab Emirates SM USD Month 1.00 35.79 39.89 10.0
Belast United Kingdom SF GBP Year 0.64 12.50 19.40 6.2
Birmingham United Kingdom SF GBP Year 0.64 21.00 32.60 6.0
Bristol United Kingdom SF GBP Year 0.64 24.00 37.26 6.2
Edinburgh United Kingdom SF GBP Year 0.64 21.00 32.60 6.0
Glasgow United Kingdom SF GBP Year 0.64 23.00 35.70 6.0
London – City United Kingdom SF GBP Year 0.64 48.50 75.29 5.2
London – West End United Kingdom SF GBP Year 0.64 77.50 120.31 4.0
Manchester United Kingdom SF GBP Year 0.64 22.00 34.15 6.0
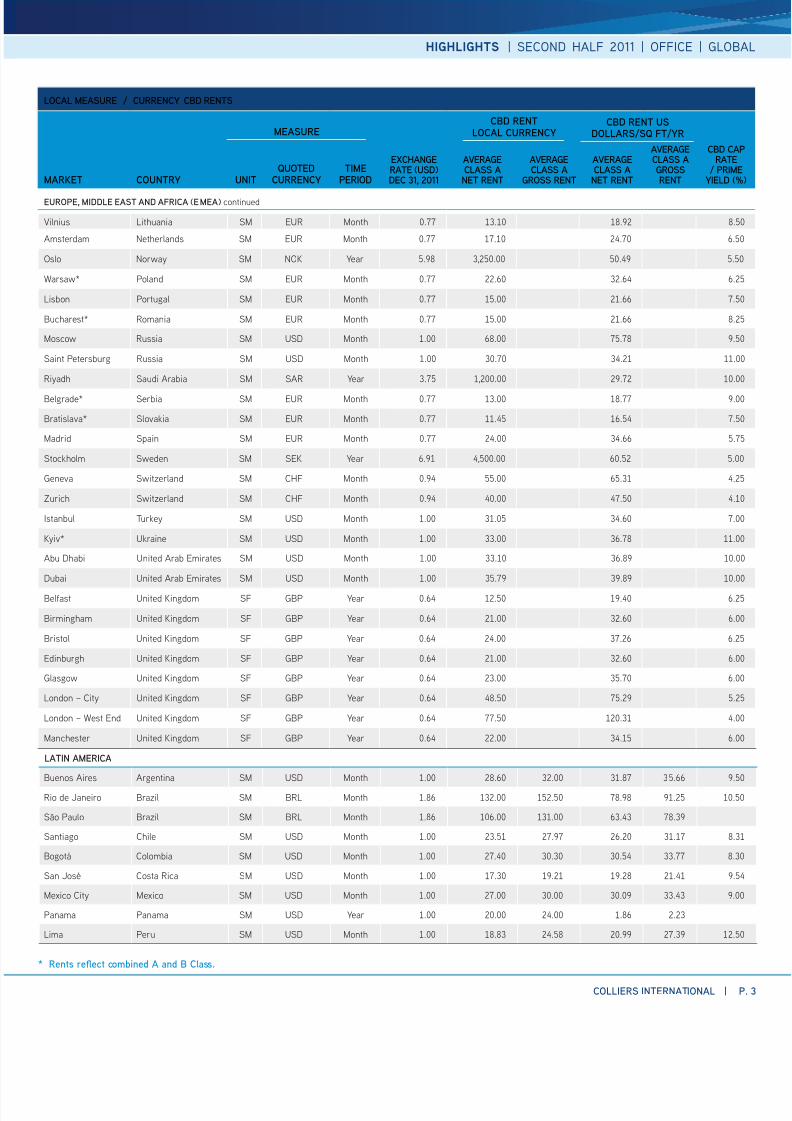
LATIN AMERICA
Buenos Aires Argentina SM USD Month 1.00 28.60 32.00 31.87 35.66 9.5
Rio de Janeiro Brazil SM BRL Month 1.86 132.00 152.50 78.98 91.25 10.5
São Paulo Brazil SM BRL Month 1.86 106.00 131.00 63.43 78.39
Santiago Chile SM USD Month 1.00 23.51 27.97 26.20 31.17 8.3
Bogotá Colombia SM USD Month 1.00 27.40 30.30 30.54 33.77 8.3
San José Costa Rica SM USD Month 1.00 17.30 19.21 19.28 21.41 9.5
Mexico City Mexico SM USD Month 1.00 27.00 30.00 30.09 33.43 9.0
Panama Panama SM USD Year 1.00 20.00 24.00 1.86 2.23
Lima Peru SM USD Month 1.00 18.83 24.58 20.99 27.39 12.5
LOCAL MEASURE / CURRENCY CBD RENTS
MARKET COUNTRY UNITQUOTED
CURRENCYTIME
PERIOD
EXCHANGERATE (USD)DEC 31, 2011
AVERAGECLASS ANET RENT
AVERAGECLASS A
GROSS RENT
AVERAGECLASS ANET RENT
AVERAGECLASS AGROSSRENT
CBD CAPRATE
/ PRIMEYIELD (%
EUROPE, MIDDLE EAST AND AFRICA (EMEA) continued
MEASURECBD RENT
LOCAL CURRENCYCBD RENT US
DOLLARS/SQ FT/YR
* Rents reect combined A and B Class.
7/31/2019 Global Office Highlights 2nd Half 2011
http://slidepdf.com/reader/full/global-office-highlights-2nd-half-2011 4/6COLLIERS INTERNATIONAL | P
HIGHLIGHTS | SECOND HALF 2011 | OFFICE | GLOBAL
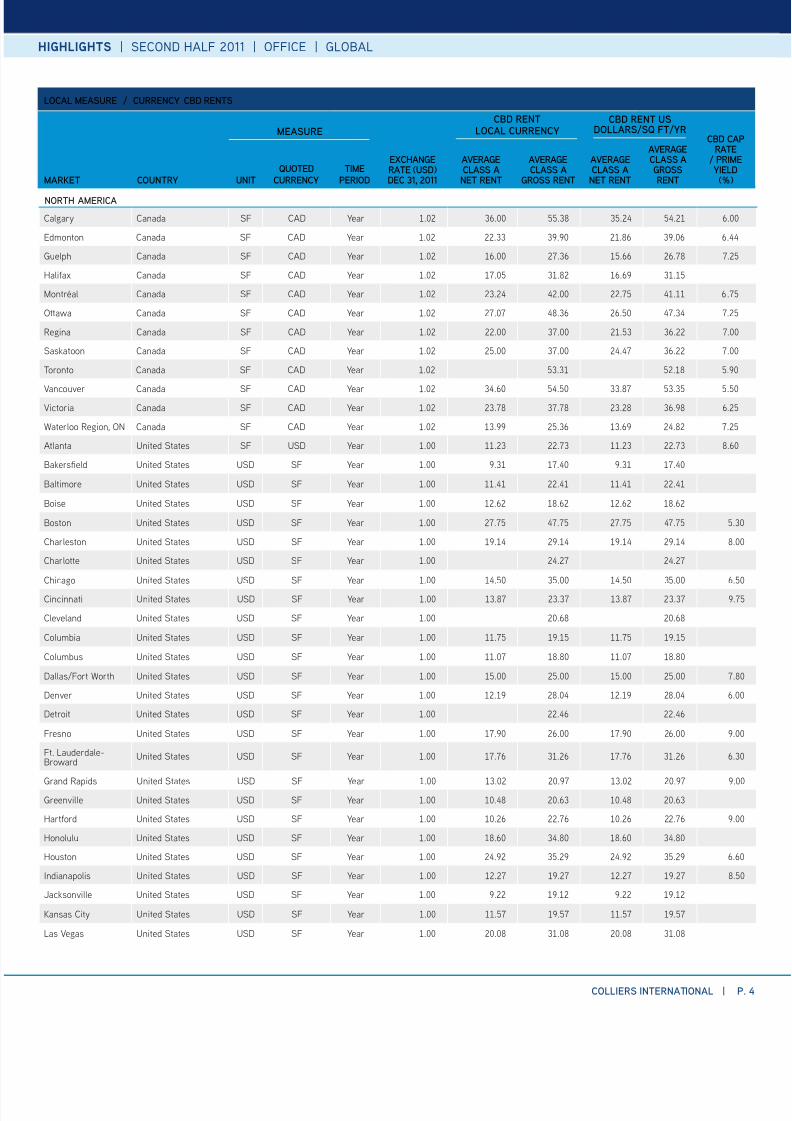
NORTH AMERICA
Calgary Canada SF CAD Year 1.02 36.00 55.38 35.24 54.21 6.00
Edmonton Canada SF CAD Year 1.02 22.33 39.90 21.86 39.06 6.44
Guelph Canada SF CAD Year 1.02 16.00 27.36 15.66 26.78 7.25
Haliax Canada SF CAD Year 1.02 17.05 31.82 16.69 31.15
Montréal Canada SF CAD Year 1.02 23.24 42.00 22.75 41.11 6.75
Ottawa Canada SF CAD Year 1.02 27.07 48.36 26.50 47.34 7.25
Regina Canada SF CAD Year 1.02 22.00 37.00 21.53 36.22 7.00
Saskatoon Canada SF CAD Year 1.02 25.00 37.00 24.47 36.22 7.00
Toronto Canada SF CAD Year 1.02 53.31 52.18 5.90
Vancouver Canada SF CAD Year 1.02 34.60 54.50 33.87 53.35 5.50Victoria Canada SF CAD Year 1.02 23.78 37.78 23.28 36.98 6.25
Waterloo Region, ON Canada SF CAD Year 1.02 13.99 25.36 13.69 24.82 7.25
Atlanta United States SF USD Year 1.00 11.23 22.73 11.23 22.73 8.60
Bakerseld United States USD SF Year 1.00 9.31 17.40 9.31 17.40
Baltimore United States USD SF Year 1.00 11.41 22.41 11.41 22.41
Boise United States USD SF Year 1.00 12.62 18.62 12.62 18.62
Boston United States USD SF Year 1.00 27.75 47.75 27.75 47.75 5.3
Charleston United States USD SF Year 1.00 19.14 29.14 19.14 29.14 8.0
Charlotte United States USD SF Year 1.00 24.27 24.27
Chicago United States USD SF Year 1.00 14.50 35.00 14.50 35.00 6.5
Cincinnati United States USD SF Year 1.00 13.87 23.37 13.87 23.37 9.7
Cleveland United States USD SF Year 1.00 20.68 20.68
Columbia United States USD SF Year 1.00 11.75 19.15 11.75 19.15
Columbus United States USD SF Year 1.00 11.07 18.80 11.07 18.80
Dallas/Fort Worth United States USD SF Year 1.00 15.00 25.00 15.00 25.00 7.8
Denver United States USD SF Year 1.00 12.19 28.04 12.19 28.04 6.0
Detroit United States USD SF Year 1.00 22.46 22.46
Fresno United States USD SF Year 1.00 17.90 26.00 17.90 26.00 9.0
Ft. Lauderdale-Broward
United States USD SF Year 1.00 17.76 31.26 17.76 31.26 6.3
Grand Rapids United States USD SF Year 1.00 13.02 20.97 13.02 20.97 9.0Greenville United States USD SF Year 1.00 10.48 20.63 10.48 20.63
Hartord United States USD SF Year 1.00 10.26 22.76 10.26 22.76 9.0
Honolulu United States USD SF Year 1.00 18.60 34.80 18.60 34.80
Houston United States USD SF Year 1.00 24.92 35.29 24.92 35.29 6.6
Indianapolis United States USD SF Year 1.00 12.27 19.27 12.27 19.27 8.5
Jacksonville United States USD SF Year 1.00 9.22 19.12 9.22 19.12
Kansas City United States USD SF Year 1.00 11.57 19.57 11.57 19.57
Las Vegas United States USD SF Year 1.00 20.08 31.08 20.08 31.08
LOCAL MEASURE / CURRENCY CBD RENTS
MARKET COUNTRY UNITQUOTED
CURRENCYTIME
PERIOD
EXCHANGERATE (USD)DEC 31, 2011
AVERAGECLASS ANET RENT
AVERAGECLASS A
GROSS RENT
AVERAGECLASS ANET RENT
AVERAGECLASS AGROSSRENT
CBD CAPRATE
/ PRIMEYIELD(%)
MEASURECBD RENT
LOCAL CURRENCYCBD RENT US
DOLLARS/SQ FT/YR
7/31/2019 Global Office Highlights 2nd Half 2011
http://slidepdf.com/reader/full/global-office-highlights-2nd-half-2011 5/6
HIGHLIGHTS | SECOND HALF 2011 | OFFICE | GLOB
COLLIERS INTERNATIONAL | P
LOCAL MEASURE / CURRENCY CBD RENTS
MARKET COUNTRY UNITQUOTED
CURRENCYTIME
PERIOD
EXCHANGERATE (USD)DEC 31, 2011
AVERAGECLASS A NET
RENT
AVERAGECLASS A
GROSS RENT
AVERAGECLASS ANET RENT
AVERAGECLASS AGROSSRENT
CBD CARATE
/ PRIMYIELD(%)
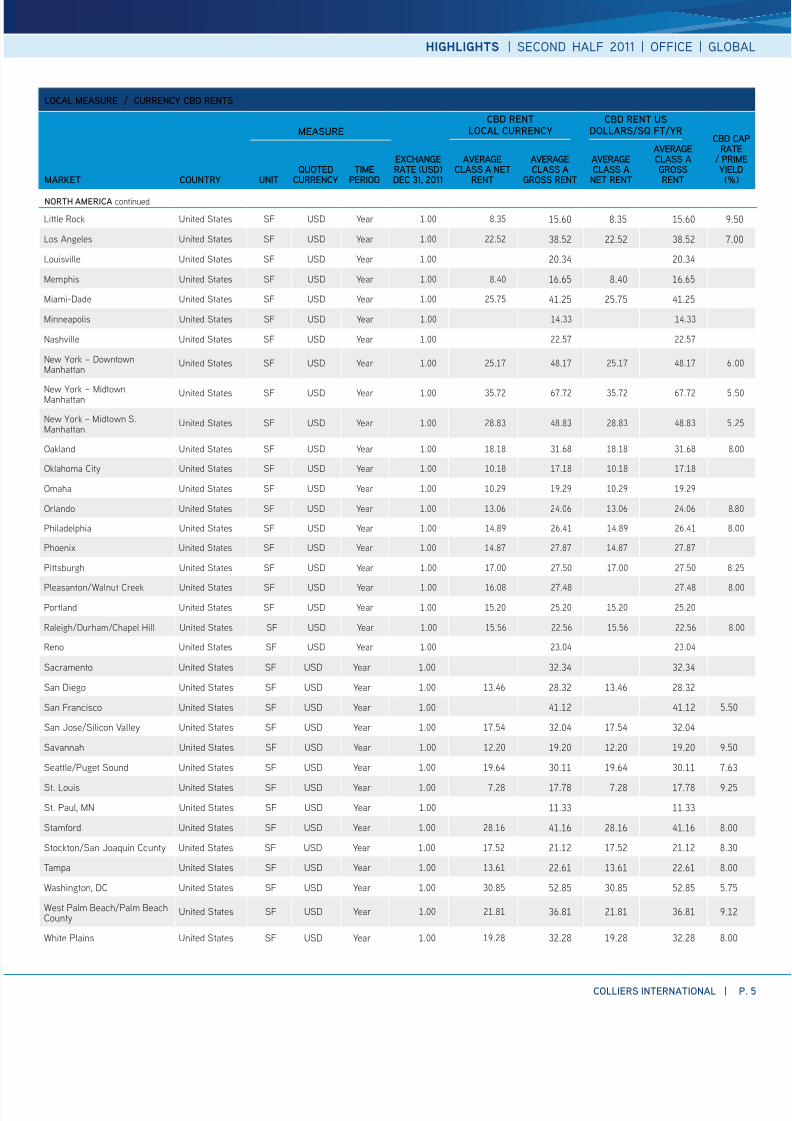
NORTH AMERICA continued
Little Rock United States SF USD Year 1.00 8.35 15.60 8.35 15.60 9.50
Los Angeles United States SF USD Year 1.00 22.52 38.52 22.52 38.52 7.00
Louisville United States SF USD Year 1.00 20.34 20.34
Memphis United States SF USD Year 1.00 8.40 16.65 8.40 16.65
Miami-Dade United States SF USD Year 1.00 25.75 41.25 25.75 41.25
Minneapolis United States SF USD Year 1.00 14.33 14.33
Nashville United States SF USD Year 1.00 22.57 22.57
New York – DowntownManhattan
United States SF USD Year 1.00 25.17 48.17 25.17 48.17 6.00
New York – MidtownManhattan United States SF USD Year 1.00 35.72 67.72 35.72 67.72 5.50
New York – Midtown S.Manhattan
United States SF USD Year 1.00 28.83 48.83 28.83 48.83 5.25
Oakland United States SF USD Year 1.00 18.18 31.68 18.18 31.68 8.00
Oklahoma City United States SF USD Year 1.00 10.18 17.18 10.18 17.18
Omaha United States SF USD Year 1.00 10.29 19.29 10.29 19.29
Orlando United States SF USD Year 1.00 13.06 24.06 13.06 24.06 8.80
Philadelphia United States SF USD Year 1.00 14.89 26.41 14.89 26.41 8.00
Phoenix United States SF USD Year 1.00 14.87 27.87 14.87 27.87
Pittsburgh United States SF USD Year 1.00 17.00 27.50 17.00 27.50 8.25
Pleasanton/Walnut Creek United States SF USD Year 1.00 16.08 27.48 27.48 8.00
Portland United States SF USD Year 1.00 15.20 25.20 15.20 25.20
Raleigh/Durham/Chapel Hill United States SF USD Year 1.00 15.56 22.56 15.56 22.56 8.00
Reno United States SF USD Year 1.00 23.04 23.04
Sacramento United States SF USD Year 1.00 32.34 32.34
San Diego United States SF USD Year 1.00 13.46 28.32 13.46 28.32
San Francisco United States SF USD Year 1.00 41.12 41.12 5.50
San Jose/Silicon Valley United States SF USD Year 1.00 17.54 32.04 17.54 32.04
Savannah United States SF USD Year 1.00 12.20 19.20 12.20 19.20 9.50
Seattle/Puget Sound United States SF USD Year 1.00 19.64 30.11 19.64 30.11 7.63
St. Louis United States SF USD Year 1.00 7.28 17.78 7.28 17.78 9.25
St. Paul, MN United States SF USD Year 1.00 11.33 11.33
Stamord United States SF USD Year 1.00 28.16 41.16 28.16 41.16 8.00
Stockton/San Joaquin County United States SF USD Year 1.00 17.52 21.12 17.52 21.12 8.30
Tampa United States SF USD Year 1.00 13.61 22.61 13.61 22.61 8.00
Washington, DC United States SF USD Year 1.00 30.85 52.85 30.85 52.85 5.75
West Palm Beach/Palm BeachCounty
United States SF USD Year 1.00 21.81 36.81 21.81 36.81 9.12
White Plains United States SF USD Year 1.00 19.28 32.28 19.28 32.28 8.00
MEASURECBD RENT
LOCAL CURRENCYCBD RENT US
DOLLARS/SQ FT/YR
7/31/2019 Global Office Highlights 2nd Half 2011
http://slidepdf.com/reader/full/global-office-highlights-2nd-half-2011 6/6
HIGHLIGHTS | SECOND HALF 2011 | OFFICE | GLOBAL
WWW COLLIERS COM
Class A Gross Rent – The average rent quoted persquare oot per annum or Class A oce building withinthe CBD plus additional costs such as property taxes,service charges or operating expenses.
Class A Net Rent – The average rent quoted per squareoot per annum or a Class A oce building within the
CBD.Class A (Prime) Buildings – Most prestigious buildingcompeting or premier oce users with rents aboveaverage or the area. Buildings have high qualitystandard or nishes, state-o-the-art systems,exceptional accessibility and a denite market presence.
Characterized by: Prime central locations; rst-classtenant improvements; on-site parking; state o the artelevators and HVAC systems; concrete and steelconstruction; contemporary design and architecture;high quality o upkeep and maintenance; ability tocommand a premium rent within the relevant market.The Class A building designation implies that the size othe building is “signicant” in accordance with themarket.
Quoted Currency – The currency quoted locally in alllease transactions. Not necessarily national currency.(Note: Chile utilizes Unidad de Fomento, which equalsUSD .)
AMERICAS
James Cook
USA
Jef Simonson
USA
EUROPE, MIDDLE EASTAND AFRICA
Thomas Grounds
EMEA
Mark Charlton
United Kingdom
Damian Harrington
Central and Eastern Europe
Renaud Roger
France
ASIA PACIFIC
Simon Lo
Asia
Amit Oberoi
India
Nerida Conisbee
Australia/New Zealand
Yumiko Yasuda
Japan
GLOBAL RESEARCH CONTACTS
GLOSSARY
COLLIERS INTERNATIONAL
Union Street, Suite
Seattle, WA USA
TEL +
oces in countries on continentsUnited States: Canada:
Latin America:
Asia Pacic: EMEA:
• $1.5 billion in annual revenue
• 979 million square feet under
management
• Over 12,500 professionals
Copyright © Colliers International.
The inormation contained herein has been obtained
rom sources deemed reliable. While every reasonable
efort has been made to ensure its accuracy, we cann
guarantee it. No responsibility is assumed or any
inaccuracies. Readers are encouraged to consult their
proessional advisors prior to acting on any o the
material contained in this report.
Accelerating success
Time Period – The standard way in which leases arequoted. Usually on a per month or per year basis.
Existing Inventory – Existing oce oor space (ClassesA, B and C) within each city’s CBD (central businessdistrict).
Under Construction – The total oce oor space
(Classes A, B and C) within each city’s CBD (centralbusiness district) which is under construction, but notyet completed, giving an indication o the developmentpipeline or each market. This includes both availableand pre-let oor space.
Unit – The normal convention locally in which area ismeasured. Usually on a per square oot or per squaremeter basis.
Vacancy Rate (%) – The percentage o the inventory(total completed oce oor space, Classes A, B and C,within the CBD) which is unoccupied.
Yield (%) – The average prime yield (or capitalizationrate), expressed as a percentage, or a Class A ocebuilding within the CBD.
Note: SF = square eetSM = square meter
PSF = per square oot
PSM = per square meterCBD = central business district