global numerical model for the evaluation of...
TRANSCRIPT
GLOBAL NUMERICAL MODEL FOR THE EVALUATION OF THE GEOMETRY
AND OPERATION CONDITION EFFECTS ON HOLLOW CATHODE INSERT
AND ORIFICE REGION PLASMAS
by
Oguz Korkmaz
B.S., Mechanical Engineering, Yıldız Technical University, 2013
Submitted to the Institute for Graduate Studies in
Science and Engineering in partial fulfillment of
the requirements for the degree of
Master of Science
Graduate Program in FBE Program for which the Thesis is Submitted
Bogazici University
2015

ii
GLOBAL NUMERICAL MODEL FOR THE EVALUATION OF THE GEOMETRY
AND OPERATION CONDITION EFFECTS ON HOLLOW CATHODE INSERT
AND ORIFICE REGION PLASMAS
APPROVED BY:
Assist. Prof. Murat Celik . . . . . . . . . . . . . . . . . . .
(Thesis Supervisor)
Assoc. Prof. Kunt Atalık . . . . . . . . . . . . . . . . . . .
Assist. Prof. Ahmet Oncu . . . . . . . . . . . . . . . . . . .
DATE OF APPROVAL: 27.January.2015

iii
ACKNOWLEDGEMENTS
I would like to thank Prof. Murat Celik for his guidance and help without which
I could not troubleshoot the problems that I have faced throughout this study and
eventually to produce this thesis. I also want to express my gratitude to him for
introducing me to the academic world.
I would like to thank the members of my thesis committee, Prof. Kunt Atalık
and Prof. Ahmet Oncu, for their time and help in the preparation process of this
dissertation.
I would like to thank all my colleagues Sina Jahanbakhsh, Mert Satır, Ali Enes
Ozturk, Emre Turkoz, Fırat Sık and Serhan Yıldız for their constant help, support and
sincere friendship in hard times.
I want to thank The Scientific and Technological Research Council of Turkey
(TUBITAK) for supporting this research project under the project number 112M862.
I also want to thank Prof. Suleyman Imamoglu, who is a scholar, sociologist
and wine expert, for his sincere chat and advices on wide variety of subjects. He also
deserves another thanks for serving me the most delicious wines I have ever tasted and
for his hospitality.
Last but not least, I am grateful to my mother, Gulsum Korkmaz, and my father,
Ali Korkmaz, for supporting me at every stage of my education. Without their support
and trust, I could never have found enough motivation for earning this Master of Science
or any other degree I have obtained so far. Therefore, they deserve most of the credits
for the achievements in my life, and I thank them for that. An immense and special
gratitude goes to other members of my family: Nevin Aydın, Osman Aydın and Gulcan
Aydın.

iv
ABSTRACT
GLOBAL NUMERICAL MODEL FOR THE EVALUATION
OF THE GEOMETRY AND OPERATION CONDITION
EFFECTS ON HOLLOW CATHODE INSERT AND
ORIFICE REGION PLASMAS
Thermionic hollow cathodes have been widely used in wide variety of areas such
as spacecraft electric propulsion systems, material processing and lasers for more than
half a century as efficient electron sources. Especially in electric propulsion systems,
hollow cathodes are being used as electron sources for propellant ionization and ion
beam neutralization. Moreover, hollow cathode is also a promising candidate for uti-
lization as a stand-alone propulsion system in microsatellites or nanosatellites due to its
small physical size, low power consumption and ease of operation. On the other hand,
the small geometry of the typical orificed hollow cathodes make the plasma diagnos-
tics difficult which is why numerical studies become important for understanding the
driving physical processes behind their operation, and the effects of the geometry and
the operation parameters on cathode performance. In this thesis a global numerical
model for the insert and orifice plasma of a hollow cathode is presented where volume
averaged plasma parameters are considered for both regions. The results of this study
show that the developed model can be used for designing and sizing orificed hollow
cathodes as comparisons with the results of experimental and other numerical studies
are in good agreement with the ones obtained from the developed model.
v
OZET
GEOMETRI VE CALISMA KOSULLARININ OYUK
KATOT YAYICI VE ORIFIS PLAZMA BOLGELERINE
OLAN ETKISININ DEGERLENDIRILMESI ICIN GLOBAL
NUMERIK MODEL
Termiyonik oyuk katotlar uzay araclarının elektrik itki sistemleri, malzeme islen-
mesi ve lazerler gibi bir cok alanda yarım yuzyılı askın bir suredir etkin elektron kay-
nakları olarak kullanılmaktadırlar. Oyuk katotlar ozellikle elektrik itki sistemlerinde
yakıtın iyonlastırılması ve iyon demetinin noturlestirilmesinde kullanılmaktadırlar. Ay-
rıca oyuk katot kucuk fiziksel boyutu, dusuk guc tuketimi ve kullanım kolaylıgı sayesinde
mikro ve nano uydularda kendi basına itki sistemi olarak kullanılmak icin umut vadedici
bir adaydır. Ote yandan oyuk katotların kucuk bir geometriye sahip olmaları plazma
olcumlerini zorlastırmaktadır. Bu sebepten oturu, bu cihazın calısmasının ardında
yatan temel fiziksel prensiplerin ve de geometri ve calısma kosullarının katot perfor-
mansı uzerindeki etkilerinin anlasılabilmesi icin, numerik calısmalar onem arz etmek-
tedir. Bu tez calısmasında, yayıcı ve orifis bolgelerindeki plazma parametrelerinin
duzgun dagılımlı oldugu kabul edilerek oyuk katodun soz konusu bolgeleri icin global
bir numerik model gelistirilmistir. Gelistirilen modelden elde edilen sonucların lit-
eraturdeki diger numerik ve deneysel calısmaların sonucları ile iyi derecede uyumlu
olması, bu modelin orifisli oyuk katotların dizaynında ve boyutlandırlmasında kul-
lanılabilir oldugunu gostermektedir.
vi
TABLE OF CONTENTS
ACKNOWLEDGEMENTS . . . . . . . . . . . . . . . . . . . . . . . . . . . . . iii
ABSTRACT . . . . . . . . . . . . . . . . . . . . . . . . . . . . . . . . . . . . . iv
OZET . . . . . . . . . . . . . . . . . . . . . . . . . . . . . . . . . . . . . . . . . v
LIST OF FIGURES . . . . . . . . . . . . . . . . . . . . . . . . . . . . . . . . . viii
LIST OF TABLES . . . . . . . . . . . . . . . . . . . . . . . . . . . . . . . . . . xii
LIST OF SYMBOLS . . . . . . . . . . . . . . . . . . . . . . . . . . . . . . . . . xiii
LIST OF ACRONYMS/ABBREVIATIONS . . . . . . . . . . . . . . . . . . . . xv
1. INTRODUCTION . . . . . . . . . . . . . . . . . . . . . . . . . . . . . . . . 1
1.1. Hollow Cathode Applications in Electric Propulsion . . . . . . . . . . . 3
1.1.1. Ion Thrusters . . . . . . . . . . . . . . . . . . . . . . . . . . . . 3
1.1.2. Hall Thrusters . . . . . . . . . . . . . . . . . . . . . . . . . . . 4
1.2. Hollow Cathode Construction . . . . . . . . . . . . . . . . . . . . . . . 5
1.3. Overview of Hollow Cathode Physics . . . . . . . . . . . . . . . . . . . 15
1.4. Plume and Spot Mode Operation of Hollow Cathodes . . . . . . . . . . 20
1.5. Literature Review . . . . . . . . . . . . . . . . . . . . . . . . . . . . . . 20
2. GLOBAL NUMERICAL MODEL FOR ORIFICED HOLLOW CATHODE . 26
2.1. Insert Model . . . . . . . . . . . . . . . . . . . . . . . . . . . . . . . . . 26
2.1.1. Ion Conservation . . . . . . . . . . . . . . . . . . . . . . . . . . 27
2.1.2. Insert Plasma Energy Balance . . . . . . . . . . . . . . . . . . . 29
2.1.3. Current Balance . . . . . . . . . . . . . . . . . . . . . . . . . . 31
2.2. Orifice Model . . . . . . . . . . . . . . . . . . . . . . . . . . . . . . . . 34
2.2.1. Ion Conservation . . . . . . . . . . . . . . . . . . . . . . . . . . 35
2.2.2. Orifice Plasma Energy Balance . . . . . . . . . . . . . . . . . . 36
2.2.3. Orifice Wall Energy Balance . . . . . . . . . . . . . . . . . . . . 38
3. SOLUTION OF MODEL EQUATIONS . . . . . . . . . . . . . . . . . . . . 40
4. RESULTS AND DISCUSSIONS . . . . . . . . . . . . . . . . . . . . . . . . . 45
4.1. Effect of Operation Conditions . . . . . . . . . . . . . . . . . . . . . . . 45
4.2. Effect of Geometry . . . . . . . . . . . . . . . . . . . . . . . . . . . . . 48
5. COMPARISON WITH EXPERIMENTAL AND NUMERICAL STUDIES . 59
vii
6. CONCLUSIONS . . . . . . . . . . . . . . . . . . . . . . . . . . . . . . . . . 63
APPENDIX A: NEUTRAL PARTICLE DENSITY AND PRESSURE ESTIMA-
TION OF INSERT PLASMA . . . . . . . . . . . . . . . . . . . . . . . . . . . . 66
APPENDIX B: DERIVATION OF RICHARDSON-LAUE-DUSHMAN EQUA-
TION WITH THERMODYNAMIC APPROACH . . . . . . . . . . . . . . . . 68
APPENDIX C: DERIVATION OF ION RADIAL DIFFUSION EQUATION . 71
APPENDIX D: ENERGY TAKEN AWAY FROM PLASMA DUE TO ELEC-
TRONS STRIKING AN ANODE . . . . . . . . . . . . . . . . . . . . . . . . . 75
APPENDIX E: PUBLICATIONS PRODUCED FROM THIS RESEARCH . . 77
REFERENCES . . . . . . . . . . . . . . . . . . . . . . . . . . . . . . . . . . . . 78

viii
LIST OF FIGURES
Figure 1.1. Schematic of a hollow cathode. . . . . . . . . . . . . . . . . . . . . 1
Figure 1.2. Schematic of a typical ion thruster. . . . . . . . . . . . . . . . . . 3
Figure 1.3. Schematic of a typical Hall effect thruster. . . . . . . . . . . . . . 4
Figure 1.4. Geometry of hollow cathode. . . . . . . . . . . . . . . . . . . . . . 5
Figure 1.5. 3D CAD drawing of a typical hollow cathode assembly. . . . . . . 5
Figure 1.6. Courtney’s heater design [9]. . . . . . . . . . . . . . . . . . . . . . 6
Figure 1.7. Heater design of University of Michigan [10]. . . . . . . . . . . . . 7
Figure 1.8. Electrical circuit diagram of hollow cathode. . . . . . . . . . . . . 8
Figure 1.9. Emission current density versus temperature for various cathode
materials [11]. . . . . . . . . . . . . . . . . . . . . . . . . . . . . . 9
Figure 1.10. Evaporation rate versus emission current density for various cath-
ode materials [14]. . . . . . . . . . . . . . . . . . . . . . . . . . . . 9
Figure 1.11. L type dispenser cathode [28]. . . . . . . . . . . . . . . . . . . . . 12
Figure 1.12. CPD cathode [28]. . . . . . . . . . . . . . . . . . . . . . . . . . . . 13
Figure 1.13. Different orifice constructions. . . . . . . . . . . . . . . . . . . . . 15

ix
Figure 1.14. Schematic of hollow cathode in operation. . . . . . . . . . . . . . . 16
Figure 1.15. Schematic of sheath region developing on the insert material. . . . 17
Figure 1.16. Schematic of the sheath developing on the orifice wall. . . . . . . . 18
Figure 1.17. Axial plasma density and plasma temperature profile along hollow
cathode regions [37, 38, 39]. . . . . . . . . . . . . . . . . . . . . . 19
Figure 1.18. The geometry modelled in reference [52]. . . . . . . . . . . . . . . 25
Figure 2.1. Insert plasma control volume. . . . . . . . . . . . . . . . . . . . . 27
Figure 2.2. Mobility of ions in the emitter region. . . . . . . . . . . . . . . . . 28
Figure 2.3. Schematic of the current balance in the insert region. . . . . . . . 31
Figure 2.4. Orifice plasma control volume. . . . . . . . . . . . . . . . . . . . . 35
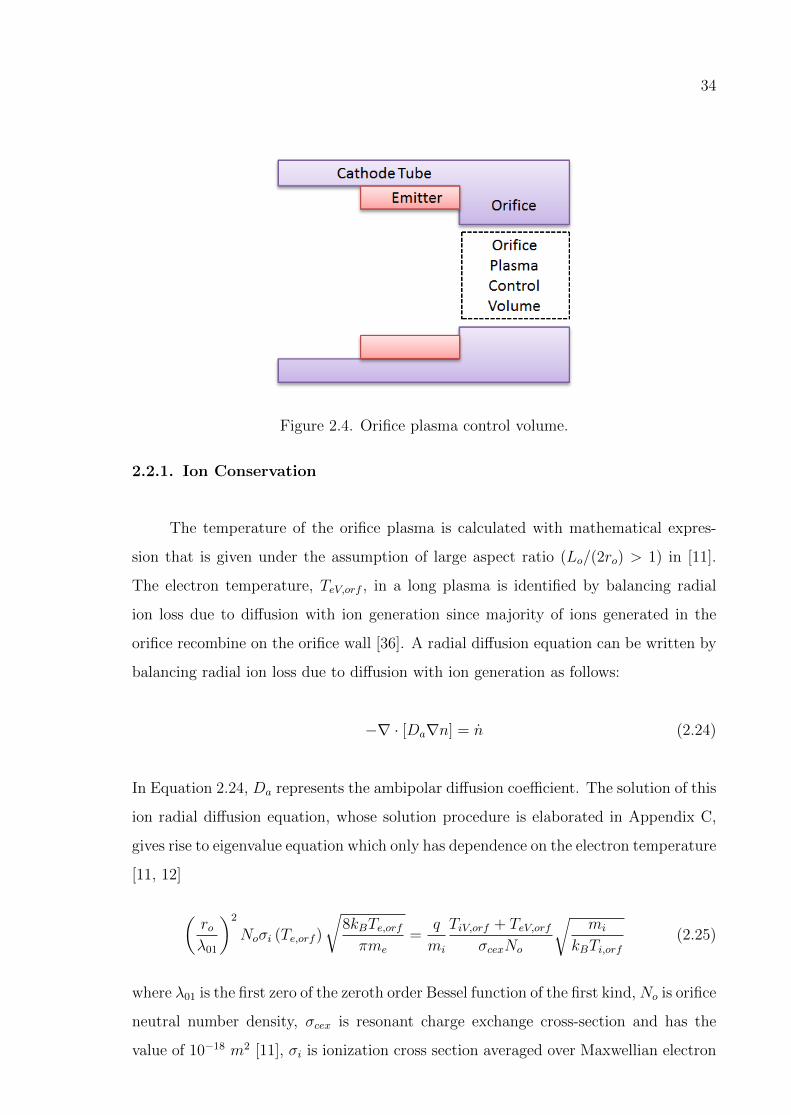
Figure 2.5. Orifice wall energy fluxes. . . . . . . . . . . . . . . . . . . . . . . . 39
Figure 3.1. Test geometry. . . . . . . . . . . . . . . . . . . . . . . . . . . . . . 40
Figure 3.2. Flow chart of the global model for OHC. . . . . . . . . . . . . . . 43
Figure 4.1. Insert wall temperature as a function of discharge current. . . . . 46
Figure 4.2. Emitter plasma density as a function of discharge current. . . . . . 46
Figure 4.3. Orifice wall temperature as a function of discharge current. . . . . 47

x
Figure 4.4. Orifice plasma density as a function of discharge current. . . . . . 47
Figure 4.5. Orifice electron temperature as a function of mass flow rate at 2 A
discharge current. . . . . . . . . . . . . . . . . . . . . . . . . . . . 48
Figure 4.6. Insert lifetime as a function of discharge current and flow rate. . . 48
Figure 4.7. NSTAR neutralizer cathode internal pressure as a function of flow
rate and discharge current. . . . . . . . . . . . . . . . . . . . . . . 49
Figure 4.8. Insert temperature as a function of insert inner diameter. . . . . . 50
Figure 4.9. Insert effective emission length as a function of insert inner diameter. 51
Figure 4.10. Insert temperature as a function of orifice diameter. . . . . . . . . 51
Figure 4.11. Insert effective emission length as a function of orifice diameter. . 52
Figure 4.12. Insert wall temperature as a function of orifice length. . . . . . . . 52
Figure 4.13. Insert effective emission length as a function of orifice length. . . . 53
Figure 4.14. Orifice wall temperature as a function of orifice length. . . . . . . 53
Figure 4.15. Amount of power delivered to orifice wall as a function of orifice
length. . . . . . . . . . . . . . . . . . . . . . . . . . . . . . . . . . 54
Figure 4.16. Insert lifetime as a function of orifice length. . . . . . . . . . . . . 54
Figure 4.17. Orifice wall temperature as a function of orifice diameter. . . . . . 55

xi
Figure 4.18. Amount of power delivered to orifice wall as a function of orifice
diameter. . . . . . . . . . . . . . . . . . . . . . . . . . . . . . . . . 55
Figure 4.19. Insert plasma pressure as a function of orifice diameter. . . . . . . 56
Figure 4.20. Orifice wall temperature as a function of cathode tube thickness. . 56
Figure 4.21. Power consumption as a function of discharge current. . . . . . . . 57
Figure 4.22. Power consumption as a function of insert inner diameter. . . . . . 57
Figure 4.23. Power consumption as a function of orifice diameter. . . . . . . . . 58
Figure 4.24. Power consumption as a function of orifice length. . . . . . . . . . 58
Figure 5.1. Comparison of calculated insert wall temperatures at 1 mg/s. . . . 59
Figure 5.2. Comparison of predicted NSTAR insert temperature with experi-
mental measurement [13]. . . . . . . . . . . . . . . . . . . . . . . . 60
Figure 5.3. Comparison of calculated orifice wall temperatures at 1 mg/s. . . . 61
Figure 5.4. Comparison of calculated insert wall temperatures at 0.3 mg/s. . . 61
Figure 5.5. Comparison of calculated orifice wall temperatures at 0.3 mg/s. . . 62

xii
LIST OF TABLES
Table 1.1. Calculated results for varying model parameters [43]. . . . . . . . . 21
Table 5.1. NSTAR neutralizer cathode throttle levels [13]. . . . . . . . . . . . 60
Table 5.2. Comparison of results obtained from different numerical models for
NSTAR neutralizer cathode [45]. . . . . . . . . . . . . . . . . . . . 62

xiii
LIST OF SYMBOLS
A Richardson constant
Aemit Insert effective emission area
D Thermionic emitter material constant
do Orifice diameter
Es Electric field of the cathode sheath
h Planck’s constant
IBohm,orf Bohm ion current at the orifice sheath edge
Iem Thermionic electron emission current
Id Discharge current
Ii Ion current towards the insert surface
Ii,out Ion current out of the control volume
Ir Random electron current towards insert surface
Ir,orf Random electron current towards orifice surface
Ji,Bohm Bohm ion current density at the sheath edge
Ji,th Ion thermal current density
kB Boltzmann’s constant
Lemit Insert effective emission length
Lo Orifice length
m Propellant mass flow rate in kg/s
me Electron mass
mi Ion mass
Ne Neutral number density of insert plasma
No Neutral number density of orifice plasma
ne Insert plasma density
no Orifice plasma density
P Neutral particle pressure
Q Propellant mass flow rate in sccm
q Electron charge

xiv
Re Insert plasma resistance
Rg Universal gas constant
Ro Orifice plasma resistance
re Insert radius
ro Orifice radius
Te,ins Insert plasma electron temperature in K
TeV,ins Insert plasma electron temperature in eV
Te,orf Orifice plasma electron temperature in K
TeV,orf Orifice plasma electron temperature in eV
Ti,orf Orifice plasma ion temperature in K
TiV,orf Orifice plasma ion temperature in eV
Tw,ins Insert wall temperature
Tw,orf Orifice wall temperature
Ui First ionization energy of propellant
W Evaporation rate of insert material
γ Specific heat ratio of propellant
ε0 Permittivity of free space
ζ Viscosity
η Plasma resistivity
Λ Coulomb logarithm
λ01 The first zero of zeroth order Bessel function of the first kind
νei Electron ion collision frequency
νen Electron neutral collision frequency
σcex Resonant charge exchange collision cross section
σen Electron neutral collision cross section
φeff Insert effective work function
φs Sheath potential
φs,orf Orifice sheath potential
φwf Insert work function

xv
LIST OF ACRONYMS/ABBREVIATIONS
CAD Computer Aided Drawing
HC Hollow Cathode
OHC Orificed Hollow Cathode
PIC Particle In Cell
RF Radio Frequency
1
1. INTRODUCTION
Thermionic hollow cathodes are being used in wide-variety of applications as
efficient electron sources. Ion and Hall thrusters require a particular device that can
provide electrons which are necessary for the ionization of the neutral propellant atoms
and neutralization of the ion beam leaving the thruster to avoid spacecraft charging.
Therefore, a specific component, such as a hollow cathode or in some other applications
a heated thermionic emitter wire [1, 2] must be added to thruster assembly to satisfy
the electron current requirement.
In early applications of ion thrusters, heated tungsten filaments was used as
electron source. It was necessary to operate the filaments at temperatures as high as
2600 K in order to obtain electron current densities about 1 A/cm2. Operating at such
high temperatures requires large amount of heat power which significantly reduces the
efficiency of the system. In addition, lifetime of tungsten filaments was limited due to
high operation temperatures which also limits the time of the space missions.
Insert Region Plasma
Insert
Propellant Cathode Plume Plasma
Keeper tube
Cathode tube
Heater Coil
Radiation heat shield
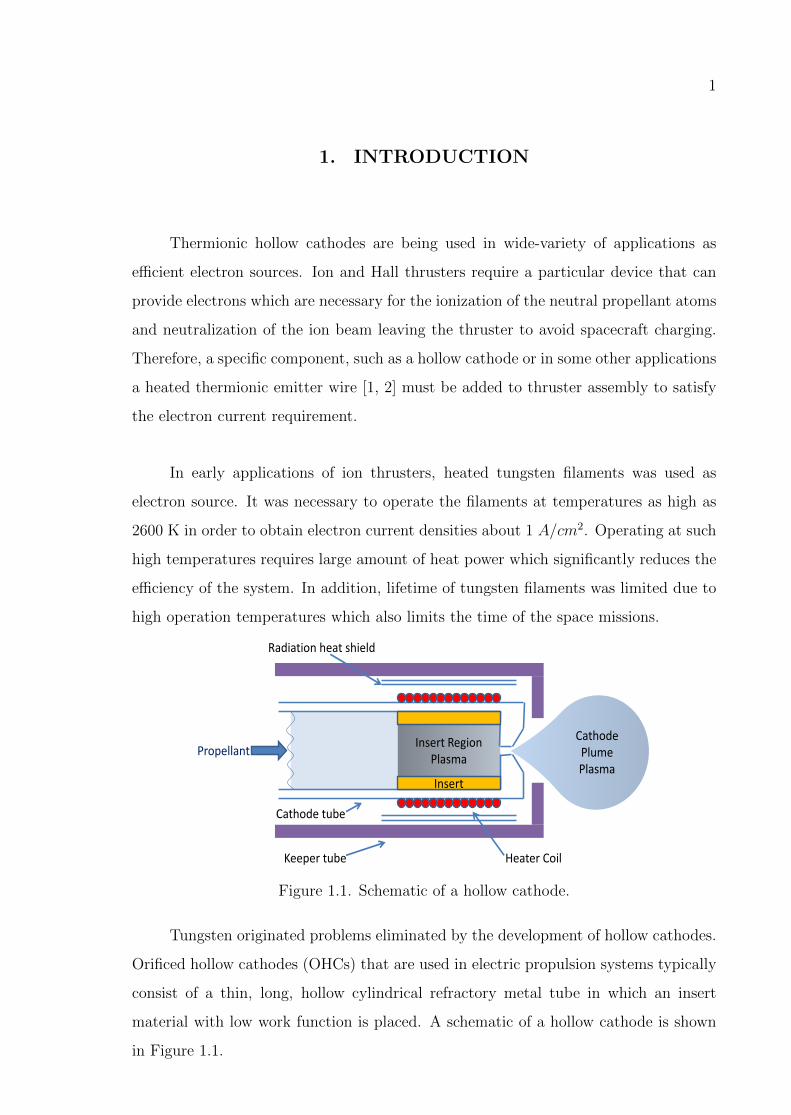
Figure 1.1. Schematic of a hollow cathode.
Tungsten originated problems eliminated by the development of hollow cathodes.
Orificed hollow cathodes (OHCs) that are used in electric propulsion systems typically
consist of a thin, long, hollow cylindrical refractory metal tube in which an insert
material with low work function is placed. A schematic of a hollow cathode is shown
in Figure 1.1.
2
Even tough an elaborate discussion of the parts and operation of hollow cathode
is given in the following sections, it is worthwhile to give a brief summary of the
parts of hollow cathode assembly. Three main parts of an OHC are insert, orifice and
keeper. Insert region is where emitter material is placed. The ease of electron release
from emitter material with thermionic emission determines the power consumption
and operation parameters of hollow cathode. Barium-Oxide impregnated tungsten
(BaO − W ), lanthanum hexaboride (LaB6) and cerium hexaboride (CeB6) are the
most common materials used as thermionic emitter in OHC [3]. BaO −W has work
function around 1.6 eV [4] and can provide sufficient electron current density under
1000C. However, this material can easily be poisoned by impurities in the propellant
gas, causing its work function to increase dramatically. For this reason, high purity
propellant usage has an extreme importance to ensure high lifetime in BaO−W OHC.
LaB6, on the other hand, is resistant against poisoning and also has low evaporation
rate which makes it a suitable material for long lifetime hollow cathodes [5]. The
work function of this material is around 2.67 eV [4]. Due to the fact that LaB6 has
higher work function than BaO−W material, it requires higher temperature to provide
same amount of current density. LaB6 reacts with many refractory materials such as
molybdenum. Therefore, extreme attention should be paid for selection of supportive
material of LaB6. For a review of various thermionic emitter materials, the reader
should look at Section 1.2.
Orifice, a refractory metal, is typically welded at the downstream end of the tube.
The reason for orifice utilization in OHC is to maintain high internal pressure, on the
order of 103 - 104 Pa. Moreover, orifice also contributes to heating of the emitter
material.
Cathode tube is enclosed with a cylindrical tube named as keeper tube. Keeper
provides an electric potential difference in order to attract the electron in the orifice
and insert region plasmas. Another task of the keeper tube is to prevent the cathode
from ion bombardment coming from thruster plasma.

3
Figure 1.2. Schematic of a typical ion thruster.
1.1. Hollow Cathode Applications in Electric Propulsion
1.1.1. Ion Thrusters
A Kaufman type ion thruster employs two hollow cathodes. One of the hollow
cathodes emits electrons which are necessary for the ionization of the propellant atoms
inside the discharge chamber of the ion thruster. Figure 1.2 shows the structure of a
Kaufman type ion thruster. Another one is used to neutralize the ion beam expelled out
of the ion thruster. The neutral propellant atoms (mostly xenon atoms) are injected
into the discharge chamber of the ion thruster. The discharge chamber is a cylindrical
shaped anode which also houses the centrally mounted hollow cathode. Magnetic field
is also applied in order to increase the length of the trajectory of electrons. Increasing
the length of the trajectory of electrons in discharge chamber leads to higher collisions
and therefore makes ion thruster more efficient. Generated ions in ionization chamber
are then accelerated by grids at the downstream end. The grids are biased at different
potentials. These expelled ions are then neutralized by the electrons emitted from
an external hollow cathode. Neutralization of the ion beam is necessary to prevent
spacecraft charging.

4
Figure 1.3. Schematic of a typical Hall effect thruster.
1.1.2. Hall Thrusters
The hollow cathode used in a Hall effect thruster works as both the discharge
cathode and the neutralizer cathode. Mostly only one hollow cathode is used in a
single-stage Hall thruster. A schematic of a typical Hall effect thruster can be seen in
Figure 1.3. The working principle of Hall effect thrusters is to ionize the propellant
and accelerate the charged particles to obtain thrust. Inner and outer electromagnets
are used to create radial magnetic field. The electrons emitted from the hollow cathode
are accelerated towards anode by the applied high voltage between anode and external
hollow cathode. These electrons begin to spiral in the direction perpendicular to the
applied magnetic field and electric field. When the propellant atoms are injected, they
collide with these electrons and as a consequence, ions are created. The ions are then
accelerated along the axial electric field. The ions expelled out of the thruster are
neutralized by the electrons emitted from the hollow cathode. Erosion of the dielectric
walls (boron nitride walls) due to sputtering determines the life of this thruster.

5
1.2. Hollow Cathode Construction
Generally, a hollow cathode consists of three main sections: emitter, orifice and
keeper. A cross-section view of a typical hollow cathode can be seen in Figure 1.4 and
a 3D CAD drawing of whole hollow cathode assembly can be seen in Figure 1.5.
Figure 1.4. Geometry of hollow cathode.
Figure 1.5. 3D CAD drawing of a typical hollow cathode assembly.
Insert material, which emits electrons with thermionic emission, is situated in the
emitter region. Heater coils, which are generally made of refractory materials such as
tungsten or tantalum, are wrapped around the cathode tube. Electrical current pro-
vided to these coils by an external power source supplies resistive heating mechanism.

6
Rather than direct heating, there are also different methods of heating the thermionic
emitter such as radiation heating, combination of radiation and electron heating [6, 7, 8]
in different applications. However, sheathed refractory metal wire wrapped around the
cathode tube is the most common way of heating in hollow cathodes.
Aside from classical heater design (wrapping sheathed refractory wire around
cathode tube), there are also different heater designs in the literature. The heater
designed at Massachusetts Institute of Technology [9] has a ceramic tube (boron nitride)
with helical grooves. Bare heater wire (instead of a sheathed one) is wrapped in this
grooves. 3D CAD drawing of this design can be seen in Figure 1.6. The heater designed
at the University of Michigan [10] has horizontal grooves that are machined on boron
nitride base. Similarly, bare heater wire is wrapped around these grooves. 3D CAD
drawing of this design is given in Figure 1.7.
Figure 1.6. Courtney’s heater design [9].
Figure 1.7. Heater design of University of Michigan [10].

7
The task of heater coils is to supply enough amount of heat to release sufficient
level of thermionic electron emission from insert. Therefore, utilization of low work
function insert is an important parameter to reduce the power consumption of hollow
cathode electron sources. In order to minimize heat loss due to radiative heat transfer,
a radiation shield is also mounted in the gap between heater coils and keeper tube.
After system reaches steady state regime, the heater is turned off. From this point
on, the necessary amount of heat, for the continuation of sufficient thermionic electron
emission from insert material, is provided by ion and electron bombardment of insert
surface, and conduction of heat from orifice [11, 12].
The propellant (generally xenon gas) is injected to the system from the base.
Neutral propellant atoms start to experience collisions when they reach emitter region.
The electrons, emitted from insert material via thermionic emission, hit the neutral
propellant atoms and cause ionization. The plasma created in the emitter region is
called insert plasma.
Another part of a typical hollow cathode is the cylindrical keeper tube which
is placed around the cathode tube. Main reason for keeper utilization is to create
an attracting potential difference for electrons. This potential difference generated
by biased keeper tube causes electrons to be extracted out of the cathode tube. At
initiation stage, the neutral propellant atoms injected from the upstream end of hollow
cathode experience collisions with thermionically emitted electrons when they reach
insert region. As a consequence of these collisions between neutral atoms and emitted
electrons, a dense plasma is created in the emitter region. After steady state operation
is achieved, keeper is used for regulating the electron discharge. Keeper also prevents
the cathode assembly from the damage that ion bombardment coming from thruster
plasma can cause. Usage of a keeper also helps maintain high insert temperature [13].
The circuit diagram of a typical hollow cathode experimental setup can be seen in
Figure 1.8.
Thermionic emitter material plays a significant role on power consumption and
operating parameters of hollow cathodes. The first concern of selection of emissive

8
Figure 1.8. Electrical circuit diagram of hollow cathode.
material is that it should have low work function. In other words, it should give high
emission current at low temperatures. Low work function, along with evaporation
rate and poisoning resistance against the impurities in the propellant are important
parameters in emitter material selection. Several materials have been used as insert
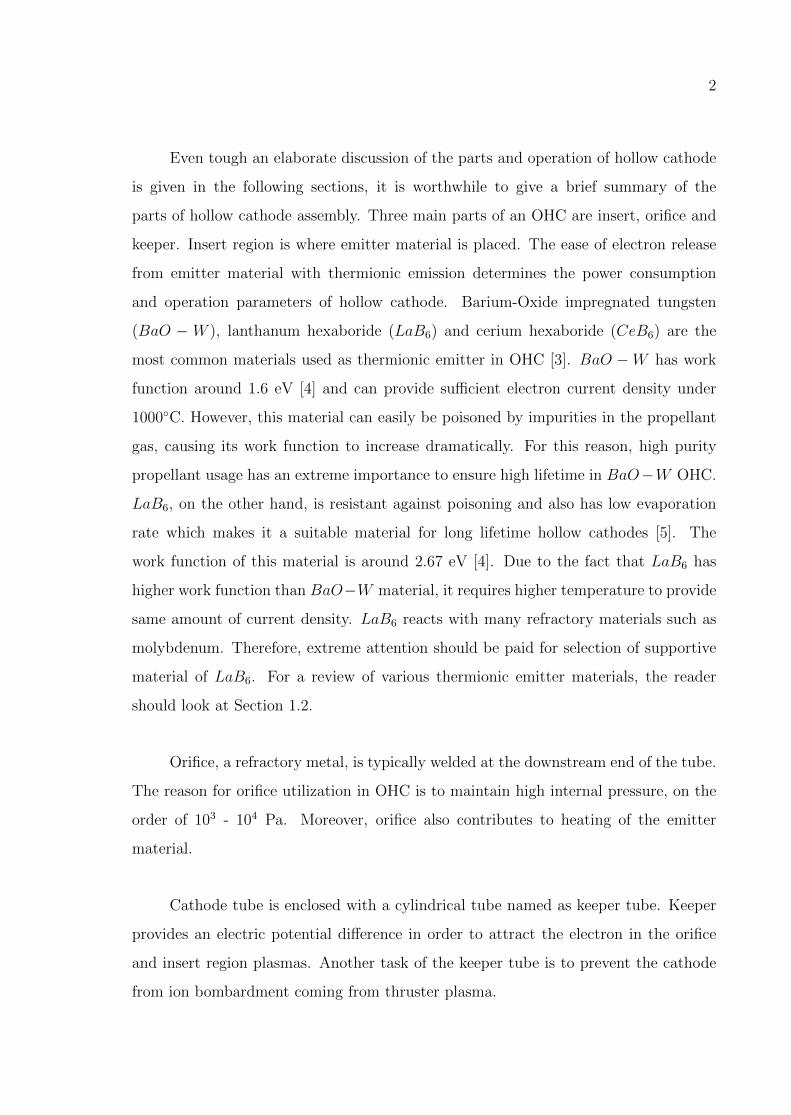
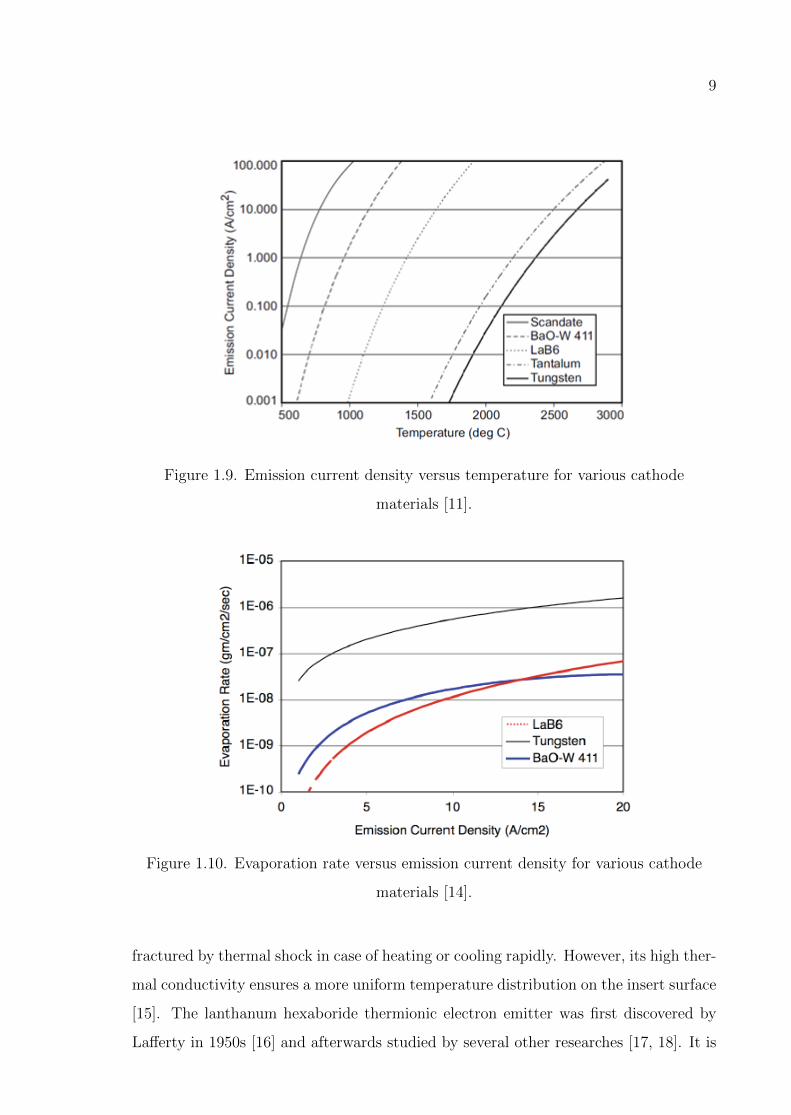
material. Emission current densities of several thermionic materials with respect to
temperature can be seen in Figure 1.9 and evaporation rate of several materials are
given in Figure 1.10.
Refractory metal cathodes such as tungsten requires high heater power and have
limited lifetimes due to their high evaporation rates. Especially for high electron current
demanding applications such as ion sources, plasma generators, ion lasers refractory
metal cathodes are not suitable candidates for electron emission. On the other hand,
LaB6 can provide high current densities, low evaporation rates and resistance to poi-
soning. LaB6 has a work function of 2.67 eV depending on the surface stoichiometry.
LaB6 can emit 10 A/cm2 at temperature 1650C. Unfortunately, LaB6 can be easily
9
Figure 1.9. Emission current density versus temperature for various cathode
materials [11].
Figure 1.10. Evaporation rate versus emission current density for various cathode
materials [14].
fractured by thermal shock in case of heating or cooling rapidly. However, its high ther-
mal conductivity ensures a more uniform temperature distribution on the insert surface
[15]. The lanthanum hexaboride thermionic electron emitter was first discovered by
Lafferty in 1950s [16] and afterwards studied by several other researches [17, 18]. It is

10
started to be used in hollow cathodes in 1970s [4]. Hollow cathodes with LaB6 insert
material has a long application history in Russia. Hundreds of LaB6 cathodes have
been used in Russian Hall thrusters [19, 20]. Goebel used LaB6 cathode for the first
time in the United States [15]. The lanthanum boride compounds can be divided into
three categories, LaB4, LaB6, LaB9, where their composition can be identified with
the surface color. LaB6 has purple, LaB4 has grey and LaB9 has blue surface color
[21].
Lanthanum hexaboride is a reactive material with refractory metals such as tung-
sten. Boron coming from LaB6 diffuses to the refractory metal, which is used to sup-
port LaB6 in its position, and forms interstitial boron compounds in metal lattices.
The boron diffusion embrittles the refractory materials at high temperatures and cause
structural failure. Thus, Lafferty [16] states that this material needs to be supported
by materials which obstruct diffusion of boron towards the support material. To avoid
these negative circumstances, LaB6 is mostly supported by materials such as carbon,
tantalum carbide and rhenium. Tungsten-boron and molybdenum-boron compounds
were seen as a thick white powder on the emitter surface when one of them (tungsten
or molybdenum) was used to support the LaB6 [22]. In order to reduce the chemical
reactions, rhenium and tantalum carbide can be used as support material.
Rhenium metal has hexagonal closed packed lattice structure which does not
allow interstitial diffusion of boron atoms into the lattice which makes it a good support
material for LaB6. Moreover, it has a high melting point of 3180C and low vapour
pressure [23].
Particularly, molybdenum is a poisonous metal to LaB6 due to the formation of
molybdenum borides and thus increase in the work function. The work function of
LaB6 with a clean surface was reported as 2.36 eV and Richardson constant of 120
A/cm2K2 [24]. It was seen that the work function of LaB6 does not change dramatically
even though it is exposed to surface impurities which can be considered as an evidence
of the fact that LaB6 can perform well even in poisonous environment [24, 25].

11
Graphite totally eliminates the problems related to chemical reactions. Graphite
has a slightly greater thermal expansion coefficient than LaB6 and also its electrical
contact, mechanical stability is suitable for operation at high temperatures [4, 26]. As a
matter of fact whole cathode assembly, especially thermionic emitter and orifice, works
at high temperatures (around 1500 K), thermal properties of the materials working
together in the assembly is an important parameter. Since thermal properties of certain
grades of graphite is similar to those of LaB6 and it does not react with LaB6, graphite
is a good option to be used as supporting material [22, 26].
Apart from different support materials, different support structure constructions
have also been tried in order to eliminate the problems due to chemical reactions.
Broers [8] developed a construction in which only some portion of the cathode is heated
by a tungsten coil wrapped around. This tungsten coil heater is not in contact with
the emitting part of the cathode.
Another emissive material, which does not have as widely usage in hollow cath-
odes as LaB6, is CeB6. The work function of CeB6 is slightly lower than LaB6. CeB6
has a work function of between 2.5-2.62 eV (depending on the surface stoichiometry).
At similar current densities, it has a lower evaporation rate in comparison to LaB6.
This emissive material is also resistant against poisoning [27]. This emissive material
does not have a long application history in hollow cathodes but preliminary investiga-
tions point out that this material is a promising cathode emitter [27].
Another material that can be used as emitter is barium oxide (BaO). These so
called “oxide cathodes” or “dispenser cathodes” have work function less than 2 eV
and they can produce high current densities. The reason why this type of cathodes
are called as dispenser cathodes is that in this configuration, there is a porous matrix
which is used as a reservoir for emissive material (barium oxide) that dispenses through
the pores on the matrix. There are two groups of dispenser cathodes. The first ones
are cavity reservoir dispenser cathodes and the second ones are impregnated dispenser
cathodes [28].
12
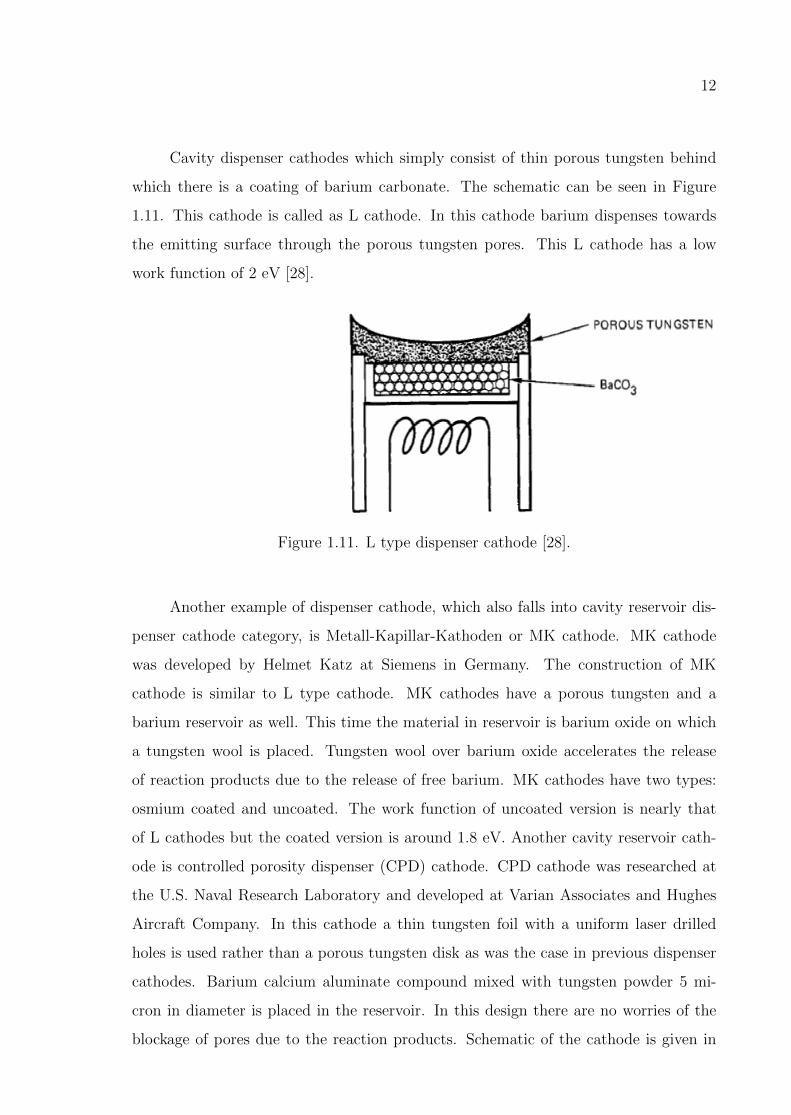
Cavity dispenser cathodes which simply consist of thin porous tungsten behind
which there is a coating of barium carbonate. The schematic can be seen in Figure
1.11. This cathode is called as L cathode. In this cathode barium dispenses towards
the emitting surface through the porous tungsten pores. This L cathode has a low
work function of 2 eV [28].
Figure 1.11. L type dispenser cathode [28].
Another example of dispenser cathode, which also falls into cavity reservoir dis-
penser cathode category, is Metall-Kapillar-Kathoden or MK cathode. MK cathode
was developed by Helmet Katz at Siemens in Germany. The construction of MK
cathode is similar to L type cathode. MK cathodes have a porous tungsten and a
barium reservoir as well. This time the material in reservoir is barium oxide on which
a tungsten wool is placed. Tungsten wool over barium oxide accelerates the release
of reaction products due to the release of free barium. MK cathodes have two types:
osmium coated and uncoated. The work function of uncoated version is nearly that
of L cathodes but the coated version is around 1.8 eV. Another cavity reservoir cath-
ode is controlled porosity dispenser (CPD) cathode. CPD cathode was researched at
the U.S. Naval Research Laboratory and developed at Varian Associates and Hughes
Aircraft Company. In this cathode a thin tungsten foil with a uniform laser drilled
holes is used rather than a porous tungsten disk as was the case in previous dispenser
cathodes. Barium calcium aluminate compound mixed with tungsten powder 5 mi-
cron in diameter is placed in the reservoir. In this design there are no worries of the
blockage of pores due to the reaction products. Schematic of the cathode is given in
13
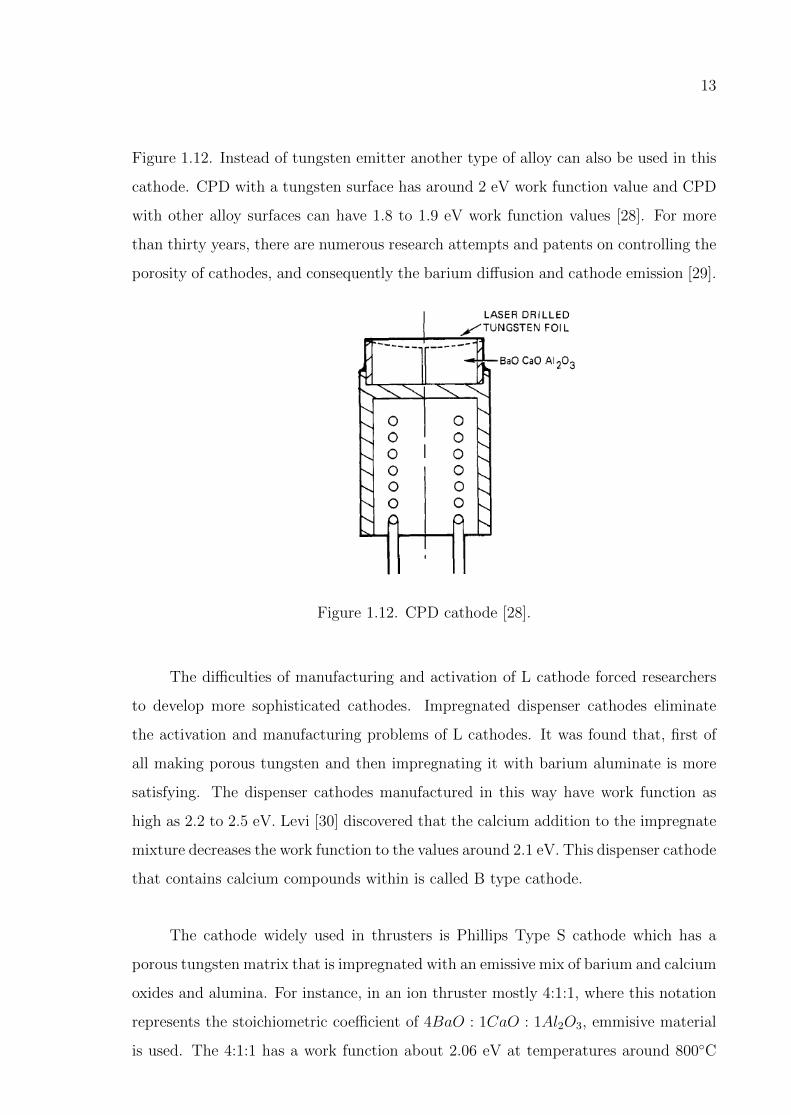
Figure 1.12. Instead of tungsten emitter another type of alloy can also be used in this
cathode. CPD with a tungsten surface has around 2 eV work function value and CPD
with other alloy surfaces can have 1.8 to 1.9 eV work function values [28]. For more
than thirty years, there are numerous research attempts and patents on controlling the
porosity of cathodes, and consequently the barium diffusion and cathode emission [29].
Figure 1.12. CPD cathode [28].
The difficulties of manufacturing and activation of L cathode forced researchers
to develop more sophisticated cathodes. Impregnated dispenser cathodes eliminate
the activation and manufacturing problems of L cathodes. It was found that, first of
all making porous tungsten and then impregnating it with barium aluminate is more
satisfying. The dispenser cathodes manufactured in this way have work function as
high as 2.2 to 2.5 eV. Levi [30] discovered that the calcium addition to the impregnate
mixture decreases the work function to the values around 2.1 eV. This dispenser cathode
that contains calcium compounds within is called B type cathode.
The cathode widely used in thrusters is Phillips Type S cathode which has a
porous tungsten matrix that is impregnated with an emissive mix of barium and calcium
oxides and alumina. For instance, in an ion thruster mostly 4:1:1, where this notation
represents the stoichiometric coefficient of 4BaO : 1CaO : 1Al2O3, emmisive material
is used. The 4:1:1 has a work function about 2.06 eV at temperatures around 800C

14
[11, 31, 32]. Other commonly encountered impregnate compositions are 5:3:2 and 3:1:1.
The most significant shortcoming of BaO emitters is that they are prone to poisoning
due to impurities present in the propellant. Poisoning on the dispenser cathode can
increase the work function and shorten the lifetime of the system. In the systems
operating with BaO emitter, special care must be taken in order to prevent poisoning.
Need of high purity propellant usage (about 99.999%) demands propellant purification
system which causes a financial burden of 0.5-1 M$ per spacecraft [33].
The barium impregnated emitters require a special conditioning procedure prior
to operation and in case of any exposure to atmosphere. After the system is evacuated
to the pressures less than 1.3× 10⁻⁴ Pa for at least 12 hours, the insert is heated
to around 500 C and kept at this temperature for three hours. Subsequently, the
cathode heater is turned off for 30 minutes. Eventually, after heating the insert to
a temperature around 1000 C and keeping it at this temperature for one hour, it is
allowed to cool down for 30 minutes. The purpose of this whole conditioning process
is to eliminate the absorbed carbon dioxide and water in the insert material and make
its surface ready for thermionic emission [34]. LaB6 emitter, on the other hand, does
not require any special conditioning procedure [27].
Another type of emitter is mixed metal matrix cathodes. According to the ex-
periments, it is observed that the work function can be reduced if the tungsten matrix
is introduced with refractory materials such as osmium, rhenium, iridium, dispenser
cathode can have work function less than 1.9 eV. Mixed metal matrix cathodes are
similar to conventional cathodes except for the usage of porous tungsten iridium (W-
I) alloy as surface. In this type of matrix, less work function can be obtained which
reduces the required temperature for a given emission current density [33].
Orifice is a refractory plate welded at the cathode tube exit. Orifice helps main-
taining high internal pressures around 103 − 104 Pa. The pressure inside the cathode
must be high enough to create a collisional plasma. Hollow cathodes can be categorised
under three classes in terms of the orifice geometry as shown in Figure 1.13. First type
(Type A) has a small orifice with a large length to diameter ratio. This type of cathode

15
Figure 1.13. Different orifice constructions.
is operated at low current and high internal gas temperatures and heated by orifice
heating. Second type of hollow cathode (Type B) has an orifice diameter larger than
length and operate at lower gas pressures. Insert heating is provided with ion or elec-
tron bombardment, or depending on the orifice size and operating temperatures these
two heating systems are used together. Third type of hollow cathode (Type C) has no
orifice. In this design large neutral density gradient can be obtained however internal
pressure is lower. The heating mechanism for third type cathodes is ion bombardment
of the insert [11].
1.3. Overview of Hollow Cathode Physics
During the operation of a hollow cathode, there are two plasma regions, orifice
and insert (emitter) plasma, in the interior of this device. The schematic of the plasma
regions in an operating hollow cathode can be seen in Figure 1.14.
Creation of plasma in the hollow cathode requires ionization of the propellant gas.
The electrons which ionize the propellant atoms are provided to the system from insert
material by thermionic emission. At the initiation of the system, the insert is heated
up to a temperature (typically between 1300 K and 1900 K) with an external heater
wrapped around the refractory cathode tube. At this temperature the insert material
starts to emit electrons. After electron emission begins, the propellant (generally xenon
16
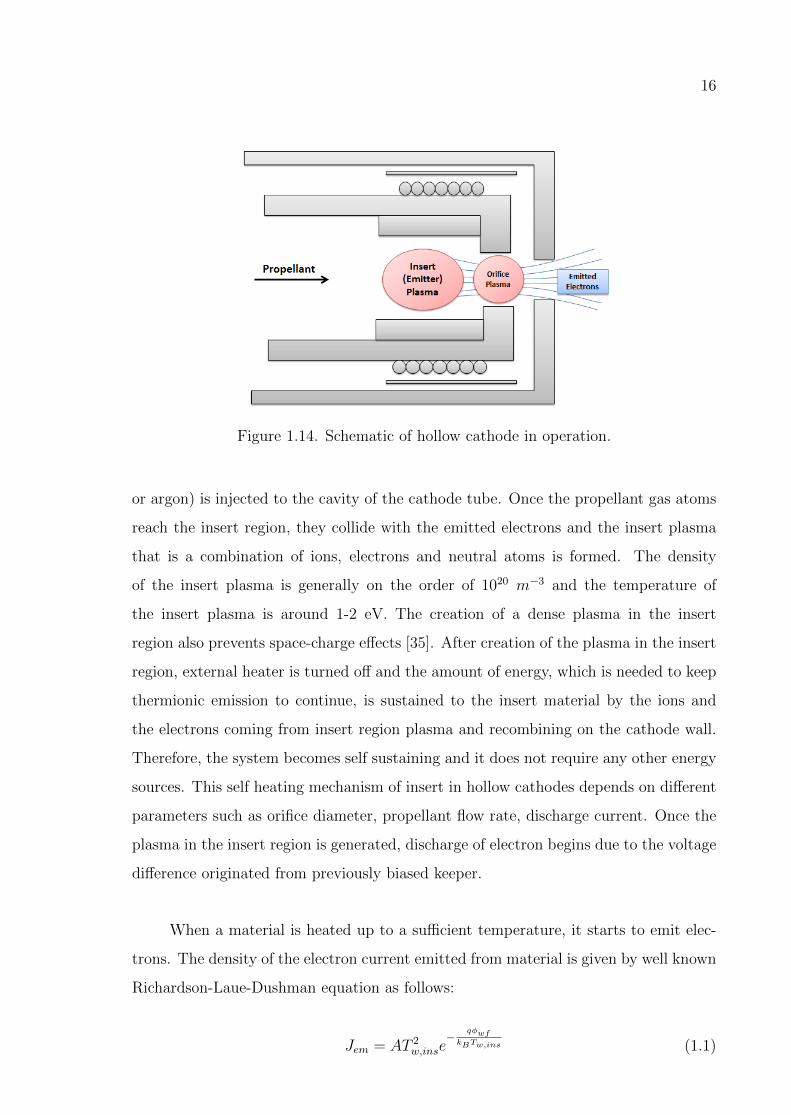
Figure 1.14. Schematic of hollow cathode in operation.
or argon) is injected to the cavity of the cathode tube. Once the propellant gas atoms
reach the insert region, they collide with the emitted electrons and the insert plasma
that is a combination of ions, electrons and neutral atoms is formed. The density
of the insert plasma is generally on the order of 1020 m−3 and the temperature of
the insert plasma is around 1-2 eV. The creation of a dense plasma in the insert
region also prevents space-charge effects [35]. After creation of the plasma in the insert
region, external heater is turned off and the amount of energy, which is needed to keep
thermionic emission to continue, is sustained to the insert material by the ions and
the electrons coming from insert region plasma and recombining on the cathode wall.
Therefore, the system becomes self sustaining and it does not require any other energy
sources. This self heating mechanism of insert in hollow cathodes depends on different
parameters such as orifice diameter, propellant flow rate, discharge current. Once the
plasma in the insert region is generated, discharge of electron begins due to the voltage
difference originated from previously biased keeper.
When a material is heated up to a sufficient temperature, it starts to emit elec-
trons. The density of the electron current emitted from material is given by well known
Richardson-Laue-Dushman equation as follows:
Jem = AT 2w,inse
−qφwf
kBTw,ins (1.1)

17
In Equation 1.2, Richardson constant, A, is equal to 120 Acm−2K−2, Tw,ins is
the surface temperature of the emitting material in K, φwf is a material dependent
quantity known as work function in eV and kB is Boltzmann’s constant [11]. Derivation
of Richardson-Laue-Dushman equation with thermodynamic approach can be found in
Appendix B. Emission of electrons from insert material creates a negative potential on
the insert surface. Thus, a sheath region develops on the insert material in order to
balance electron and ion fluxes to the surface. Figure 1.15 shows the structure of this
sheath. The sheath region present on the insert surface creates a retarding potential
region for electrons. Hence, electrons coming from insert plasma must carry enough
energy to overcome this retarding potential and reach the insert surface. The thickness
of this sheath is on the order of several Debye lengths.
Figure 1.15. Schematic of sheath region developing on the insert material.
In the sheath region that develops on the insert material, a non-zero electric field,
Es, is created. This electric field acting on the emitter surface reduces the apparent
work function of the material, and thus enhances the thermionic emission. The effective
work function of the emitter material under an electric field can be calculated by the
Schottky equation as follows:
φeff = φwf −√qEs4πε0
(1.2)
18
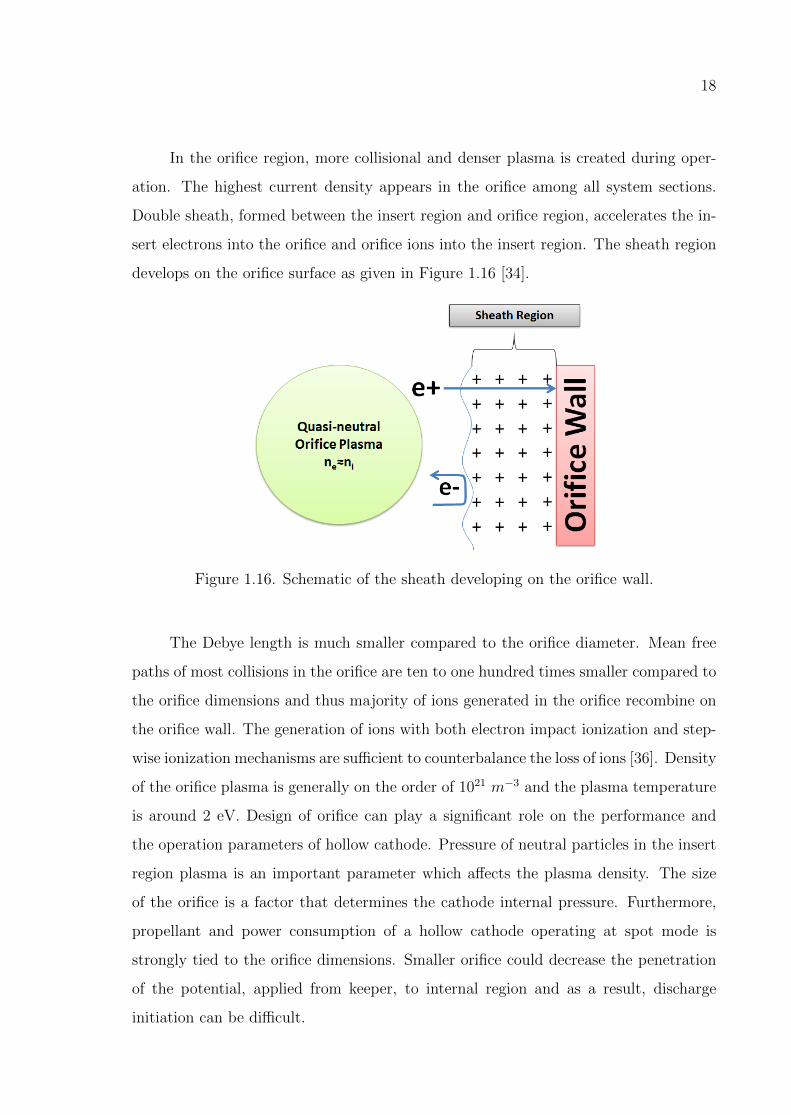
In the orifice region, more collisional and denser plasma is created during oper-
ation. The highest current density appears in the orifice among all system sections.
Double sheath, formed between the insert region and orifice region, accelerates the in-
sert electrons into the orifice and orifice ions into the insert region. The sheath region
develops on the orifice surface as given in Figure 1.16 [34].
Figure 1.16. Schematic of the sheath developing on the orifice wall.
The Debye length is much smaller compared to the orifice diameter. Mean free
paths of most collisions in the orifice are ten to one hundred times smaller compared to
the orifice dimensions and thus majority of ions generated in the orifice recombine on
the orifice wall. The generation of ions with both electron impact ionization and step-
wise ionization mechanisms are sufficient to counterbalance the loss of ions [36]. Density
of the orifice plasma is generally on the order of 1021 m−3 and the plasma temperature
is around 2 eV. Design of orifice can play a significant role on the performance and
the operation parameters of hollow cathode. Pressure of neutral particles in the insert
region plasma is an important parameter which affects the plasma density. The size
of the orifice is a factor that determines the cathode internal pressure. Furthermore,
propellant and power consumption of a hollow cathode operating at spot mode is
strongly tied to the orifice dimensions. Smaller orifice could decrease the penetration
of the potential, applied from keeper, to internal region and as a result, discharge
initiation can be difficult.

19
Figure 1.17. Axial plasma density and plasma temperature profile along hollow
cathode regions [37, 38, 39].
Explaining briefly the plasma conditions in the hollow cathode would also be
beneficial in order to understand the hollow cathode operation. The axial electron
temperature and density of the plasmas in the distinct regions of hollow cathode are
given in Figure 1.17. The axial density of the insert plasma increases in the region close
to the orifice entrance. A peak in the plasma density is seen in the orifice region. In the
gap between orifice and keeper, a sharp decrease in the plasma electron density occurs.
The plasma temperature in the insert region is around 1 eV. Due to the presence of more
collisional and denser plasma in the orifice region, the plasma electron temperature
increases. In the interior region of an OHC, the electron temperature increases due to
classical collisions. However, in the vicinity of the orifice, the electrons are heated up
due to electrostatic instabilities [39].
1.4. Plume and Spot Mode Operation of Hollow Cathodes
Operation of hollow cathodes at spot and plume modes is important for perfor-
mance characterization of these devices. At spot mode operation the voltage is weakly
dependent on the flow rate. Another characterization of spot mode is also defined as

20
observing small, luminous region at the orifice exit and having negligible AC compo-
nents in discharge voltage. At spot mode operation, the plasma present in the gap
between orifice to keeper has sufficient density so that the required amount of current
can be collected passively at the keeper or anode. At spot mode operation, negligible
voltage fluctuation is observed. This operation mode can be achieved at high current
and high flow rates. At this operation mode, a quasi-neutral plasma is present, accom-
panying a small sheath region developed around keeper orifice, between the orifice and
the keeper [34, 40].
At low currents and flow rates, the collection of electrons at keeper is not suffi-
cient. Therefore, sheath thickness increases in order to attract the electrons towards
the keeper or the anode. This mode of operation is called plume mode. At plume
mode operation, a luminous region occurs in front of the orifice region and beyond the
keeper orifice [9, 36]. Another characteristic of plume mode operation is high discharge
voltages and large fluctuations in voltage which is necessary to obtain desired current.
Furthermore, electron temperatures increase at plume mode operation because of the
reduced inelastic collisions and the low density [41]. Due to high voltage demand at
plume mode operation, the power consumption of cathode increases. Another short-
coming of operation at plume mode is that ions repelled by keeper cause sputtering
on orifice of the cathode [42]. Therefore, plume mode operation reduces the lifetime of
hollow cathode.
1.5. Literature Review
Since hollow cathodes have been under investigation, numerous studies have been
published in order to assess the plasma parameters in these devices. In the study pub-
lished by Katz et al. [43], sensitivity of hollow cathode, operating in spot mode, to
orifice diameter, orifice length, propellant mass flow rate and keeper current was in-
vestigated. In this parametric study, ion temperature and neutral temperature are
assumed to be 0.1 eV. The plasma energy gain due to ohmic heating is equated with
ionization loss, excitation loss and electron convection loss. The orifice plasma temper-
ature and plasma density were varied until ion loss balances ion gain, and energy loss

21
equals to energy gain. Different parameters such as orifice length, discharge current
are doubled to see the influence on hollow cathode and some of the results are given in
Table 1.1.
Table 1.1. Calculated results for varying model parameters [43].
Diameter
[mm]
Length
[mm]
Discharge
[A]
Mass Flow
Rate [sccm]
I2R
[W]
Energy For Each
Ion Generation [eV/ion]
1 6 1 2 22.31 3.952
1 12 1 2 44.26 7.315
0.7 6 1 2 40.44 5.312
1 6 1 4 25.10 4.270
1 6 2 2 35.06 2.879
Another modelling attempt of orificed hollow cathode was published in 2012 by
researchers from Israel Institute of Technology [44]. A zero dimensional (0-D) model
for orifice plasma was developed for large aspect ratio cathodes (L/2r). In this model,
some plasma parameters are considered as nonuniform. The electron temperature,
neutral gas temperature, electron current, axial neutral gas velocity (Te, T0, Ie, u0) are
taken as constant in the orifice. Neutral density and neutral gas velocity vary only
in axial direction. The plasma density in the orifice changes in both axial and radial
directions, n(r, z). The equations of motion for ions and neutrals are defined in terms
of averaged parameters in order to come up with a set of algebraic equations. Even
tough it is a zero dimensional model, the plasma parameters show good agreement
with two dimensional (2-D) models. Moreover, its computational time is much shorter
than one dimensional (1-D) or 2-D models.
Most recent study on 0-D modelling of hollow cathode is published in 2013 by
Italian researchers in Alta group [45]. The most prominent feature of this model is
that it does not require any kind of external input such as experimental data. This
model consists of three main parts; orifice model, emitter model and thermal model.
The plasma density, electron temperature, neutral density in the orifice and emitter
regions are obtained after orifice and emitter iterations. The thermal model is used to
obtain temperature along the cathode. The cathode is considered as if it is composed
22
of several sub elements which are in contact with each other with perfect gluing and
the thermal network between these sub elements are developed. The ion conservation,
plasma energy balance and pressure balance equations are solved in the orifice region.
Even tough the continuum assumption is not valid in orifice region (0.01 < Kn < 0.05),
the pressure equation equates the pressure of a continuum flow with the one calculated
from kinetic theory of gases. Similarly, in addition to ion conservation, plasma energy
balance and pressure balance equations, current density equation is also solved in the
emitter model. The nonlinear equation sets that occur as a result of governing equations
in the emitter and orifice regions are solved by using Matlab fsolve command. Despite
the fact that this model cannot answer the significant changes in geometry, mass flow
rate and discharge current, it is the most comprehensive 0-D model of hollow cathode.
The effect of the viscosity is not taken into account in this study. This is another
shortcoming of this model since it can increase the inner pressure and neutral density
by 50% [46].
In addition to zero dimensional models, there is also a one dimensional hollow
cathode model in the literature. In the study published by Katz et al. in 2003 [37],
a one dimensional hollow cathode model is developed based on the observation that
ion mobility is diffusion limited. The continuity equations written for electrons, ions
and neutrals, ion and electron momentum equations, energy equation for electrons are
solved for modelling the hollow cathode plasmas. In this model, chamfered region
next to the orifice is also taken into account. It is assumed that electrons behave as
fluid. Orifice plasma loses xenon atoms and electrons from downstream, and xenon ions
both from downstream and upstream. For insert region, isothermal ambipolar diffusion
equation in two dimensions is solved to obtain the spatial distribution of insert plasma
density.
Apart from zero dimensional and one dimensional modelling, there are also two
dimensional modelling studies in the literature. Mikellides et al. developed a two di-
mensional axisymmetric model (Orifice Cathode OrCa2D) for OHCs with two different
geometries [35, 38]. The modelled cathode diameters are 0.635 cm and 1.5 cm with
a length of 2.54 cm, orifice diameter of 0.1 cm and 0.3 cm. The plasma is considered

23
as fluid, and governing equation are solved in a 2D computational domain in order to
obtain two dimensional distribution of plasma density, electron current density, plasma
temperature, electric field, plasma potential, neutral density and temperature of heavy
particles. At the orifice entrance, plasma density and potential are set according to
the experimental values and adiabatic condition is applied for electron temperature.
At the cathode inlet, heavy species are considered at the wall temperature, adiabatic
condition is applied for electrons and no electron flux is allowed. At orifice wall, zero
electron emission is considered and temperature of the heavy particles is assumed to
be equal to the wall temperature. After implementation of boundary condition and
solution of governing equations with finite volume method, it is found that the neutral
gas heating mechanisms is dominated by resonant charge-exchange collisions between
fast ions and slow neutrals in case of inviscid flow.
As an extention of the OrCa2D model, several studies have been also published
to assess different aspects. For instance, in the study published by Mikellides [47], the
main goal was to asses the effect of viscosity. The governing equations are solved by
finite volume approach for species present in the plasma after addition of viscous term
in neutral momentum equation. The results, obtained by comparing the viscous and
inviscid solutions, showed that viscosity has a significant influence on the flow field of
the atomic species. Cathode internal pressure is found to be more than 40% higher
than the inviscid solution. As a result, the force due to pressure gradient is larger than
the drag force due to ion-atom collisions and reverses the flow field towards the cathode
orifice region. On the other hand, it is found that the ions remain unaffected by viscous
effect because motion of these species are mostly driven by electric field in the plasma
and sheath regions instead of collisional drag forces. In another study published by
Mikellides et al. [39], it was shown by the experimental measurements and numerical
simulations, conducted on a 1.5 cm diameter hollow cathode operating at 25-27.5 A
discharge current and 5.5 sccm xenon flow rate, that in the vicinity of the orifice, the
electrons are heated up by electrostatic instabilities. Therefore, heating of electrons
cannot be accounted by classical transport and Ohm’s law. In this manner, there are
several studies published in extension of OrCa2D by Mikellides et al. [46, 48, 49] and
by Katz et al. [50].
24
Boyd & Crofton [51] developed a hybrid Particle in Cell (PIC) model for the
plasma plume of an orificed hollow cathode. The hollow cathode modelled in this study
has an impregnated tungsten dispenser whose inner diameter is 1 mm, outer diameter
is 2.8 mm and length is 11 mm. The orifice diameter is 0.2 mm and length is 1 mm.
The downstream of the orifice has a full-angle 90 chamfer. In this study, electrons
are modelled by fluid equations, while heavy particles (ions and neutrals) are modelled
kinetically using PIC method. Plasma density and plasma electron temperature at the
HC exit are used as boundary conditions in PIC model.
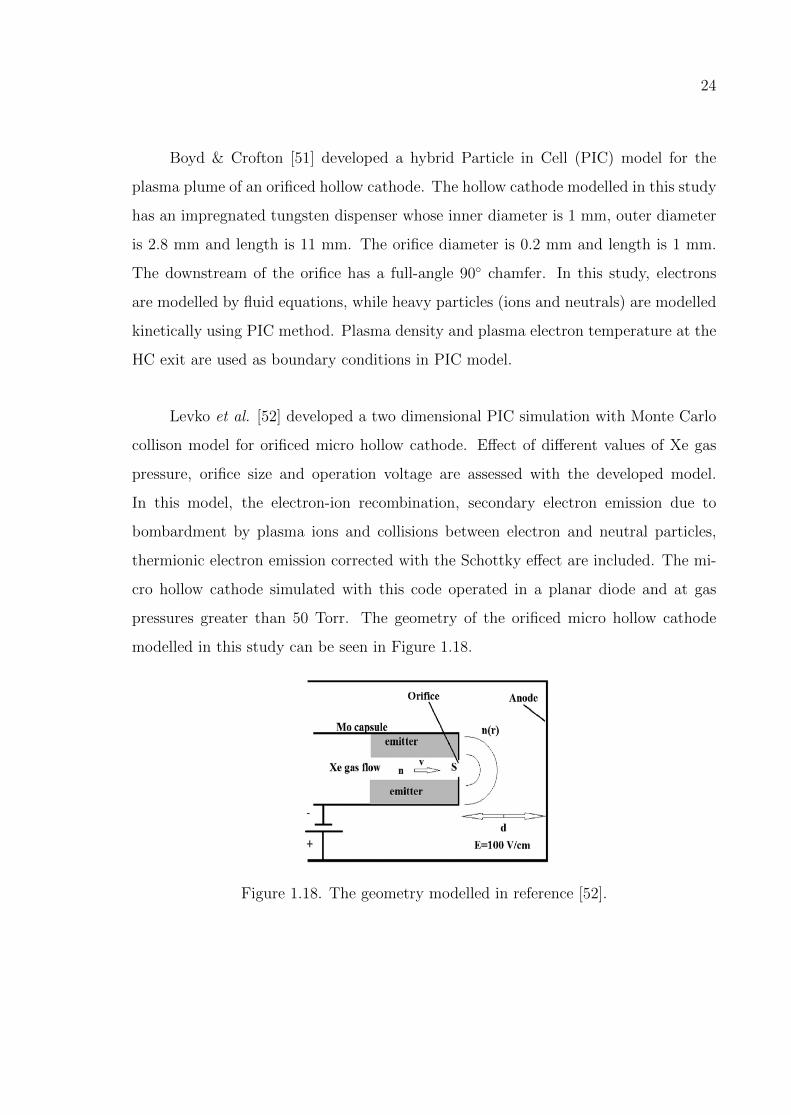
Levko et al. [52] developed a two dimensional PIC simulation with Monte Carlo
collison model for orificed micro hollow cathode. Effect of different values of Xe gas
pressure, orifice size and operation voltage are assessed with the developed model.
In this model, the electron-ion recombination, secondary electron emission due to
bombardment by plasma ions and collisions between electron and neutral particles,
thermionic electron emission corrected with the Schottky effect are included. The mi-
cro hollow cathode simulated with this code operated in a planar diode and at gas
pressures greater than 50 Torr. The geometry of the orificed micro hollow cathode
modelled in this study can be seen in Figure 1.18.
Figure 1.18. The geometry modelled in reference [52].
25
2. GLOBAL NUMERICAL MODEL FOR ORIFICED
HOLLOW CATHODE
As mentioned before, modelling of the hollow cathode is important in order to
understand the behaviour of this device and also results of the models can give vital
information for building better systems. The theoretical modelling can give valuable
clues about the effect of the geometry and operating conditions on the cathode be-
haviour, power consumption and lifetime. Mainly, the goal of the modelling attempts
is to obtain main plasma parameters such as electron, neutral, ion density and tem-
perature in the insert and orifice regions.
Since operation conditions and geometry are important for cathode performance
[42], the primary aim of the developed model is to assess the cathode for different
geometry and operating conditions. A quasi-neutral plasma with uniform plasma pa-
rameters (electron density, electron temperature, neutral density etc.) in both emitter
and orifice region is assumed in this model. Orifice and emitter plasmas consist of a
combination of thermalized electrons, singly-charged ions and neutrals, and they are
enclosed within a hypothetical cylindrical control volume. The model considers that
the particles in both plasma regions have Maxwellian distribution. In the model, it is
assumed that the heavy particles, namely neutrals and ions, have the same temperature
with the cathode wall. The developed model follows the previous studies of different
researchers [11, 34, 45].
2.1. Insert Model
Considering steady state operation, ion balance, insert plasma power balance and
current balance equations are solved in the hypothetical control volume enclosing the
insert plasma as schematically shown in Figure 2.1. Eventual goal of the insert plasma
model is to compute the plasma number density, plasma electron temperature, emitter
wall temperature, and the influence of the operation conditions and geometry on insert

26
plasma parameters and emitter wall temperature.
Figure 2.1. Insert plasma control volume.
2.1.1. Ion Conservation
There are two types of electron populations that can cause ionization events in
the insert region: low-temperature electrons emitted from the insert material with
thermionic emission and the Maxwellian plasma electrons present in the insert plasma.
The energy spent for ionization and excitation events due to the Maxwellian electrons
can be evaluated as follows:
(dnidt
)ionization
qUi = qπr2eLemitUiNene〈σve〉 [W ] (2.1)
(dnexcdt
)excitation
qUexc = qπr2eLemitUiNene〈σ∗ve〉 [W ] (2.2)
According to [34], the electron-impact ionization due to the electrons emitted from
insert material is negligible. Therefore, ionization mechanisms in the insert plasma
are electron-impact and stepwise ionization due to Maxwellian electrons in the insert
plasma, and stepwise ionization due to primary electrons (electrons emitted from insert
material).

27
The ionization term in the ion conservation equation considers only the electron-
impact ionization from the ground state, and stepwise ionization processes are ne-
glected. As shown in Figure 2.2, the ion loss mechanism in this region is the thermal
flux of ions towards the cathode base and the strike of ions to the surface of the insert
material and orifice wall. The ion generation mechanism, on the other hand, is ion
production due to the electron impact ionization. The ion conservation in steady-state
operation is given as:
qπr2eLemitNene〈σve〉︸ ︷︷ ︸
Ion generation withelectron impact ionization
= Ji,Th(πr2
e
)︸ ︷︷ ︸Thermal ion loss
to upstream
+ Ji,Bohm(2πreLemit + πr2
e
)︸ ︷︷ ︸Ion loss to insert surface
and to orifice region
(2.3)
The left hand-side of Equation 2.3 represents the amount of ion produced by electron
impact ionization from the ground state. Here, ne and Ne represents plasma density
and neutral density of emitter region plasma, respectively. The first term on the right
hand side stands for the thermally lost ions to upstream and the second term on the
right hand side shows the ion loss to the insert surface and orifice wall. Even tough, it
is speculated by [53] and experimentally observed by [54] that a double layer is formed
at the constriction between insert and orifice region plasma, effect of this double layer
structure is not taken into account in Equation 2.3. As found in studies [44] and [46]
for xenon flow rate higher than 1 sccm, neutral gas flow sweeps the ions from insert to
orifice. Thus, this is also accounted in the ion conservation Equation 2.3. Therefore,
this model is expected to be more accurate for flow rates greater than 1 sccm.
Figure 2.2. Mobility of ions in the emitter region.

28
The ionization rate function, as a function of electron temperature, TeV , is cal-
culated according to the expression given in [11] as follows:
〈σve〉 = 10−20[(
3.97 + 0.643TeV − 0.0368T 2eV
)e
−12.127TeV
](8qTeVπme
)1/2 [m3
s
](2.4)
2.1.2. Insert Plasma Energy Balance
Apart from ion conservation, energy balance equation of the emitter plasma is
also solved. The energy balance for the insert region plasma involves all the energy
that comes in and out of the plasma region. In the insert region of the hollow cathode,
the energy gain of the plasma due to ohmic heating and thermionic electron emission
is balanced by the energy loss due to ions leaving the control volume, random electron
current to the insert surface and electron discharge current. In energy balance equation,
it is considered that the plasma is optically thick, so that radiated energy is again
absorbed by the plasma. Thus, radiation losses are not considered [55]. Energy removed
via excitation is also ignored in the energy balance equation written for insert region
plasma [11]:
Iemφs︸ ︷︷ ︸Gain due to
thermionic electron emission
+ ReI2d︸︷︷︸
Gain due toohmic heating
= Ii,out
(Ui +
2kBTw,insq
)︸ ︷︷ ︸
Loss due toion loss
+ (2TeV,ins + φs) Ir︸ ︷︷ ︸Loss due to
random electron current
+5
2TeV,insId︸ ︷︷ ︸
Loss due toelectron discharge
(2.5)
Here Iem represents the thermionic emission current in Amperes, φs represents the
sheath voltage built in plasma in Volts, Re is the resistance of the plasma in Ohms, Id
is the current extracted from the cathode in Amperes, Ii,out is the ion current out of
the control volume in Amperes, Ui is the first ionization energy of xenon in eV, TeV is
electron temperature in eV, and Ir is the random electron current to the insert surface
in Amperes at the insert region [11].
29
Iemφs term represents the energy input by thermionically emitted electrons that
are accelerated by sheath plasma potential. ReI2d term represents the energy lost by the
electrons to the plasma due to collisions with the ions and the neutrals in the plasma.
First term on the right hand side accounts for the energy lost due to the ions leaving
the control volume. (2TeV,ins+φs)Ir term represents the energy that is drawn from the
plasma as the electrons overcome the sheath potential at the sheath edge and reaches
the insert wall. 52TeV,insId term is the energy spent to energize the extracted current.
Here 3/2 of this represents total kinetic energy in three degrees of freedom (x, y, z,
1/2 each) and 1 comes from work done on the electrons by pressure. As the current is
extracted, this energy is carried away.
In order to calculate emitter plasma energy gain due to ohmic heating, the emitter
plasma resistance, Re, is found from the following expression [34]:
Re = ηre
4/3reLemit[ohm] (2.6)
where Lemit is the length of the actively emitting region of the emitter, also correspond-
ing conduction length of the plasma, re is the radius of the emitter region plasma, η
is the resistivity of the insert region plasma. It is assumed that most of the current is
carried in radial direction, thus for the current conduction an average cross-sectional
area is used as given in [34]. The resistivity of the plasma is given by:
η = meνei + νenq2ne
[kg ×m3
s× C2
](2.7)
where ne is emitter plasma density, q is the electron charge, νei and νen are electron-ion
and and electron-neutral collision frequencies respectively. The electron-ion collision
frequency is calculated as follows:
νei = 2.9× 10⁻¹² neΛ
T3/2eV,ins
[1
s
](2.8)

30
where the quantity Λ, is the Coulomb logarithm and it is given as:
Λ = 23− 1
2ln
(10−6neT 3eV,ins
)(2.9)
The electron-neutral collision frequency is given by:
νen = σenNe
√8kBTe,insπme
[1
s
](2.10)
where σen is the electron-neutral collision cross section:
σen = 6.6× 10⁻¹⁹
TeV,ins4− 0.1
1 +(TeV,ins
4
)1.6
[m2] (2.11)
2.1.3. Current Balance
Another equation written for the emitter plasma region is the current balance.
There are four currents that play part in the plasma as shown in Figure 2.3. In this
figure the dashed line represents the sheath edge of the plasma at the insert region.
Insert
Id Ii
Ir Iem
Cathode Tube
Figure 2.3. Schematic of the current balance in the insert region.
The four currents that enter and leave the insert region plasma have the following
relationship [11]:
Iem︸︷︷︸Thermionically emitted
electron current
+ Ii︸︷︷︸Ion current to the
insert surface
= Id︸︷︷︸Discharge current
+ Ir︸︷︷︸Random electron current
to the insert surface
(2.12)

31
In this equation, Iem is the amount of electron current emitted from insert with
thermionic emission. Thus, Iem represents the total electron current leaving the in-
sert surface and entering the insert region plasma. The thermionic current density is
evaluated from Richardson-Laue-Dushman equation:
Jem = DT 2w,insexp
(− qφeffkBTw,ins
) [A
m2
](2.13)
where D is material constant and Tw,ins is the emitter wall temperature. D is taken as
29 Acm−2K−2 for LaB6 [16].
In the presence of an electric field on the insert material, the apparent work
function decreases. This phenomena is referred to as the Schottky effect and effective
work function is given as:
φeff = φwf −√qEs4πε0
[V ] (2.14)
where φwf is the value of the work function in the literature, Es is the electric field of
the cathode sheath acting on the insert material and it is given as follows [56]:
Es =
√nekBTe,ins
ε0
[2
√1 +
2qφskBTe,ins
− 4
]1/2 [V
m
](2.15)
where φs, the emitter sheath voltage drop, is given as [11]:
φs =kBTe,ins
qln
[√2mi
πme
][V ] (2.16)
The electric field caused by the sheath potential on the emitter reduces the literature
work function of insert material, and thus enhances the thermionic electron emission.
Eventually, electron emission current from insert with field-enhanced thermionic emis-
sion can be calculated as follows:
Iem = JemAemit [A] (2.17)
32
Ii is the ion current that leaves the insert region plasma and reaches the surface of the
emitter. These ions that reach the surface bombard the surface with their energy and
contribute to the heating of the surface. Ii is calculated from Bohm sheath criterion
as follows:
Ii = 0.61qne
√kBTe,insmi
Aemit [A] (2.18)
where ne is the electron density in the insert region plasma, Te,ins is electron temper-
ature in K. In Equation 2.12, Ir, the random electron current at the sheath edge, is
given by:
Ir =1
4neq
(8kBTe,insπme
)1/2
exp
(−qφskBTe,ins
)Aemit [A] (2.19)
The neutral density in the insert region is determined by assuming Pouiselle flow
through the orifice. Taking reduced temperature Tr as the ratio Tn/289.7. The viscosity
is given by [11]:
ζ = 2.3× 10⁻⁴T0.71+ 0.29
Trr [Poise] (2.20)
Then the pressure of neutral atoms will be determined in terms of Torr as follows [11]:
P =
√0.78QζTrLo
d4o
[Torr] (2.21)
where Lo and do are orifice length and diameter in cm respectively, Q is the mass flow
rate in sccm. Finally, neutral density in the insert plasma, Ne, is found from:
Ne = 9.65× 1024 P
Tn[m−3] (2.22)
During the operation of hollow cathode, density of the insert plasma becomes greater
in the region close to the orifice. Especially, operation at high currents and mass flow
rates pushes the plasma density peak to the regions closer to orifice [37, 38, 57]. There-
33
fore, this peak in insert plasma density causes small plasma-emitter contact area. As
a result of this small plasma-emitter attachment area, required current is emitted from
that small region close to orifice which leads high current density and high temperature
as speculated in studies [11, 37, 50]. In other words, this uneven distribution of tem-
perature on the emitter surface causes the hotter regions to emit more electrons. For
determination of the effective emission length of the insert, the simple methodology
proposed by Alta group is used. It is assumed that the product of the effective emission
length and the insert plasma pressure is equal to 15 mPa. It is suggested that even
tough the product of the effective emission length and the insert plasma pressure is
set equal to 5 mPa or 10 mPa, it does not affect the general tendency of the plasma
parameters [45].
15 = Lemit × P × 133.322 [mPa] (2.23)
where P is in terms of Torr.
2.2. Orifice Model
Electrons coming from the insert region experience frequent elastic and inelastic
collisions in the orifice region. These collisions create resistance to the electron current.
Throughout orifice modelling, thermionic emission from the orifice material is ignored
because common materials used as orifice have high work function (i.e. 4.5 eV for
tungsten). This orifice model follows the work done by [11, 43]. Considering steady
state operation, ion balance in radial direction, plasma power balance and energy bal-
ance written for orifice surface equations are solved in the hypothetical control volume
enclosing orifice plasma as schematically shown in Figure 2.4. Eventual goal of the ori-
fice plasma numerical model is to compute the plasma number density, plasma electron
temperature, orifice wall temperature and the influence of the operation conditions and
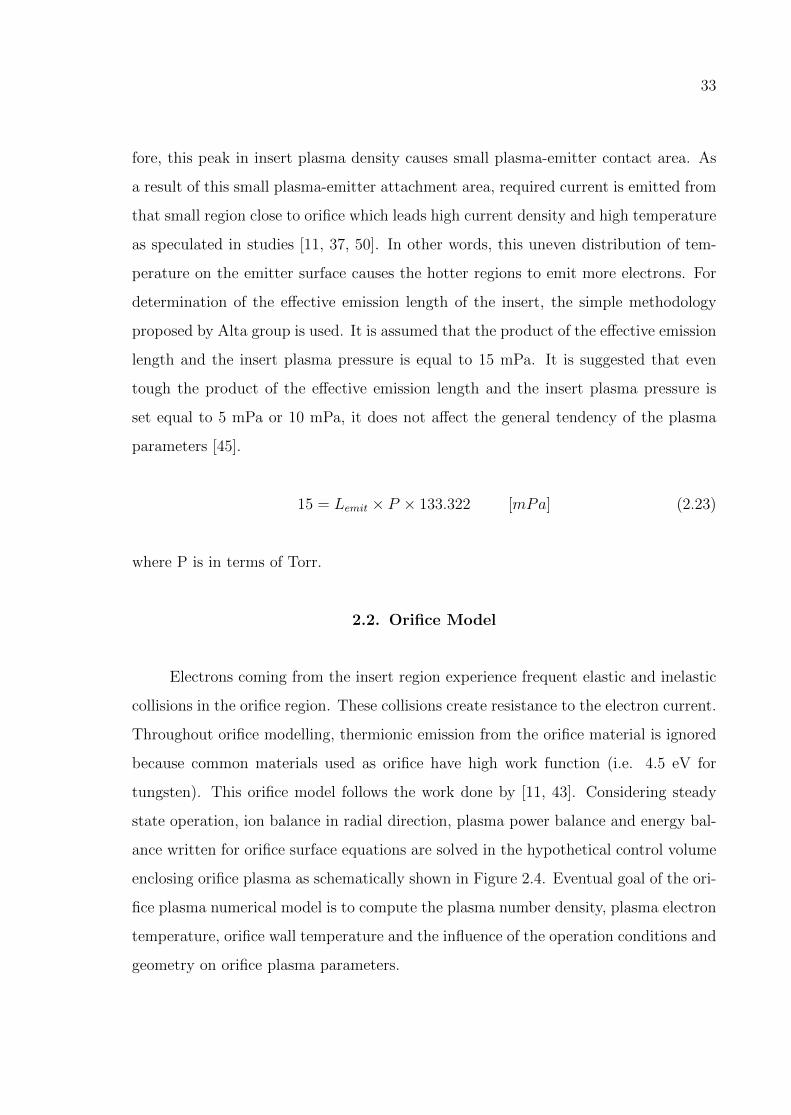
geometry on orifice plasma parameters.
34
Figure 2.4. Orifice plasma control volume.
2.2.1. Ion Conservation
The temperature of the orifice plasma is calculated with mathematical expres-
sion that is given under the assumption of large aspect ratio (Lo/(2ro) > 1) in [11].
The electron temperature, TeV,orf , in a long plasma is identified by balancing radial
ion loss due to diffusion with ion generation since majority of ions generated in the
orifice recombine on the orifice wall [36]. A radial diffusion equation can be written by
balancing radial ion loss due to diffusion with ion generation as follows:
−∇ · [Da∇n] = n (2.24)
In Equation 2.24, Da represents the ambipolar diffusion coefficient. The solution of this
ion radial diffusion equation, whose solution procedure is elaborated in Appendix C,
gives rise to eigenvalue equation which only has dependence on the electron temperature
[11, 12]
(roλ01
)2
Noσi (Te,orf )
√8kBTe,orfπme
=q
mi
TiV,orf + TeV,orfσcexNo
√mi
kBTi,orf(2.25)
where λ01 is the first zero of the zeroth order Bessel function of the first kind, No is orifice
neutral number density, σcex is resonant charge exchange cross-section and has the
value of 10−18 m2 [11], σi is ionization cross section averaged over Maxwellian electron

35
temperature and Ti,orf and TiV,orf are ion temperature in K and eV, respectively.
2.2.2. Orifice Plasma Energy Balance
Orifice plasma energy balance equates the energy gain of the plasma due to
resistive heating with the energy loss due to ionization and convection of electrons from
orifice to insert. Since the electron temperature in the orifice is larger in comparison
to the insert plasma electron temperature, the convection loss occurs. The energy
equation for orifice plasma is written as follows:
RoI2d︸︷︷︸
Energy gain due toohmic heating
+ 2.5kBqIdTe,ins︸ ︷︷ ︸
Energy gain due toelectrons coming from insert
= qπr2oLoNono〈σve〉Ui︸ ︷︷ ︸
Energy loss due to ionization
+ 2.5kBqIdTe,orf︸ ︷︷ ︸
Energy loss dueelectrons leaving orifice
(2.26)
When we put Equation 2.26 in a tidy form, we end up with the following expression:
RoI2d︸︷︷︸
Energy gain due toohmic heating
=(qπr2
oLoNono〈σve〉)
(Ui)︸ ︷︷ ︸Energy loss due to ionization
+ 2.5kBqId (Te,orf − Te,ins)︸ ︷︷ ︸Energy loss due
electron convection
(2.27)
In Equation 2.27, the term on the left is the energy gain due to ohmic heating, the first
term on the right is energy loss due to ionization and finally the last term is the energy
loss due to electron convection. Orifice plasma resistance is evaluated as follows
Ro =ηLoπr2
o
[Ω =
m2 × kgs× C2
](2.28)
where the resistivity term, η, is:
η =νme
noq2
[kg ×m3
s× C2
](2.29)

36
where ν stands for total collision frequency. In total collision frequency calculation, the
contribution of both electron-ion and electron-neutral collisions are taken into account
as follow:
ν = νei + νen
[1
s
](2.30)
where electron-ion collision frequency, νei, is:
νei = (2.9× 10⁻¹²)noΛ
(TeV )3/2
[1
s
](2.31)
where the quantity Λ, is the Coulomb logarithm and it is:
Λ = 23− 1
2ln
(10−6noT 3eV
)(2.32)
Electron-neutral collision frequency is given by:
νen = σenNo
√kTeme
[1
s
](2.33)
where σen is electron-neutral collision cross section and it is given as:
σen = 6.6× 10⁻¹⁹
[TeV
4− 0.1
1 +(TeV
4
)1.6
][m2] (2.34)
where TeV is the electron temperature in terms of eV.
Finally, the amount of power transferred to orifice plasma with ohmic heating
can be calculated as:
PR = RoI2d [W ] (2.35)

37
The power loss due to neutral particle ionization in the orifice is:
Pion =
(dnidt
)ionization
qUi = qπr2oLoUiNono〈σve〉 [W ] (2.36)
where no can be evaluated from the solution of Equation 2.25, and Ui, which is the
mean energy loss due to single ionization event, is 12.1 eV for Xenon. In order to
calculate the neutral particle number density in orifice plasma, it is assumed that
choked flow condition occurs at the orifice exit. Under this assumption orifice plasma
neutral number density can be calculated as follows [58]:
No =m
MoAorf√γRgTw,orf
[m−3] (2.37)
For calculation of the ionization rate function, the expression, which is a function of
plasma electron temperature, given in [11] is used:
〈σve〉 = 10−20[(
3.97 + 0.643TeV − 0.0368T 2eV
)e
−12.127TeV
](8qTeVπme
)1/2 [m3
s
](2.38)
Loss due to electron convection is given as:
Pconv = 2.5kBIdq
(Te,orf − Te,ins) [W ] (2.39)
2.2.3. Orifice Wall Energy Balance
Another equation written for the orifice model is the energy balance on the orifice
surface. The ions passing the sheath reaches the orifice and give their energy to the
orifice. Electrons striking the orifice surface are also another energy gain mechanism.
The energy loss mechanisms for the orifice is the heat conduction to the base and
the insert, and thermal radiation to its surroundings. Figure 2.5 depicts the energy
exchange in the orifice. Under these conditions, orifice wall energy balance can be
38
written as follows:
IBohm,orf
(Ui + φs,orif + 0.5
kBTw,orfq
)︸ ︷︷ ︸
Ion heating
+ Ir,orf (2TeV,orf )︸ ︷︷ ︸Electron heating
= Hbase +Hins +Hrad(2.40)
Figure 2.5. Orifice wall energy fluxes.
In Equation 2.40, Hbase stands for the amount or heat that is lost to base by
conduction, Hins represents the amount of heat that is lost to insert by conduction and
Hrad is the amount of heat that is lost by radiation. In ion heating term, ions deliver
the ionization energy, the energy gain while passing through sheath and the kinetic
energy to the orifice wall. Since the sheath creates a retarding potential for electrons,
the electrons which carry sufficient energy to overcome this retarding sheath potential
can reach the orifice surface. 2TeV,orf term in electron heating accounts the energy
transferred to the orifice wall by electrons.

39
3. SOLUTION OF MODEL EQUATIONS
In this section, the solution methodology of the insert and orifice plasma model
equations explained in previous section is given. The details regarding the solution of
the model equations and lifetime calculation of orificed hollow cathode can be found
in this section. The results obtained with the developed model are shared in the next
section.
The reference geometry modelled in this study is adopted from [45] and is shown
in Figure 3.1. Basically, there are three main geometric parameters that are associated
with the hollow cylindrical insert: the inner diameter, Din = 3 mm, the outer diameter,
Dout = 6.9 mm, and the length Lins = 6 mm. Length of the orifice and its diameter
are Lo = 0.36 mm, Do = 0.3 mm, respectively. Lastly, the total length of the cathode
tube is Ltube = 20 mm. The thickness of the cathode tube is taken as 0.3 mm.
Figure 3.1. Test geometry.
The heat transfer coefficient of the cathode tube material and insert material must
be known in order to perform heat transfer calculations. The thermal conductivity of
LaB6 insert material is taken as kins = 130 W/m ·K [59]. The cathode tube is assumed
to be made of tantalum, thus kt = 63W/m·K [60]. The thermal conductivity of BaO-W

40
emissive material is assumed to be the same as that of tungsten. Therefore, the thermal
conductivity of BaO-W is taken as 107 W/m · K [60]. Cathode base temperature is
assumed to be constant at 1000 K, and the temperature of the radiation shield is
assumed to be constant at 1200 K for the heat transfer calculations. The change of the
thermal properties of the materials due to temperature variations are ignored. Since
hollow cathode operates in vacuum environment, there is no heat loss with convection
from insert or orifice. The view factor, used in radiation heat loss calculations, is
taken as unity. The cathode is operated at discharge currents varying from 0.5 A to
3 A with 0.5 A increment and at xenon flow rates of 0.3 mg/s, 1 mg/s and 2 mg/s.
The equations used in the developed model for simulation of insert and orifice region
plasmas are summarized below:
Insert plasma model equations:
• Ion conservation equation:
qπr2eLemitNene〈σve〉 = Ji,Th
(πr2
e
)+ Ji,Bohm
(2πreLemit + πr2
e
)(3.1)
• Energy conservation equation:
Iemφs +ReI2d = Ii,out
(Ui +
2kBTw,insq
)+ (2TeV,ins + φs) Ir +
5
2TeV,insId (3.2)
• Current balance equation:
Iem + Ii = Id + Ir (3.3)
Orifice plasma model equations:
• Ion conservation equation:
(roλ01
)2
Noσi (Te,orf )
√8kBTe,orfπme
=q
mi
TiV,orf + TeV,orfσcexNo
√mi
kBTi,orf(3.4)
41
• Energy balance equation:
RoI2d =
(qπr2
oLoNono〈σve〉)
(Ui) + 2.5kBqId (Te,orf − Te,ins) (3.5)
• Orifice wall energy balance:
IBohm,orf
(Ui + φs,orif + 0.5
kBTw,orfq
)+ Ir,orf (2TeV,orf ) = Hbase +Hins +Hrad
(3.6)
Bisection method is used for solution of the ion and energy conservation equations
written for both insert and orifice region plasmas. Since the temperature of neutral
particles in the orifice region plasma is required for calculation of the insert plasma
pressure and consequently for calculation of the effective emission length of insert
material, orifice plasma neutral particle temperature is taken as 1500 K for the first
discharge current value (0.5 A). Orifice plasma neutral particle temperature is updated
for the subsequent values of the discharge current.
For the solution of emitter region plasma parameters, the emitter wall temper-
ature is varied. First, the emitter plasma ion conservation equation, Equation 3.1, is
solved using bisection method in order to obtain the emitter plasma electron tempera-
ture, (TeV,ins). After that, insert plasma energy balance equation, Equation 3.2, is also
solved with the same method in order to have the emitter plasma electron density, (ne).
Iteration of emitter wall temperature is terminated when the current balance equation,
Equation 3.3, is satisfied. For determining whether the current balance equation is
satisfied, all the terms in the current balance equation (Equation 3.3) are written on
the left hand side of the equality and set equal to zero. As the insert wall temperature
is iterated, the calculated value of the insert wall temperature is determined as the
current balance equation (Equation 3.3) is satisfied with a relatively small error on
the order of 2 %. It is to author’s knowledge that the accuracy of the emitter wall
temperature prediction can be increased by increasing the resolution of emitter wall
temperature iteration.

42
Figure 3.2. Flow chart of the global model for OHC.
The same logic is applied for the orifice region plasma. While the orifice wall
temperature is varied, ion conservation equation, Equation 3.4, and orifice plasma
energy balance equation, Equation 3.5, are solved consecutively with bisection method
in order to obtain the orifice plasma electron temperature, (TeV,orf ), and plasma density,
(no). Iteration of orifice wall temperature is terminated when energy balance equation
written for the orifice wall, Equation 3.6, is satisfied. Flow chart diagram of the solution
procedure can be seen in Figure 3.2.
As a first order approximation, lifetime of hollow cathode can be estimated by
evaporation rate which is a function of current density [14, 26]. Therefore, for lifetime
calculation, a mathematical expression, Equation 3.7, is obtained for LaB6 evaporation
rate versus current density using graph given in [14]:
W = 3× 10⁻¹¹J (2.564)em (3.7)
where Jem is the electron emission current density in A/cm2 and W is the evaporation

43
rate in gm/cm2s. Lifetime of insert is calculated as the time required to halve the initial
mass of emitter material [45]. It should be noted that this approximation for lifetime
determination does not consider any other factors that can affect lifetime significantly,
such as poisoning due to impurities in gas being used.
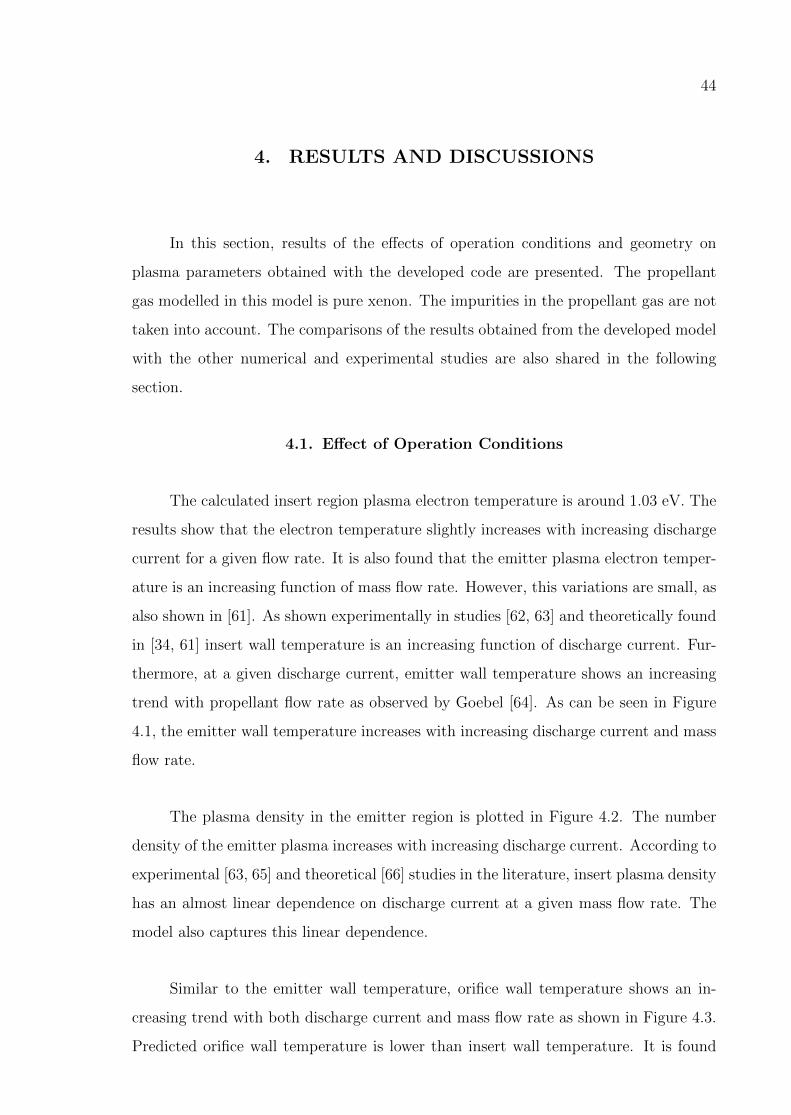
44
4. RESULTS AND DISCUSSIONS
In this section, results of the effects of operation conditions and geometry on
plasma parameters obtained with the developed code are presented. The propellant
gas modelled in this model is pure xenon. The impurities in the propellant gas are not
taken into account. The comparisons of the results obtained from the developed model
with the other numerical and experimental studies are also shared in the following
section.
4.1. Effect of Operation Conditions
The calculated insert region plasma electron temperature is around 1.03 eV. The
results show that the electron temperature slightly increases with increasing discharge
current for a given flow rate. It is also found that the emitter plasma electron temper-
ature is an increasing function of mass flow rate. However, this variations are small, as
also shown in [61]. As shown experimentally in studies [62, 63] and theoretically found
in [34, 61] insert wall temperature is an increasing function of discharge current. Fur-
thermore, at a given discharge current, emitter wall temperature shows an increasing
trend with propellant flow rate as observed by Goebel [64]. As can be seen in Figure
4.1, the emitter wall temperature increases with increasing discharge current and mass
flow rate.
The plasma density in the emitter region is plotted in Figure 4.2. The number
density of the emitter plasma increases with increasing discharge current. According to
experimental [63, 65] and theoretical [66] studies in the literature, insert plasma density
has an almost linear dependence on discharge current at a given mass flow rate. The
model also captures this linear dependence.
Similar to the emitter wall temperature, orifice wall temperature shows an in-
creasing trend with both discharge current and mass flow rate as shown in Figure 4.3.
Predicted orifice wall temperature is lower than insert wall temperature. It is found

45
Figure 4.1. Insert wall temperature as a function of discharge current.
Figure 4.2. Emitter plasma density as a function of discharge current.
in experimental studies [13, 67] conducted with hollow cathodes having BaO-W insert
that orifice plate temperature could be up to 100C cooler than insert temperature.
As was the case for emitter, it is found that the orifice plasma density is also an
increasing function of both discharge current and mass flow rate as seen in Figure 4.4.
The electron temperature of the orifice region remains almost constant with dis-
charge current whereas it decreases with the propellant flow rate as shown in Figure
4.5 and as found by Domonkos [34].
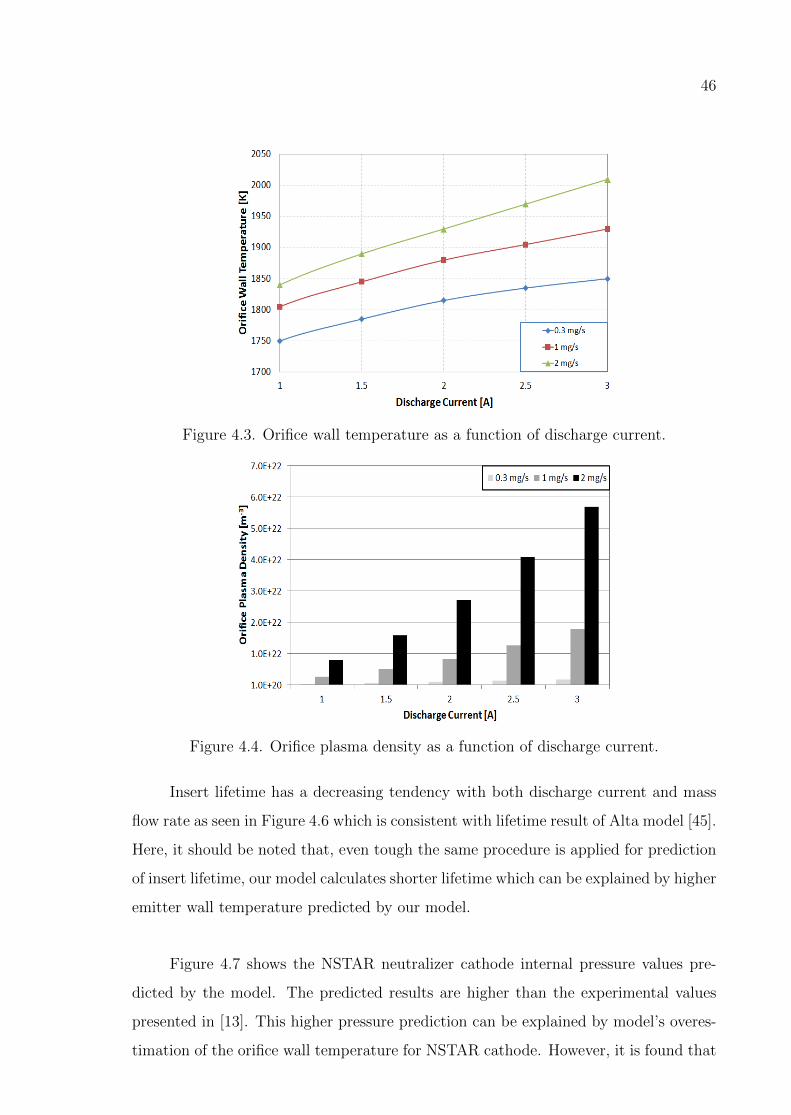
46
Figure 4.3. Orifice wall temperature as a function of discharge current.
Figure 4.4. Orifice plasma density as a function of discharge current.
Insert lifetime has a decreasing tendency with both discharge current and mass
flow rate as seen in Figure 4.6 which is consistent with lifetime result of Alta model [45].
Here, it should be noted that, even tough the same procedure is applied for prediction
of insert lifetime, our model calculates shorter lifetime which can be explained by higher
emitter wall temperature predicted by our model.
Figure 4.7 shows the NSTAR neutralizer cathode internal pressure values pre-
dicted by the model. The predicted results are higher than the experimental values
presented in [13]. This higher pressure prediction can be explained by model’s overes-
timation of the orifice wall temperature for NSTAR cathode. However, it is found that
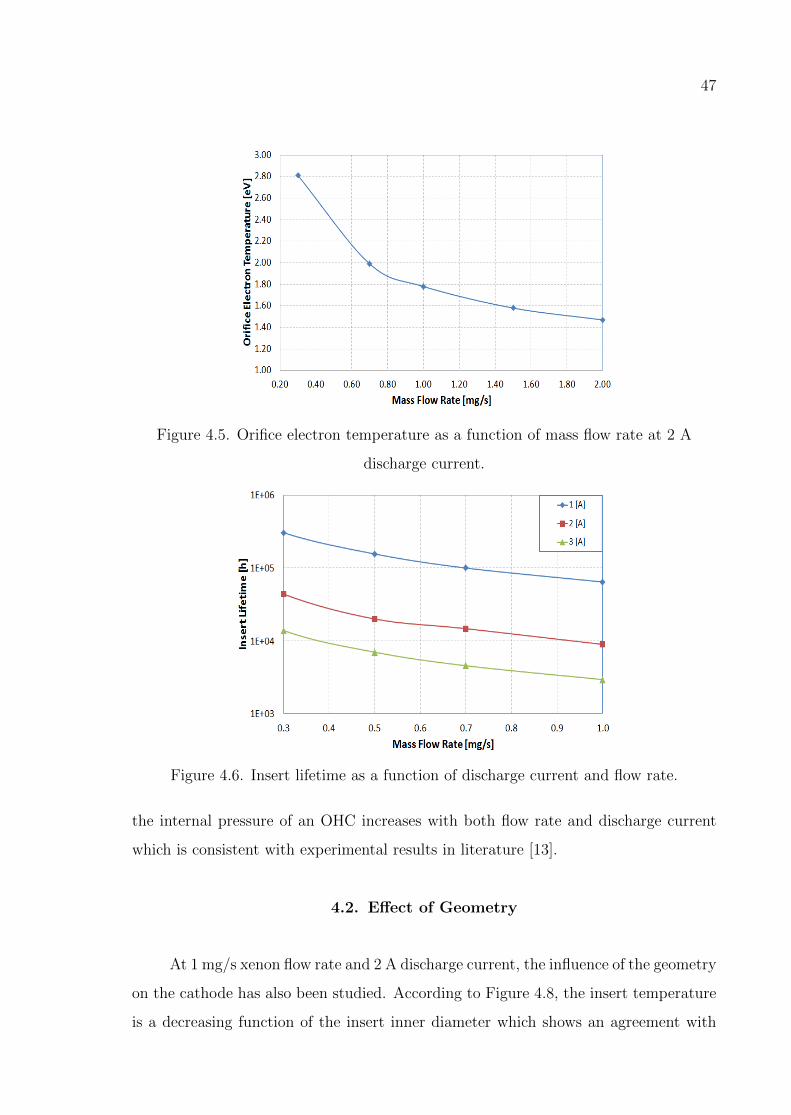
47
Figure 4.5. Orifice electron temperature as a function of mass flow rate at 2 A
discharge current.
Figure 4.6. Insert lifetime as a function of discharge current and flow rate.
the internal pressure of an OHC increases with both flow rate and discharge current
which is consistent with experimental results in literature [13].
4.2. Effect of Geometry
At 1 mg/s xenon flow rate and 2 A discharge current, the influence of the geometry
on the cathode has also been studied. According to Figure 4.8, the insert temperature
is a decreasing function of the insert inner diameter which shows an agreement with

48
Figure 4.7. NSTAR neutralizer cathode internal pressure as a function of flow rate
and discharge current.
the results of Domonkos’ model [34]. As proposed in study [68], increase in insert inner
diameter increases the effective emission area of insert material and thus reduces the
insert wall temperature. As given in Figure 4.9, this behaviour of hollow cathode is
captured by developed model. Figure 4.9 shows that increase in insert inner diameter
increases the effective emission length of emitter material. Increasing the effective
emission length of emitter material reduces the current density emitted from insert.
Therefore, insert temperature decreases. In other words, the same amount of current
can be obtained at lower emitter wall temperatures.
Another finding from the model is that the wall temperature of the insert de-
creases with the orifice diameter as seen in Figure 4.10. Similarly, increasing the orifice
diameter increases the effective emission length and consequently reduces the wall
temperature of insert as found in [4]. The change in effective emission length of insert
material with orifice diameter is given in Figure 4.11. It is calculated by the developed
model that insert effective emission length increases with increasing the diameter of
orifice.
Effect of orifice length on insert temperature is also studied. Insert wall tem-
perature increases with orifice length as shown in Figure 4.12. This increase in insert

49
Figure 4.8. Insert temperature as a function of insert inner diameter.
wall temperature can be attributed to decrease in effective emission length with orifice
length. As show in Figure 4.13, increasing the orifice length decreases the effective
emission length of emitter.
For a given flow rate and orifice diameter, Mandell and Katz [36] predicts an
increase in the orifice plasma electron temperature, as a result of ohmic heating, when
the orifice length is increased. Elevated electron temperature enhances the ionization in
the orifice plasma, and the electron and ion fluxes to the walls of the orifice increases.
Thus power deposition to the orifice wall due to ion heating and electron heating,
represented in brackets in Equation 2.40, increases. As a result, orifice wall temperature
also increases with orifice length as seen in Figure 4.14. Figure 4.15 shows the amount
of power transferred from particles striking to the wall of orifice, with respect to orifice
length. Since plasma density and sheath potential is high in the orifice plasma, the
heating mechanism of the orifice wall is mainly due to ion heating [69].
Lifetime of insert with respect to orifice length is given in Figure 4.16. Insert
lifetime decreases with increasing orifice length. As we have already shown, increasing
the orifice length decreases the effective emission length of emitter which leads higher
current density emission from insert material. Since the lifetime of LaB6 is mainly
dependent on current density, insert lifetime decreases with orifice length.
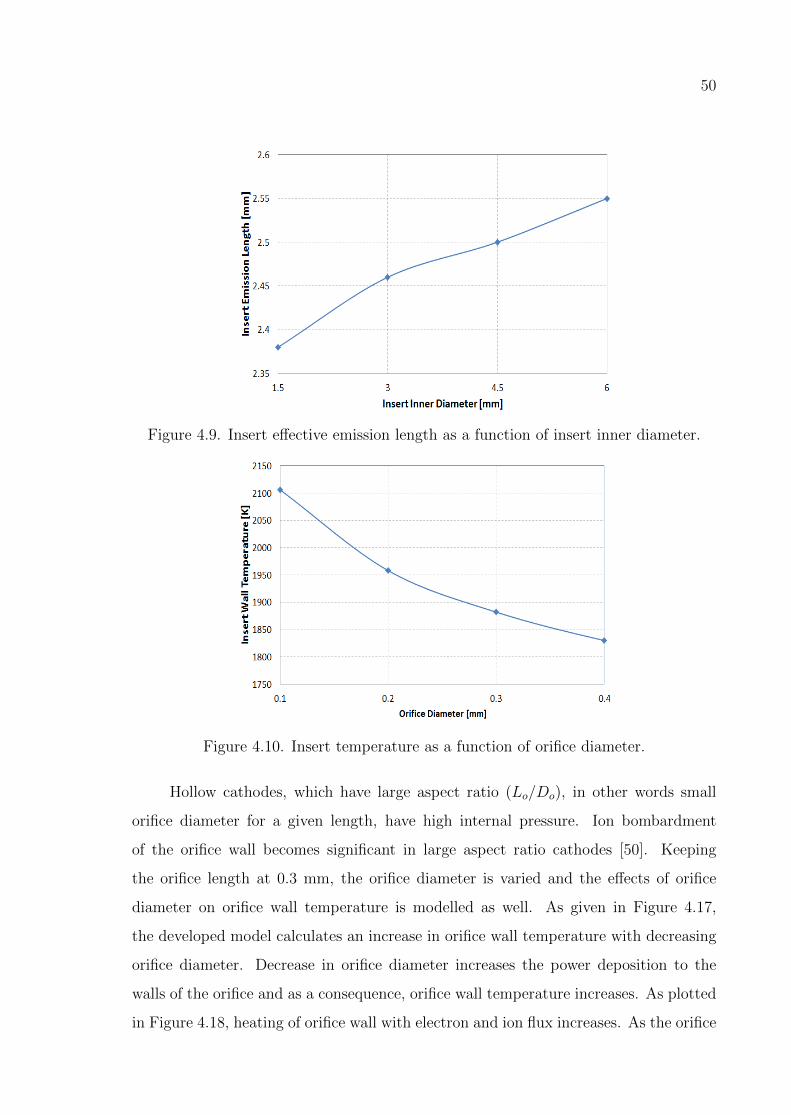
50
Figure 4.9. Insert effective emission length as a function of insert inner diameter.
Figure 4.10. Insert temperature as a function of orifice diameter.
Hollow cathodes, which have large aspect ratio (Lo/Do), in other words small
orifice diameter for a given length, have high internal pressure. Ion bombardment
of the orifice wall becomes significant in large aspect ratio cathodes [50]. Keeping
the orifice length at 0.3 mm, the orifice diameter is varied and the effects of orifice
diameter on orifice wall temperature is modelled as well. As given in Figure 4.17,
the developed model calculates an increase in orifice wall temperature with decreasing
orifice diameter. Decrease in orifice diameter increases the power deposition to the
walls of the orifice and as a consequence, orifice wall temperature increases. As plotted
in Figure 4.18, heating of orifice wall with electron and ion flux increases. As the orifice

51
Figure 4.11. Insert effective emission length as a function of orifice diameter.
Figure 4.12. Insert wall temperature as a function of orifice length.
diameter decreases, ion heating becomes significant.
Aside from increasing the orifice wall temperature, decreasing the orifice diameter
also increases the insert plasma pressure as shown in Figure 4.19.
The effect of the thickness of the cathode tube on orifice wall temperature is
plotted in Figure 4.20. Increasing the thickness of the cathode tube wall increases the
heat conduction from orifice to the cathode base therefore, the thicker the cathode
tube, the lower the orifice wall temperature is. Even tough it is expected that thicker
cathode tube decreases the temperature of the emitter, the developed model does not
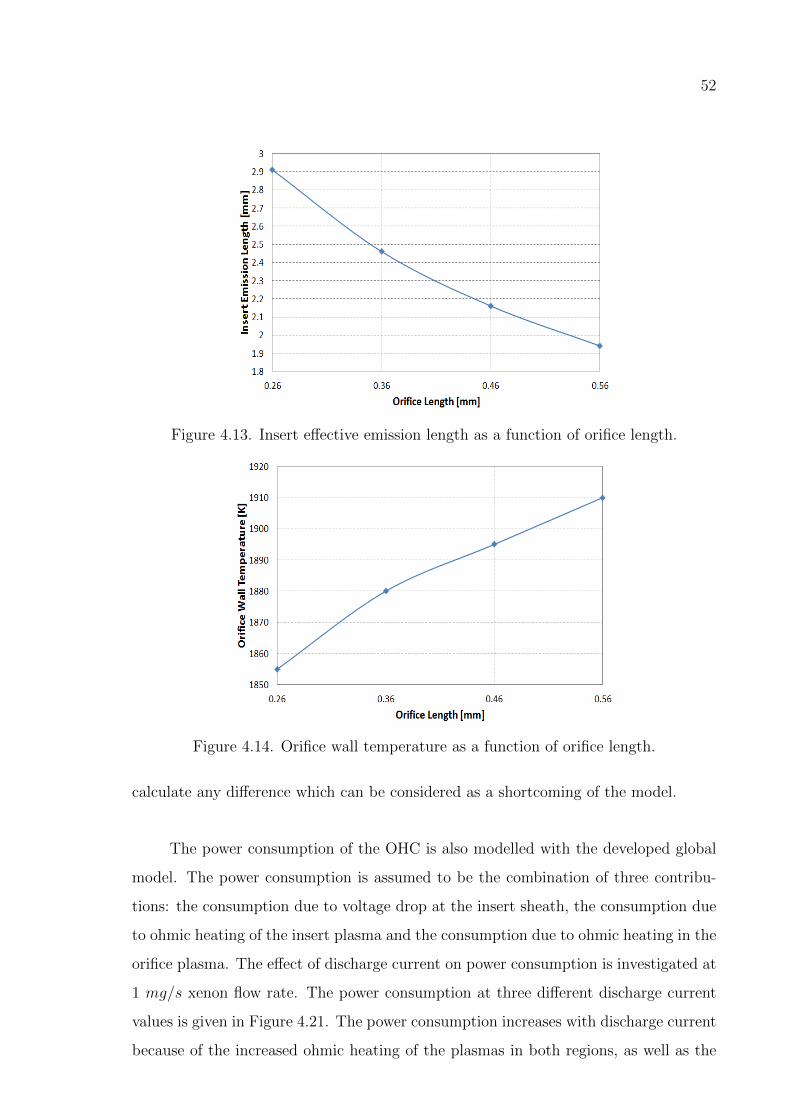
52
Figure 4.13. Insert effective emission length as a function of orifice length.
Figure 4.14. Orifice wall temperature as a function of orifice length.
calculate any difference which can be considered as a shortcoming of the model.
The power consumption of the OHC is also modelled with the developed global
model. The power consumption is assumed to be the combination of three contribu-
tions: the consumption due to voltage drop at the insert sheath, the consumption due
to ohmic heating of the insert plasma and the consumption due to ohmic heating in the
orifice plasma. The effect of discharge current on power consumption is investigated at
1 mg/s xenon flow rate. The power consumption at three different discharge current
values is given in Figure 4.21. The power consumption increases with discharge current
because of the increased ohmic heating of the plasmas in both regions, as well as the

53
Figure 4.15. Amount of power delivered to orifice wall as a function of orifice length.
Figure 4.16. Insert lifetime as a function of orifice length.
increase of the voltage drop on emitter sheath.
As suggested by Domonkos with both experimental and theoretical investigations
[34], the insert diameter should be large in order to reduce the power consumption.
The effect of the insert inner diameter on power consumption is given in Figure 4.22.
It is obtained with the developed model that power consumption increases with the
insert inner diameter. This increase in power consumption with the increase in insert
inner diameter is not consistent with the findings of Domonkos [34].
Figure 4.23 displays the effect of orifice diameter on power consumption. The

54
Figure 4.17. Orifice wall temperature as a function of orifice diameter.
Figure 4.18. Amount of power delivered to orifice wall as a function of orifice
diameter.
resistance of orifice plasma increases as expected. The decrease in orifice diameter
also increases the resistive heating of insert plasma because the insert plasma electron
density increases as shown in [34] and effective length decreases with decreasing the
orifice diameter. Hence, the power consumption increases with decreasing the orifice
diameter.
The effect of orifice length on power consumption is also investigated. As shown in
Figure 4.24, power consumption increases with orifice length. The power consumption
due to orifice and insert plasma resistance increases with orifice length, whereas the

55
Figure 4.19. Insert plasma pressure as a function of orifice diameter.
Figure 4.20. Orifice wall temperature as a function of cathode tube thickness.
power consumption due to emitter sheath voltage drop remains almost constant.

56
Figure 4.21. Power consumption as a function of discharge current.
Figure 4.22. Power consumption as a function of insert inner diameter.

57
Figure 4.23. Power consumption as a function of orifice diameter.
Figure 4.24. Power consumption as a function of orifice length.
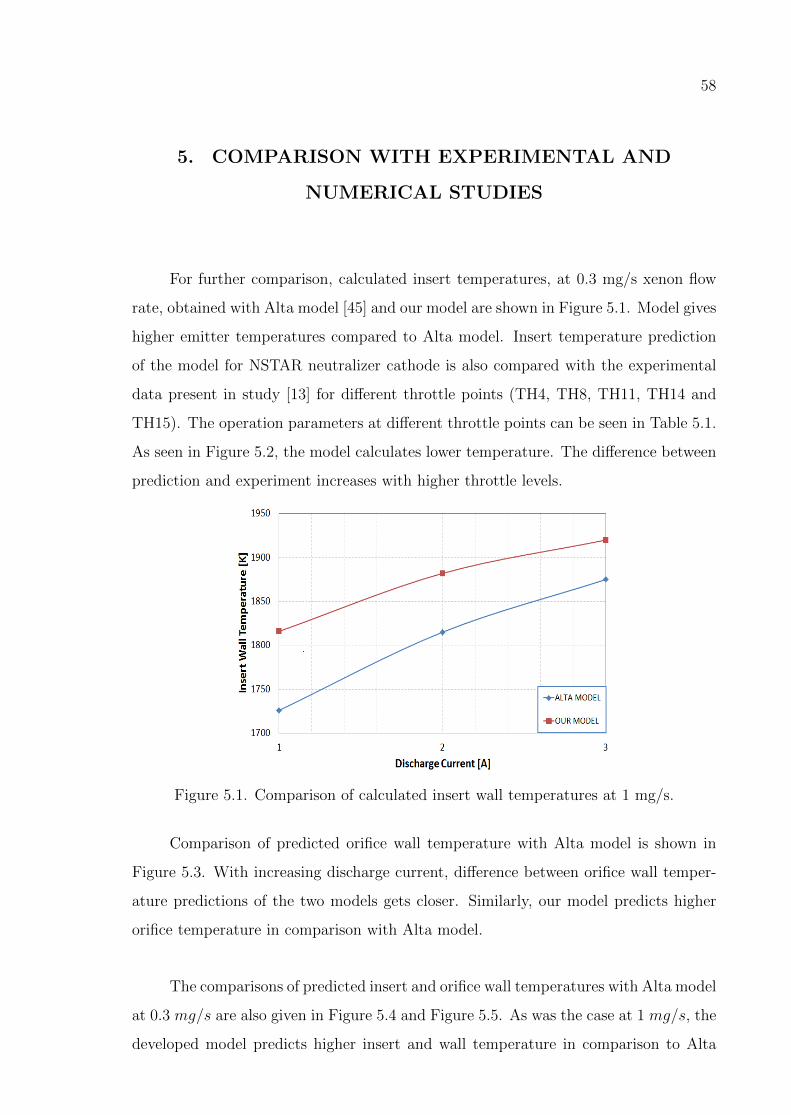
58
5. COMPARISON WITH EXPERIMENTAL AND
NUMERICAL STUDIES
For further comparison, calculated insert temperatures, at 0.3 mg/s xenon flow
rate, obtained with Alta model [45] and our model are shown in Figure 5.1. Model gives
higher emitter temperatures compared to Alta model. Insert temperature prediction
of the model for NSTAR neutralizer cathode is also compared with the experimental
data present in study [13] for different throttle points (TH4, TH8, TH11, TH14 and
TH15). The operation parameters at different throttle points can be seen in Table 5.1.
As seen in Figure 5.2, the model calculates lower temperature. The difference between
prediction and experiment increases with higher throttle levels.
Figure 5.1. Comparison of calculated insert wall temperatures at 1 mg/s.
Comparison of predicted orifice wall temperature with Alta model is shown in
Figure 5.3. With increasing discharge current, difference between orifice wall temper-
ature predictions of the two models gets closer. Similarly, our model predicts higher
orifice temperature in comparison with Alta model.
The comparisons of predicted insert and orifice wall temperatures with Alta model
at 0.3 mg/s are also given in Figure 5.4 and Figure 5.5. As was the case at 1 mg/s, the
developed model predicts higher insert and wall temperature in comparison to Alta

59
Table 5.1. NSTAR neutralizer cathode throttle levels [13].
NSTAR
Throttle
Level
Discharge
Current
[A]
Flowrate
[sccm]
TH 4 6.0 2.47
TH 8 8.24 2.47
TH 11 10.17 2.73
TH 14 12.35 3.34
TH 15 15.0 3.70
Figure 5.2. Comparison of predicted NSTAR insert temperature with experimental
measurement [13].
model. Similar to the case at 1 mg/s, with increasing discharge current, difference
between orifice wall temperature predictions of the two models gets closer.
A more comprehensive comparison study with other numerical studies present in
the literature is conducted. NSTAR neutralizer cathode, which has an orifice 0.75 mm
in length and 0.28 mm in diameter and a barium-oxide impregnated tungsten insert
material, operated at 3.6 sccm xenon flow rate and 3.26 A discharge current is simulated
by developed code and comparison of results obtained with the same geometry and
operation conditions are given in Table 5.2. Here, it should be noted that in 0-D
models developed by Katz and Mandell [43] and Mizrahi and Vekselman [44] energy

60
Figure 5.3. Comparison of calculated orifice wall temperatures at 1 mg/s.
Figure 5.4. Comparison of calculated insert wall temperatures at 0.3 mg/s.
losses due to excitation processes are taken into account in plasma energy balance
equation whereas in our model it is neglected. From the viewpoint of 0-D models, our
model predicts higher electron temperature in orifice plasma in comparison to Katz
and Mandell [43], and Mizrahi and Vekselman [44] whereas lower than the Alta model
[45]. Calculated plasma density is lower than that predicted by [43] and [44]. Predicted
neutral particle density in orifice plasma is lower than the prediction of [44] and higher
than other 0-D models. Even tough neutral particle density calculated by our model is
higher, plasma density and plasma temperature results are in a good agreement with
orifice outlet results of the 2-D model developed by Mikellides and Katz [70].
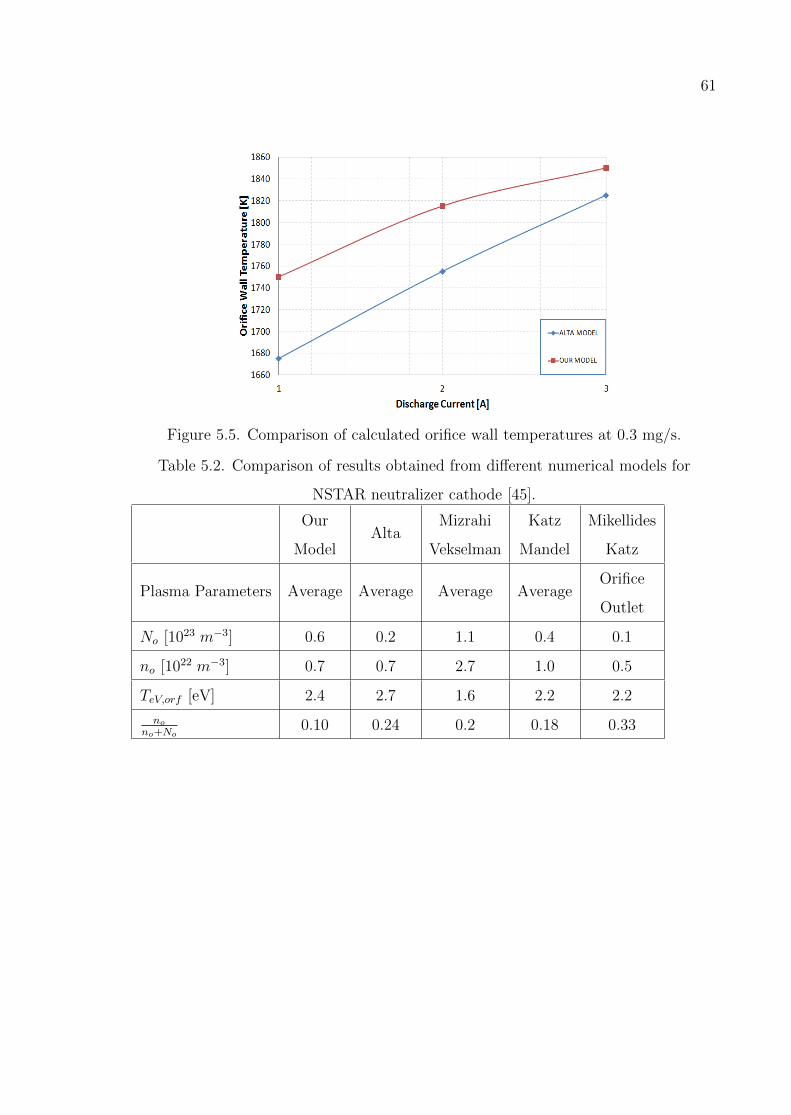
61
Figure 5.5. Comparison of calculated orifice wall temperatures at 0.3 mg/s.
Table 5.2. Comparison of results obtained from different numerical models for
NSTAR neutralizer cathode [45].
Our
ModelAlta
Mizrahi
Vekselman
Katz
Mandel
Mikellides
Katz
Plasma Parameters Average Average Average AverageOrifice
Outlet
No [1023 m−3] 0.6 0.2 1.1 0.4 0.1
no [1022 m−3] 0.7 0.7 2.7 1.0 0.5
TeV,orf [eV] 2.4 2.7 1.6 2.2 2.2
nono+No
0.10 0.24 0.2 0.18 0.33

62
6. CONCLUSIONS
A global numerical model for orifice and insert regions of a typical orificed hollow
cathode operating with LaB6 thermionic emitter and xenon propellant is developed
under the assumption of the presence of a quasi-neutral plasma with uniform plasma
parameters in both regions. The conservation and balance equations written for insert
and orifice plasmas are solved to have the plasma parameters and to assess the effect of
geometry on both plasma regions. Furthermore, the comparison of the obtained results
with other numerical and experimental studies present in the literature are given. The
agreement of the obtained results with experimental and numerical studies shows that
this indigenous global model can be used for designing more efficient and longer life
time hollow cathodes.
Operation at high discharge current and mass flow rate cause the predictions
of model to diverge from other results. For instance, the model overestimates orifice
wall temperature and internal pressure at high mass flow rate and discharge current.
Nevertheless, predictions of the developed model at low operation conditions (mass
flow rate and discharge current) for wide range of geometries are satisfactory. Another
shortcoming of the model is that it cannot predict the electrical characteristics of
OHCs correctly. Therefore, further improvements are necessary in order to simulate
the electrical characteristics of OHCs as well.
Having a broader plasma density profile along the insert is crucial in order to
increase the lifetime of hollow cathodes. Broader axial plasma density profile in the
insert region leads to better plasma-emitter contact and thus increases the emitting
surface area of insert material. In other words, better plasma-emitter contact area
leads to low current densities and low insert temperatures. Since the lifetime of insert
material is mainly determined with its evaporation rate, which depends on the tem-
perature of the material, reduced insert temperatures can guarantee longer lifetime for
hollow cathodes. Therefore, in design process of a thermionic hollow cathode, special
attention should be paid to insert temperature.

63
In literature, there are many different studies, efforts and recommendations for
extending the lifetime of hollow cathode by increasing its emission length. In 2006, Van
Noord [68] suggested increasing the thickness of hollow cathode tube walls. Thicker
tube walls will increase the heat conduction and eventually temperature gradient on
insert surface can be reduced. Decreasing the temperature variations along the insert
material can ensure more uniform thermionic electron emission and consequently ex-
tend the lifetime of cathode. In this study, it is observed that thicker cathode tube wall
can increase the plasma-emitter contact area. However, since the main energy loss of
cathode is heat conduction to the base, it is not desirable to have thicker wall. Rather,
thinner and longer cathode tube is used in construction of hollow cathodes [4, 14].
Another method proposed by Van Noord [68] to increase the effective emission
length of insert material is increasing the insert inner diameter. It is found in [68] that
increasing the insert inner diameter increases the lifetime.
Another suggestion to increase the effective emission length of insert material is
to increase the orifice diameter [4]. Increasing the orifice diameter broadens the axial
density profile of insert plasma. Therefore, effective emission length increases.
Rather than playing with the cathode geometry and dimensions, attachment of
RF coils near the heater coils is another way for increasing the emission length [71]. The
main reason for adding RF coil is to deposit RF energy and extend the axial plasma
density profile towards the downstream. Extended axial plasma profile increases the
plasma emitter contact area and thus reduces the current density.
According to the result of the developed model, increasing the insert inner diam-
eter leads to a decrease in insert wall temperature, due to an increase in effective emis-
sion length of insert material, and thus to a higher lifetime as shown in [68]. Another
finding is that increasing the diameter of orifice can also increase the lifetime. With
increasing the orifice diameter, effective emission length of insert material increases and
thus, insert temperature decreases. The prediction of the effect of orifice diameter on
insert wall temperature is consistent with the findings of Goebel and Watkins [4]. Fur-
64
thermore, larger orifice diameter can eliminate the difficulties regarding the discharge
initiation from hollow cathode by increasing the penetration of the potential applied
by keeper.
The results of the developed model show that reducing the orifice diameter causes
a considerable increase in power deposited to the orifice wall and as a consequence
increases the orifice wall temperature. The developed model captures the effect of the
cathode tube thickness on the orifice wall temperature. The increase in the cathode
tube thickness reduces the temperature of the orifice wall. Unfortunately, effect of
cathode tube thickness on insert wall temperature cannot be captured by the model,
since the insert model does not include heat transfer considerations.
Even though it is shown in study [26] that longer lifetimes can be obtained by
using larger sized hollow cathodes, it is found that reducing the length of the orifice is
advantageous for maintaining lower insert temperatures and thus longer lifetimes.

65
APPENDIX A: NEUTRAL PARTICLE DENSITY AND
PRESSURE ESTIMATION OF INSERT PLASMA
In the viscous regime, the pressure in a cylindrical tube is determined by Poiseuille
flow that is modified for compressible gas [11]. The mole flow rate in moles per second
of the compressible gas is given as:
Nm =π
8ζ
r4
l
Pa (P1 − P2)
RgT=
π
16ζ
r4
l
P 21 − P 2
2
RgT
[1kgm·s× m4
m× kg2
m2 · s4× 1
Jmol·KK
=mol
s
](A.1)
where r is the radius and l is the length of the tube, ζ is the viscosity, P1 is the pressure
at the upstream end of the tube, P2 is the pressure at the downstream end of the tube,
T is the temperature of the gas, Pa is the average pressure in the tube and it is given
as:
Pa =P1 + P2
2(A.2)
The measured gas flow rate is given by the ideal gas law:
Q = PmVm = NmRgTm
[mol
s× J
mol ·K×K =
Pa ·m3
s
](A.3)
where Pm is the pressure, Vm represents the volume, Tm is the temperature and Nm is
the mole flow rate [11]. Putting mole flow rate in Equation A.3 gives:
Q =π
16ζ
r4
l
P 21 − P 2
2
TTm (A.4)
Defining Tr = T/Tm:
Q =π
16ζ
r4
l
P 21 − P 2
2
Tr(A.5)
66
When the necessary unit conversions are done and writing this in terms of gas flow
divided by the pressure drop:
Q =1.28d4
ζTrl
(P 2
1 − P 22
)(A.6)
where Q is the flow rate in terms of sccm, ζ is the viscosity in terms of poise, the
pressures are in terms of Torr, d and l are the orifice diameter and orifice length in
centimeters, respectively. The pressure at the upstream of the orifice is:
P1 =
(P 2
2 +0.78QζTrl
d4
)1/2
(A.7)
Assuming that P1 is much higher than P2, the downstream pressure, P2, can be ne-
glected. The viscosity of xenon in terms of poise is given as:
ζ = 2.3× 10⁻⁴T(0.71+0.29/Tr,Xe)r,Xe for Tr,Xe > 1 (A.8)
where Tr,Xe = T/293.7. Once we know the pressure in the cathode interior, the neutral
particle density can be calculated in terms of particles/m3 by using ideal gas law:
P = NkBT =⇒ N = 9.65× 1024 × P
T(A.9)

67
APPENDIX B: DERIVATION OF
RICHARDSON-LAUE-DUSHMAN EQUATION WITH
THERMODYNAMIC APPROACH
The discussion presented here is adapted from [72] and explains briefly the deriva-
tion of the Richardson-Laue-Dushman equation. For more detailed explanation, the
reader should consult reference [72].
Considering that the electron chemical potential in the vapor is equal to the
electrochemical potential of electrons in the conductor, and considering that the re-
lationship between vapor chemical potential and its density is the one which is given
by the quantum statistics for a perfect gas with particle in statistical weight, number
density of electrons in the vapor that is away from surface is given by:
n1 =[2 (2πmkBT )3/2 /h3
]exp (µv/kBT ) (B.1)
where µv represents the chemical potential of the vapor and h represents the Planck’s
constant.
Putting µ + qMv in place of µv in Equation B.1, this equation can be extended
to the regions where the image potential is appreciable. Here, Mv is the motive at the
given point in vapor. Therefore Equation B.1 becomes:
n1 = 2[(2πmkBT ) /h2
]3/2exp ((µ+ qMv) /kBT ) (B.2)
The integration over the Maxwellian distribution of electron velocities gives the number
of electrons crossing the unit area in either direction in unit time as follows:
Γ =1
4n1
(8kBT
πm
)1/2
(B.3)
68
where n1 is the number of electrons per unit volume in the vapor.
The definition of saturation can be explained as the plane in question is placed
at an enough distance away from the surface where it is beyond the maximum in the
motive created by the superposition of the applied field and the image field. Assuming
that the transition from equilibrium to saturation does not change the state of emitting
material, if we follow the path of electrons, it can be seen that some of the electrons
enter the interior of the emitter and some crosses the plane. rv represents the fraction
of electrons passing across the plane to the total. Here, it is assumed that there are
no considerable collisions between vapor electrons in the region between the plane and
the emitter which leads that the reflection coefficient, rv, is dependent on surface and
the field close to it, not dependent on the density of the vapor. Since current density
is defined as the product of elementary charge, particle density and particle velocity,
combining the reflection coefficient with Equations B.2 and B.3, saturation current
density, J, can be obtained as follows:
J = 2[(2πmkBT ) /h2
]3/2exp ((µ+ qMv) /kBT )× 1
4
√8kBT
πm× q × (1− rv)
= A(1− rv)T 2exp((µ+ qMv) /kBT )
(B.4)
In Equation B.4, A is the universal constant and has the value:
A =(4πmk2
Bq/h3)
= 120 [A/cm2K2] (B.5)
The true work function, which can be defined as the difference between the electro-
chemical potential, µ, of the electrons in the emitter and the electrostatic potential
energy of an electron, −qΦa, just outside the conductor, is given as:
φ = −Φa − (µ/q) (B.6)
Considering that if a quite weak field is sufficient to produce saturation, the plane just
outside the range has the same potential with the one just outside of the surface of

69
the emitter and using the Equation B.6, the saturation current density, Equation B.4,
reduces to a more familiar form:
J = A(1− rv)T 2exp(−eφ/kBT ) (B.7)
For clean surfaces, the reflection coefficient, rv, is small and insensitive to temperature.
Therefore, the expression becomes:
J = AT 2exp(−eφ/kBT ) (B.8)
70
APPENDIX C: DERIVATION OF ION RADIAL
DIFFUSION EQUATION
In the orifice region, most of the ions generated are lost to the orifice walls. There-
fore, considering that the ion production rate is equal to diffusion rate, the following
expression can be written:
−∇ · [Da∇n] = n (C.1)
where Da is ambipolar diffusion coefficient and it is given by:
Da =1
σcexN
q
mi
(Ti + Teuscat
)(C.2)
where σcex is neutral-ion resonant charge exchange cross-section and uscat is the scatter-
ing speed and it can be approximated as ion thermal speed for relatively small diffusion
[37]:
uth =
√qTimi
(C.3)
The ion source term on the right hand side of Equation C.1 is given by:
n = Nnσ (Te)
√8qTeπme
(C.4)
When we ignore the axial density gradients and radial variations of electron temper-
ature and neutral particle density, ambipolar diffusion coefficient can be taken out.
Since the Laplacian operator is defined as the divergence of the gradient of a function,
Equation C.1 can be written as:
−Da∇2n = n (C.5)

71
In expanded form:
−Da
[1
r
∂
∂r
(r∂n
∂r
)+
1
r2
∂2n
∂φ2+∂2n
∂z2
]= n (C.6)
Considering a slab geometry for the sake of simplicity, the angular terms in Equation
C.6 can be eliminated and the equation becomes:
−Da
[∂2n
∂r2+
1
r
∂n
∂r+∂2n
∂z2
]= Nnσ (Te)
√8qTeπme
(C.7)
After final arrangement, the equation can be put in a tidy form:
∂2n
∂r2+
1
r
∂n
∂r+∂2n
∂z2+ C2n = 0 (C.8)
where
C2 =Nσ (Te)
√8qTe/πme
Da
(C.9)
Equation C.1 can be solved by using separation of variables method. Considering that
n(r, z) = F (r)G(z), the partial derivatives of n(r, z) are:
∂n
∂r= F ′G
∂n
∂z= FG′
∂2n
∂r2= F ′′G
∂2n
∂z2= FG′′
(C.10)
Plugging this derivatives into Equation C.8 and making necessary arrangements, we
obtain:
F ′′G+1
rF ′G+ C2FG = −FG′′ (C.11)
Dividing both sides by FG, we end up with:
1
F
∂2F
∂r2+
1
rF
∂F
∂r+ C2 = − 1
G
∂2G
∂z2(C.12)
72
The solution of left hand-side of Equation C.12 is the zeroth order Bessel function and
the solution of right hand-side of Equation C.12 is an exponential function. Therefore,
the solution of Equation C.8 is the product of these two.
n(r, z) = AJ0
(√C2 + α2r
)e−αz (C.13)
where A is an arbitrary constant. At the origin, A is equal to n(0, 0). Hence, solution
becomes:
n(r, z) = n(0, 0)J0
(√C2 + α2r
)e−αz (C.14)
Assuming that the ion density is zero at the wall (n(R, z) = 0):
√C2 + α2 =
λ01
R(C.15)
where λ01 is the first zero of the zeroth order Bessel function of the first kind and R
represents the radius. If we take α = 0, this eigenvalue gives us:
√C2 =
λ01
R=⇒ C =
λ01
R(C.16)
Plugging this C into Equation C.9, we have:
(λ01
R
)2
=Nσ(Te)
√8qTe/πme
Da
(C.17)
Simply taking the reciprocal of both sides, we have:
(R
λ01
)2
=Da
Nσ(Te)√
8qTe/πme
(C.18)
Making the final arrangements, we end up with the following expression:
(R
λ01
)2
Nσ(Te)
√8qTeπme
−Da = 0 (C.19)

73
Solution of this equation, which is only dependent on the electron temperature, gives
the plasma electron temperature. As shown in study [37], axial ion density gradients
in the orifice is small. Therefore, axial dependence of Equation C.1 disappears. In this
case, using the same methodology explained above, the solution of the ion radial flow
equation becomes only a zeroth order Bessel function (the solution does not have the
exponential term). Following the solution steps, explained in detail above, gives us the
same electron temperature equation.
74
APPENDIX D: ENERGY TAKEN AWAY FROM PLASMA
DUE TO ELECTRONS STRIKING AN ANODE
In this section, the energy taken away form plasma with electrons being lost to an
anode is derived. This derivation is of primary importance for calculating how much
energy is transferred to the walls of the cathode (insert material and orifice wall) from
the particles (electrons and ions) coming from plasma and recombining on the cathode
wall. It is also important to calculate how much energy is taken away from plasma. It
should be noted that the anode potential considered in this derivation is more negative
than the plasma. The Maxwellian plasma electrons are slowed down by the sheath
potential on the anode surface. The electron current density to the anode is given by
[11]:
Jr = qne
∫ ∞−∞
dvx
∫ ∞−∞
dvy
∫ ∞√
2qφs/mi
vz
(mi
2πkBTe
) 32
exp
(−mi
(v2x + v2
y + v2z
)2kBTe
)dvz
=1
4qne
√8kBTeπmi
exp
(− qφskBTe
)(D.1)
Since the sheath potential is a retarding potential for electrons, the electrons must
overcome this sheath potential to reach the wall. Therefore, the electron speed, assum-
ing in the z-direction, must be at least√
2qφs/mi. The Maxwellian plasma electrons
lose their energy while they are passing through this sheath region. The power flux
from plasma is given by:
Pe = ne
∫ ∞−∞
dvx
∫ ∞−∞
dvy
∫ ∞√
2qφs/mi
vz
(me
(v2x + v2
y + v2z
)2
)(mi
2πkBTe
) 32
exp
(−mi
(v2x + v2
y + v2z
)2kBTe
)dvz
=1
4qne
√8kBTeπmi
(2kBTeq
+ φs
)exp
(− qφskBTe
)(D.2)

75
where φs represents the sheath potential in eV. Taking the ratio of the power per
electron to the electron flux, the energy that an electron removes from the plasma in
eV is:
E =PeJr
= 2kBTeq
+ φs = 2TeV + φs (D.3)
where TeV represents the electron temperature in eV. The energy that an electron
transfers to the wall is different than the one that an electron removes from the plasma.
As we mentioned above, the electrons lose their kinetic energy when they are passing
through the sheath region. Therefore, qφs term needs be included in the electron
particle energy expression. The power flux to the anode wall from Maxwellian plasma
electrons can be calculated as follows:
Pe = ne
∫ ∞−∞
dvx
∫ ∞−∞
dvy
∫ ∞√
2qφs/mi
vz
(me
(v2x + v2
y + v2z
)2
− qφs
)(mi
2πkBTe
) 32
exp
(−mi
(v2x + v2
y + v2z
)2kBTe
)dvz
=1
4qne
√8kBTeπmi
(2kBTeq
)exp
(− qφskBTe
)(D.4)
The energy transferred to the anode wall per electron can be calculated by taking the
ratio of the power to the electron flux. Notice that the electron flux to the wall is the
same as given above.
E =PeJr
= 2kBTeq
= 2TeV (D.5)

76
APPENDIX E: PUBLICATIONS PRODUCED FROM
THIS RESEARCH
The list of publications produced from this thesis are listed below:
Journal Publications
(i) Korkmaz, O., M. Celik, “Global Numerical Model for the Assessment of the Effect
of Geometry and Operation Conditions on Insert and Orifice Region Plasmas of a
Thermionic Hollow Cathode Electron Source,” Contributions to Plasma Physics,
Vol. 54, No. 10, pp. 838-850, 2014.
International Conference Proceedings
(i) Korkmaz, O., M. Celik, “Global Numerical Model For Orifice and Insert Region
of a Lanthanum Hexaboride Thermionic Hollow Cathode,” 4th Space Propulsion
Conference, Cologne, Germany, May 2014.
(ii) Ozturk, A. E., O. Korkmaz, M. Celik, “Design and Analysis of Different In-
sert Region Heaters of a Lanthanum Hexaboride Hollow Cathode During Initial
Heating,” 4th Space Propulsion Conference, Cologne, Germany, May 2014.
National Conference Proceedings
(i) Korkmaz, O., A. E. Ozturk, M. Celik, “Elektrik Itki Sistemlerinde Elektron
Kaynagı Olarak Kullanılmak Uzere Uretilen Oyuk Katodun Tasarım Sureci,”
V. Ulusal Havacılık ve Uzay Konferansı, Erciyes Universitesi, Kayseri, Turkiye,
Eylul 2014.
77
REFERENCES
1. Criado, E., E. Roibas, S. P. Tierno, P. R. D. Francisco, J. L. Domenech-Garret,
J. M. Donoso, and L. Conde, “Ion Beam Neutralization and Properties of Plasmas
From Low Power Ring Cusp Ion Thrusters”, Physics of Plasmas , Vol. 19, No. 2,
p. 023505, 2012.
2. Roibas, E., S. P. Tierno, E. Criado, J. L. Domenech-Garret, J. J. M. Donoso,
and L. Conde, “Characterization of the Ion Beam Neutralization of Plasma
Thrusters Using Collecting and Emissive Langmuir Probes”, Contributions to
Plasma Physics , Vol. 53, No. 1, pp. 57–62, 2013.
3. Warner, D. J., “Advanced Cathodes For Next Generation Electric Propulsion Tech-
nology”, M.Sc. Thesis, Air Force Institute of Technology, Dayton, OH, USA, 2008.
4. Goebel, D. M. and R. M. Watkins, “Compact Lanthanum Hexaboride Hollow
Cathode”, Review of Scientific Instruments , Vol. 81, No. 083504, 2010.
5. Warner, D. J., R. D. Branam, and W. A. Hargus, “Ignition and Plume Charac-
teristics of Low-Current Cerium and Lanthanum Hexaboride Hollow Cathodes”,
Journal of Propulsion and Power , Vol. 26, No. 1, pp. 130–134, 2010.
6. Kuznetsov, G., “High Temperature Cathodes for High Current Density”, Nuclear
Instruments and Methods in Physics Research Section A: Accelerators, Spectrom-
eters, Detectors and Associated Equipment , Vol. 340, No. 1, pp. 204–208, 1994.
7. Herniter, M. E. and W. D. Getty, “Thermionic Cathode Electron Gun for High
Current Densities”, IEEE Transactions on Plasma Science, Vol. PS-15, No. 4, pp.
351–360, 1987.
8. Broers, A. N., “Electron Gun using Long-Life Lanthanum Hexaboride Cathode”,
Journal of Applied Physics , Vol. 38, No. 4, pp. 1991–1992, 1967.

78
9. Courtney, D. G., “Development and Characterization of a Diverging Cusped Field
Thruster and a Lanthanum Hexaboride Hollow Cathode”, M.Sc. Thesis, Mas-
sachusetts Institute of Technology, Cambridge, MA, USA, 2008.
10. Trent, K. R., M. S. McDonald, R. B. Lobbia, and A. D. Gallimore, “Time-resolved
Langmuir Probing of a New Lanthanum Hexaboride (LaB6) Hollow Cathode”, 32nd
International Electric Propulsion Conference, Weisbaden, Germany, September
2011, IEPC-2011-245.
11. Goebel, D. M. and I. Katz, Fundamentals of Electric Propulsion: Ion and Hall
Thrusters , JPL Space Science and Technology Series, New York, USA, 2008.
12. Coletti, M., R. I. Marques, and S. B. Gabriel, “Discharge Hollow Cathode Design
for a 4-Gridded Ion Engine”, IEEE Aerospace Conference, pp. 1–12, IEEE, 2010.
13. Polk, J., A. Grubisic, N. Taheri, D. M. Goebel, R. Downey, and S. Hornbeck,
“Emitter Temperature Distributions in the NSTAR Discharge Hollow Cathode”,
41st Joint Propulsion Conference, Tucson, AZ, USA, July 2005, AIAA-2005-
4398.
14. Goebel, D. M. and C. Emily, “High Current Lanthanum Hexaboride Hollow Cath-
odes for High Power Hall Thrusters”, 32nd International Electric Propulsion Con-
ference, Weisbaden, Germany, September 2011, IEPC-2011-053.
15. Goebel, D. M., J. T. Crow, and A. T. Forrester, “Lanthanum Hexaboride Hollow
Cathode for Dense Plasma Production”, Review of Scientific Instruments , Vol. 49,
No. 4, pp. 469–472, 2008.
16. Lafferty, J. M., “Boride Cathodes”, Journal of Applied Cathodes , Vol. 22, No. 3,
1951.
17. Storms, E. K. and B. A. Muller, “A study of Surface Stoichiometry and Thermionic
Emission Using LaB6”, Journal of Applied Physics , Vol. 50, No. 5, pp. 3691 – 3698,

79
1979.
18. Jacobson, D. L. and E. K. Storms, “Work Function Measurement of Lanthanum
- Boron Compounds”, IEEE Transactions on Plasma Science, Vol. 6, No. 2, pp.
191 – 199, 1978.
19. Kim, V., G. Popov, B. Arkhipov, V. Murashko, A. Koroteyev, V. Garkusha, A. Se-
menkin, and S. Tverdokhlebov, “Electric Propulsion Activity in Russia”, 27th In-
ternational Electric Propulsion Conference, Pasadena, CA, USA, October 2001,
IEPC-2001-005.
20. Arkhopov, B. A. and K. N. Kozubsky, “The Development of the Cathode Compen-
sators for Stationary Plasma Thrusters in the USSR”, 22nd International Electric
Propulsion Conference, Viareggio, Italy, October 1991, IEPC-91-023.
21. Storms, E. K. and B. A. Muller, “Phase Relationship, Vaporization, and Ther-
modynamic Properties of the Lanthanum-Boron System”, The Journal of Physical
Chemistry , Vol. 82, No. 1, pp. 51 – 59, 1978.
22. Goebel, D. M., Y. Hirooka, and T. Sketchley, “Large Area Lanthanum Hexaboride
Electron Emitter”, Review of Scientific Instruments , Vol. 56, pp. 1717 – 1722,
1985.
23. Favreau, L. J., “Cataphoretic Coating Lanthanum Boride on Rhenium Filaments”,
Review of Scientific Instruments , Vol. 36, pp. 856 – 857, 1965.
24. Pelletier, J. and C. Pomot, “Work Function of Sintered Lanthanum Hexaboride”,
Applied Physics Letters , Vol. 34, No. 4, pp. 249 – 251, 1979.
25. Storms, E. K., “Thermionic Emission and Vaporization Behavior of the Ternary
Systems of Lanthanum Hexaboride Containing Molybdenum Boride, Molybdenum
Diboride, Zirconium Diboride, Gadolinium Hexaboride, and Neodymium Hexa-
boride”, Journal of Applied Physics , Vol. 54, No. 2, pp. 1076 – 1081, 1983.

80
26. Goebel, D. M., R. M. Watkins, and K. Jameson, “LaB6 Hollow Cathodes for Ion
and Hall Thrusters”, Journal of Propulsion and Power , Vol. 23, No. 3, pp. 527 –
528, 2010.
27. Warner, D. J., R. D. Branam, W. A. Hargus, and D. M. Goebel, “Low Current
Cerium Hexaboride and Lanthanum Hexaboride Hollow Cathodes”, 46th AIAA
Aerospace Sciences Meeting and Exhibit , Reno, NV, USA, January 2008, AIAA-
2008-1086.
28. Falce, L., “Dispenser cathodes: The Current State of the Technology”, Interna-
tional Electron Devices Meeting , Vol. 29, pp. 448–451, IEEE, 1983.
29. Ives, R. L., L. R. Falce, S. Schwartzkopf, and R. Witherspoon, “Controlled Porosity
Cathodes From Sintered Tungsten Wires”, IEEE Transactions on Electron Devices ,
Vol. 52, No. 12, pp. 2800–2805, 2005.
30. Levi, R., “Improved Impregnated Cathode”, Journal of Applied Physics , Vol. 26,
No. 5, pp. 639–639, 2004.
31. Cronin, J. L., “Modern Dispenser Cathodes”, IEE Proceedings I (Solid-State and
Electron Devices), Vol. 128, No. 1, pp. 19–32, 1981.
32. Kovaleski, S. D., “Life Model of Hollow Cathodes Using a Barium Calcium Alumi-
nate Impregnated Tungsten Emitter”, 27th International Electric Propulsion Con-
ference, Pasadena, CA, USA, October 2001, IEPC-01-276.
33. Polk, J. E., D. M. Goebel, and R. Watkins, “Characterization of Hollow Cathode
Performance and Thermal Behaviour”, 42nd Joint Propulsion Conference, Sacra-
mento, CA, USA, July 2006, AIAA-2006-5150.
34. Domonkos, M. T., “Evaluation of Low-Current Orificed Hollow Cathodes”, Ph.D.
Thesis, The University of Michigan, Ann Arbor, MI, 1999.
81
35. Mikellides, I. G., I. Katz, D. M. Goebel, J. E. Polk, and K. K. Jameson, “Plasma
Processes Inside Dispenser Hollow Cathodes”, Physics of Plasmas , Vol. 13, No. 6,
p. 063504, 2006.
36. Mandell, M. J. and I. Katz, “Theory of Hollow Cathode Operation in Spot and
Plume Modes”, 30th Joint Propulsion Conference, Indianapolis, IN, USA, June
1994, AIAA-94-3134.
37. Katz, I., J. R. Anderson, J. E. Polk, and J. R. Brophy, “One-Dimensional Hollow
Cathode Model”, Journal of Propulsion and Power , Vol. 19, No. 4, pp. 595–600,
2003.
38. Mikellides, I. G., I. Katz, D. M. Goebel, and J. E. Polk, “Hollow Cathode Theory
and Experiment. II. A Two-dimensinal Theoretical Model of the Emitter Region”,
Journal of Applied Physics , Vol. 98, No. 113303, 2005.
39. Mikellides, I. G., I. Katz, D. M. Goebel, and K. K. Jameson, “Evidence of Non-
classical Plasma Transport in Hollow Cathodes for Electric Propulsion”, Journal
of Applied Physics , Vol. 101, No. 6, p. 063301, 2007.
40. Albertoni, R., M. Andrenucci, D. Pedrini, and F. Paganucci, “Preliminary Char-
acterization of a LaB6 Hollow Cathode for Low Power Hall Effect Thrusters”,
33rd International Electric Propulsion Conference, Washington, DC, USA, Octo-
ber 2013, IEPC-2013-137.
41. Fossum, E. C., J. D. Sommerville, and L. B. King, “Characterization of Near
Field Plasma Environment of a Hollow Cathode Assembly”, 40th Joint Propulsion
Conference, Fort Lauderdale, FL, USA, July 2004, AIAA-2004-3795.
42. Domonkos, M. T., M. J. Patterson, and A. D. Gallimore, “Low-current, Xenon Ori-
ficed Hollow Cathode Performance for In-Space Applications”, Journal of Propul-
sion and Power , Vol. 19, No. 3, pp. 438–443, 2003.

82
43. Katz, I., M. J. Mandell, M. Patterson, and M. Domonkos, “Sensitivity of Hollow
Cathode Performance to Design and Operating Parameters”, 35th Joint Propulsion
Conference, Los Angeles, CA, USA, June 1999, AIAA-99-2576.
44. Mizrahi, J., V. Vekselman, V. Gurovich, and Y. E. Krasik, “Simulation of
Plasma Parameters During Hollow Cathodes Operation”, Journal of Propulsion
and Power , Vol. 28, No. 5, pp. 1134–1137, 2012.
45. Albertoni, R., D. Pedrini, F. Paganucci, and M. Andrenucci, “A Reduced Order
Model For Thermionic Hollow Cathodes”, IEEE Transactions on Plasma Science,
Vol. 43, No. 7, pp. 1731–1745, 2013.
46. Mikellides, I. G. and I. Katz, “Wear Mechanisms in Electron Sources for Ion Propul-
sion, 1: Neutralizer Hollow Cathode”, Journal of Propulsion and Power , Vol. 24,
No. 4, pp. 855–865, 2008.
47. Mikellides, I. G., “Effects of Viscosity in a Partially Ionized Channel Flow With
Thermionic Emission”, Physics of Plasma, Vol. 16, No. 1, p. 013501, 2009.
48. Mikellides, I. G., D. M. Goebel, J. S. Snyder, I. Katz, and D. A. Herman, “The
Discharge Plasma In Ion Engine Neutralizers: Numerical Simulations and Com-
parisons With Laboratory Data”, Journal of Applied Physics , Vol. 108, No. 11, p.
113308, 2010.
49. Mikellides, I. G., I. Katz, D. M. Goebel, K. K. Jameson, and J. E. Polk, “Wear
Mechanisms in Electron Sources for Ion Propulsion, II: Discharge Hollow Cathode”,
Journal of Propulsion and Power , Vol. 24, No. 4, pp. 866–879, 2008.
50. Katz, I., I. G. Mikellides, D. M. Goebel, and J. E. Polk, “Insert Heating and
Ignition in Inert-Gas Hollow Cathodes”, IEEE Transactions on Plasma Science,
Vol. 36, No. 5, pp. 2199–2206, 2008.
51. Boyd, I. D. and M. W. Crofton, “Modelling the Plasma of a Hollow Cathode”,
83
Journal of Applied Physics , Vol. 95, No. 7, pp. 3285–3296, 2004.
52. Levko, D., Y. E. Krasik, V. Vekselman, and I. Haber, “Two Dimensional Model
of Orificed Micro Hollow Cathode Discharge For Space Application”, Physics of
Plasmas , Vol. 20, No. 8, p. 083512, 2013.
53. Crawford, F. W. and I. L. Freeston, “The Double Sheath at a Discharge Constric-
tion”, 6th International Conference on Ionization Phenomena in Gases , Paris, July
1963, v.1 pp. 461-464.
54. Goebel, D. M., K. K. Jameson, R. M. Watkins, and I. Katz, “Hollow Cathode
and Keeper-Region Plasma Measurements Using Ultra-Fast Miniature Scanning
Probes”, 40th Joint Propulsion Conference, Fort Lauderdale, FL, USA, July 2004,
AIAA-2004-3430.
55. Malik, A. K., P. Montarde, and M. G. Haines, “Spectroscopic Measurements on
Xenon Plasma in a Hollow Cathode”, Journal of Physics D: Applied Physics ,
Vol. 33, No. 16, pp. 2037–2048, 2000.
56. Siegfried, D. E. and P. J. Wilbur, “A Model for Mercury Orificed Hollow Cath-
odes:Theory and Experiment”, AIAA Journal , Vol. 22, No. 10, pp. 1405–1412,
1984.
57. Chu, E. and D. M. Goebel, “High-Current Lanthanum Hexaboride Hollow Cathode
for 10-to-50-kW Hall Thrusters”, IEEE Transactions on Plasma Science, Vol. 40,
No. 9, pp. 2133–2144, 2012.
58. Domonkos, M. T., “A Particle and Energy Balance Model of the Orificed Hollow
Cathode”, 38th Joint Propulsion Conference, Indianapolis, IN, USA, July 2002,
AIAA-2002-4240.
59. Tanaka, T., “The Thermal and Electrical Conductivities of LaB6 at High Temper-
atures”, Journal of Physics C: Solid State Physics , Vol. 7, No. 9, pp. L177–L180,

84
1974.
60. Incropera, F. P. and D. P. DeWitt, Fundamentals of Heat and Mass Transfer , New
York, USA: John Wiley & Sons, 1996.
61. Capacci, M. and A. S. M. Minucci, “Simple Numerical Model Describing Discharge
Parameters in Orificed Hollow Cathode Devices”, 33rd Joint Propulsion Confer-
ence, Seattle, WA, USA, July 1997, AIAA-97-2791.
62. Siegfried, D. E. and P. J. Wilbur, “An Investigation of Mercury Hollow Cathode
Phenomena”, 13th International Electric Propulsion Conference, San Diego, CA,
USA, April 1978, AIAA-78-705.
63. Salhi, A., “Theoretical and Experimental Studies of Orificed, Hollow Cathode Op-
eration”, Ph.D. Thesis, Ohio State University, Columbus, OH, USA, 1993.
64. Goebel, D. M., K. K. Jameson, and R. R. Hofer, “Hall Thruster Cathode Flow
Impact on Coupling Voltage and Cathode Life”, Journal of Propulsion and Power ,
Vol. 28, No. 2, pp. 355–363, 2012.
65. Jameson, K. K., D. M. Goebel, and R. M. Watkins, “Hollow Cathode and Thruster
Discharge Chamber Plasma Measurements Using High-Speed Scanning Probes”,
29th International Electric Propulsion Conference, Princeton, NJ, USA, October
2005, IEPC-2005-269.
66. Siegfried, D. E., “A Phenomenological Model for Orificed Hollow Cathodes”, Ph.D.
Thesis, Colorado State University, Fort Collins, CO, USA, 1992.
67. Polk, J., C. Marrese, B. Thornber, L. Dang, and L. Johnson, “Temperature Dis-
tributions in Hollow Cathode Emitters”, 40th Joint Propulsion Conference, Fort
Lauderdale, FL, USA, July 2004, AIAA-2004-4116.
68. Noord, J. L. V., H. Kamhawi, and H. K. McEwen, “Characterization of a High
85
Current, Long Life Hollow Cathode”, 29th International Electric Propulsion Con-
ference, Princeton, NJ, USA, October 2005, IEPC-2005-321.
69. Katz, I., I. G. Mikellides, J. E. Polk, D. M. Goebel, and S. E. Hornbeck, “Ther-
mal Model of the Hollow Cathode Using Numerically Simulated Plasma Fluxes”,
Journal of propulsion and power , Vol. 23, No. 3, pp. 527–526, 2007.
70. Mikellides, I. G., I. Katz, D. M. Goebel, and J. E. Polk, “Theoretical Model of a
Hollow Cathode Plasma for the Assessment of Insert and Keeper Lifetimes”, 41st
Joint Propulsion Conference, Tucson, AZ, USA, July 2005, AIAA-2005-4234.
71. Plasek, M. L., B. Jorns, E. Y. Choueiri, and J. E. Polk, “Exploration of RF-
Controlled High Current Density Hollow Cathode Concepts”, 48th Joint Propulsion
Conference, Atlanta, GA, USA, July 2012, AIAA-2012-4083.
72. Herring, C. and M. H. Nichols, “Thermionic Emission”, Reviews of Modern
Physics , Vol. 21, No. 2, p. 185, 1949.