global nanomaterials opportunity and emerging · pdf file · 2013-04-26global...
TRANSCRIPT

Creating the Equation for Growth
Global Nanomaterials Opportunity and
Emerging Trends
Creating the Equation for Growth
Lucintel Brief
Published : March 2011
Lucintel
1320 Greenway Dr., Suite 870, Las Colinas, TX 75038, USA.
Tel: +1-972-636-5056, E-mail: [email protected]
Copyright © Lucintel
Creating the Equation for Growth
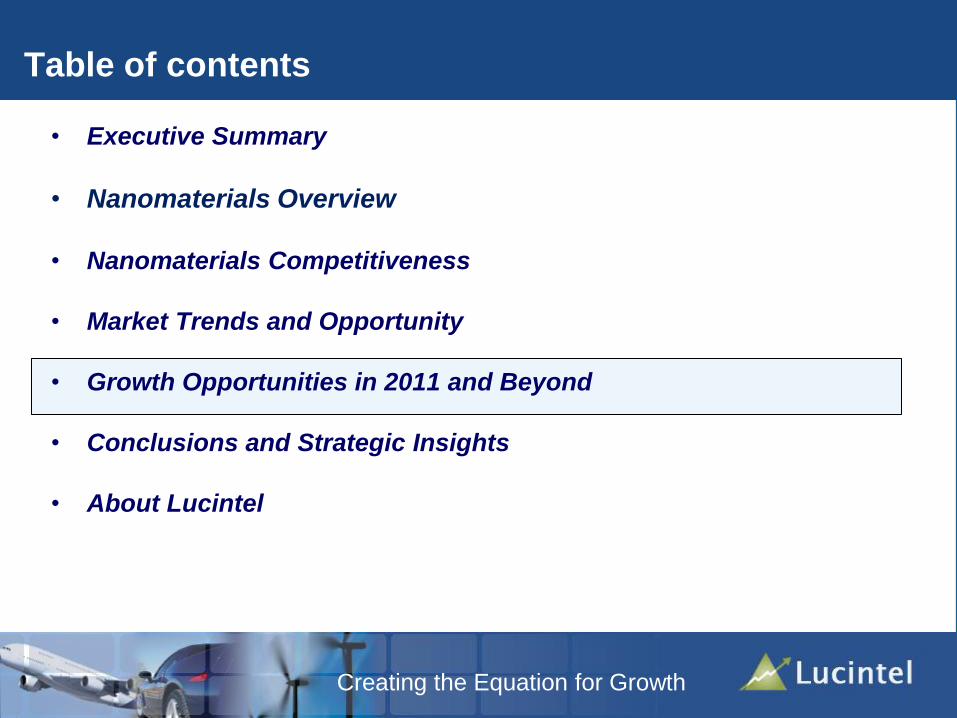
Table of contents
• Executive Summary
• Nanomaterials Overview
• Nanomaterials Competitiveness
• Market Trends and Opportunity
• Growth Opportunities in 2011 and Beyond
• Conclusions
• About Lucintel
Creating the Equation for Growth
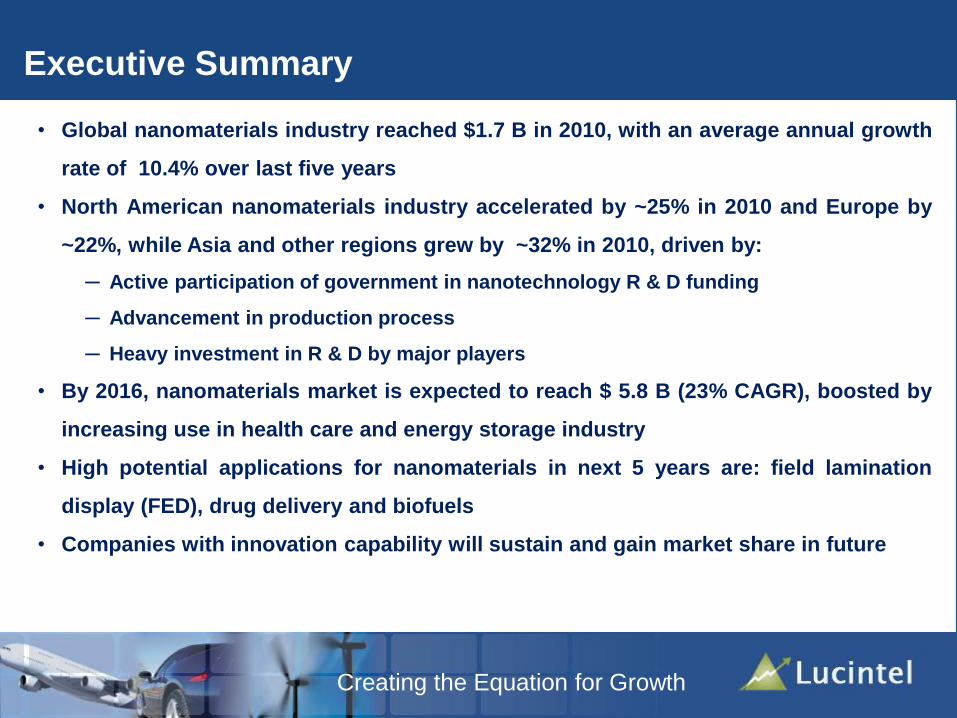
Executive Summary
• Global nanomaterials industry reached $1.7 B in 2010, with an average annual growth
rate of 10.4% over last five years
• North American nanomaterials industry accelerated by ~25% in 2010 and Europe by
~22%, while Asia and other regions grew by ~32% in 2010, driven by:
─ Active participation of government in nanotechnology R & D funding
─ Advancement in production process
─ Heavy investment in R & D by major players
• By 2016, nanomaterials market is expected to reach $ 5.8 B (23% CAGR), boosted by
increasing use in health care and energy storage industry
• High potential applications for nanomaterials in next 5 years are: field lamination
display (FED), drug delivery and biofuels
• Companies with innovation capability will sustain and gain market share in future

Creating the Equation for Growth
4
• Executive Summary
• Nanomaterials Overview
• Nanomaterials Competitiveness
• Market Trends and Opportunity
• Growth Opportunities in 2011 and Beyond
• Conclusions
• About Lucintel
Table of contents
Creating the Equation for Growth
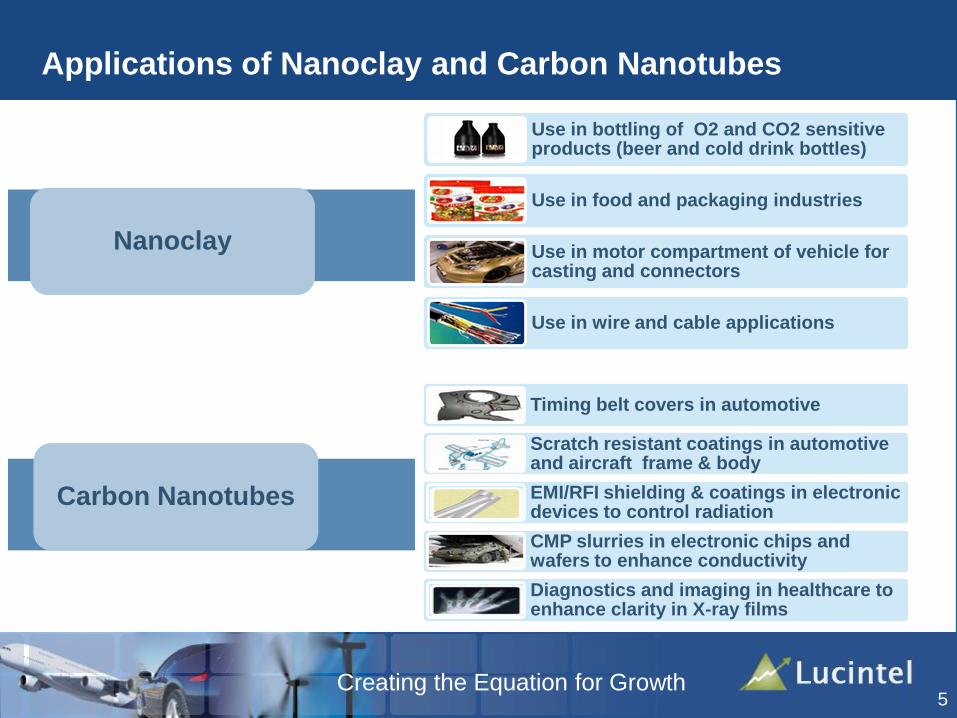
Applications of Nanoclay and Carbon Nanotubes
5
Nanoclay
Carbon Nanotubes
Timing belt covers in automotive
Scratch resistant coatings in automotive and aircraft frame & body
EMI/RFI shielding & coatings in electronic devices to control radiation
CMP slurries in electronic chips and wafers to enhance conductivity
Diagnostics and imaging in healthcare to enhance clarity in X-ray films
Use in bottling of O2 and CO2 sensitive products (beer and cold drink bottles)
Use in food and packaging industries
Use in motor compartment of vehicle for casting and connectors
Use in wire and cable applications

Creating the Equation for Growth
Current and Potential Applications
6
Meat & Food Packaging
Computers & Electronics
Medicines & Pharmaceuticals
Beer Bottles
Packaging
Conductive Flooring
Pipes
Insulating Materials for Roofs & Thatches
House & Building Siding
Self Cleaning Windows
Construction
Engine & Fuel Systems
Scratch Resistant Exterior Parts and Coatings
Car Interior
Aircraft Structure &
Framing
Wear Resistant Paints & Coatings for Defense
Vehicles
Transportation

Creating the Equation for Growth
Current and Potential Applications
7
Health Care
Consumer Goods
Body implants
Medical devices
Dental filling materials
Others
Anti-foul coatings for marine ships
Industrial equipment to increase strength
Fire resistant clothes
Sensors
Semiconductors
Hard disk storage in computers
Electrical &
Electronics
Energy
Home appliances
Sporting goods & toys
Furniture & others
Battery electrodes
Fuel cell membranes
Supercapacitors
Creating the Equation for Growth
8
• Executive Summary
• Nanomaterials Overview
• Nanomaterials Competitiveness
• Market Trends and Opportunity
• Growth Opportunities in 2011 and Beyond
• Conclusions
• About Lucintel
Table of contents

Creating the Equation for Growth
Cost and property analysis of nanomaterials with respect
to other materials
9
MaterialsStrength Modulus Price Weight
Surface
Area
Wear
Resistance
Barrier
Property
Electrical
Conductivity
Nanomateri
als
Ceramic
Kevlar
(Aramid)
Glass
Fibers
Carbon
Fibers
High Medium Low- Medium Low
Key Insights
Least
• Nanomaterials have the highest strength, modulus, wear resistance, barrier property and electrical
conductivity when compared with other materials

Creating the Equation for Growth
10
• Executive Summary
• Nanomaterials Overview
• Nanomaterials Competitiveness
• Market Trends and Opportunity
• Growth Opportunities in 2011 and Beyond
• Conclusions
• About Lucintel
Table of contents
Creating the Equation for Growth
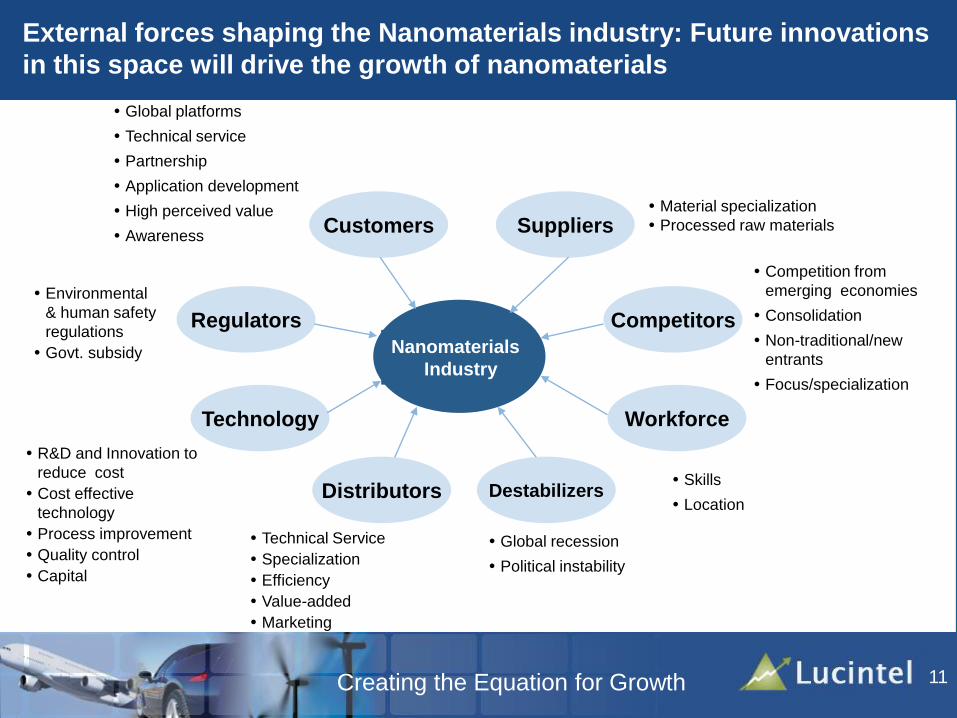
External forces shaping the Nanomaterials industry: Future innovations
in this space will drive the growth of nanomaterials
11
Nanomaterials
Industry
SuppliersCustomers
Competitors
WorkforceTechnology
Regulators
Material specialization
Processed raw materials
Competition from
emerging economies
Consolidation
Non-traditional/new
entrants
Focus/specialization
Skills
Location
Global recession
Political instability
Technical Service
Specialization
Efficiency
Value-added
Marketing
DestabilizersDistributors
R&D and Innovation to
reduce cost
Cost effective
technology
Process improvement
Quality control
Capital
Environmental
& human safety
regulations
Govt. subsidy
Global platforms
Technical service
Partnership
Application development
High perceived value
Awareness

Creating the Equation for Growth
Geographical breakdown for nanomaterials
12
37%
Asia & Others
Europe
25%
38%
North America
Global nanomaterials distribution ($ mil)
by regions in 2010
• North America and Europe were the two largest
markets for nanomaterials in 2010
• European region has significant use of nano-
materials in pharmaceuticals, as many
pharmaceutical companies are based in Europe
• Good growth of nanomaterials was witnessed
in Asia region during last 5 years due to:
─Government support
─Continued environmental consciousness
─Expected increase in demand for specialty
materials
Key Insights

Creating the Equation for Growth
Nanomaterials Market: Trend and Forecast
13
1.7
5.8
2010 2016
1.0
2005CAGR
+10%
+23%
Drivers For Nanomaterials Investment
Emerging
Applications
• It is expected that nanomaterials
to be extensively used in emerging
applications like water treatment,
drug delivery, nanomedicines, etc
Price•Decrease in price of nanomaterials
may take place due to advanced
production techniques
Patents• The number of patents regarding
manufacturing of nanomaterials is
increasing year after year
Top 3 Market Segments Region wise
EuropeNorth America RoW
Health& Personal
CareE&E E&E
E&EHealth& Personal
CareTransportation
TransportationEnergy Storage
DevicesPackaging
Electrical & Electronics (E&E) market
witnessed a robust growth due to the large
price decrease of carbon nanotubes and
increase in mass production of nanomaterials
Trend and forecast in nanomaterials
shipment ($ B): 2005-2016
Creating the Equation for Growth
14
• Executive Summary
• Nanomaterials Overview
• Nanomaterials Competitiveness
• Market Trends and Opportunity
• Growth Opportunities in 2011 and Beyond
• Conclusions and Strategic Insights
• About Lucintel
Table of contents
Creating the Equation for Growth
CA
GR
(2
011
-20
16)
Market Size (US$ M)
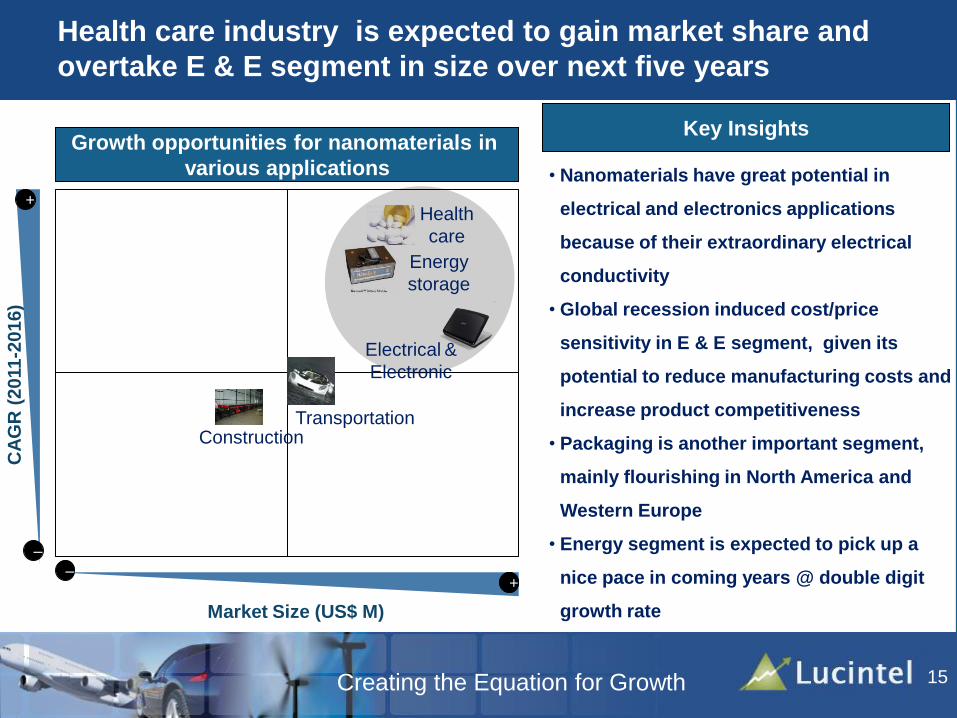
Health care industry is expected to gain market share and
overtake E & E segment in size over next five years
15
+
+
–
–
Health
care
Energy
storage
Electrical &
Electronic
TransportationConstruction
Growth opportunities for nanomaterials in
various applications
+
• Nanomaterials have great potential in
electrical and electronics applications
because of their extraordinary electrical
conductivity
• Global recession induced cost/price
sensitivity in E & E segment, given its
potential to reduce manufacturing costs and
increase product competitiveness
• Packaging is another important segment,
mainly flourishing in North America and
Western Europe
• Energy segment is expected to pick up a
nice pace in coming years @ double digit
growth rate
Key Insights

Creating the Equation for Growth16
Emerging Trends
in the Global
Nanocomposites
Industry
Emerging Trends in the Global Nanocomposites Industry
Trend A
Trend B
Trend C
Trend D
Growing demand for high
strength, durable structural
materials
New material development
and product design
New and emerging market
applications
Falling nanocomposites prices
Trend EHuge expansion by existing
suppliers and new entrants
Trend FGovernment support and
R&D funding
Creating the Equation for Growth
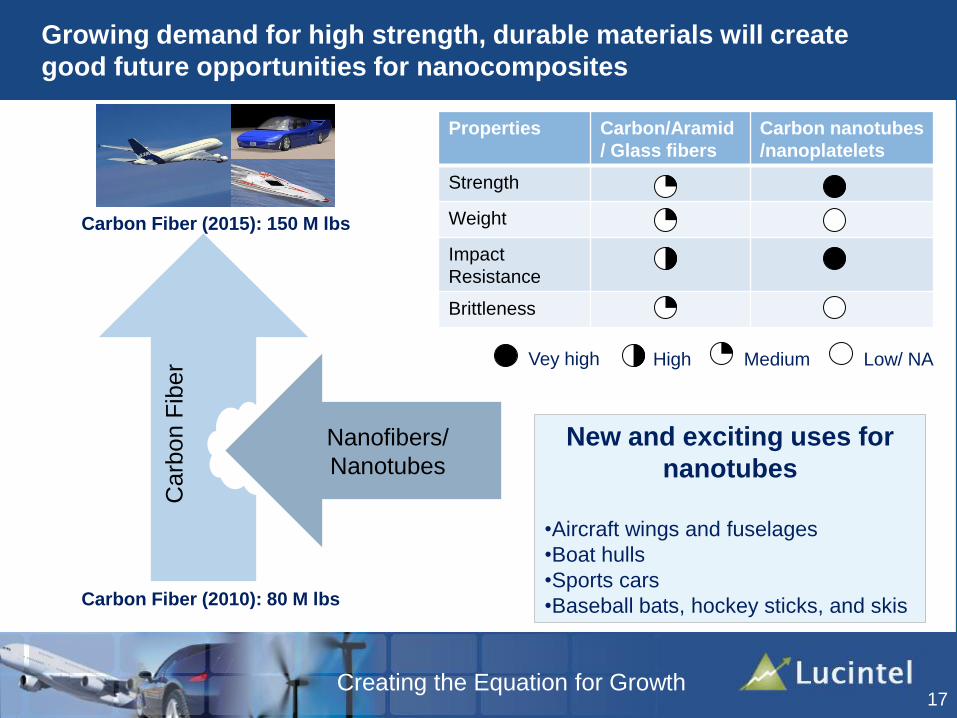
Growing demand for high strength, durable materials will create
good future opportunities for nanocomposites
17
Carb
on F
iber
Nanofibers/
Nanotubes
Carbon Fiber (2010): 80 M lbs
Carbon Fiber (2015): 150 M lbs
Properties Carbon/Aramid
/ Glass fibers
Carbon nanotubes
/nanoplatelets
Strength
Weight
Impact
Resistance
Brittleness
New and exciting uses for
nanotubes
•Aircraft wings and fuselages
•Boat hulls
•Sports cars
•Baseball bats, hockey sticks, and skis
Vey high High Medium Low/ NA
Creating the Equation for Growth
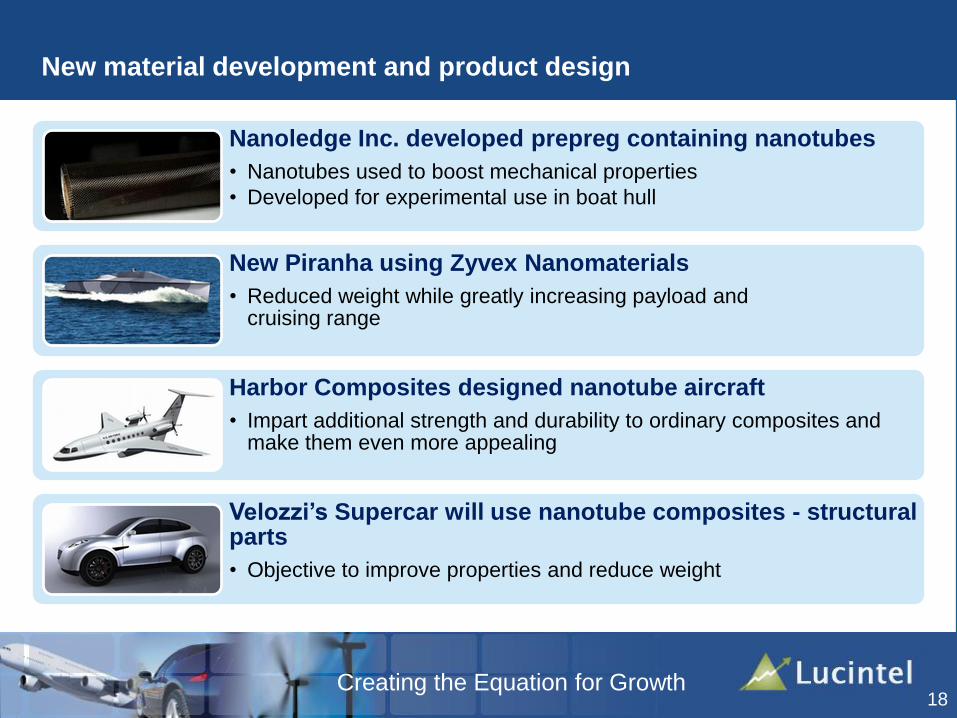
New material development and product design
18
Nanoledge Inc. developed prepreg containing nanotubes
• Nanotubes used to boost mechanical properties
• Developed for experimental use in boat hull
New Piranha using Zyvex Nanomaterials
• Reduced weight while greatly increasing payload and cruising range
Harbor Composites designed nanotube aircraft
• Impart additional strength and durability to ordinary composites and make them even more appealing
Velozzi’s Supercar will use nanotube composites - structural parts
• Objective to improve properties and reduce weight

Creating the Equation for Growth
Technical developments in CNT promise further capacity expansion
and price reduction
19
Key Insights
•CNT prices have fallen substantially, from
more than $150 per gram in 2000 to under $50
per gram today (2010)
•Improved manufacturing and large-scale
production by CVD process enabled the drop
in price
•Current technical developments in carbon
nanotube fabrication may encourage further
increase in production capacity and reduction
in prices
Global leaders increasing manufacturing capacity
Arkema
• Arkema has scheduled a production facility for carbon nanotubes with the capacity of 400 tons per year to start in 2011 in France
Bayer
• Bayer Material Science opened a carbon nanotube pilot facility in Germany, boosting annual capacity by 200 tons
Trend in percentage fall in multiwall carbon
nanomaterial cost: 2005-2010
-120%
-100%
-80%
-60%
-40%
-20%
0%
2005 2006 2007 2008 2009 2010
% C
ost
de
cre
ase
Year
Creating the Equation for Growth
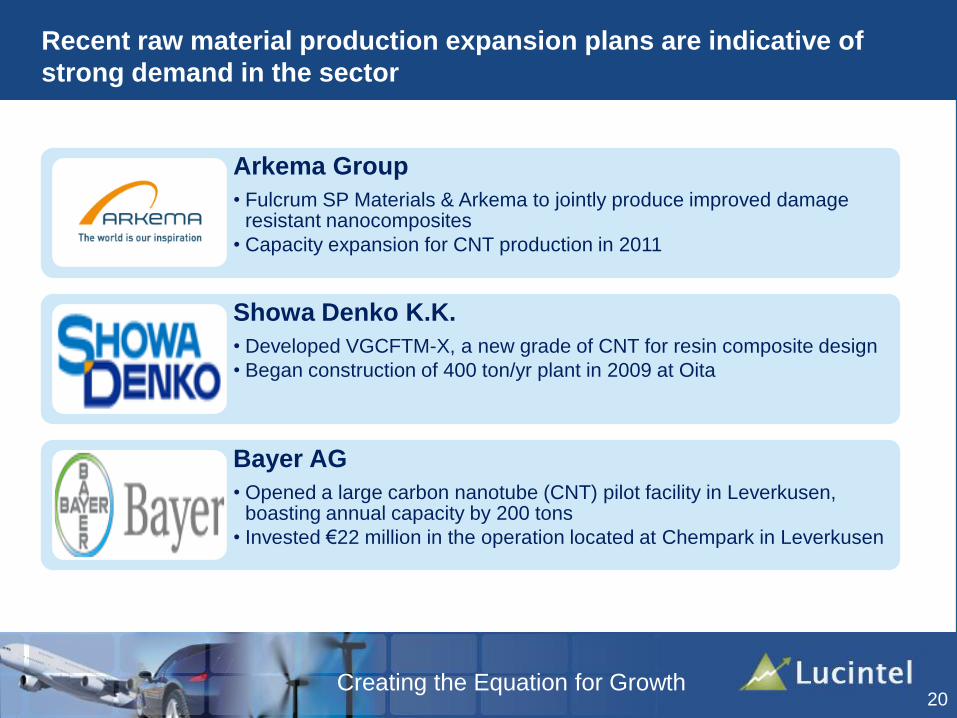
Recent raw material production expansion plans are indicative of
strong demand in the sector
20
Arkema Group
• Fulcrum SP Materials & Arkema to jointly produce improved damage resistant nanocomposites
• Capacity expansion for CNT production in 2011
Showa Denko K.K.
• Developed VGCFTM-X, a new grade of CNT for resin composite design
• Began construction of 400 ton/yr plant in 2009 at Oita
Bayer AG
• Opened a large carbon nanotube (CNT) pilot facility in Leverkusen, boasting annual capacity by 200 tons
• Invested €22 million in the operation located at Chempark in Leverkusen
Creating the Equation for Growth
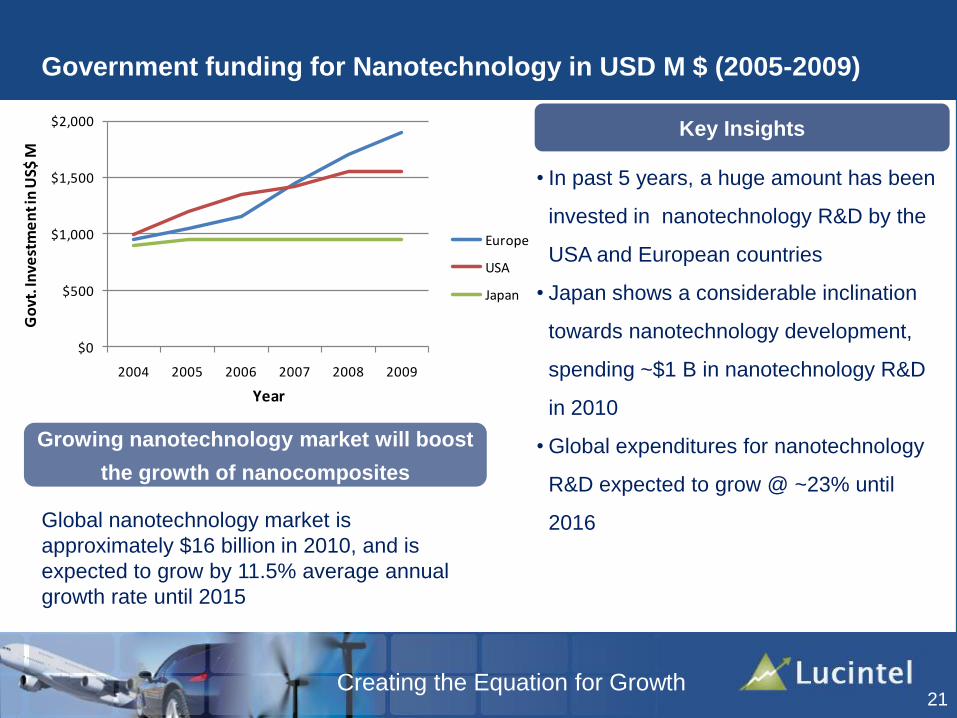
Government funding for Nanotechnology in USD M $ (2005-2009)
21
Key Insights
• In past 5 years, a huge amount has been
invested in nanotechnology R&D by the
USA and European countries
• Japan shows a considerable inclination
towards nanotechnology development,
spending ~$1 B in nanotechnology R&D
in 2010
• Global expenditures for nanotechnology
R&D expected to grow @ ~23% until
2016
$0
$500
$1,000
$1,500
$2,000
2004 2005 2006 2007 2008 2009
Go
vt. I
nve
stm
en
t in
US$
M
Year
Europe
USA
Japan
Global nanotechnology market is
approximately $16 billion in 2010, and is
expected to grow by 11.5% average annual
growth rate until 2015
Growing nanotechnology market will boost
the growth of nanocomposites
Creating the Equation for Growth
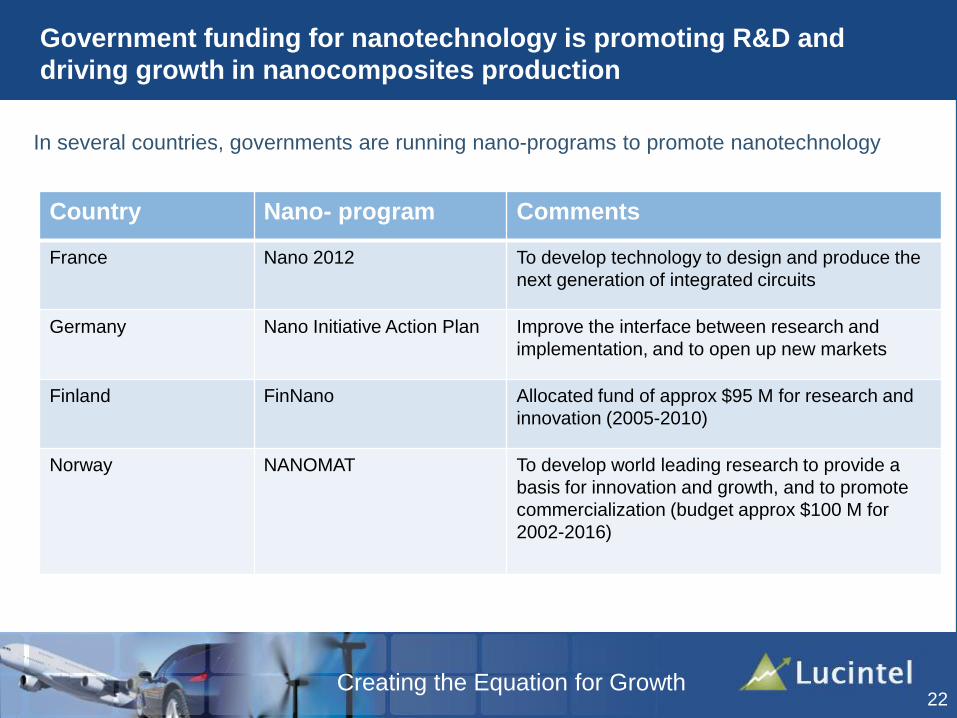
Government funding for nanotechnology is promoting R&D and
driving growth in nanocomposites production
22
In several countries, governments are running nano-programs to promote nanotechnology
Country Nano- program Comments
France Nano 2012 To develop technology to design and produce the
next generation of integrated circuits
Germany Nano Initiative Action Plan Improve the interface between research and
implementation, and to open up new markets
Finland FinNano Allocated fund of approx $95 M for research and
innovation (2005-2010)
Norway NANOMAT To develop world leading research to provide a
basis for innovation and growth, and to promote
commercialization (budget approx $100 M for
2002-2016)

Creating the Equation for Growth
Growing uses of nancomposites in transportation industry will
create huge demand in future
23
Nanoflakes for
SMC used in
larger
structures body
molding
Nanostructured
polymer
composites for
transparent
Tragholme
Nanostructure
control of
multi-material
welds
Nano-structured Mg
sheet and extrusions
for light weight hang-on
parts
Nanoparticles
for wear
resistant tires;
adherent long
running tires
Nano- enabled
LED lightsScratch
resistant
paints
Creating the Equation for Growth
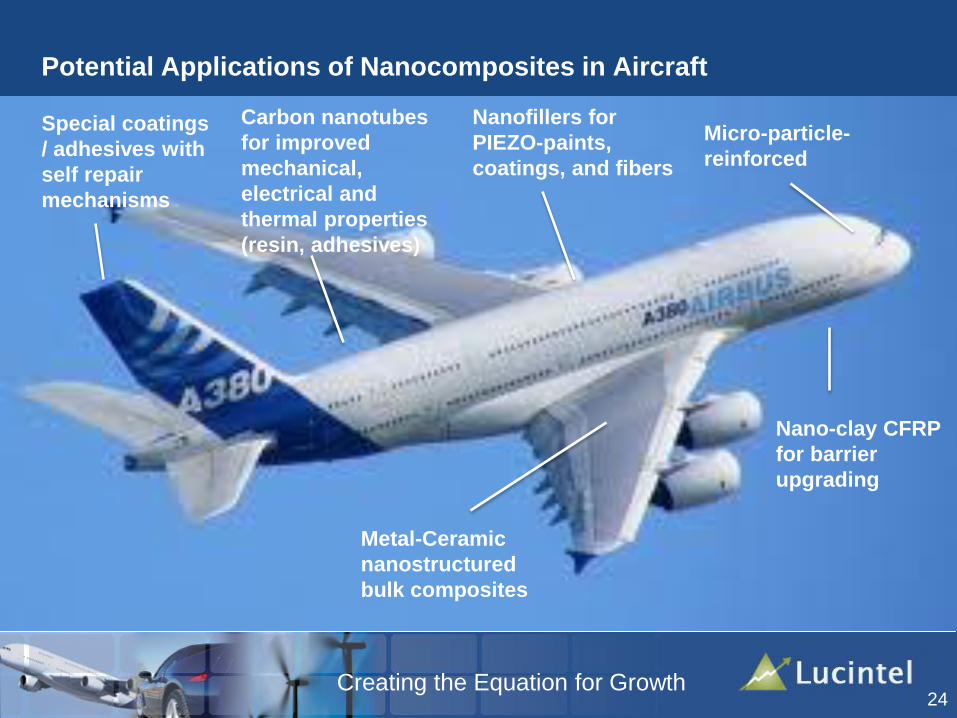
Potential Applications of Nanocomposites in Aircraft
24
Special coatings
/ adhesives with
self repair
mechanisms
Carbon nanotubes
for improved
mechanical,
electrical and
thermal properties
(resin, adhesives)
Nanofillers for
PIEZO-paints,
coatings, and fibers
Micro-particle-
reinforced
Metal-Ceramic
nanostructured
bulk composites
Nano-clay CFRP
for barrier
upgrading

Creating the Equation for Growth25
Nano-fibers and
channels for fuel
injection
Corrosion resistant
paints & coatingsNano-scale material
for catalytic
converters
Polymer
nanocomposite
sensors
High density &
power
nanocomposites
Nanocomposite
based hydrogen
storage
Nanopore fuel & oil
filter
Power Train
Future
Nano-enabled
batteries
Huge Potential of Nanocomposites in Future Power Trains
Creating the Equation for Growth
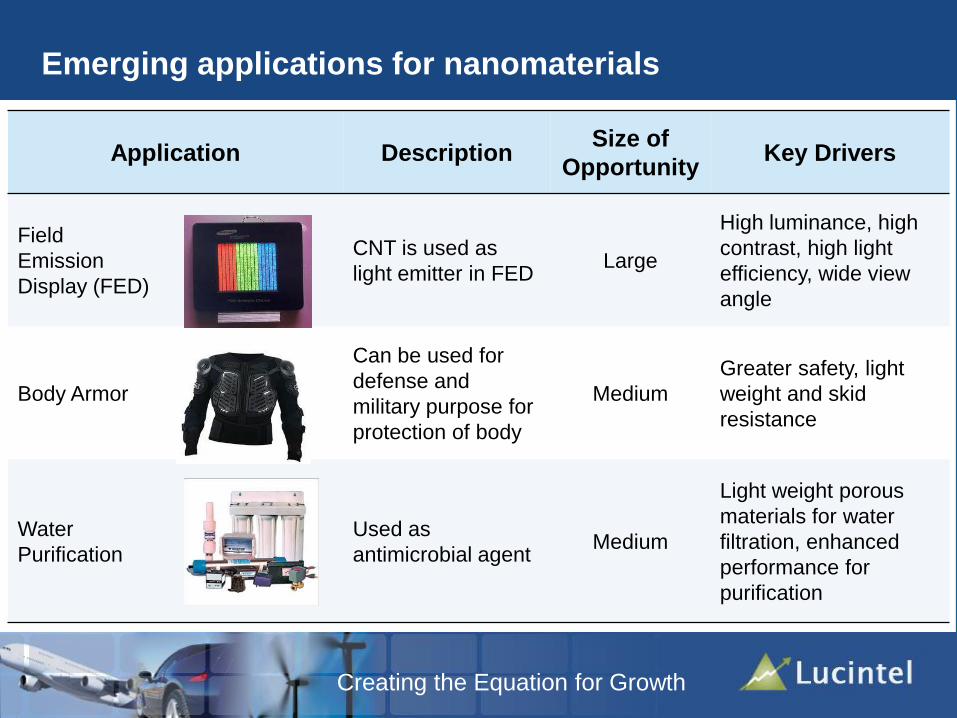
Emerging applications for nanomaterials
Application DescriptionSize of
OpportunityKey Drivers
Field
Emission
Display (FED)
CNT is used as
light emitter in FEDLarge
High luminance, high
contrast, high light
efficiency, wide view
angle
Body Armor
Can be used for
defense and
military purpose for
protection of body
Medium
Greater safety, light
weight and skid
resistance
Water
Purification
Used as
antimicrobial agentMedium
Light weight porous
materials for water
filtration, enhanced
performance for
purification

Creating the Equation for Growth
Emerging applications for nanomaterials: Cont….
27
Application DescriptionSize of
OpportunityKey Drivers
Drug Delivery
Used for improving
the treatment of
cancer
Medium
Enhanced mechanism
for treating the infected
cells
Bio Fuel Cell
Can be used as
electrodes in bio
fuel cell
Medium to
Large
High enzyme loading,
overcomes limitation
of small dimensions
and large specific
surface area
Creating the Equation for Growth
28
• Executive Summary
• Nanomaterials Overview
• Nanomaterials Competitiveness
• Market Trends and Opportunity
• Growth Opportunities in 2011 and Beyond
• Conclusions
• About Lucintel
Table of contents

Creating the Equation for Growth
Conclusions
• The nanomaterials market is expected to grow at about 23% annual rate until 2016
• Top 6 players have secured two-thirds of global nanomaterials market shipments; high
opportunity for new players to enter this growth market
• Decline in demand in 2009 for nano-enabled products in the automotive industry, such as
automotive lubricants, catalytic converters, sensors and filters, among others, drove the
heavy downturn in market opportunities for nanomaterials such as multi-wall carbon
nanotubes (MWNTs) and ceramic nanoparticles
• Health care and energy markets were two main application areas which helped the global
nanomaterial industry recover from the heavy downturn experienced in 2009.
• The healthcare industry is expected to surpass the electronic and electric industry in size over
the coming 2-3 years, driven by nanotechnology advancements in biomedical field
• North America will remain the market leading region for several years as it has significant
ongoing R & D activities in nanomaterials
• It is expected that nanomaterials will broaden their markets as they enter into more
applications such as drug delivery, armor, defense equipment, weapons, nanomedicines and
the like
29

Creating the Equation for Growth
30
• Executive Summary
• Nanomaterials Overview
• Nanomaterials Competitiveness
• Market Trends and Opportunity
• Growth Opportunities in 2011 and Beyond
• Conclusions
• About Lucintel
Table of contents
Creating the Equation for Growth31
Lucintel is the leading global management consulting & market
research firm for aerospace, marine, energy, construction, consumer
goods, transportation, chemical, and composites industries.
Lucintel creates your equation for growth and is committed to
actionable results that deliver significant value and long term growth
to our clients.
Lucintel has been creating measurable value for over 10 years and
for more than 1000 clients in 70 + countries worldwide.
Visit http://www.lucintel.com/imovie/ for a short 3.5-minute movie on
Lucintel solutions.
About Lucintel
Creating the Equation for Growth
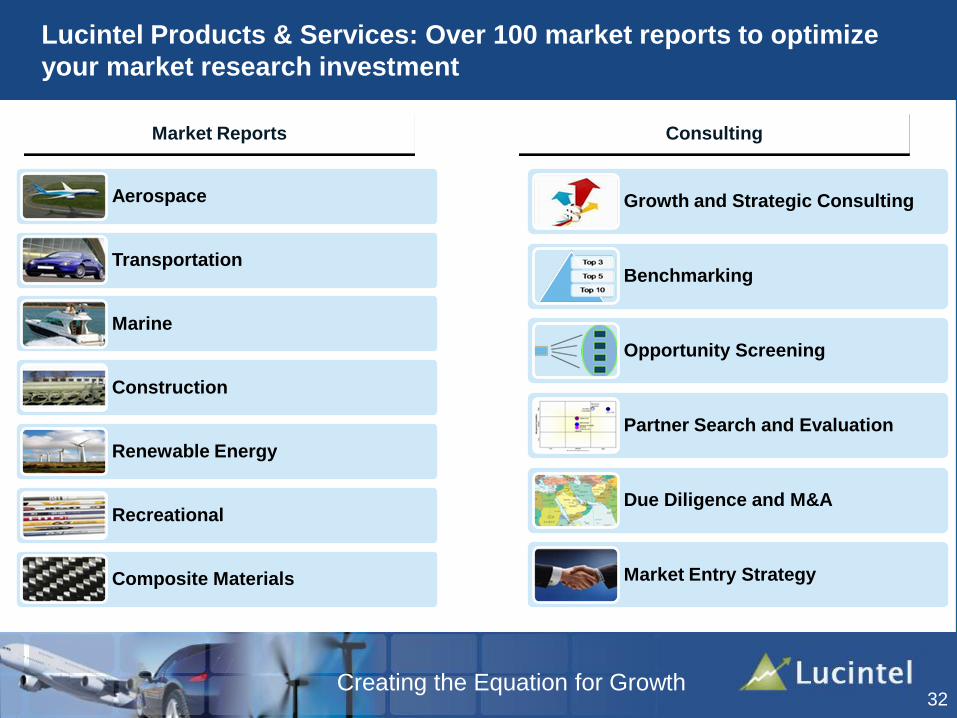
Lucintel Products & Services: Over 100 market reports to optimize
your market research investment
32
Aerospace
Transportation
Marine
Construction
Renewable Energy
Recreational
Composite Materials
Market Reports Consulting
Growth and Strategic Consulting
Benchmarking
Opportunity Screening
Partner Search and Evaluation
Due Diligence and M&A
Market Entry Strategy
Creating the Equation for Growth
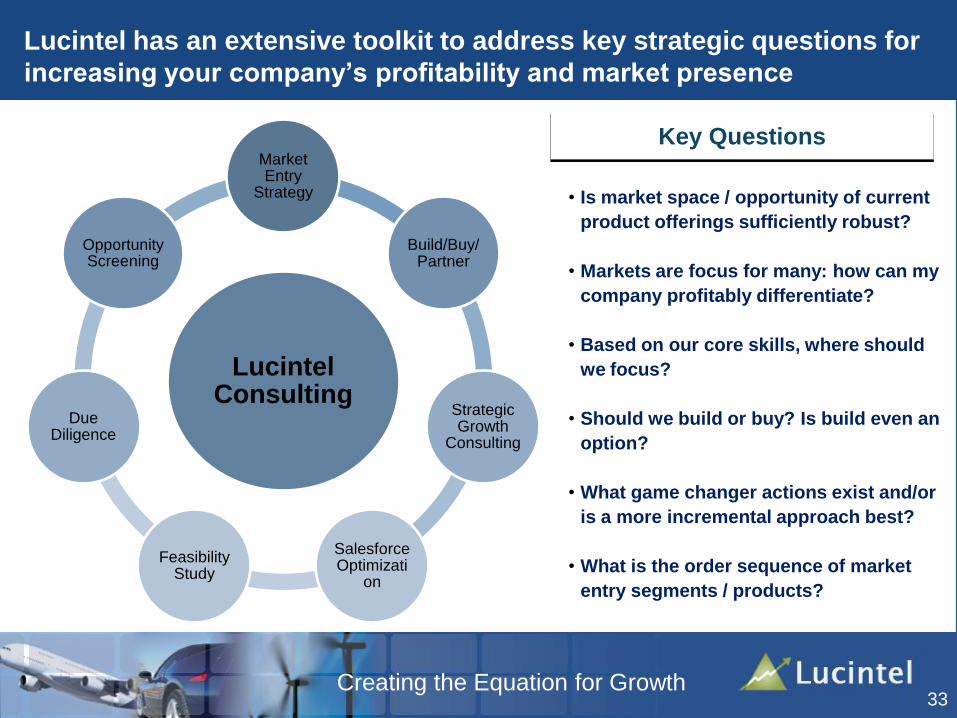
Lucintel has an extensive toolkit to address key strategic questions for
increasing your company’s profitability and market presence
33
• Is market space / opportunity of current
product offerings sufficiently robust?
• Markets are focus for many: how can my
company profitably differentiate?
• Based on our core skills, where should
we focus?
• Should we build or buy? Is build even an
option?
• What game changer actions exist and/or
is a more incremental approach best?
• What is the order sequence of market
entry segments / products?
Key Questions
Lucintel Consulting
Market Entry
Strategy
Build/Buy/Partner
Strategic Growth
Consulting
Salesforce Optimizati
on
Feasibility Study
Due Diligence
Opportunity Screening

Creating the Equation for Growth
Clients around the world value our services
34
Creating the Equation for Growth
Norman Timmins, MBA
VP, Consulting, USA
Cell :+1-940-597-3786
Roy Almaguer
Sales Manager, USA
Email: [email protected]
Tel. : +1-210-878-7693 (Office)
Alan Clark
Director of Sales, UK
Tel :+44 (0) 7875 708825
Nigel Odea
Business Development Manager, UK
Cell : +44 (0) 207 558 8798
Reach Lucintel
For your business requirements and cutting edge consulting solutions, contact
Lucintel at [email protected] or Tel. +1-972-636-5056 or call one of the
following.
35