global mobile consumer survey 2016 the netherlands mobile consumer survey 2016 the netherlands...
TRANSCRIPT
Global Mobile Consumer Survey 2016
The Netherlands

Welcome to the Dutch edition of the 2016 Deloitte Global Mobile Consumer Survey, our research study into global mobile consumer trends. This “Dutch cut” outlines the details around connectivity, device ownership, smartphone addiction, smartphone usage and emerging technologies.
For several years now, Deloitte has researched mobile consumer behavior on a global scale, focusing on the key aspects of devices, connectivity and usage. Our research provides not only the most important insights into the state of the market, but it also reveals the most insightful developments.
So what makes Dutch consumers tick, according to this year’s “Dutch Cut”? Is it quality or price? And is SIM only penetration still spreading rapidly?
And what about device ownership? Have smartphone penetration and tablet and laptop ownership increased again? In fact, the Netherlands is among the leading countries in the field of smartphone penetration. The Dutch have even grown a little addicted to using their phones around the clock, responding to messages in the middle of the night.
The question rises what Dutch consumers use their smartphones for - for social networks, gaming, checking their e-mails, mobile banking, or all of the above? And are they prepared for a future in which connected devices –the Internet of Things – will become common usage? The answers to these questions, and more, are included in this survey.
We hope this study gives you the insight and data to enhance your understanding of the opportunities and challenges ahead, and we welcome your feedback.
3Deloitte - Global Mobile Consumer Survey 2016 - NL Edition
Global Mobile Consumer Survey 2016

4Deloitte - Global Mobile Consumer Survey 2016 - NL Edition
Global Mobile Consumer Survey 20165 continents, 31 countries, 53,000 respondents
The Netherlands3,000 Respondents Nationally representativeAdults 18-75 Online polling
United States
Russia
China
Indonesia
Australia
Thailand
Philippines
Colombia
Brazil
Canada
IndiaMexico
Argentina
Israel
Saudi Arabia
JapanSouth Korea
SingaporeMalaysia
France
United Kingdom Netherlands
Finland
Italy
Belgium
Sweden
Luxembourg
Norway
PolandIrelandGermany
Contents
Executive Summary 6
The Speed Game 8
Smartphone Society 24
Addiction Around The Clock 38
The Device of Unlimited Opportunities 46
The Future Starts Tomorrow (Not Today) 56
Contact 62
6Deloitte - Global Mobile Consumer Survey 2016 - NL Edition
Executive Summary (1/2)
The Speed Game
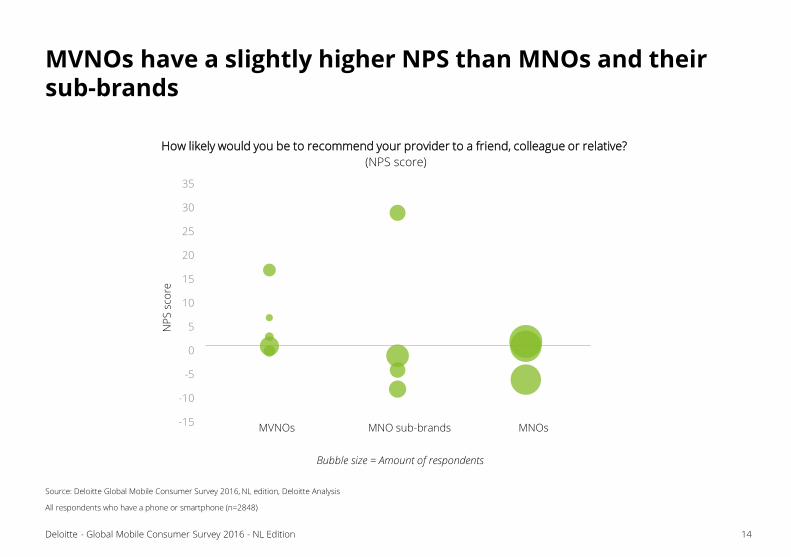
The Dutch are well connected – and they like speed. In fact, 4G technology is now used by over half of all the Dutch. Those who use 4G perceive it to be faster than Wi-Fi, especially in rural areas. They are also more likely to recommend their operator than customers on 3G technology.
However, even though the speed and quality of a mobile connection are important to the Dutch, their most important criterion for choosing an operator remains pricing. How very Dutch. This is especially true for customers of MVNOs and MNO sub-brands. These customers are more likely to recommend their operator to others than MNO customers. A trend which is also reflected in the shift in market share. MVNOs and MNO sub-brands are gaining market share at the cost of MNOs.
The growth of SIM only, which was significant last year, is more moderate now. Of all mobile customers, 42% is now on a SIM only contract. Consumers mainly use mobile voice and data. Interest in other services is low, with only 13% of consumers having Value Added Services (such as music streaming services) from their mobile operator and only 35% of consumers buying their fixed services. Also, voice and SMS services are rapidly declining, in favor of mobile VoIP.
Smartphone Society
The Dutch are growing more and more fond of their smartphones. In fact, the Netherlands is among the leading countries when it comes to smartphone penetration. This penetration is still increasing, mainly driven by the 19% year-on-year growth in the 55+ age segment. On the other hand, tablet and laptop ownership has stabilized.
How do Dutch consumers obtain their smartphones? In nearly half the cases they purchase them online. When it comes to purchasing a brand new model, Apple users are most likely to purchase it immediately after release. Apple can also claim the highest market share in the corporate smartphone market and in brand loyalty of their customers. However, market share of new devices is still highest for Samsung, as well as the total market share.
7Deloitte - Global Mobile Consumer Survey 2016 - NL Edition
Executive Summary (2/2)
Addiction Around The Clock
Not only has smartphone penetration increased – so has smartphone usage. Consumers prefer a tablet for most activities, but they have grown accustomed to using their phones around the clock for a variety of activities. Some of them even respond to messages in the middle of the night. 31% of all respondents have had arguments about their phone usage, especially with their significant other. Phone usage at night is highest among 18 – 24 year olds: 54% check their phone when they should be sleeping.
The Device Of Unlimited Opportunities
One of the activities for which smartphones are used, is sharing and recording photos and videos, especially when consumers have access to 4G technology. Also, smartphones are preferred for social networking – and increasingly for mobile banking. When it comes to commercial activities, consumers mostly surf shopping sites and pay for products on smartphones. 43% of respondents have used their phone to transfer money to another individual. In fact, the Netherlands has become one of the leading countries in the field of mobile banking. However, security is still an issue, with 26% of people not having a security measure in place to lock their phone. Fingerprint readers are used by 68% of consumers who have one on their phone.
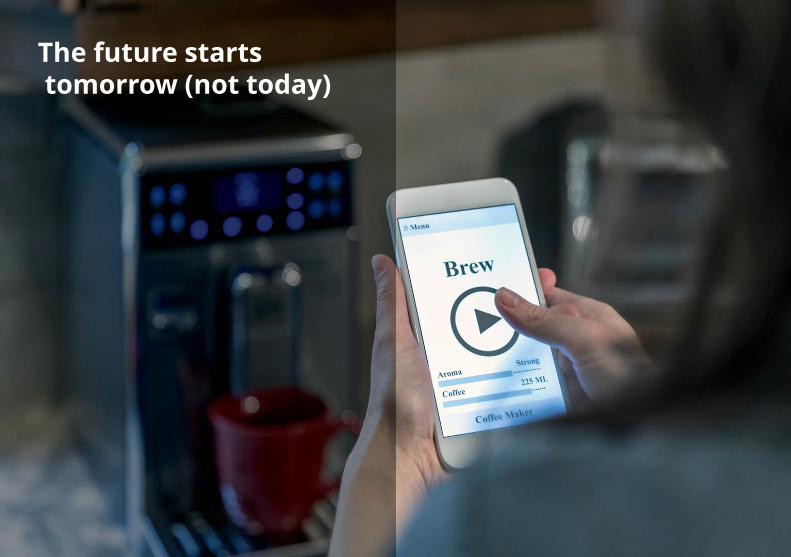
The Future Starts Tomorrow (Not Today)
When it comes to technologies such as the Internet of Things, consumers seem a little cautious. Connected devices are still a niche market for consumers. Even though 50% has a connected device, these are mostly entertainment products and only 10% considers to purchase connected products in the coming year. Virtual Reality device adoption is also low, especially considering the amount of low-end, cardboard, products. Apparently, the future starts tomorrow for most consumers - not today.

The Speed Game
The name of the game is speed, and this seems especially
true for smartphone users. This year, adoption of 4G has
reached nearly 55%. Even though this is an increase of 51%
since last year, the Netherlands lost its top 3 position in
Europe in terms of adoption. Our analysis shows that
consumers also perceive 4G to be faster than Wi-Fi, whether
they are out and about or at home. We see that this
perception of speed is especially higher in rural areas. The
perception and availability of speed is also reflected in
operator appreciation, as consumers with a 4G connection
tend to give their mobile operator a higher Net Promoter
Score (NPS) than 3G users. When looking at operators’ NPS,
our research shows that consumers score MVNOs higher
than MNOs or their sub-brands.
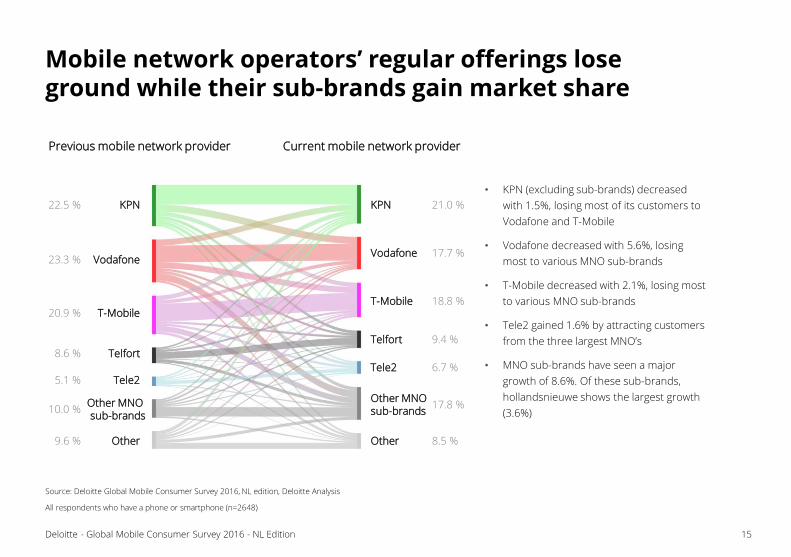
Similar to last year, MNOs continue to lose market share,
predominantly to their sub-brands. We see that SIM only
penetration continues to grow for the third year in a row,
although growth seems to slow down this year. Our research
also shows that consumers’ choice for an operator is still
mainly driven by price. Even though this is especially true for
MVNO and MNO sub-brand subscribers, price is also an
important consideration for MNO subscribers, next to a good
connection quality and sufficient product differentiation.
This year’s research also shows a decline in consumers’ use
of traditional telecommunication services such as traditional
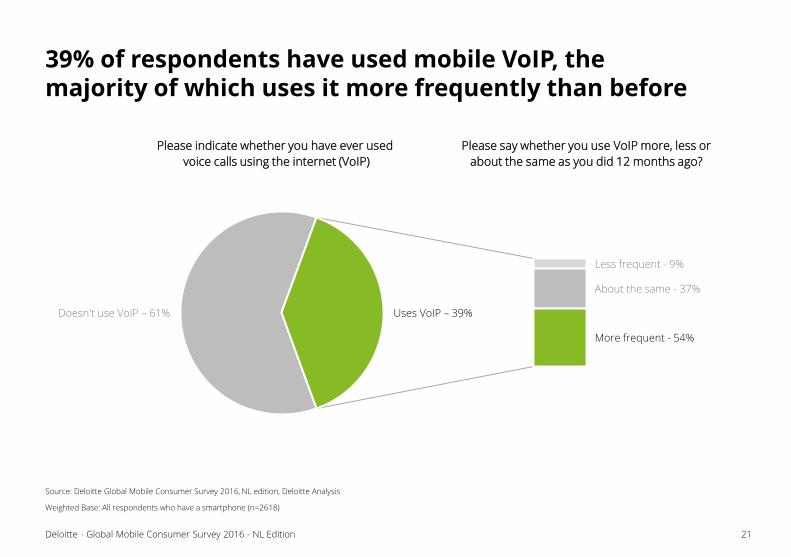
voice and SMS. As much as 39% of respondents indicate that
they have used mobile VoIP and the majority of this group is
using VoIP more often than before. Furthermore, instant
messages and e-mail are still growing, though growth seems
to slow down. Looking at online preferred communications
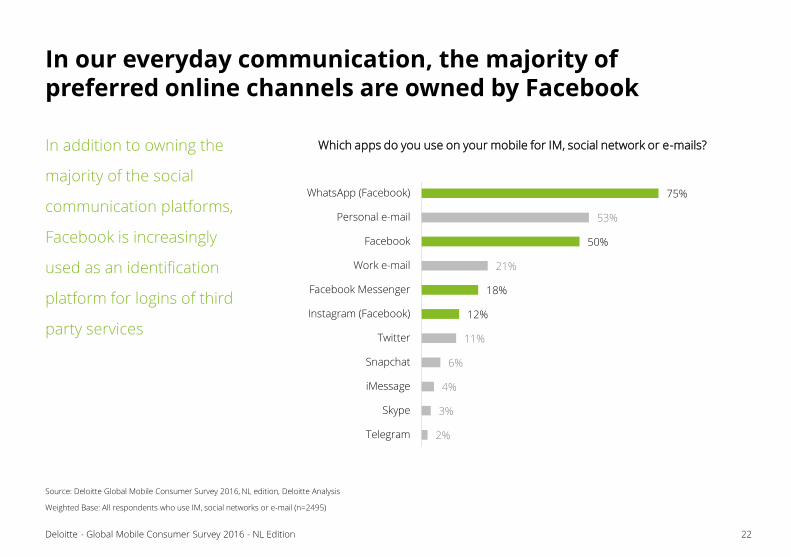
services, analysis shows that two-thirds of our top 6 channels
are owned by Facebook.
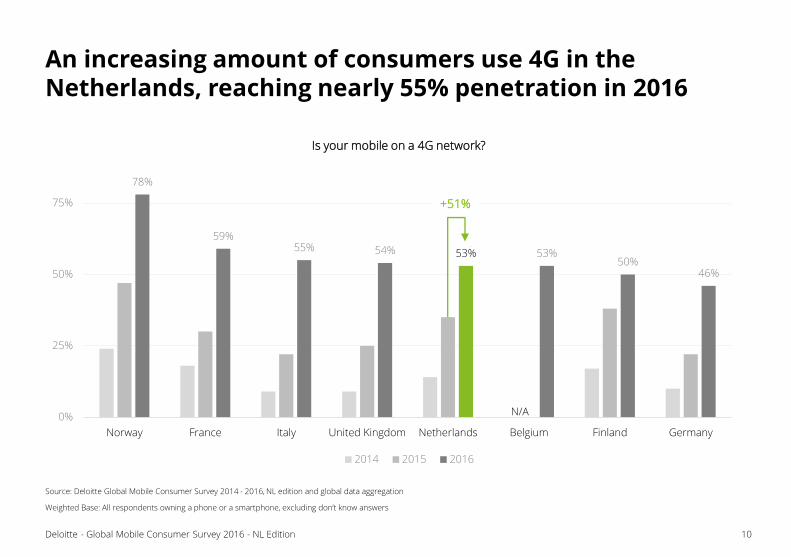
78%
59%55% 54% 53% 53%
50%46%
0%
25%
50%
75%
Norway France Italy United Kingdom Netherlands Belgium Finland Germany
2014 2015 2016
.
10Deloitte - Global Mobile Consumer Survey 2016 - NL Edition
An increasing amount of consumers use 4G in the Netherlands, reaching nearly 55% penetration in 2016
Source: Deloitte Global Mobile Consumer Survey 2014 - 2016, NL edition and global data aggregation
Weighted Base: All respondents owning a phone or a smartphone, excluding don’t know answers
Is your mobile on a 4G network?
.
+51%
N/A
11Deloitte - Global Mobile Consumer Survey 2016 - NL Edition
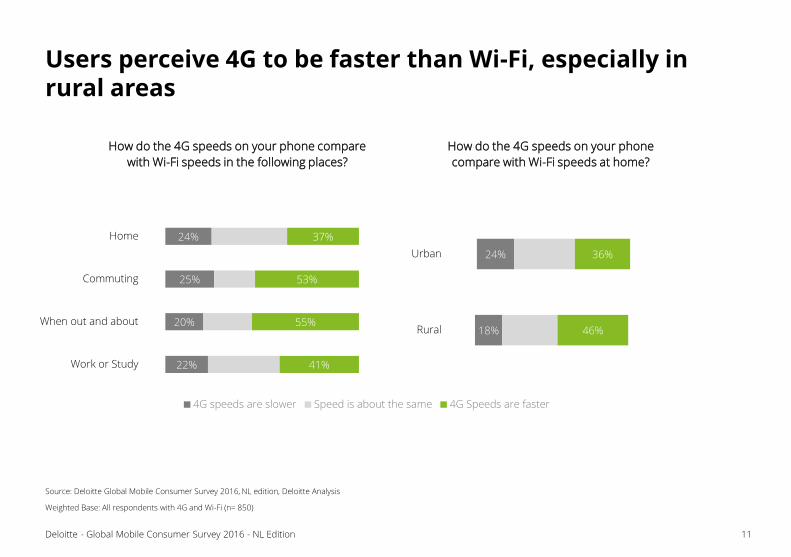
Users perceive 4G to be faster than Wi-Fi, especially in rural areas
Source: Deloitte Global Mobile Consumer Survey 2016, NL edition, Deloitte Analysis
Weighted Base: All respondents with 4G and Wi-Fi (n= 850)
22%
20%
25%
24%
41%
55%
53%
37%
Work or Study
When out and about
Commuting
Home
4G speeds are slower Speed is about the same 4G Speeds are faster
How do the 4G speeds on your phone compare
with Wi-Fi speeds in the following places?
18%
24%
46%
36%
Rural
Urban
How do the 4G speeds on your phone
compare with Wi-Fi speeds at home?
12Deloitte - Global Mobile Consumer Survey 2016 - NL Edition
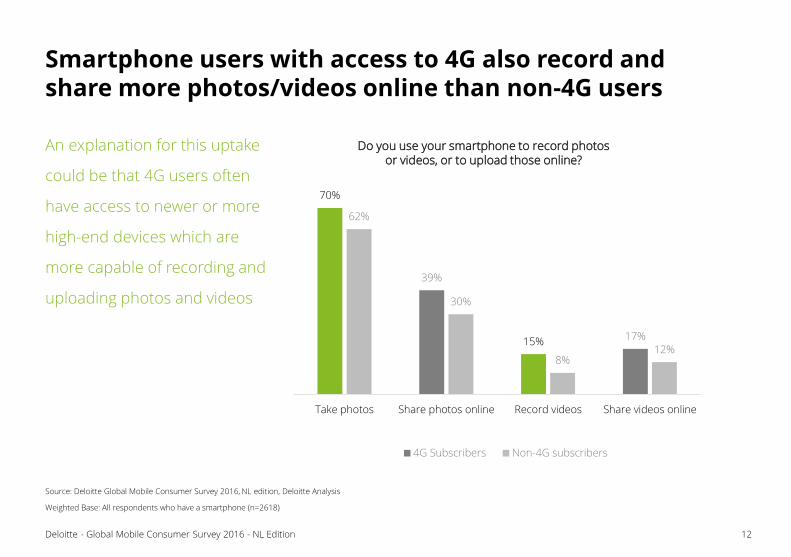
Smartphone users with access to 4G also record and share more photos/videos online than non-4G users
Source: Deloitte Global Mobile Consumer Survey 2016, NL edition, Deloitte Analysis
Weighted Base: All respondents who have a smartphone (n=2618)
70%
39%
15% 17%
62%
30%
8%12%
Take photos Share photos online Record videos Share videos online
4G Subscribers Non-4G subscribers
An explanation for this uptake
could be that 4G users often
have access to newer or more
high-end devices which are
more capable of recording and
uploading photos and videos
Do you use your smartphone to record photos or videos, or to upload those online?
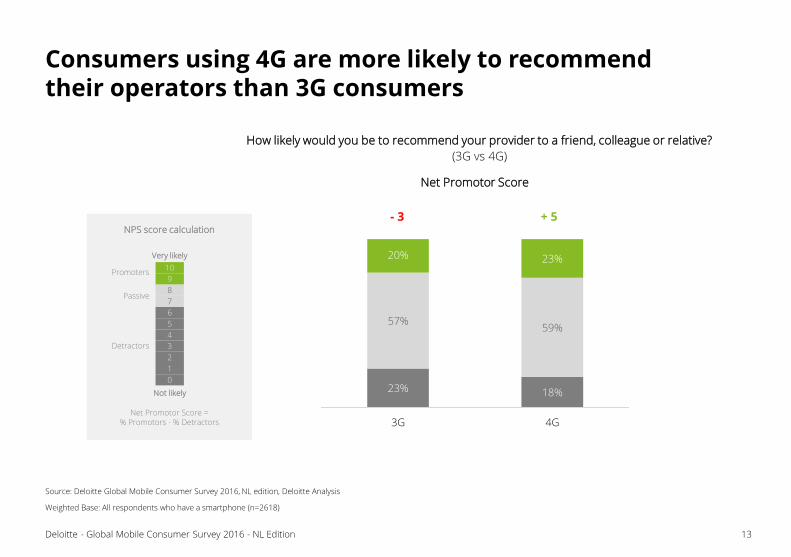
NPS score calculation
Passive
Detractors
Promoters
Very likely
Not likely
Net Promotor Score =% Promotors - % Detractors
13Deloitte - Global Mobile Consumer Survey 2016 - NL Edition
Consumers using 4G are more likely to recommend their operators than 3G consumers
Source: Deloitte Global Mobile Consumer Survey 2016, NL edition, Deloitte Analysis
Weighted Base: All respondents who have a smartphone (n=2618)
10
9
8
7
6
5
4
3
2
1
0
How likely would you be to recommend your provider to a friend, colleague or relative?
(3G vs 4G)
23% 18%
57%59%
20% 23%
3G 4G
+ 5- 3
Net Promotor Score
14Deloitte - Global Mobile Consumer Survey 2016 - NL Edition
MVNOs have a slightly higher NPS than MNOs and their sub-brands
Source: Deloitte Global Mobile Consumer Survey 2016, NL edition, Deloitte Analysis
All respondents who have a phone or smartphone (n=2848)
-15
-10
-5
0
5
10
15
20
25
30
35
MVNOs MNO sub-brands MNOs
NP
S s
core
How likely would you be to recommend your provider to a friend, colleague or relative?
(NPS score)
Bubble size = Amount of respondents
15Deloitte - Global Mobile Consumer Survey 2016 - NL Edition
Mobile network operators’ regular offerings lose ground while their sub-brands gain market share
Source: Deloitte Global Mobile Consumer Survey 2016, NL edition, Deloitte Analysis
All respondents who have a phone or smartphone (n=2648)
KPN 21.0 %KPN22.5 %
Vodafone 17.7 %Vodafone23.3 %
T-Mobile 18.8 %T-Mobile20.9 %
Tele2 6.7 %Tele25.1 %
Telfort 9.4 %
Telfort8.6 %
Other 8.5 %Other9.6 %
Other MNO sub-brands
17.8 %Other MNO sub-brands
10.0 %
Previous mobile network provider Current mobile network provider
• KPN (excluding sub-brands) decreased
with 1.5%, losing most of its customers to
Vodafone and T-Mobile
• Vodafone decreased with 5.6%, losing
most to various MNO sub-brands
• T-Mobile decreased with 2.1%, losing most
to various MNO sub-brands
• Tele2 gained 1.6% by attracting customers
from the three largest MNO’s
• MNO sub-brands have seen a major
growth of 8.6%. Of these sub-brands,
hollandsnieuwe shows the largest growth
(3.6%)
16Deloitte - Global Mobile Consumer Survey 2016 - NL Edition
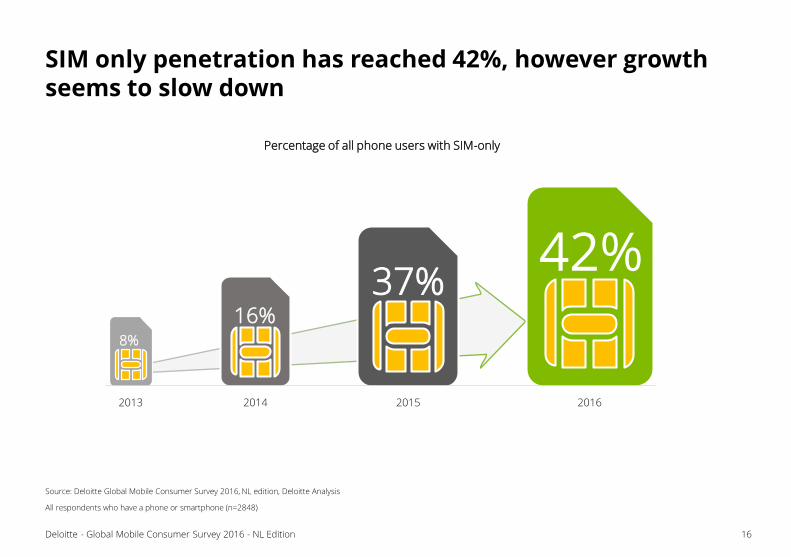
SIM only penetration has reached 42%, however growth seems to slow down
Source: Deloitte Global Mobile Consumer Survey 2016, NL edition, Deloitte Analysis
All respondents who have a phone or smartphone (n=2848)
2014
16%
2013
8%
2015
42%
2016
Percentage of all phone users with SIM-only
37%
17Deloitte - Global Mobile Consumer Survey 2016 - NL Edition
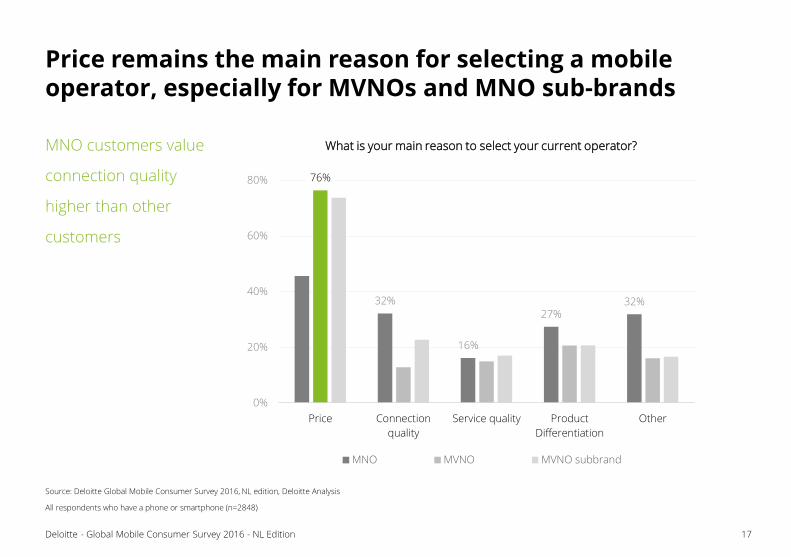
Price remains the main reason for selecting a mobile operator, especially for MVNOs and MNO sub-brands
Source: Deloitte Global Mobile Consumer Survey 2016, NL edition, Deloitte Analysis
All respondents who have a phone or smartphone (n=2848)
32%
16%
27%32%
76%
0%
20%
40%
60%
80%
Price Connection
quality
Service quality Product
Differentiation
Other
What is your main reason to select your current operator?
MNO MVNO MVNO subbrand
MNO customers value
connection quality
higher than other
customers
18Deloitte - Global Mobile Consumer Survey 2016 - NL Edition
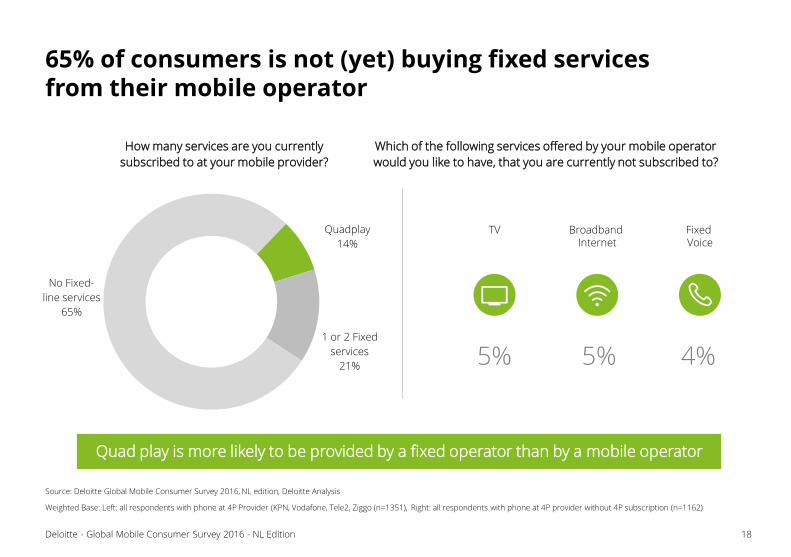
65% of consumers is not (yet) buying fixed services from their mobile operator
Source: Deloitte Global Mobile Consumer Survey 2016, NL edition, Deloitte Analysis
Weighted Base: Left: all respondents with phone at 4P Provider (KPN, Vodafone, Tele2, Ziggo (n=1351), Right: all respondents with phone at 4P provider without 4P subscription (n=1162)
No Fixed-
line services
65%
Quadplay
14%
1 or 2 Fixed
services
21%
Broadband Internet
5%
TV
5%
Fixed Voice
4%
Which of the following services offered by your mobile operator
would you like to have, that you are currently not subscribed to?
Quad play is more likely to be provided by a fixed operator than by a mobile operator
How many services are you currently
subscribed to at your mobile provider?
19Deloitte - Global Mobile Consumer Survey 2016 - NL Edition
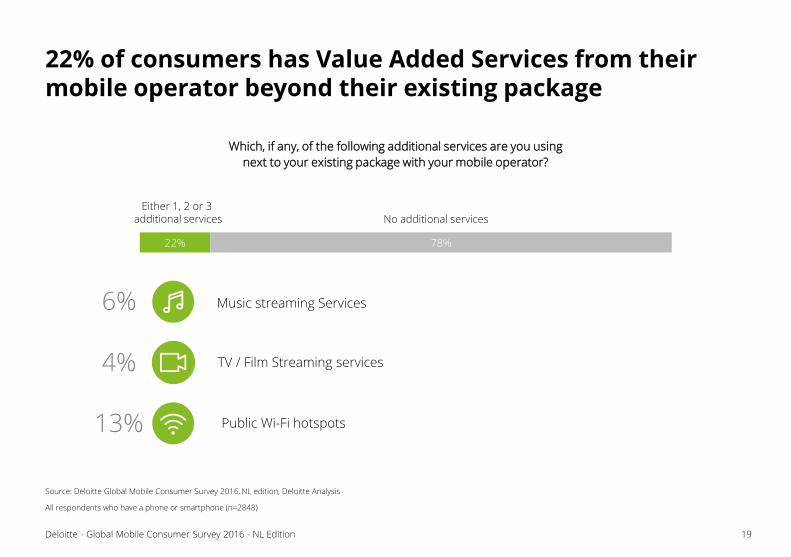
22% of consumers has Value Added Services from their mobile operator beyond their existing package
Source: Deloitte Global Mobile Consumer Survey 2016, NL edition, Deloitte Analysis
All respondents who have a phone or smartphone (n=2848)
22% 78%
TV / Film Streaming services4%
Music streaming Services6%
Public Wi-Fi hotspots13%
Which, if any, of the following additional services are you using
next to your existing package with your mobile operator?
Either 1, 2 or 3 additional services No additional services
20Deloitte - Global Mobile Consumer Survey 2016 - NL Edition
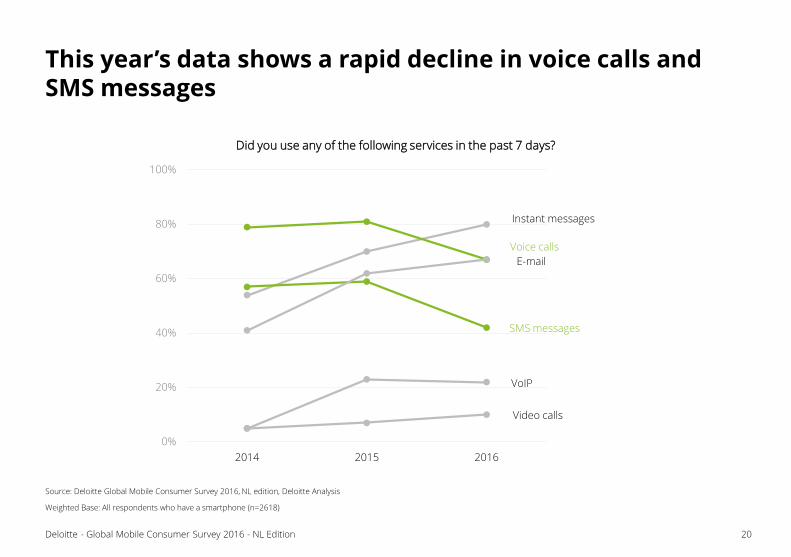
This year’s data shows a rapid decline in voice calls and SMS messages
Source: Deloitte Global Mobile Consumer Survey 2016, NL edition, Deloitte Analysis
Weighted Base: All respondents who have a smartphone (n=2618)
Instant messages
Video calls
Voice calls
SMS messages
VoIP
0%
20%
40%
60%
80%
100%
2014 2015 2016
Did you use any of the following services in the past 7 days?
Doesn't use VoIP – 61%
Less frequent - 9%
About the same - 37%
More frequent - 54%
Uses VoIP – 39%
21Deloitte - Global Mobile Consumer Survey 2016 - NL Edition
39% of respondents have used mobile VoIP, the majority of which uses it more frequently than before
Source: Deloitte Global Mobile Consumer Survey 2016, NL edition, Deloitte Analysis
Weighted Base: All respondents who have a smartphone (n=2618)
Please indicate whether you have ever used
voice calls using the internet (VoIP)
Please say whether you use VoIP more, less or
about the same as you did 12 months ago?
22Deloitte - Global Mobile Consumer Survey 2016 - NL Edition
In our everyday communication, the majority of preferred online channels are owned by Facebook
Source: Deloitte Global Mobile Consumer Survey 2016, NL edition, Deloitte Analysis
Weighted Base: All respondents who use IM, social networks or e-mail (n=2495)
2%
3%
4%
6%
11%
12%
18%
21%
50%
53%
75%
Telegram
Skype
iMessage
Snapchat
Instagram (Facebook)
Facebook Messenger
Work e-mail
Personal e-mail
WhatsApp (Facebook)
Which apps do you use on your mobile for IM, social network or e-mails?In addition to owning the
majority of the social
communication platforms,
Facebook is increasingly
used as an identification
platform for logins of third
party services

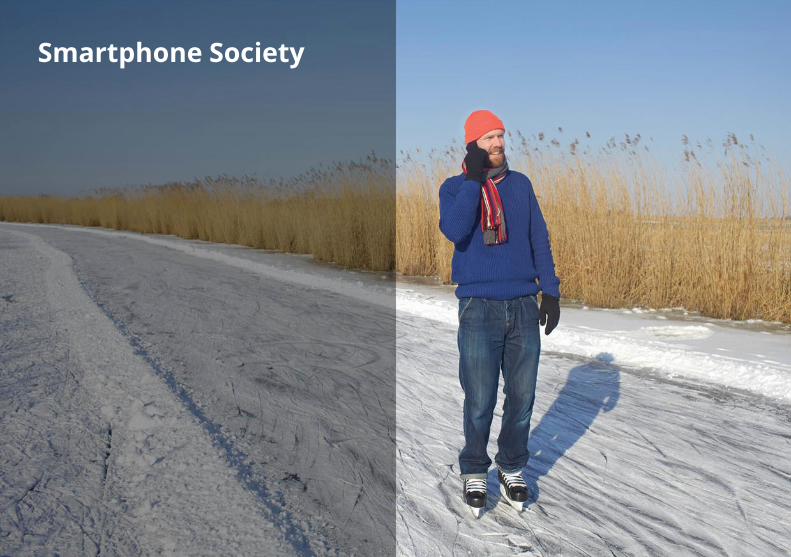
Smartphone Society
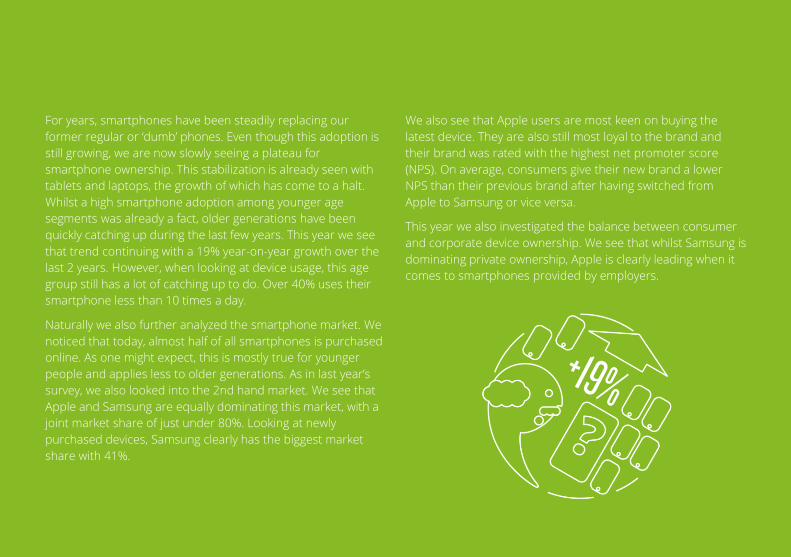
For years, smartphones have been steadily replacing our
former regular or ‘dumb’ phones. Even though this adoption is
still growing, we are now slowly seeing a plateau for
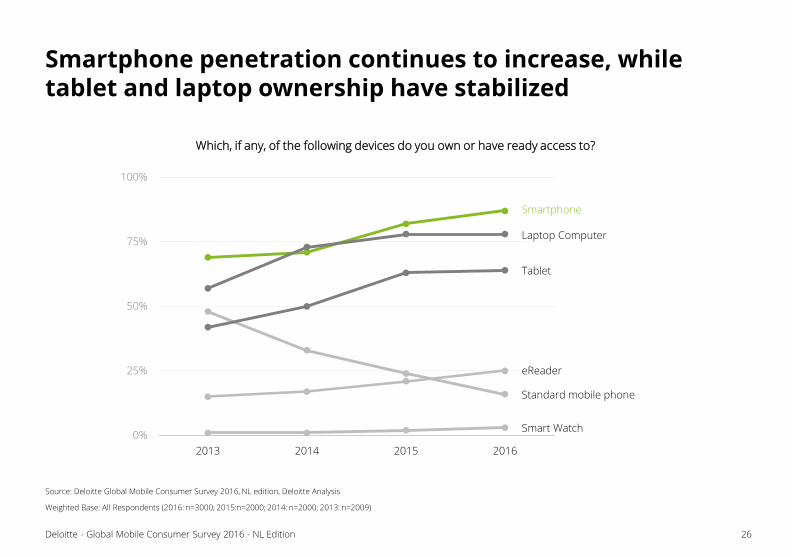
smartphone ownership. This stabilization is already seen with
tablets and laptops, the growth of which has come to a halt.
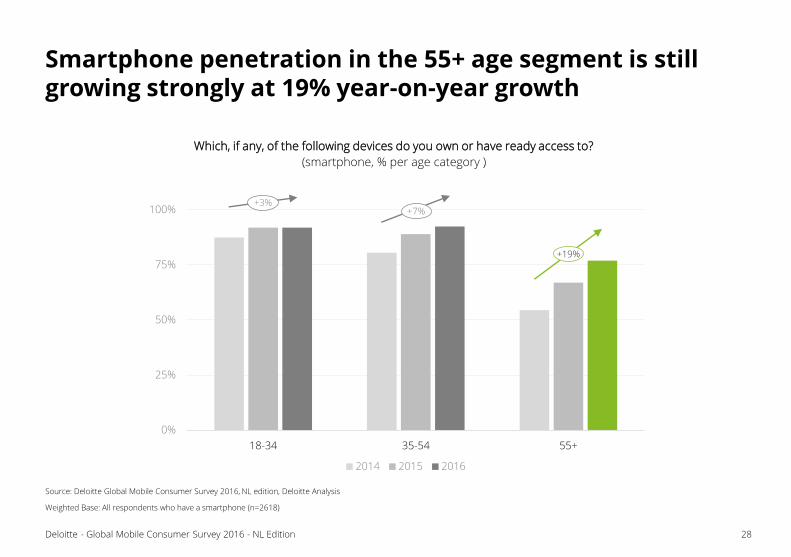
Whilst a high smartphone adoption among younger age
segments was already a fact, older generations have been
quickly catching up during the last few years. This year we see
that trend continuing with a 19% year-on-year growth over the
last 2 years. However, when looking at device usage, this age
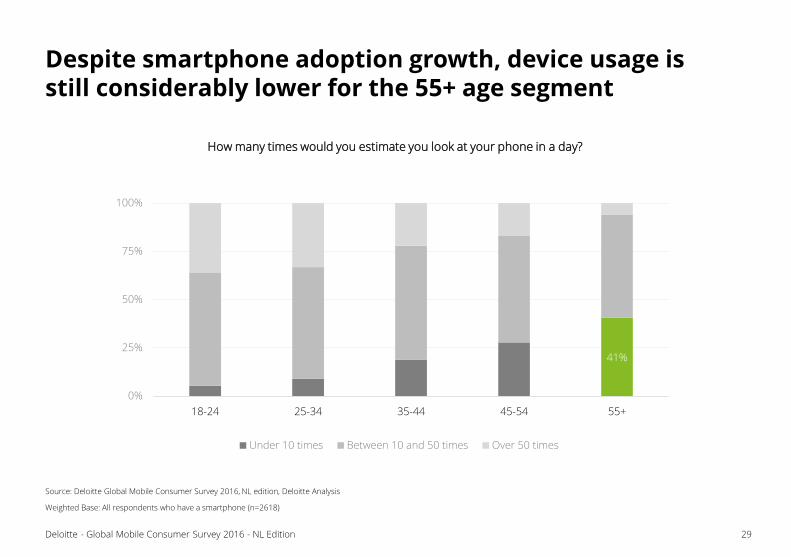
group still has a lot of catching up to do. Over 40% uses their
smartphone less than 10 times a day.
Naturally we also further analyzed the smartphone market. We
noticed that today, almost half of all smartphones is purchased
online. As one might expect, this is mostly true for younger
people and applies less to older generations. As in last year’s
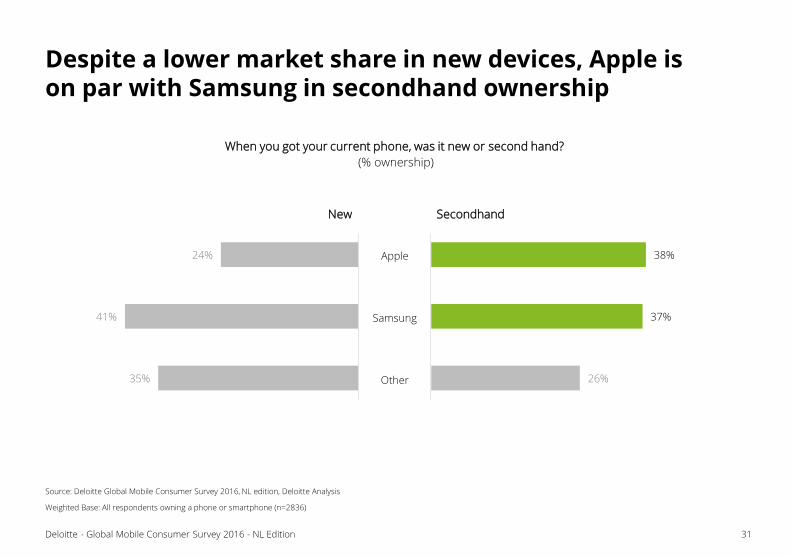
survey, we also looked into the 2nd hand market. We see that
Apple and Samsung are equally dominating this market, with a
joint market share of just under 80%. Looking at newly
purchased devices, Samsung clearly has the biggest market
share with 41%.
We also see that Apple users are most keen on buying the
latest device. They are also still most loyal to the brand and
their brand was rated with the highest net promoter score
(NPS). On average, consumers give their new brand a lower
NPS than their previous brand after having switched from
Apple to Samsung or vice versa.
This year we also investigated the balance between consumer
and corporate device ownership. We see that whilst Samsung is
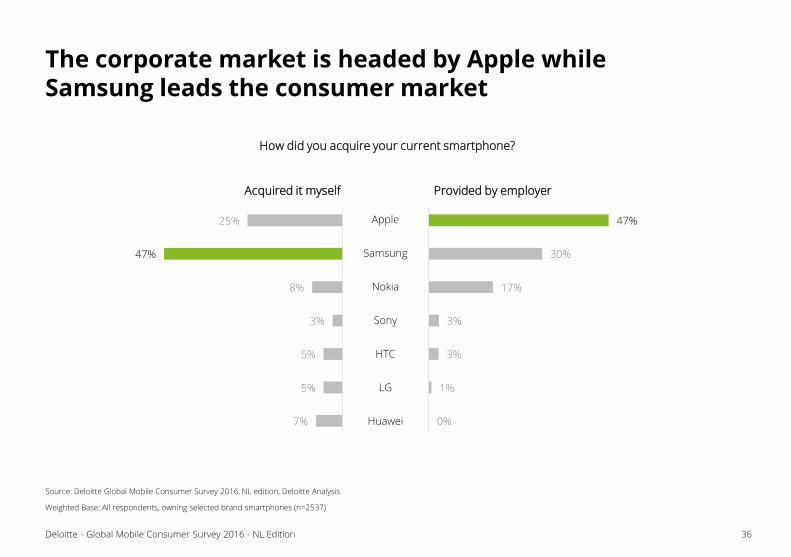
dominating private ownership, Apple is clearly leading when it
comes to smartphones provided by employers.
26Deloitte - Global Mobile Consumer Survey 2016 - NL Edition
Smartphone penetration continues to increase, while tablet and laptop ownership have stabilized
Source: Deloitte Global Mobile Consumer Survey 2016, NL edition, Deloitte Analysis
Weighted Base: All Respondents (2016: n=3000; 2015:n=2000; 2014: n=2000; 2013: n=2009)
Which, if any, of the following devices do you own or have ready access to?
0%
25%
50%
75%
100%
2013 2014 2015 2016
Standard mobile phone
eReader
Tablet
Laptop Computer
Smartphone
Smart Watch
27Deloitte - Global Mobile Consumer Survey 2016 - NL Edition
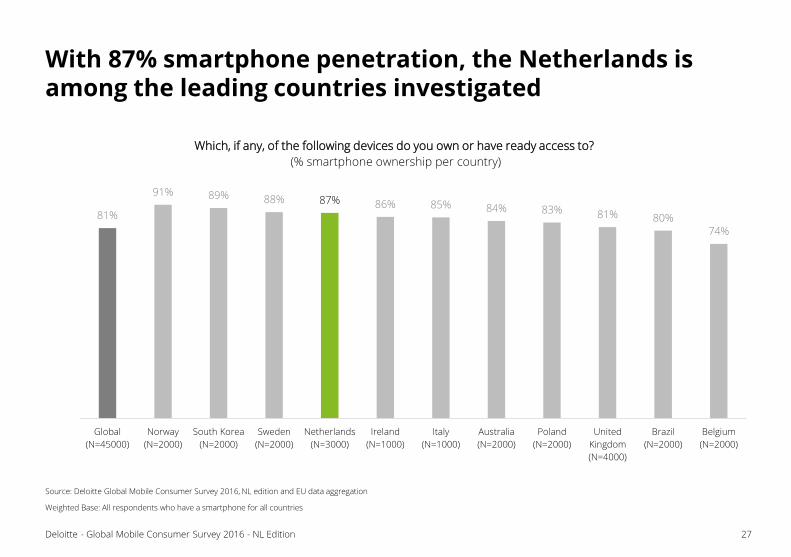
With 87% smartphone penetration, the Netherlands is among the leading countries investigated
Source: Deloitte Global Mobile Consumer Survey 2016, NL edition and EU data aggregation
Weighted Base: All respondents who have a smartphone for all countries
Which, if any, of the following devices do you own or have ready access to?
(% smartphone ownership per country)
81%
91% 89% 88% 87% 86% 85% 84% 83% 81% 80%74%
Global
(N=45000)
Norway
(N=2000)
South Korea
(N=2000)
Sweden
(N=2000)
Netherlands
(N=3000)
Ireland
(N=1000)
Italy
(N=1000)
Australia
(N=2000)
Poland
(N=2000)
United
Kingdom
(N=4000)
Brazil
(N=2000)
Belgium
(N=2000)
0%
25%
50%
75%
100%
18-34 35-54 55+
2014 2015 2016
28Deloitte - Global Mobile Consumer Survey 2016 - NL Edition
Smartphone penetration in the 55+ age segment is still growing strongly at 19% year-on-year growth
Source: Deloitte Global Mobile Consumer Survey 2016, NL edition, Deloitte Analysis
Weighted Base: All respondents who have a smartphone (n=2618)
Which, if any, of the following devices do you own or have ready access to?
(smartphone, % per age category )
+3%+7%
+19%
29Deloitte - Global Mobile Consumer Survey 2016 - NL Edition
Despite smartphone adoption growth, device usage is still considerably lower for the 55+ age segment
Source: Deloitte Global Mobile Consumer Survey 2016, NL edition, Deloitte Analysis
Weighted Base: All respondents who have a smartphone (n=2618)
41%
0%
25%
50%
75%
100%
18-24 25-34 35-44 45-54 55+
Under 10 times Between 10 and 50 times Over 50 times
How many times would you estimate you look at your phone in a day?
30Deloitte - Global Mobile Consumer Survey 2016 - NL Edition
Nearly half of all smartphones are bought online
Source: Deloitte Global Mobile Consumer Survey 2016, NL edition, Deloitte Analysis
Weighted Base: All respondents owning a phone or a smartphone (n=2836)
31%
45%
55%
45%
52%
36%
34%
39%
17%
19%
11%
16%
55+
35-54
18-34
Average
I purchased it online and had it delivered or picked it up in-store
I purchased it in-store
Other (e.g. leased it, ordered over the phone, received it from family / employer)
Which, if any, of the following apply to how you got your current phone?
31Deloitte - Global Mobile Consumer Survey 2016 - NL Edition
Despite a lower market share in new devices, Apple is on par with Samsung in secondhand ownership
Source: Deloitte Global Mobile Consumer Survey 2016, NL edition, Deloitte Analysis
Weighted Base: All respondents owning a phone or smartphone (n=2836)
When you got your current phone, was it new or second hand?
(% ownership)
35%
41%
24%
New
26%
37%
38%
Secondhand
Apple
Samsung
Other

32Deloitte - Global Mobile Consumer Survey 2016 - NL Edition
Apple users are most likely to buy the latest model directly when, or soon after it is launched
Source: Deloitte Global Mobile Consumer Survey 2016, NL edition, Deloitte Analysis
Weighted Base: All respondents, with a smartphone (n=2616)
42%
26%
28%
31%
14%
26%
Apple
Samsung
Nokia
Sony
Huawei
LG
I buy the latest devices as soon
as they enter the market
I tend to buy the latest devices if I
really like them
I buy devices after they've been
out for a while
I only replace devices when they
go wrong or are broken
Don't know
Which of the following best describes your attitude towards new devices?
(%)

33Deloitte - Global Mobile Consumer Survey 2016 - NL Edition
Apple has the highest Net Promoter Score of all smartphone manufacturers
Source: Deloitte Global Mobile Consumer Survey 2016, NL edition, Deloitte Analysis
Weighted Base: All respondents who have a smartphone(n=2618); Apple includes all iPhone models, Samsung includes all Galaxy models
1 https://www.thestreet.com/story/13095775/1/blackberry--who-knew--wins-most-improved-from-us-consumers.html
-10
9
11
16
20
24
40
LG
Huawei
HTC
Nokia
Sony
Samsung
Apple
How likely would you be to recommend the brand of your current handset
to a friend, colleague or relative?
(NPS Score)
Dutch consumers rate
their devices lower
compared to UK and US
consumers1: Apple has a
NPS of 63 in the US and
46 in the UK
34Deloitte - Global Mobile Consumer Survey 2016 - NL Edition
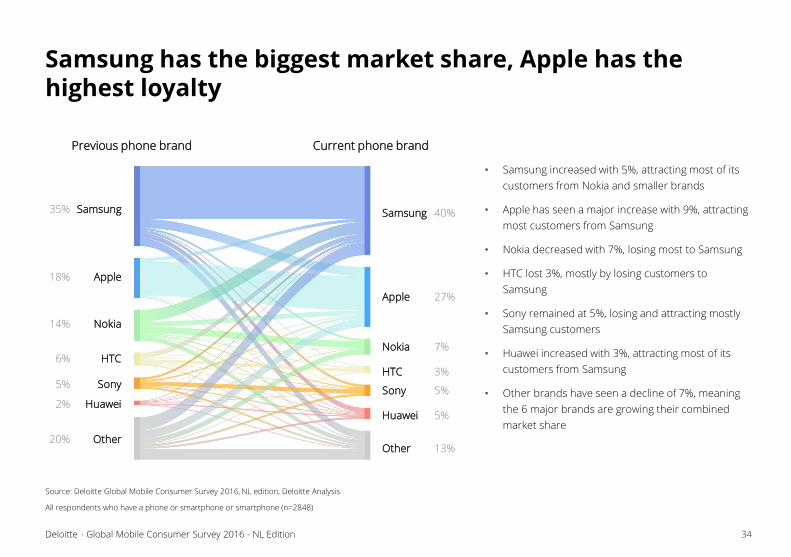
Samsung has the biggest market share, Apple has the highest loyalty
Source: Deloitte Global Mobile Consumer Survey 2016, NL edition, Deloitte Analysis
All respondents who have a phone or smartphone or smartphone (n=2848)
Samsung35% Samsung 40%
Nokia14%
Nokia 7%
Apple18%
Apple 27%
HTC6%HTC 3%
Sony5%Sony 5%
Huawei2%Huawei 5%
Other20%Other 13%
Previous phone brand Current phone brand
• Samsung increased with 5%, attracting most of its
customers from Nokia and smaller brands
• Apple has seen a major increase with 9%, attracting
most customers from Samsung
• Nokia decreased with 7%, losing most to Samsung
• HTC lost 3%, mostly by losing customers to
Samsung
• Sony remained at 5%, losing and attracting mostly
Samsung customers
• Huawei increased with 3%, attracting most of its
customers from Samsung
• Other brands have seen a decline of 7%, meaning
the 6 major brands are growing their combined
market share
35Deloitte - Global Mobile Consumer Survey 2016 - NL Edition
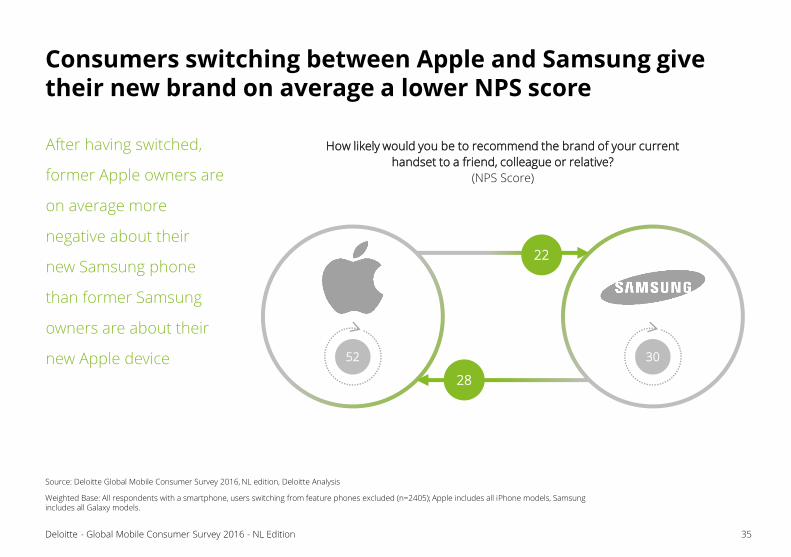
Consumers switching between Apple and Samsung give their new brand on average a lower NPS score
Source: Deloitte Global Mobile Consumer Survey 2016, NL edition, Deloitte Analysis
Weighted Base: All respondents with a smartphone, users switching from feature phones excluded (n=2405); Apple includes all iPhone models, Samsung includes all Galaxy models.
After having switched,
former Apple owners are
on average more
negative about their
new Samsung phone
than former Samsung
owners are about their
new Apple device
22
28
52 30
How likely would you be to recommend the brand of your current
handset to a friend, colleague or relative?
(NPS Score)
36Deloitte - Global Mobile Consumer Survey 2016 - NL Edition
The corporate market is headed by Apple while Samsung leads the consumer market
Source: Deloitte Global Mobile Consumer Survey 2016, NL edition, Deloitte Analysis
Weighted Base: All respondents, owning selected brand smartphones (n=2537)
7%
5%
5%
3%
8%
47%
25%
Acquired it myself
0%
1%
3%
3%
17%
30%
47%
Provided by employer
How did you acquire your current smartphone?
Apple
Samsung
Nokia
Sony
HTC
LG
Huawei

Addiction around the clock
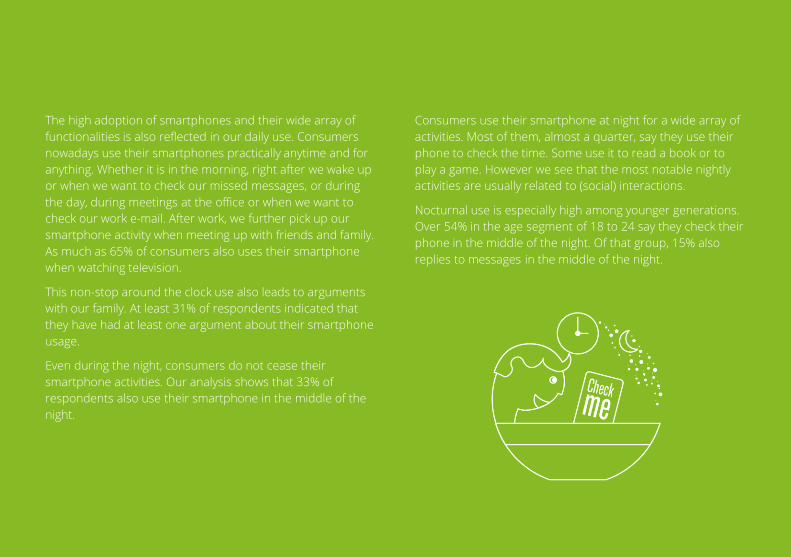
The high adoption of smartphones and their wide array of
functionalities is also reflected in our daily use. Consumers
nowadays use their smartphones practically anytime and for
anything. Whether it is in the morning, right after we wake up
or when we want to check our missed messages, or during
the day, during meetings at the office or when we want to
check our work e-mail. After work, we further pick up our
smartphone activity when meeting up with friends and family.
As much as 65% of consumers also uses their smartphone
when watching television.
This non-stop around the clock use also leads to arguments
with our family. At least 31% of respondents indicated that
they have had at least one argument about their smartphone
usage.
Even during the night, consumers do not cease their
smartphone activities. Our analysis shows that 33% of
respondents also use their smartphone in the middle of the
night.
Consumers use their smartphone at night for a wide array of
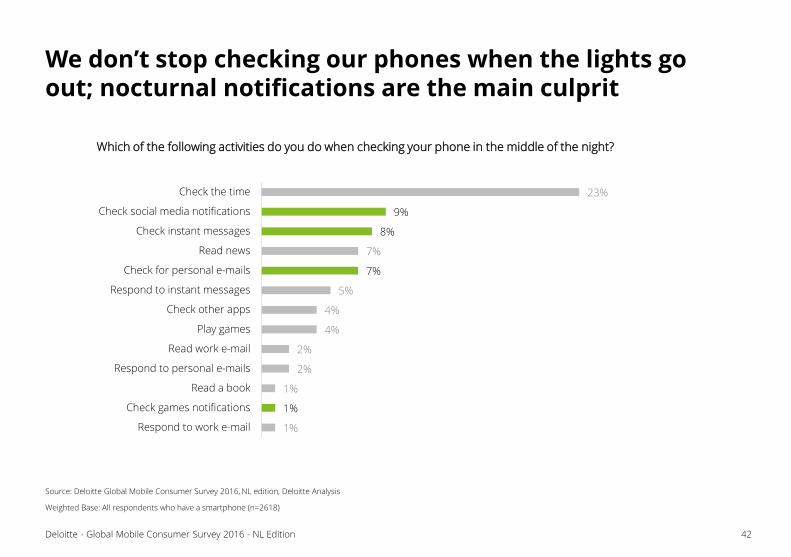
activities. Most of them, almost a quarter, say they use their
phone to check the time. Some use it to read a book or to
play a game. However we see that the most notable nightly
activities are usually related to (social) interactions.
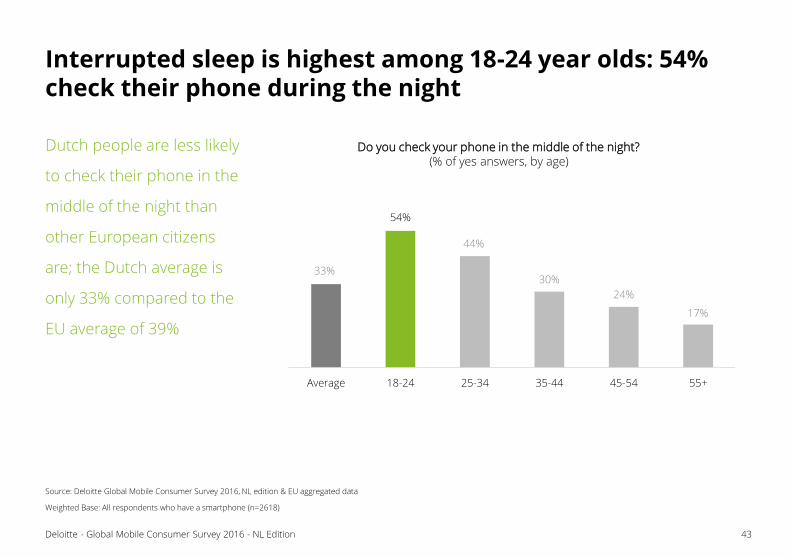
Nocturnal use is especially high among younger generations.
Over 54% in the age segment of 18 to 24 say they check their
phone in the middle of the night. Of that group, 15% also
replies to messages in the middle of the night.
40Deloitte - Global Mobile Consumer Survey 2016 - NL Edition
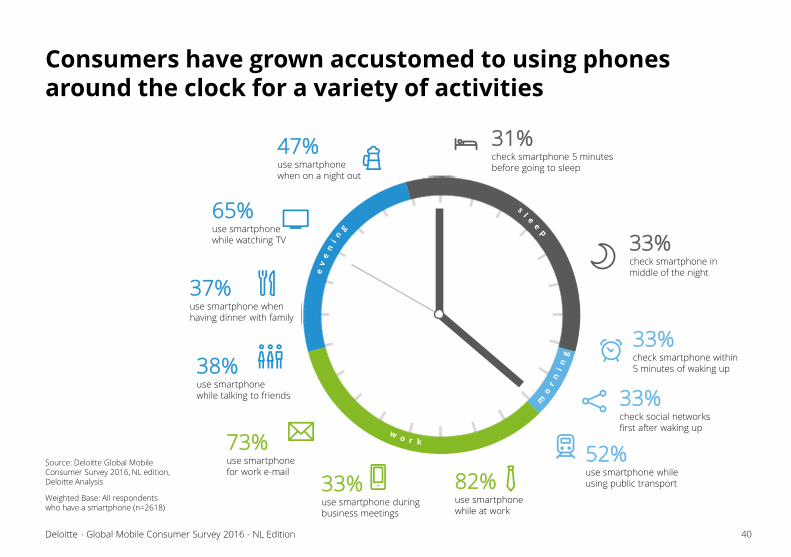
Consumers have grown accustomed to using phones around the clock for a variety of activities
Source: Deloitte Global Mobile Consumer Survey 2016, NL edition, Deloitte Analysis
Weighted Base: All respondents who have a smartphone (n=2618)
31% check smartphone 5 minutes before going to sleep
33% check smartphone inmiddle of the night
33% check smartphone within 5 minutes of waking up
52% use smartphone while using public transport33%
use smartphone during business meetings
82% use smartphone while at work
73% use smartphone for work e-mail
38% use smartphone while talking to friends
37% use smartphone when having dinner with family
65% use smartphone while watching TV
47% use smartphonewhen on a night out
33% check social networksfirst after waking up

41Deloitte - Global Mobile Consumer Survey 2016 - NL Edition
31% of respondents have argued about phone usage with relatives, especially with their significant other
Source: Deloitte Global Mobile Consumer Survey 2016, NL edition, Deloitte Analysis
All respondents who have a phone or smartphone or smartphone (n=2848)
8%
8%
10%
12%
14%
24%
Children
Grandparents
Siblings
Housemates or friends
Parents
Spouse
31%
69%
Have you ever had arguments with relatives about your mobile phone use?
Do you have disagreements with one of the following people about your mobile phone use?
(% of respondents that have arguments)
42Deloitte - Global Mobile Consumer Survey 2016 - NL Edition
We don’t stop checking our phones when the lights go out; nocturnal notifications are the main culprit
Source: Deloitte Global Mobile Consumer Survey 2016, NL edition, Deloitte Analysis
Weighted Base: All respondents who have a smartphone (n=2618)
1%
1%
1%
2%
2%
4%
4%
5%
7%
7%
8%
9%
23%
Respond to work e-mail
Check games notifications
Read a book
Respond to personal e-mails
Read work e-mail
Play games
Check other apps
Respond to instant messages
Check for personal e-mails
Read news
Check instant messages
Check social media notifications
Check the time
Which of the following activities do you do when checking your phone in the middle of the night?
43Deloitte - Global Mobile Consumer Survey 2016 - NL Edition
Interrupted sleep is highest among 18-24 year olds: 54% check their phone during the night
Source: Deloitte Global Mobile Consumer Survey 2016, NL edition & EU aggregated data
Weighted Base: All respondents who have a smartphone (n=2618)
33%
54%
44%
30%
24%
17%
Average 18-24 25-34 35-44 45-54 55+
Dutch people are less likely
to check their phone in the
middle of the night than
other European citizens
are; the Dutch average is
only 33% compared to the
EU average of 39%
Do you check your phone in the middle of the night? (% of yes answers, by age)

44Deloitte - Global Mobile Consumer Survey 2016 - NL Edition
A part of these interrupted sleepers even replies to messages in the middle of the night
Source: Deloitte Global Mobile Consumer Survey 2016, NL edition, Deloitte Analysis
Weighted Base: All respondents who have a smartphone (n=2618)
15%
33%
54%
44%
30%
24%
17%
Average 18-24 25-34 35-44 45-54 55+
Responds to instant messages in the middle of the night
When checking your phone in the middle of the night, do you also respond to instant messages?
(by age)

The device of unlimited opportunities
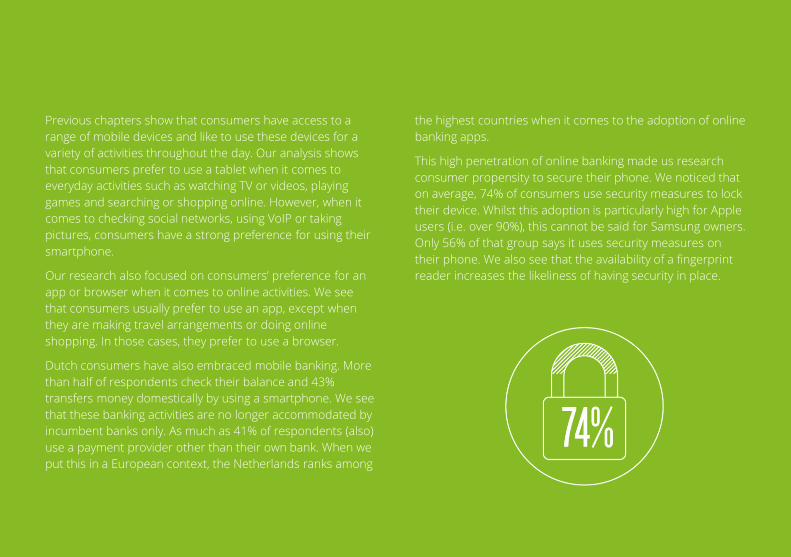
Previous chapters show that consumers have access to a
range of mobile devices and like to use these devices for a
variety of activities throughout the day. Our analysis shows
that consumers prefer to use a tablet when it comes to
everyday activities such as watching TV or videos, playing
games and searching or shopping online. However, when it
comes to checking social networks, using VoIP or taking
pictures, consumers have a strong preference for using their
smartphone.
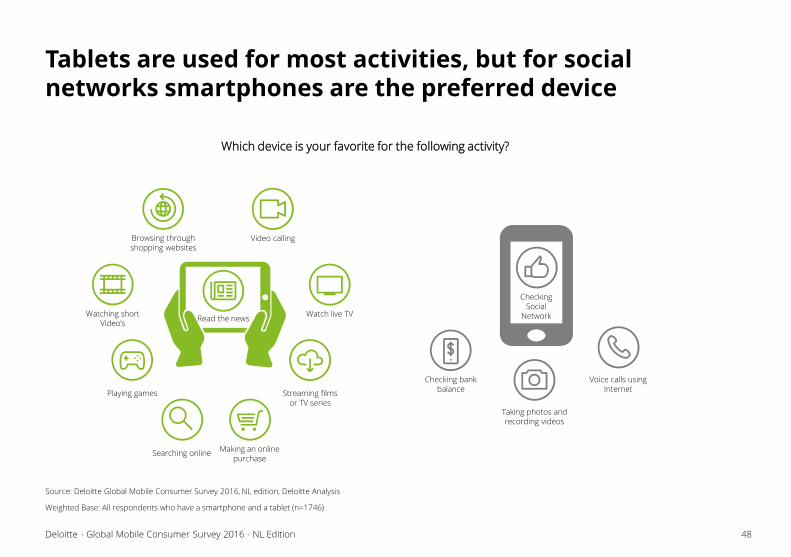
Our research also focused on consumers’ preference for an
app or browser when it comes to online activities. We see
that consumers usually prefer to use an app, except when
they are making travel arrangements or doing online
shopping. In those cases, they prefer to use a browser.
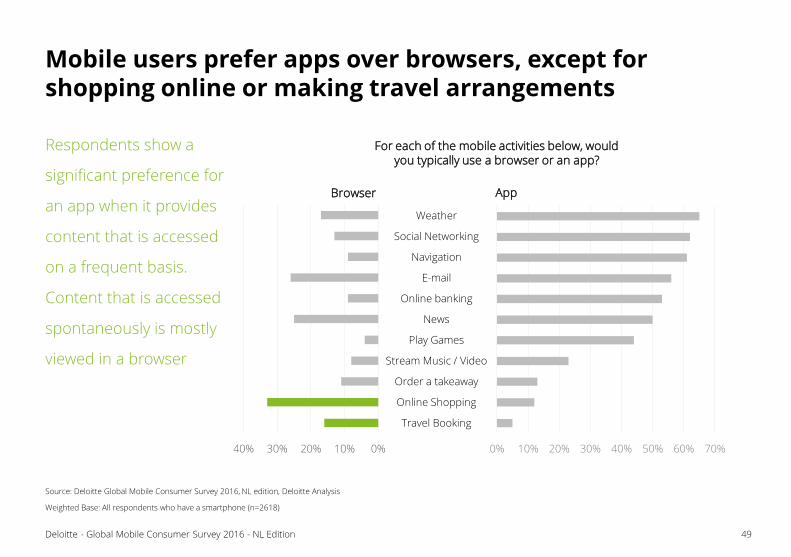
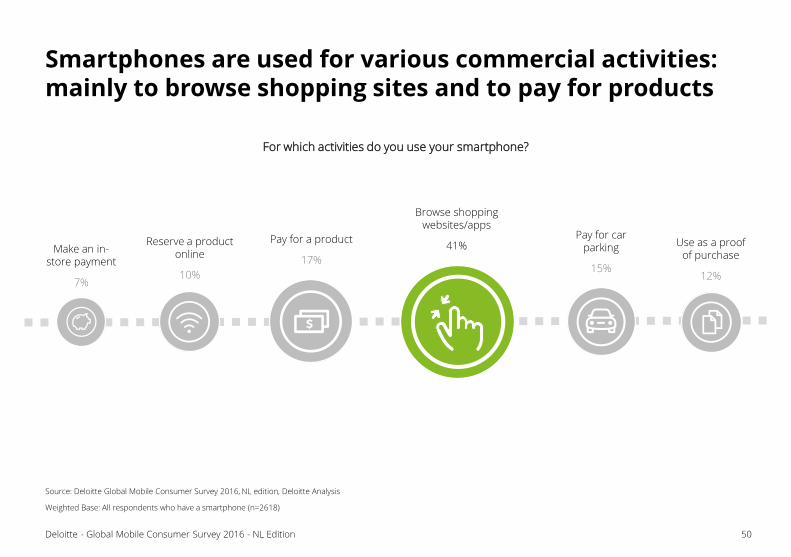
Dutch consumers have also embraced mobile banking. More
than half of respondents check their balance and 43%
transfers money domestically by using a smartphone. We see
that these banking activities are no longer accommodated by
incumbent banks only. As much as 41% of respondents (also)
use a payment provider other than their own bank. When we
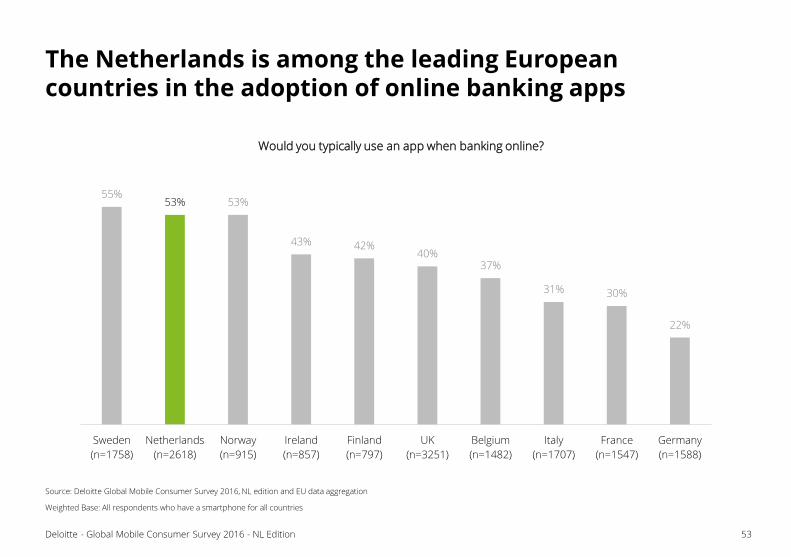
put this in a European context, the Netherlands ranks among
the highest countries when it comes to the adoption of online
banking apps.
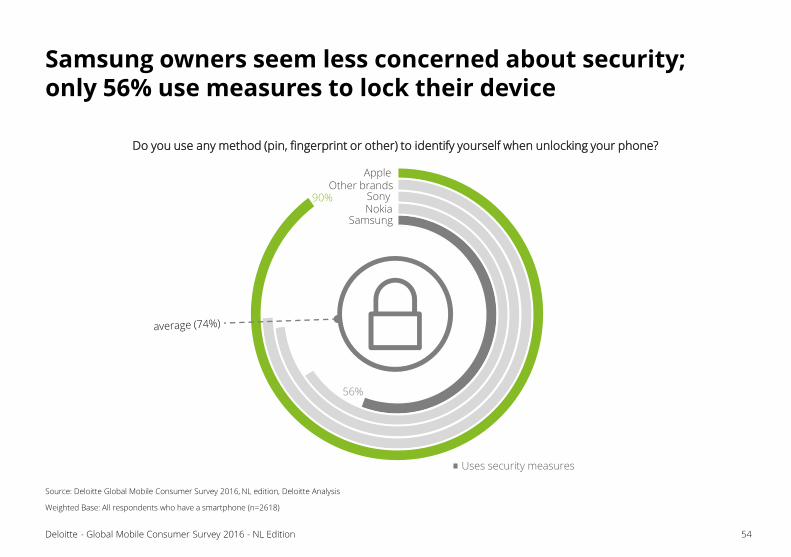
This high penetration of online banking made us research
consumer propensity to secure their phone. We noticed that
on average, 74% of consumers use security measures to lock
their device. Whilst this adoption is particularly high for Apple
users (i.e. over 90%), this cannot be said for Samsung owners.
Only 56% of that group says it uses security measures on
their phone. We also see that the availability of a fingerprint
reader increases the likeliness of having security in place.
48Deloitte - Global Mobile Consumer Survey 2016 - NL Edition
Tablets are used for most activities, but for social networks smartphones are the preferred device
Source: Deloitte Global Mobile Consumer Survey 2016, NL edition, Deloitte Analysis
Weighted Base: All respondents who have a smartphone and a tablet (n=1746)
Voice calls using Internet
Taking photos and recording videos
Checking bank balance
Checking Social
Network
Video calling
Watch live TV
Browsing through shopping websites
Playing games Streaming filmsor TV series
Watching shortVideo’s
Read the news
Making an onlinepurchase
Searching online
Which device is your favorite for the following activity?
49Deloitte - Global Mobile Consumer Survey 2016 - NL Edition
Mobile users prefer apps over browsers, except for shopping online or making travel arrangements
Source: Deloitte Global Mobile Consumer Survey 2016, NL edition, Deloitte Analysis
Weighted Base: All respondents who have a smartphone (n=2618)
Respondents show a
significant preference for
an app when it provides
content that is accessed
on a frequent basis.
Content that is accessed
spontaneously is mostly
viewed in a browser
0% 10% 20% 30% 40% 50% 60% 70%0%10%20%30%40%
Weather
Social Networking
Navigation
Online banking
News
Play Games
Stream Music / Video
Order a takeaway
Online Shopping
Travel Booking
Browser App
For each of the mobile activities below, would you typically use a browser or an app?
50Deloitte - Global Mobile Consumer Survey 2016 - NL Edition
Smartphones are used for various commercial activities: mainly to browse shopping sites and to pay for products
Source: Deloitte Global Mobile Consumer Survey 2016, NL edition, Deloitte Analysis
Weighted Base: All respondents who have a smartphone (n=2618)
For which activities do you use your smartphone?
Browse shopping websites/apps
41%Make an in-store payment
7%
Pay for a product
17%
Pay for car parking
15%
Use as a proof of purchase
12%
Reserve a product online
10%

42%
54%
43%
15%
9%
6%
None of these
Check bank balances
Transfer money (within NL)
Pay for a services bill
Transfer money (abroad)
Pay a utility bill (e.g. gas, water)
51Deloitte - Global Mobile Consumer Survey 2016 - NL Edition
43% of respondents have used their smartphone to transfer money to another individual
Source: Deloitte Global Mobile Consumer Survey 2016, NL edition, Deloitte Analysis
Weighted Base: All respondents who have a smartphone (n=2618)
Even though most people
use their phone to transfer
money or check balances,
42% of respondents still do
not use their mobile phone
for any kind of financial
transactions
For which of the following financial transactions have you ever used your mobile phone?
52Deloitte - Global Mobile Consumer Survey 2016 - NL Edition
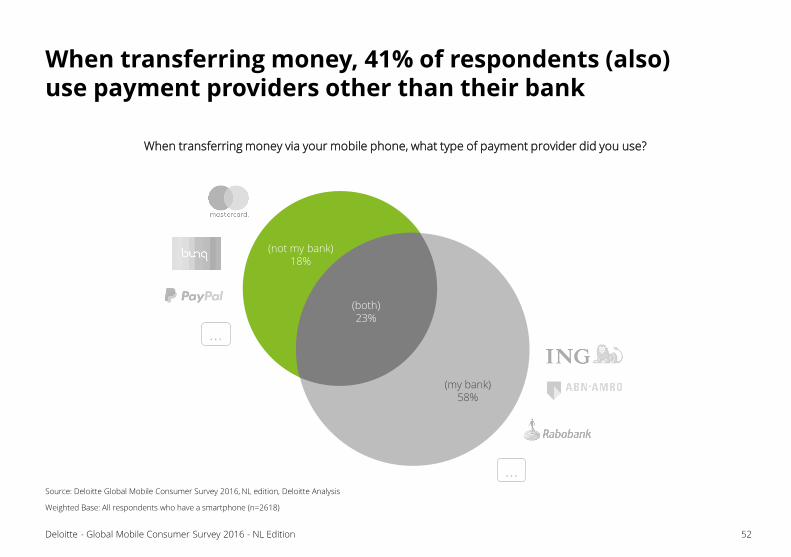
When transferring money, 41% of respondents (also) use payment providers other than their bank
Source: Deloitte Global Mobile Consumer Survey 2016, NL edition, Deloitte Analysis
Weighted Base: All respondents who have a smartphone (n=2618)
…
(not my bank)18%
(my bank)58%
When transferring money via your mobile phone, what type of payment provider did you use?
…
(both)23%
53Deloitte - Global Mobile Consumer Survey 2016 - NL Edition
The Netherlands is among the leading European countries in the adoption of online banking apps
Source: Deloitte Global Mobile Consumer Survey 2016, NL edition and EU data aggregation
Weighted Base: All respondents who have a smartphone for all countries
55%53% 53%
43% 42%40%
37%
31% 30%
22%
Sweden
(n=1758)
Netherlands
(n=2618)
Norway
(n=915)
Ireland
(n=857)
Finland
(n=797)
UK
(n=3251)
Belgium
(n=1482)
Italy
(n=1707)
France
(n=1547)
Germany
(n=1588)
Would you typically use an app when banking online?
SamsungNokiaSony
Other brandsApple
Uses security measures
54Deloitte - Global Mobile Consumer Survey 2016 - NL Edition
Samsung owners seem less concerned about security; only 56% use measures to lock their device
Source: Deloitte Global Mobile Consumer Survey 2016, NL edition, Deloitte Analysis
Weighted Base: All respondents who have a smartphone (n=2618)
Do you use any method (pin, fingerprint or other) to identify yourself when unlocking your phone?
56%
90%
55Deloitte - Global Mobile Consumer Survey 2016 - NL Edition
68% of smartphone owners have used their fingerprint reader to identify themselves
Source: Deloitte Global Mobile Consumer Survey 2016, NL edition, Deloitte Analysis
Weighted Base: All respondents who have a smartphone with fingerprint functionality (n=2618)
78%
0%
20%
40%
60%
80%
100%
18-24 25-34 35-44 45-54 55+
average (68%)
Have you ever used a fingerprint reader to identify yourself when unlocking your phone, authorizing mobile payments or other transactions?
The future startstomorrow (not today)
This year, one of the hottest topics in consumer electronics is
Internet of Things (IoT). As a result, we have investigated the
uptake in IoT devices among consumers and their propensity
to buy these type of devices in the near future. We noticed
that even though everyone is expecting IoT to be the next big
thing, reality shows that adoption of these devices is still very
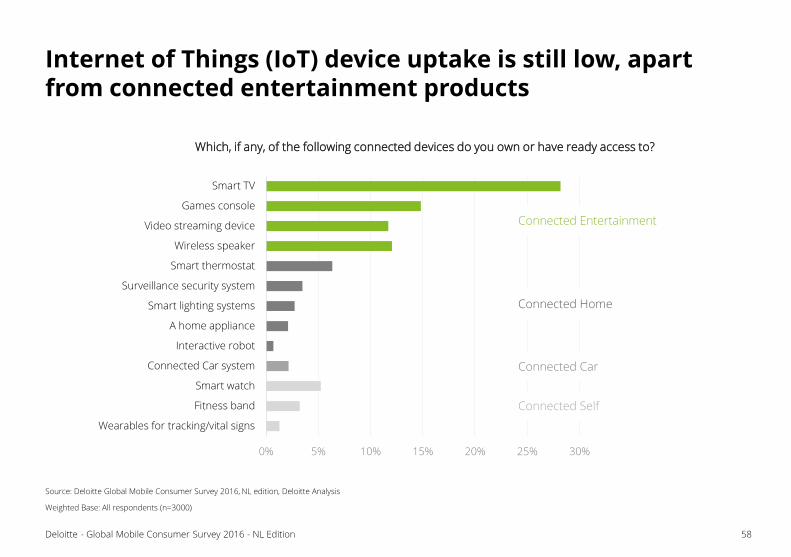
low among consumers. Connected Entertainment devices
such as Smart TVs and Game Consoles have the highest
penetration (with respectively 28% and 15%), however the
uptake of other connected devices is still rather low. Even the
adoption of wearables such as Smart Watches and Fitness
bands, devices that have already been available for a few
years, is still low with an adoption rate of only 5% or less.
In a nutshell, among all connected product categories, the
penetration of Connected Entertainment is the highest with
43%. The question remains whether this high percentage is
driven by actual demand for IoT functionality or the mere
standard availability of these connected services in everyday
household devices.
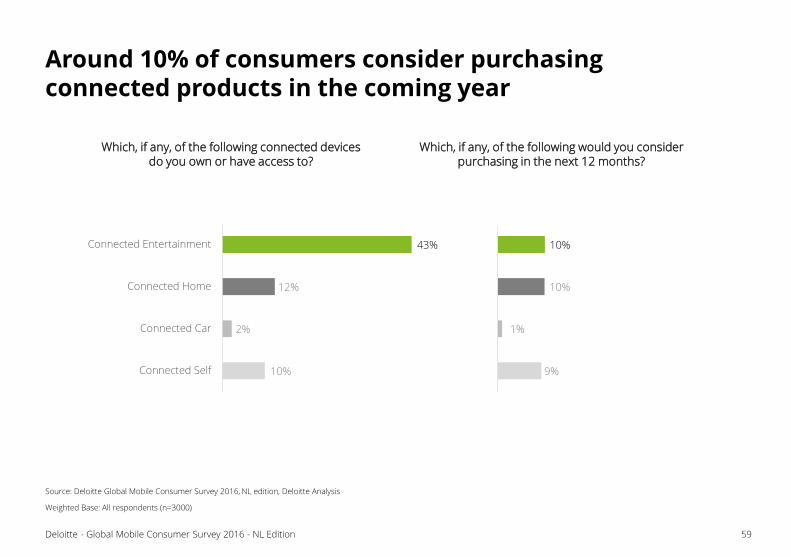
Our respondents also indicate that on average, only 10% is
considering to purchase some type of connected product in
the next 12 months. This is not true for connected car
products for which only 1% considers a purchase within the
next 12 months.
The market’s high expectation of future IoT devices is also
focused on a strong uptake in Virtual Reality (VR). However,
we see that consumer adoption of these IoT devices is still
very low as well. Roughly 5% of consumers owns a VR device,
of which the vast majority owns a low-end or cardboard type
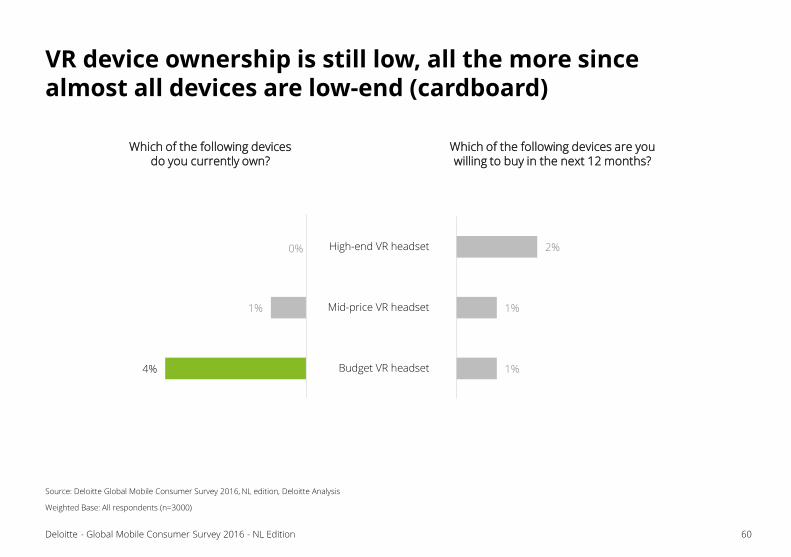
of VR headset. Also consumer’s willingness to buy is low.
58Deloitte - Global Mobile Consumer Survey 2016 - NL Edition
Internet of Things (IoT) device uptake is still low, apart from connected entertainment products
Source: Deloitte Global Mobile Consumer Survey 2016, NL edition, Deloitte Analysis
Weighted Base: All respondents (n=3000)
0% 5% 10% 15% 20% 25% 30%
Wearables for tracking/vital signs
Fitness band
Smart watch
Connected Car system
Interactive robot
A home appliance
Smart lighting systems
Surveillance security system
Smart thermostat
Wireless speaker
Video streaming device
Games console
Smart TV
Connected Home
Connected Entertainment
Which, if any, of the following connected devices do you own or have ready access to?
Connected Self
Connected Car
59Deloitte - Global Mobile Consumer Survey 2016 - NL Edition
Around 10% of consumers consider purchasing connected products in the coming year
Source: Deloitte Global Mobile Consumer Survey 2016, NL edition, Deloitte Analysis
Weighted Base: All respondents (n=3000)
Which, if any, of the following connected devices do you own or have access to?
10%
2%
12%
43%
Connected Self
Connected Car
Connected Home
Connected Entertainment
Which, if any, of the following would you consider purchasing in the next 12 months?
9%
1%
10%
10%
4%
1%
0%
60Deloitte - Global Mobile Consumer Survey 2016 - NL Edition
VR device ownership is still low, all the more since almost all devices are low-end (cardboard)
Source: Deloitte Global Mobile Consumer Survey 2016, NL edition, Deloitte Analysis
Weighted Base: All respondents (n=3000)
1%
1%
2%
Budget VR headset
Mid-price VR headset
High-end VR headset
Which of the following devices do you currently own?
Which of the following devices are you willing to buy in the next 12 months?

Contact

39Deloitte - Global Mobile Consumer Survey 2016 - NL Edition
Contact
Vincent Kuijvenhoven
Manager | Deloitte Digital
+31 6 5359 8526
Remco Gaykema
Senior Consultant | Deloitte Digital
+31 6 5359 8479
Dirk Reuser
Manager | Deloitte Digital
+31 6 8201 9345
Michiel Mennen
Manager | Operational Excellence
+31 6 1258 1756
Marc Beijn
Director | Deloitte Digital
+31 6 8201 9400
Patrick Steemers
Partner | Segment Lead Telecom
+31 6 8201 9347
Rob Oudehand
Morris Boermann
Joël van Veen
Iris Olde Klieverik
Somil Sharma
Christie Tan
Erik Bookholt
Consultant | Enterprise Architecture
+31 6 8201 2578
With special thanks to:
Deloitte refers to one or more of Deloitte Touche Tohmatsu Limited, a UK private company limited by guarantee (“DTTL”), its network of member firms, and their related entities. DTTL and each of its member firms are legally separate and independent entities. DTTL (also referred to as “Deloitte Global”) does not provide services to clients. Please see www.deloitte.nl/about for a more detailed description of DTTL and its member firms.
Deloitte provides audit, consulting, financial advisory, risk management, tax and related services to public and private clients spanning multiple industries. Deloitte serves four out of five Fortune Global 500® companies through a globally connected network of member firms in more than 150 countries bringing world-class capabilities, insights, and high-quality service to address clients’ most complex business challenges. To learn more about how Deloitte’s approximately 225,000 professionals make an impact that matters, please connect with us on Facebook, LinkedIn, or Twitter.
This communication contains general information only, and none of Deloitte Touche Tohmatsu Limited, its member firms, or their related entities (collectively, the “Deloitte Network”) is, by means of this communication, rendering professional advice or services. Before making any decision or taking any action that may affect your finances or your business, you should consult a qualified professional adviser. No entity in the Deloitte Network shall be responsible for any loss whatsoever sustained by any person who relies on this communication.
© 2016 Deloitte The Netherlands