global it-bpo outsourcing deals analysisindia and australia were two other key outsourcing markets....
TRANSCRIPT

Global IT-BPO
Outsourcing Deals
Analysis
3Q15 Analysis:
July to September
October 2015

1© 2015 KPMG International Cooperative (“KPMG International”), a Swiss entity. Member firms of the KPMG network of independent firms are affiliated with KPMG International. KPMG International provides no client services.
No member firm has any authority to obligate or bind KPMG International or any other member firm vis-à-vis third parties, nor does KPMG International have any such authority to obligate or bind any member firm. All rights
reserved.
About global IT-BPO outsourcing deals analysis
KPMG’s Shared Services and Outsourcing Advisory (SSOA) practice publishes a quarterly analysis on
IT-BPO outsourcing contracts signed across industries and geographies, with a total contract value
(TCV) of USD5 million and above per deal.
Methodology and limitations of the study:
The analysis and findings presented in this report are based on select third party deals database
including, publicly available outsourcing data as identified throughout this presentation. It does not
include contract information gathered from KPMG Sourcing Advisory business engagements.
The count and value of the deals may vary notably in reality and is only indicative of market movements
and trends in the IT-BPO space. Readers are requested to use their discretion while assessing the
global IT-BPO market accordingly.
For more information on this market research, please get in touch with Shailesh Narwaiye

Contents
Section 1: Global deals: An overview
Section 3: IT-BPO outsourcing outlook
Section 2: 3Q15 deal analysis

Section 1
Global deals: An overview

4© 2015 KPMG International Cooperative (“KPMG International”), a Swiss entity. Member firms of the KPMG network of independent firms are affiliated with KPMG International. KPMG International provides no client services.
No member firm has any authority to obligate or bind KPMG International or any other member firm vis-à-vis third parties, nor does KPMG International have any such authority to obligate or bind any member firm. All rights
reserved.
A summary
Source: IDC (www.idc.com), Contract Database, Oct 2015, KPMG member firms research & analysis based on the IDC contract database
In 3Q15 (July to September), 222 ITO contracts worth USD32.9 billion and 23 BPO contracts worth USD4.5
billion were signed, worldwide.
ADM and SCM contributed approximately USD9.6 billion and USD1.7 billion respectively and were
the largest procured services globally within ITO and BPO outsourced services, respectively.
Globally eight IT-BPO bundled deals were signed in 3Q15 with contract value
worth USD1.4 billion.
In terms of value, approximately 59 per cent of deals originated from the United States, followed by
the United Kingdom at 9.8 per cent. India and Australia were two other key outsourcing markets.
Defense sector continued to be the top consumer of IT-BPO services contributing to 54 per cent in terms of
value of outsourcing deals signed in 3Q15. Telecom sector exhibited continuous growth over past two
quarters doubling in total contract value in 3Q15 over 2Q15
Average annualized contract value in 3Q15 was USD36.4 million as compared to USD24.9 million in 3Q14
showing an increase of 46 per cent between the two quarters.
The average deal tenure decreased to 4 years 3 months in 3Q15 from 4 years 9 months in 2Q15.

5© 2015 KPMG International Cooperative (“KPMG International”), a Swiss entity. Member firms of the KPMG network of independent firms are affiliated with KPMG International. KPMG International provides no client services.
No member firm has any authority to obligate or bind KPMG International or any other member firm vis-à-vis third parties, nor does KPMG International have any such authority to obligate or bind any member firm. All rights
reserved.
22.7
36.5 35.3
55.9
20.3
43.9
53.3
28.0 25.229.1 39.8 26.4
21.8
75.9
38.8
292
354
428
516
299
426 422
326
259
316324
245192
334
253
Q1 Q2 Q3 Q4 Q1 Q2 Q3 Q4 Q1 Q2 Q3 Q4 Q1 Q2 Q3
2012 2013 2014 2015
Value (USD billion) No. of deals
Total deal value
USD145.5 billion
Total deal value
USD150.4 billion
Quarterly deal movementsSnapshot
Quarterly movements of global IT-BPO deals*
Number of deals
1,590
-3%
Number of deals
1,473
-7%
*The term deals is interchangeably used with contracts throughout the analysis unless otherwise specified. Deals analyzed are global sourcing contracts of size USD5.0 million and above only.
Source: IDC (www.idc.com), Contract Database, Oct 2015, KPMG member firms research & analysis based on the IDC contract database
Total deal value
USD120.4 billion
-17%
Number of deals
1,144
-22%
Deal value
3Q15
3Q14
3%
No. of deals
3Q14
3Q15
22%
• 3Q15 witnessed a sharp drop in deal activity as compared to 2Q15. There was a decrease of 49 per cent in
total contract value and 24 per cent decrease in total number of deals in 3Q15 as compared to 2Q15
• The average contract value also decreased by 33 per cent in 3Q15 as compared to 2Q15

6© 2015 KPMG International Cooperative (“KPMG International”), a Swiss entity. Member firms of the KPMG network of independent firms are affiliated with KPMG International. KPMG International provides no client services.
No member firm has any authority to obligate or bind KPMG International or any other member firm vis-à-vis third parties, nor does KPMG International have any such authority to obligate or bind any member firm. All rights
reserved.
Annualized contract value (ACV)Q-o-Q comparison
Annualized* contract value comparison per quarter
* Annualized contract value = ( total value of a contract / tenure in months ) x 12
Contract value for contracts having tenure less than 1 year is considered as annualized value for the analysis. Graph is not to scale and
only represents the division across different parameters
Source: IDC (www.idc.com), Contract Database, Oct 2015, KPMG member firms research & analysis based on the IDC contract database
Average annualized contract value (USD million)
Average tenure per contract
Note: All values in USD million unless otherwise specified
14% increase
Minimum annualized
contract value
Maximum annualized
contract value
46% increase
265.7
1720.4
0.57
0.86
4 years 7 months
24.90
27.73
3Q14
3Q13
10000.85
3Q15
36.41
4 years 3 months
4 years 9 months
• Total annualized contract value in 3Q15 increased by 14 per cent as compared to 3Q14. The average
annualized contract value also increased by 46 per cent in 3Q15 as against 3Q14 indicating a strong
preference for larger value deals
• The average contract tenure decreased to 4 years 3 months in 3Q15 from 4 years 7 months in 3Q14
11,703
8,067
9,212
3,500 5,500 7,500 9,500 11,500 13,500
3Q13
3Q14
3Q15
Total Annualized Contract Value (USD million)
31% decrease

7© 2015 KPMG International Cooperative (“KPMG International”), a Swiss entity. Member firms of the KPMG network of independent firms are affiliated with KPMG International. KPMG International provides no client services.
No member firm has any authority to obligate or bind KPMG International or any other member firm vis-à-vis third parties, nor does KPMG International have any such authority to obligate or bind any member firm. All rights
reserved.
*Others: Construction, Consumer and Recreational Services, Education, Professional services, Securities and investment services, Social services, Trade unions, Technology, Wholesale
Source: IDC (www.idc.com), Contract Database, Oct 2015, KPMG member firms research & analysis based on the IDC contract database
Sector analysisQ-o-Q comparison
Trends in deal movement from 3Q14 to 3Q15
Decrease >=25% Decrease <25% Increase <25% Increase >=25%No change
• In 3Q15, while there has been an increase in Total Contract Value by more than 25 per cent in few sectors,
there has been a decrease of more than 25 per cent in sectors like Defense and Government which are
the major contributors to total contract value
• Continuous growth over two last quarters was observed in Telecom in terms of all three parameters - total
contract value, total number of contracts and average contract value
• Multi-fold growth in terms of total contract value was observed in Banking and Financial Services,
Insurance, Travel and Logistics and Telecom sectors in 3Q15 as compared to 2Q15
Sector
3Q14->4Q14 4Q14 -> 1Q15 1Q15 -> 2Q15 2Q15 -> 3Q15 3Q14->4Q14 4Q14 -> 1Q15 1Q15 -> 2Q15 2Q15 -> 3Q15 3Q14->4Q14 4Q14 -> 1Q15 1Q15 -> 2Q15 2Q15 -> 3Q15
Automotive & Aerospace -41% 403% -83% 46% 0% 150% 20% 0% -41% 101% -86% 46%
Banking & Financial Services 77% -7% -90% 360% -37% -8% 18% 15% 181% 2% -91% 299%
Defence -72% 45% 710% -63% -56% 27% 114% -53% -36% 14% 279% -22%
Energy & Utilities -75% 64% -14% 27% -32% -31% 11% 20% -63% 137% -23% 6%
Government -54% -82% 439% -51% -14% -61% 37% 22% -46% -53% 294% -60%
Insurance 331% 36% -92% 1107% 100% 17% 0% 0% 115% 16% -92% 1107%
Manufacturing 91% -2% 170% -4% 15% -53% 129% 38% 66% 110% 18% -30%
Pharma & Healthcare -93% 2242% 1072% -99% -75% 200% 267% -82% -72% 681% 220% -97%
Publishing, Media & Entertainment -96% 786% 314% -72% -67% 100% 350% -78% -88% 343% -8% 26%
Retail -25% -48% 631% 52% 40% -71% 400% -10% -47% 82% 46% 69%
Telecom 47% -59% 82% 105% 17% -39% 76% 3% 26% -33% 3% 98%
Travel & Logistics 263% 4% -91% 371% 40% -14% -17% 0% 160% 22% -89% 371%
Others* 956% -43% 281% -81% 13% 22% 45% -34% 838% -53% 162% -71%
Total Contract Value Total Number of Contracts Average Contract Value

8© 2015 KPMG International Cooperative (“KPMG International”), a Swiss entity. Member firms of the KPMG network of independent firms are affiliated with KPMG International. KPMG International provides no client services.
No member firm has any authority to obligate or bind KPMG International or any other member firm vis-à-vis third parties, nor does KPMG International have any such authority to obligate or bind any member firm. All rights
reserved.
Deal analysis Q-o-Q comparison
Trends in deal movement from 3Q14 to 3Q15
Source: IDC (www.idc.com), Contract Database, Oct 2015, KPMG member firms research & analysis based on the IDC contract database
Decrease >=25% Decrease <25% Increase <25% Increase >=25%No change
• Owing to weak deal activity in 3Q15 added to the fact that 2Q15 was a strong quarter, all the deal
categories witnessed a decrease in total contract value in 3Q15 as compared to 2Q15
• The total number of contracts signed in 3Q15 with tenure between 1 to 5 years increased, both short
tenure (less than 1 year) deals and long tenure (more than 5 years) deals decreased by more than 25 per
cent
• While the total contract value of BPO deals decreased by more than 25 per cent in 3Q15 as compared to
2Q15, the average contract value increased by more than 25 per cent in the same period
Deal Type
3Q14->4Q14 4Q14 -> 1Q15 1Q15 -> 2Q15 2Q15 -> 3Q15 3Q14->4Q14 4Q14 -> 1Q15 1Q15 -> 2Q15 2Q15 -> 3Q15 3Q14->4Q14 4Q14 -> 1Q15 1Q15 -> 2Q15 2Q15 -> 3Q15
ITO 26% -18% 276% -51% 0% -25% 72% -13% 26% 9% 119% -44%
BPO -90% 1% 313% -40% -73% -68% 700% -68% -63% 213% -48% 87%
Bundled -39% -24% -20% -21% -17% 75% -77% 0% -27% -56% 249% -21%
Less than USD 100 MN -27% -18% 78% -20% -20% -20% 56% -25% -9% 2% 14% 6%
Betw een USD 100- 500 MN -51% -10% 214% -44% -32% -29% 159% -25% -28% 27% 21% -25%
More than USD 500 MN -19% -22% 344% -56% -55% -22% 71% -8% 80% 1% 159% -52%
Less than 1-year -54% 61% 21% -66% -37% -5% 33% -25% -27% 68% -9% -55%
Betw een 1 to 5-years -46% 6% 82% -7% -15% -16% 26% 3% -36% 26% 45% -10%
More than 5-years -19% -38% 487% -66% -46% -58% 594% -71% 52% 48% -15% 18%
Total Contract Value Total Number of Contracts Average Contract Value

9© 2015 KPMG International Cooperative (“KPMG International”), a Swiss entity. Member firms of the KPMG network of independent firms are affiliated with KPMG International. KPMG International provides no client services.
No member firm has any authority to obligate or bind KPMG International or any other member firm vis-à-vis third parties, nor does KPMG International have any such authority to obligate or bind any member firm. All rights
reserved.
36.8
97.6
31.3
64.9
24.7
253
887
211
649
118
3Q13 2013 3Q14 2014 3Q15
2.2
8.8
2.2
8.0
6.1 32
134
20
97
48
3Q13 2013 3Q14 2014 3Q15
14.3
39.1
6.2
47.5
7.9
137
452
93
398
87
3Q13 2013 3Q14 2014 3Q15
Geography analysisIT-BPO deals across geographies: Q-o-Q comparison
Geography-wise break-up of deals*
* Deals originating from the geography
Source: IDC (www.idc.com), Contract Database, Oct 2015, KPMG member firms research & analysis based on the IDC contract database
EMA
AMERICAS
ASPAC
11.4 15.6
7.8
716
608 562
2009 2010 2011
Total Contract Value (USD billion) No. of Contracts
30
122
35
126
13
253
1,066
282
996
157
Q2-2009 2009 Q2-2010 2010 Q2-2011
Total Contract Value (USD billion) No. of Contracts
• AMERICAS continues to be the major outsourcing region contributing 64 per cent of the total deal value
in 3Q15. EMA and ASPAC contribute 21 per cent and 16 per cent respectively
• The outsourcing market in EMA and ASPAC continue to grow with an increase in total deal value by 174
per cent and 27 per cent respectively in 3Q15 as compared to 3Q14
• In terms of number of deals, AMERICAS contributed to 47 per cent of the total number of deals signed in
3Q15, whereas EMA and ASPAC contributed 34 per cent and 19 per cent respectively.

10© 2015 KPMG International Cooperative (“KPMG International”), a Swiss entity. Member firms of the KPMG network of independent firms are affiliated with KPMG International. KPMG International provides no client services.
No member firm has any authority to obligate or bind KPMG International or any other member firm vis-à-vis third parties, nor does KPMG International have any such authority to obligate or bind any member firm. All rights
reserved.
5.3
0.8 0.2
1.5 0.9
0.6 0.01 0.01 0.1
3.9
2.0
20.7
2.8
5.7
1.2 0.9
1.6
0.8
1.0
0.2 0.05 0.1
1.6
1.1
4.8
5.8
5.3
0.1 0.1
0.1
2.2
0.9
1.9
0.2 0.4
2.9
4.3
7.0
1.1
0.5 1.1
0.2 0.7
2.2 1.1
0.0 0.1 0.6
6.0
0.8
56.3
5.7
0.1
1.6
Sector analysisIT-BPO deals across sectors by value and numbers
Sector-wise break-up of deals (4Q14 to 3Q15)
Banking
and
Financial
Services
Insurance Automotive
and
Aerospace
Travel and
Logistics
Manufacturing Energy and
Utilities
Pharma
and
Healthcare
Publishing,
Media and
Entertainment
Retail Telecom Others * Defense Government
No. of contracts* Others: Construction, Consumer and Recreational Services, Education, Professional services, Securities and investment services, Social services, Trade unions, Technology, Wholesale
Graph is not to scale and only represents the division across different parameters. Figures may not add up to 100 per cent due to rounding off
Source: IDC (www.idc.com), Contract Database, Jul 2015, KPMG member firms research & analysis based on the IDC contract database
Q4-2014 Q1-2015 Q2-2015
TCV : USD38.8 billion
No. of contracts: 253
Q3-2015
12
6
11
776
2
14 1513
1 1
7
28
5
79
3 2
17
30
10
22
12
2 2
9
31
21
12
18
51
22
65 66
50
77
139
• While the Defence sector continue to lead deal activity, contributing 54 per cent of the total deal value in
3Q15, the contribution of Government sector has dropped to 8 per cent. Both the sectors witnessed a
decrease of over 50 per cent in total contract value in 3Q15 as compared to 2Q15
• Telecom sector is continuously growing since past two quarters. The total contract value doubled in
3Q15 as compared to 2Q15
30
2
13
76
10
16
10 11 9 10
32
41
2.5
15
Deal
Valu
e (
US
D b
illi
on
)
11© 2015 KPMG International Cooperative (“KPMG International”), a Swiss entity. Member firms of the KPMG network of independent firms are affiliated with KPMG International. KPMG International provides no client services.
No member firm has any authority to obligate or bind KPMG International or any other member firm vis-à-vis third parties, nor does KPMG International have any such authority to obligate or bind any member firm. All rights
reserved.
New and renewal* deal analysisQ-o-Q comparison
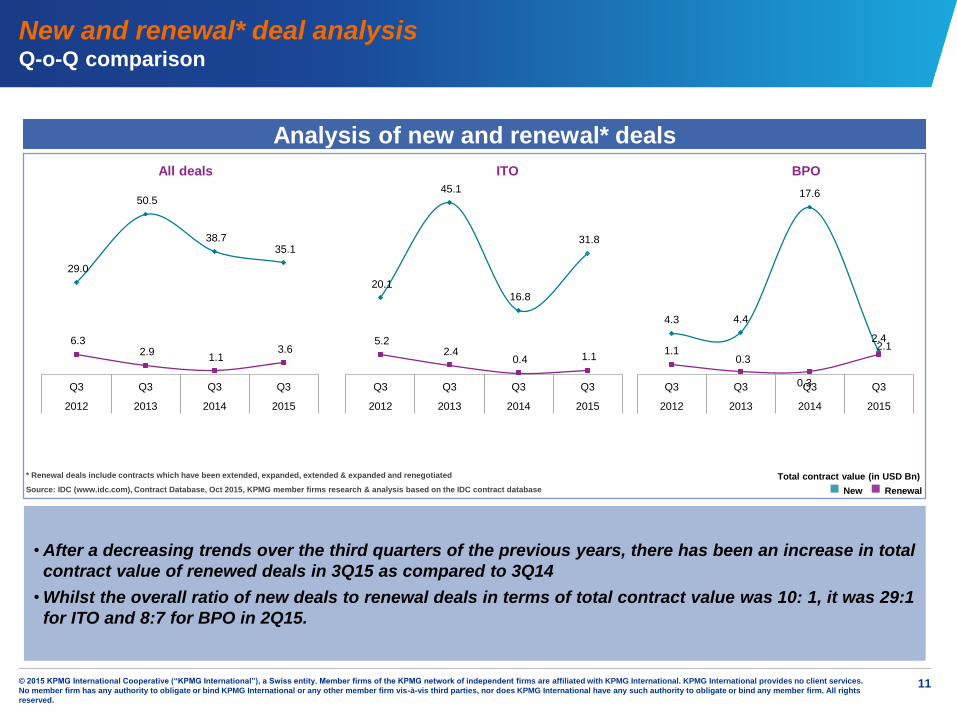
Analysis of new and renewal* deals
• After a decreasing trends over the third quarters of the previous years, there has been an increase in total
contract value of renewed deals in 3Q15 as compared to 3Q14
• Whilst the overall ratio of new deals to renewal deals in terms of total contract value was 10: 1, it was 29:1
for ITO and 8:7 for BPO in 2Q15.
Analysis of new and renewal* deals
* Renewal deals include contracts which have been extended, expanded, extended & expanded and renegotiated
Source: IDC (www.idc.com), Contract Database, Oct 2015, KPMG member firms research & analysis based on the IDC contract database
29.0
50.5
38.7 35.1
6.3 2.9
1.1 3.6
Q3 Q3 Q3 Q3
2012 2013 2014 2015
20.1
45.1
16.8
31.8
5.2 2.4
0.4 1.1
Q3 Q3 Q3 Q3
2012 2013 2014 2015
4.3 4.4
17.6
2.41.1
0.3
0.3
2.1
Q3 Q3 Q3 Q3
2012 2013 2014 2015
All deals ITO BPO
New Renewal
Total contract value (in USD Bn)

Section 2
3Q15 deal analysis

13© 2015 KPMG International Cooperative (“KPMG International”), a Swiss entity. Member firms of the KPMG network of independent firms are affiliated with KPMG International. KPMG International provides no client services.
No member firm has any authority to obligate or bind KPMG International or any other member firm vis-à-vis third parties, nor does KPMG International have any such authority to obligate or bind any member firm. All rights
reserved.
ITO32.9
BPO4.5
Bundled1.4
Americas24.7
EMA7.9
ASPAC6.1
Less than USD 100 MN5.9
Between USD 100- 500 MN12.9
More than USD 500 MN19.9
Less than 1-year0.3
Between 1 to 5-years20.3
More than 5-years18.1
Fixed Price23.5
Hybrid14.2
0.6 0.4
Services Region Contract Value Tenure Pricing
* Deals analyzed are USD5.0 million and above only, throughout the analysis. Graph is not to scale and only represents the division across different parameters. Figures may not add up to 100 per cent due to rounding off
# Hybrid pricing includes a combination of various pricing mechanisms
Source: IDC (www.idc.com), Contract Database, Oct 2015, KPMG member firms research & analysis based on the IDC contract database
IT-BPO deals* signed in 3Q15 (Total contract value: USD38.8 billion)
Total
contract
value
USD38.8
billion
• ITO deals continue to dominate the outsourcing space with a contribution of 85 per cent to total deal
value signed in 3Q15
• AMERICAS continues to be the major outsourcing region contributing 64 per cent of the total deal value
in 3Q15. EMA and ASPAC contribute 21 per cent and 16 per cent respectively
• 3Q15 saw the continued dominance of Fixed Price contracting model, contributing 61 per cent of the deal
value, followed by Hybrid model, contributing 37 per cent.
0%
10%
20%
30%
40%
50%
60%
70%
80%
90%
100%
Deal valueGlobal sourcing snapshot: July to September 2015
OthersTime & Material
#

14© 2015 KPMG International Cooperative (“KPMG International”), a Swiss entity. Member firms of the KPMG network of independent firms are affiliated with KPMG International. KPMG International provides no client services.
No member firm has any authority to obligate or bind KPMG International or any other member firm vis-à-vis third parties, nor does KPMG International have any such authority to obligate or bind any member firm. All rights
reserved.
ITO222
BPO23
Bundled8
Americas118
EMA87
ASPAC48
Less than USD 100 MN180
Between USD 100- 500 MN62
More than USD 500 MN11
Less than 1-year21
Between 1 to 5-years200
More than 5-years32
Fixed Price225
Hybrid9
172
Services Region Contract Value Tenure Pricing
IT-BPO deals* signed in 3Q15 (Total number of contracts: 253)
Total
contracts
253
• While ITO deals and BPO deals decreased by 13 per cent and 68 per cent respectively in terms of number
of deals signed in 3Q15 as compared to 2Q15, bundled deals remained constant in the same period
• 71 per cent of the deals, in terms of number of deals signed in 3Q15, were of value less than USD100
million
• Deals with tenure between 1 to 5 years were largest in number, comprising 79 per cent to the deals
signed in 3Q15. Long tenure deals with tenure more than 5 years made 13 per cent of the total number of
deals
0%
10%
20%
30%
40%
50%
60%
70%
80%
90%
100%
* Deals analyzed are USD5.0 million and above only, throughout the analysis. Graph is not to scale and only represents the division across different parameters. Figures may not add up to 100 per cent due to rounding off
# Hybrid pricing includes a combination of various pricing mechanisms
Source: IDC (www.idc.com), Contract Database, Oct 2015, KPMG member firms research & analysis based on the IDC contract database
Number of dealsGlobal sourcing snapshot: July to September 2015
#
OthersTime & Material

15© 2015 KPMG International Cooperative (“KPMG International”), a Swiss entity. Member firms of the KPMG network of independent firms are affiliated with KPMG International. KPMG International provides no client services.
No member firm has any authority to obligate or bind KPMG International or any other member firm vis-à-vis third parties, nor does KPMG International have any such authority to obligate or bind any member firm. All rights
reserved.
Analysis of ITO deals 3Q15
Number of DealsNote: Size of bubble indicates percentage share of the total number of ITO deals
SI – System Integration, Other IT services – Software testing, IT Education and Training, SaaS
Source: IDC (www.idc.com), Contract Database, Oct 2015, KPMG member firms research & analysis based on the IDC
contract database
• ADM, ICT Services and IT Bundled together contributed to 77 per cent of all ITO deals in terms of value
and 67 per cent in terms of number of deals during 3Q15
• ADM gained activity with multi-fold growth in total contract value in 3Q15 over 2Q15 after a long period of
weak activity. SMAC services are gaining momentum with 43 per cent increase in total contract value
over the same period
Value of contracts (USD Billion)Note: All values in USD billion. Scale of graph is just representative to illustrate the division across different parameters.
Figures may not add up to 100 per cent due to rounding off. Refer L.H.S. figure for legend
Source: IDC (www.idc.com), Contract Database, Oct 2015, KPMG member firms research & analysis based on the IDC
contract database
Services segmentationITO services
9.6
0.2
6.1
9.4
0.02 0.7 0.1
4.7
1.80.3
ADM8%
ERP3%
ICT Services17%
IT Bundled services41%
IT Consulting1%
IT Infrastructure5%
IT Products2%
Other IT Services, 0%
SI7% SMAC
15%
0
5
10
15
20
25
30
35
40
45
0 10 20 30 40 50 60 70 80 90 100
To
tal V
alu
e o
f co
ntr
acts
(U
SD
Billio
n)
32.9
ADM ERP Total
ITO
ICT IT
Bundled
IT
Infra.
IT
Products
SMACSIIT
Conslt.
Other IT
Services

16© 2015 KPMG International Cooperative (“KPMG International”), a Swiss entity. Member firms of the KPMG network of independent firms are affiliated with KPMG International. KPMG International provides no client services.
No member firm has any authority to obligate or bind KPMG International or any other member firm vis-à-vis third parties, nor does KPMG International have any such authority to obligate or bind any member firm. All rights
reserved.
Analysis of BPO deals 3Q15
Note: Size of bubble indicates percentage share of the total number of BPO deals
Other BPO services – Data management, logistics etc.
Source: IDC (www.idc.com), Contract Database, Oct 2015, KPMG member firms research & analysis based on the IDC contract
database
Note: All values in USD million. Scale of graph is just representative to illustrate the division across different parameters.
Figures may not add up to 100 per cent due to rounding off. Refer L.H.S. figure for legend
Source: IDC (www.idc.com), Contract Database, Oct 2015, KPMG member firms research & analysis based on the IDC
contract database
• SCM and BPO Bundled together contributed to 60 per cent of all BPO deals in terms of value and 61 per
cent in terms of number of deals during 3Q15
• F&A and CRM services have also exhibited multifold growth in 3Q15 in terms of deal value as compared
to 2Q15
Services segmentationBPO services
929
63
550
331
0 55
1729
BPO Bundled services
17%
Content Management
4%
CRM9%
F&A13%
HRO9%
Other BPO Services
4%
SCM43%
0
200
400
600
800
1,000
1,200
1,400
1,600
1,800
2,000
0 4 8 12
4,455
BPO
Bundled
Services
Content
Mgmt.
CRM Total
BPOHRO KPO Other
BPO
Services
To
tal V
alu
e o
f co
ntr
acts
(U
SD
Millio
n)
Number of Deals Value of contracts (USD Million)
SCM

Section 3
IT-BPO outsourcing outlook

18© 2015 KPMG International Cooperative (“KPMG International”), a Swiss entity. Member firms of the KPMG network of independent firms are affiliated with KPMG International. KPMG International provides no client services.
No member firm has any authority to obligate or bind KPMG International or any other member firm vis-à-vis third parties, nor does KPMG International have any such authority to obligate or bind any member firm. All rights
reserved.
OutlookGlobal outsourcing industry
■ 3Q15 shows a outsourcing deal activity in lines with the weak economic activity in most major
industrialized markets – though there is a sharp dip as compared to 2Q15, it is comparable to the third
quarters of the last couple of years.
■ Renewal deals value is miniscule as compared to new deals values with many organizations actively
exploring outsourcing as a part of their business transformation efforts from a more wide-ranging process
standpoint.
■ Government and Defense sectors are the main consumers of IT&BPO services – while 2Q15 saw an
upturn in the deal activity both the sectors witnessed a significant downturn in 3Q15
■ Many organizations chose traditional pricing models as compared to a hybrid model continuing the
decreasing trend in the share of hybrid pricing deals over the quarters. This may indicate a reduction in
the risk appetite of the vendors
■ While EMA is continuing to gain outsourcing momentum, 3Q15 deal activity has been driven by the
AMERICAS which continues to be the major outsourcer
■ SMAC services and automation are major drivers for the commoditization of the outsourcing services
and this is especially true for IT services. There are still only a few stand-alone SMAC deals but are
now becoming a common part of bundled deals.
■ Buyers are seeking more commoditized solutions tailor made to specific industry, geographic and
regulatory needs that can drive benefits more than cost savings*
1 KPMG SSOA Pulse survey 2Q15
Source: IDC (www.idc.com), Contract Database, Oct 2015, KPMG member firms research & analysis based on the IDC contract database

19© 2015 KPMG International Cooperative (“KPMG International”), a Swiss entity. Member firms of the KPMG network of independent firms are affiliated with KPMG International. KPMG International provides no client services.
No member firm has any authority to obligate or bind KPMG International or any other member firm vis-à-vis third parties, nor does KPMG International have any such authority to obligate or bind any member firm. All rights
reserved.
To learn more, log on to https://institutes.kpmg.us/institutes/shared-services-outsourcing-institute.html/
Advice Worth Keeping Blog: http://blog.equaterra.com/
Advice Worth Keeping podcast series: http://www.kpmginstitutes.com/shared-services-outsourcing-institute/events/podcast_series/advice-worth-keeping-
podcast-series.aspx
Global IT-BPO Outsourcing Deals Analysis: http://www.kpmg.com/IN/en/IssuesAndInsights/ArticlesPublications/KPMG-Deal-Tracker/Pages/Default.aspx
Latest from the KPMG Shared Services and Outsourcing Institute
•Global Business Services (GBS) Journey to Excellence
•Robotic Revolution – Separating Hype from Reality
•From Human to Digital: The Future of Global Business Services
About KPMG Institutes
KPMG Institutes is dedicated to
helping organisations and their
stakeholders identify and understand
emerging trends, risks and
opportunities. We do this by creating
an open forum where peers can
exchange insights, share leading
practices, and access the latest
thought leadership publications.
As a result, corporate executives,
business managers, industry
leaders, government officials,
academics, and others have access
to the thought leadership documents
and knowledge which they can use
to make better informed decisions
and meet their marketplace
challenges.
KPMG Shared Services and Outsourcing Advisory (SSOA) research

20© 2015 KPMG International Cooperative (“KPMG International”), a Swiss entity. Member firms of the KPMG network of independent firms are affiliated with KPMG International. KPMG International provides no client services.
No member firm has any authority to obligate or bind KPMG International or any other member firm vis-à-vis third parties, nor does KPMG International have any such authority to obligate or bind any member firm. All rights
reserved.
Glossary (1/2)
Terms Definition
ITO Information Technology Outsourcing
BPO Business Process Outsourcing
ACV Annualized contract value = ( total value of a contract/tenure in months ) x 12
TCV Total contract value
AMERICAS North America and South America
ASPAC Asia and Oceania
EMA Europe, Middle East and Africa

21© 2015 KPMG International Cooperative (“KPMG International”), a Swiss entity. Member firms of the KPMG network of independent firms are affiliated with KPMG International. KPMG International provides no client services.
No member firm has any authority to obligate or bind KPMG International or any other member firm vis-à-vis third parties, nor does KPMG International have any such authority to obligate or bind any member firm. All rights
reserved.
Glossary (2/2)
Terms Definition
ITO Services
ADM Application development and maintenance
ERP Enterprise resource planning implementation and support services
ICT ServicesInformation and communication technology services (e.g. contact center technology, telecommunication, and
related services)
IT Bundled Services Any combination of two or more IT services mentioned above
IT Consulting Information technology consulting services
IT InfrastructureIT hardware deployment (e.g. data centre outsourcing, network management, hardware deploy and support,
hosting services, etc.)
IT Products Software products typically developed and branded by IT companies and sold as own Intellectual Property
Other IT ServicesTypically services that do not fall in other buckets (e.g. Software testing, IT helpdesk support services, Cyber
security)
SMAC Social, Mobile, Analytics and Cloud services (i.e. Social Media, Mobility, Analytics and Cloud computing)
System Integration IT system integration services (application or enterprise system integration services)
BPO Services
BPO Bundled Services Any combination of two or more BPO services mentioned above
Content Management Data management services (e.g. document management, print management, etc.)
CRM Customer Relationship Management solutions and services
F&A Finance and Accounting services
HRO Human Resource outsourcing services
KPO Knowledge process outsourcing services
Other BPO Services Typically services that do not fall in other buckets (e.g. Industry specific processes, Facilities Management)
SCM Supply Chain Management services (including procurement, logistics etc.)

22© 2015 KPMG International Cooperative (“KPMG International”), a Swiss entity. Member firms of the KPMG network of independent firms are affiliated with KPMG International. KPMG International provides no client services.
No member firm has any authority to obligate or bind KPMG International or any other member firm vis-à-vis third parties, nor does KPMG International have any such authority to obligate or bind any member firm. All rights
reserved.
Jehil ThakkarPartner – Advisory Services
KPMG in India
+91 22 3090 1670
Viral ThakkerPartner – Advisory Services
KPMG in India
+91 22 3090 1730
KPMG contacts:
Stan Lepeak Director – Global Research,
Management Consulting
KPMG in the US
+1 203 458 0677

Thank you
Analyst Team Contact:
Shailesh Narwaiye
KPMG in India
+91 20 3050 4000
Analysts (KPMG in India):
Esther Jaydevi
Swati Kumari
The information contained herein is of a general nature and is not
intended to address the circumstances of any particular individual
or entity. Although we endeavour to provide accurate and timely
information, there can be no guarantee that such information is
accurate as of the date it is received or that it will continue to be
accurate in the future. No one should act on such information
without appropriate professional advice after a thorough
examination of the particular situation.
© 2015 KPMG International Cooperative (“KPMG International”), a
Swiss entity. Member firms of the KPMG network of independent
firms are affiliated with KPMG International. KPMG International
provides no client services. No member firm has any authority to
obligate or bind KPMG International or any other member firm vis-
à-vis third parties, nor does KPMG International have any such
authority to obligate or bind any member firm. All rights reserved.
The KPMG name, logo and “cutting through complexity” are
registered trademarks or trademarks of KPMG International.