global investment trends - unctad | homeunctad.org/en/publicationchapters/wir2013ch1_en.pdf ·...
TRANSCRIPT

CHAPTER I
GLOBAL INVESTMENT
TRENDS

World Investment Report 2013: Global Value Chains: Investment and Trade for Development2
A. GLOBAL TRENDS: THE FDI RECOVERY FALTERS
1.Current trends
Global foreign direct invest-
ment (FDI) inflows fell by
18 per cent in 2012, down
from a revised $1.65 trillion
in 2011 to $1.35 trillion. The
strong decline in FDI flows
is in stark contrast to other
macroeconomic variables,
including GDP, trade and
employment growth, which all remained in positive
territory in 2012 (table I.1).
FDI flows in 2013 are expected to remain close
to the 2012 level, with an upper range of $1.45
trillion. As macroeconomic conditions improve and
investors regain confidence in the medium term,
transnational corporations (TNCs) may convert their
record levels of cash holdings into new investments.
FDI flows may then reach the level of $1.6 trillion
in 2014 and $1.8 trillion in 2015. Nevertheless,
significant risks to this scenario persist, including
structural weaknesses in the global financial
system, weaker growth in the European Union (EU)
and significant policy uncertainty in areas crucial for
investor confidence.
a. FDI by geographical distribution
(i) FDI inflows
FDI flows to developing
economies remained rela-
tively resilient in 2012,
reaching more than $700
billion, the second highest
level ever recorded. In
contrast, FDI flows to
developed countries
shrank dramatically to
$561 billion, almost one third of their peak value
in 2007. Consequently, developing economies
absorbed an unprecedented $142 billion more
FDI than developed countries. They accounted
for a record share of 52 per cent of FDI inflows
in 2012 (figure I.1). The global rankings of the
largest recipients of FDI also reflect changing
patterns of investment flows. For example, four
developing economies now rank among the five
largest recipients in the world; and among the
top 20 recipients, nine are developing economies
(figure I.2).
Among developing regions, FDI inflows to
developing Asia fell by 6.7 per cent as a result of
decreases across most subregions and major
economies, including China, Hong Kong (China),
India, the Republic of Korea, Saudi Arabia and
Turkey. However, 2012 inflows to Asia still attained
the second highest level recorded, accounting for
58 per cent of FDI flows to developing countries.
FDI inflows to the Association of Southeast Asian
Nations (ASEAN) went up by 2 per cent as most
countries in this group saw their FDI rise. FDI flows
to West Asia declined for the fourth consecutive
year: with continuing political uncertainty in the
region and subdued economic prospects globally,
foreign investors were still wary of making further
commitments in the region.
FDI to Latin America and the Caribbean maintained
the high levels it reached in 2011, decreasing only
slightly, by 2.2 per cent in 2012. The high levels
The post-crisis FDI recovery
that started in 2010 and 2011
has currently stalled, with
global FDI flows falling to
below the pre-crisis level. The
FDI recovery will now take
longer than expected.
In 2012, for the first time
ever, developing economies
absorbed more FDI than
developed countries, with
nine developing economies
ranked among the 20 largest
recipients in the world.
Table I.1. Growth rates of global GDP, GFCF, trade, employment and FDI, 2008–2014
(Per cent)
Variable 2008 2009 2010 2011 2012 2013a 2014a
GDP 1.4 -2.1 4.0 2.8 2.3 2.3 3.1
Trade 3.0 -10.3 12.5 5.9 2.6 3.6 5.3
GFCF 2.3 -5.6 5.6 4.8 3.7 5.0 5.7
Employment 1.1 0.5 1.3 1.5 1.3 1.3 1.3
FDI -9.3 -33.0 15.8 17.3 -18.2 3.6 17.1
Memorandum:
FDI value
(in $ trillions)1.82 1.22 1.41 1.65 1.35 1.40 1.6
Source: UNCTAD based on United Nations for GDP, IMF for
GFCF and Trade, and ILO for employment.a Projections.
Note: GFCF = Gross fixed capital formation.

CHAPTER I Global Investment Trends 3
East Europe, FDI flows almost halved as a result
of reduced investment from EU countries, the
main investors in the subregion. In the CIS, FDI
flows fell only slightly as foreign investors continue
to be attracted by these countries’ fast-growing
consumer markets and natural resources. The
Russian Federation saw FDI flows decline slightly,
while those to Kazakhstan and Ukraine rose
modestly.
of FDI flows to South America were driven mainly
by the region’s economic buoyancy, attracting a
significant number of market-seeking investments,
and by the persistent strength of commodity prices.
This continued to encourage investments in the
extractive industries, particularly in Chile, Peru
and Colombia. FDI to Brazil slowed but remained
robust, elevating the country to the world’s fourth
leading investment destination (see figure I.2). FDI
flows to Central America decreased, mainly as a
result of a decline in flows to Mexico.
Africa was the only region that saw FDI flows rise
in 2012 (figure I.3). Flows to North Africa reversed
their downward trend, and Egypt saw a rebound in
investment from European investors. FDI inflows to
sub-Saharan Africa were driven partly by investments
in the extractive sector in countries such as the
Democratic Republic of the Congo, Mauritania,
Mozambique and Uganda. Angola – an important
holder of FDI stock in Africa – continued to post
divestments in 2012.
In 2012, the transition economies of South-East
Europe and the Commonwealth of Independent
States (CIS) saw a decline in FDI inflows, driven
in large part by the plummeting value of cross-
border mergers and acquisitions (M&As). In South-
Figure I.2. Top 20 host economies, 2012(Billions of dollars)
Developing economies
Developed economies
Transition economies
14141620
252628282930
4551
5757
626565
75121
168
20 Sweden (38)19 Kazakhstan (27)
18 Colombia (28)17 Indonesia (21)
16 France (13)15 India (14)
14 Spain (16)13 Luxembourg (18)
12 Ireland (32)11 Chile (17)
10 Canada (12)9 Russian Federation (9)
8 Singapore (8)7 Australia (6)
6 United Kingdom (10)5 British Virgin Islands (7)
4 Brazil (5)3 Hong Kong, China (4)
2 China (2)1 United States (1)
(x) = 2011 ranking
Source: UNCTAD FDI-TNC-GVC Information System, FDI
database (www.unctad.org/fdistatistics).
Figure I.1. FDI inflows, global and by group of economies, 1995–2012
(Billions of dollars)
0
500
1 000
1 500
2 000
2 500
1995
1996
1997
1998
1999
2000
2001
2002
2003
2004
2005
2006
2007
2008
2009
2010
2011
2012
52
World total
Developingeconomies
Transition economies
Developed economies
Source: UNCTAD FDI-TNC-GVC Information System, FDI
database (www.unctad.org/fdistatistics).
Figure I.3. FDI inflows, by region, 2008–2012(Billions of dollars)
Africa Latin America and
the Caribbean
Asia Transitioneconomies
0
70
140
210
280
350
420
4902008 2009 2010 2011 2012
Source: UNCTAD FDI-TNC-GVC Information System, FDI
database (www.unctad.org/fdistatistics).

World Investment Report 2013: Global Value Chains: Investment and Trade for Development4
FDI flows declined dramatically to developed
countries in 2012, falling sharply both in Europe
and in the United States. In Europe, Belgium
and Germany saw sharp declines in FDI inflows.
In Belgium – which, with a drop of more than
$100 billion, accounted for much of the fall – FDI
flows are often volatile or inflated by the transactions
of special purpose entities (SPEs). Germany posted
a large decline of FDI from $49 billion in 2011 to
$6.6 billion in 2012, owing to large divestments.
Taken together, FDI flows to the Southern European
countries affected by sovereign debt problems
(Greece, Italy, Portugal and Spain) more than halved
from 2011. The decline of inflows to the United
States is largely explained by the fall in cross-border
M&A sales. Despite that fall, the country remained
the largest recipient of FDI flows in the world. A few
developed countries bucked the trend and saw FDI
inflows increase – namely Canada, Ireland, Japan
and the United Kingdom – although none of these
increases were significant in historic terms. Of note,
however, Japan saw positive inflows after two years
of net divestments. The return of greater stability
and confidence in the Irish economy has revived the
activity of TNCs in the country since the crisis.
(ii) FDI outflows
Global FDI outflows fell by
17 per cent to $1.4 trillion,
down from $1.7 trillion in
2011. Developed econo-
mies, in particular those
in the EU, saw their FDI
outflows fall close to the
trough of 2009, in part
because of uncertainty
about the euro. In contrast, investors from
developing countries continued their expansion
abroad. Together, the share of developing and
transition economies in global outflows reached 35
per cent (figure I.4). Among developing and transition
economies, the BRICS countries (Brazil, the Russian
Federation, India, China and South Africa) continue
to be important outward investors (box I.1).
In contrast to the sharp decline of FDI flows from
developed countries, FDI flows from developing
economies rose slightly in 2012, amounting to $426
billion. As a result, their share in global outflows rose
to a record 31 per cent. Among developing regions,
FDI outflows from Africa nearly tripled, flows from
Asia remained unchanged from their 2011 level,
and those from Latin America and the Caribbean
declined slightly (figure I.5). Asian countries
remained the largest source of FDI in developing
world, accounting for almost three quarters of the
group’s total.
The rise in outward FDI flows from Africa in 2012 –
to $14 billion – was mainly due to large flows from
South Africa in mining, the wholesale sector and
health-care products. In 2012, FDI outflows from
developing Asia remained close to the record
level of 2011, reaching $308 billion. China has
been one of the main drivers of outflows from
Asia. Flows from the Republic of Korea, Malaysia,
Saudi Arabia, Thailand and Turkey rose in 2012.
In contrast, companies from Hong Kong (China),
India and Singapore saw their investments abroad
fall from 2011 levels. Outward FDI from Latin
America and the Caribbean declined by 2 per cent
in 2012, to some $100 billion. Outflows from Brazil
remained restrained by high levels of repayment of
intercompany loans by Brazilian affiliates abroad
to their parent companies in Brazil. In contrast,
Mexico and Chile saw strong increases in their FDI
outflows.
Outward FDI flows from transition economies
declined in 2012, owing to a fall in FDI outflows
by Russian investors. Although natural-resource-
based TNCs supported by high commodity prices
Investors from developing
economies remained bullish
in 2012. In contrast,
developed-country TNCs
continued their wait-and-see
approach or heavily divested
their FDI assets.
Figure I.4. Share of major economic groups in FDI outflows, 2000–2012
(Per cent)
Developed economiesDeveloping and transition economies
0
25
50
75
100
88
65
35
12
2000
2001
2002
2003
2004
2005
2006
2007
2008
2009
2010
2011
2012
Source: UNCTAD FDI-TNC-GVC Information System, FDI
database (www.unctad.org/fdistatistics).
CHAPTER I Global Investment Trends 5
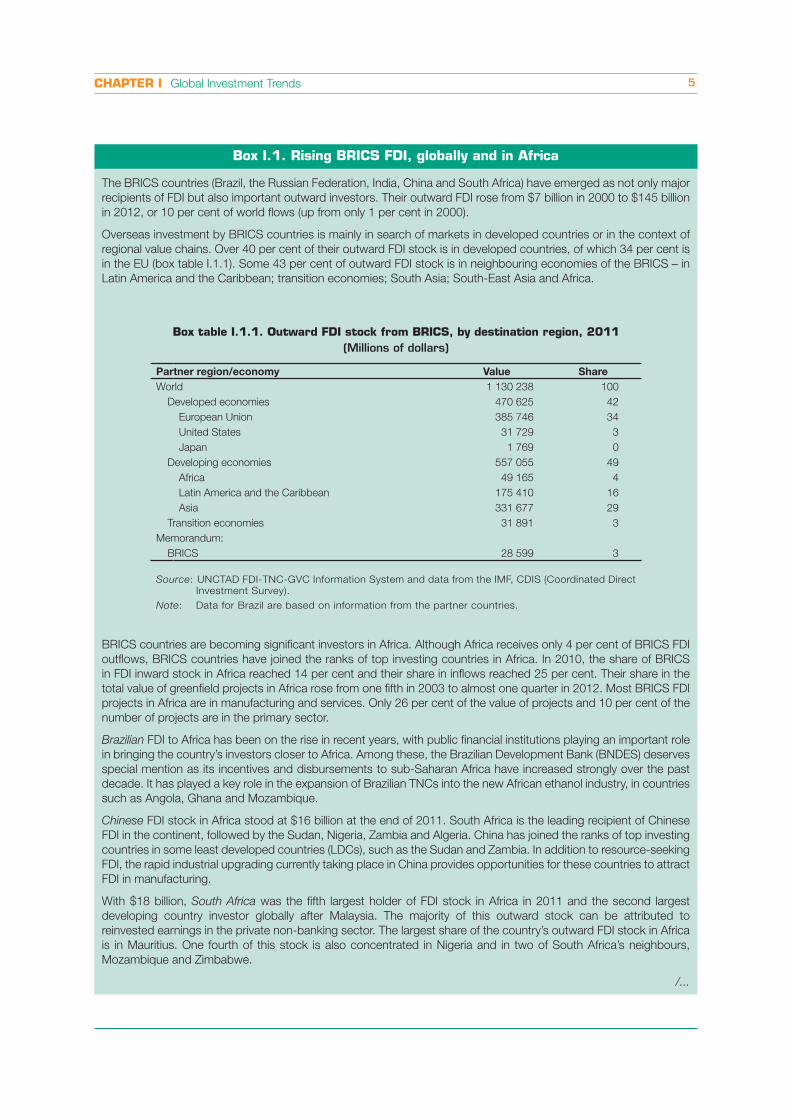
Box I.1. Rising BRICS FDI, globally and in Africa
The BRICS countries (Brazil, the Russian Federation, India, China and South Africa) have emerged as not only major
recipients of FDI but also important outward investors. Their outward FDI rose from $7 billion in 2000 to $145 billion
in 2012, or 10 per cent of world flows (up from only 1 per cent in 2000).
Overseas investment by BRICS countries is mainly in search of markets in developed countries or in the context of
regional value chains. Over 40 per cent of their outward FDI stock is in developed countries, of which 34 per cent is
in the EU (box table I.1.1). Some 43 per cent of outward FDI stock is in neighbouring economies of the BRICS – in
Latin America and the Caribbean; transition economies; South Asia; South-East Asia and Africa.
BRICS countries are becoming significant investors in Africa. Although Africa receives only 4 per cent of BRICS FDI
outflows, BRICS countries have joined the ranks of top investing countries in Africa. In 2010, the share of BRICS
in FDI inward stock in Africa reached 14 per cent and their share in inflows reached 25 per cent. Their share in the
total value of greenfield projects in Africa rose from one fifth in 2003 to almost one quarter in 2012. Most BRICS FDI
projects in Africa are in manufacturing and services. Only 26 per cent of the value of projects and 10 per cent of the
number of projects are in the primary sector.
Brazilian FDI to Africa has been on the rise in recent years, with public financial institutions playing an important role
in bringing the country’s investors closer to Africa. Among these, the Brazilian Development Bank (BNDES) deserves
special mention as its incentives and disbursements to sub-Saharan Africa have increased strongly over the past
decade. It has played a key role in the expansion of Brazilian TNCs into the new African ethanol industry, in countries
such as Angola, Ghana and Mozambique.
Chinese FDI stock in Africa stood at $16 billion at the end of 2011. South Africa is the leading recipient of Chinese
FDI in the continent, followed by the Sudan, Nigeria, Zambia and Algeria. China has joined the ranks of top investing
countries in some least developed countries (LDCs), such as the Sudan and Zambia. In addition to resource-seeking
FDI, the rapid industrial upgrading currently taking place in China provides opportunities for these countries to attract
FDI in manufacturing.
With $18 billion, South Africa was the fifth largest holder of FDI stock in Africa in 2011 and the second largest
developing country investor globally after Malaysia. The majority of this outward stock can be attributed to
reinvested earnings in the private non-banking sector. The largest share of the country’s outward FDI stock in Africa
is in Mauritius. One fourth of this stock is also concentrated in Nigeria and in two of South Africa’s neighbours,
Mozambique and Zimbabwe.
/...
Box table I.1.1. Outward FDI stock from BRICS, by destination region, 2011
(Millions of dollars)
Partner region/economy Value Share
World 1 130 238 100
Developed economies 470 625 42
European Union 385 746 34
United States 31 729 3
Japan 1 769 0
Developing economies 557 055 49
Africa 49 165 4
Latin America and the Caribbean 175 410 16
Asia 331 677 29
Transition economies 31 891 3
Memorandum:
BRICS 28 599 3
Source: UNCTAD FDI-TNC-GVC Information System and data from the IMF, CDIS (Coordinated Direct
Investment Survey).
Note: Data for Brazil are based on information from the partner countries.

World Investment Report 2013: Global Value Chains: Investment and Trade for Development6
continued their expansion abroad, the largest
acquisitions in 2012 took place in the financial
industry.
The global ranking of the largest FDI investors
shows the continuing rise of developing and
transition economies (figure I.6). Two developing
countries now rank among the five largest foreign
investors in the world, and for the first time ever,
China was the world’s third largest investor, after
the United States and Japan.
Outward FDI from developed countries fell by more
than $274 billion in 2012, which accounted for
almost the entire decline in global outflows. Belgium,
the United States and the Netherlands saw the
largest declines. FDI dropped in 22 of 38 developed
economies, including most of the major source
countries. The continuing Eurozone crisis appears to
have deterred United States investors from investing
in Europe, their main target region. European TNCs,
mainly in the financial industry, heavily divested
their assets abroad. In contrast, Japan kept up the
momentum of the previous year to become the
second largest source of FDI worldwide. A growing
part of outward FDI from developed countries
is made up of reinvested earnings, now a record
61 per cent of the total (figure I.7). While this reflects
a growing tendency of developed-country TNCs to
finance overseas expansion from foreign earnings,
it also reflects the tendency of developed-country
TNCs to hold large cash reserves in their foreign
affiliates in the form of retained earnings.
Box I.1. Rising BRICS FDI, globally and in Africa (concluded)
Indian FDI in Africa has traditionally been concentrated in Mauritius, originally because of ethnic links that led to
FDI in the garment industry, but more recently because of the country’s offshore financial facilities and favourable
tax conditions. As a result, the final destinations of recent investments have often been elsewhere. However, Indian
TNCs have recently begun investing in other countries in the region, such as Côte d’Ivoire, Ethiopia, Senegal and
the Sudan.
The expansion of Russian TNCs in Africa is fairly recent but has been rapid, reaching $1 billion in 2011. The arrival of
Russian TNCs has been motivated by a desire to enhance raw-material supplies and to expand into new segments
of strategic commodities, as well as a desire to access local markets.
Source: UNCTAD.
Figure I.5. FDI outflows, by region, 2008–2012(Billions of dollars)
2008 2009 2010 2011 2012
Africa Latin America and
the Caribbean
Asia Transitioneconomies
0
100
200
300
400
Source: UNCTAD FDI-TNC-GVC Information System, FDI
database (www.unctad.org/fdistatistics).
Figure I.6. Top 20 investor economies, 2012(Billions of dollars)
Source: UNCTAD FDI-TNC-GVC Information System, FDI
database (www.unctad.org/fdistatistics).
20 Luxembourg (30)19 Ireland (167)18 Norway (19)
17 Chile (21)16 Singapore (18)
15 Mexico (28)14 Italy (9)
13 Republic of Korea (16)12 Sweden (17)
11 France (8)10 British Virgin Islands (10)
9 Switzerland (13)8 Russian Federation (7)
7 Canada (12)6 Germany (11)
5 United Kingdom (3)4 Hong Kong, China (4)
3 China (6)2 Japan (2)
1 United States (1)
(x) = 2011 ranking
329
17
1921
21
2326
30
33
37
42
4451
5467
71
8484
123
33
Developing economies
Developed economies
Transition economies

CHAPTER I Global Investment Trends 7
b. FDI by mode and sector/industry
In 2012 the deterioration
of the global economic
situation – in particular the
deepening of the crisis
in the Eurozone and the
slowing of growth in the
emerging economies –
clearly depressed investors’
drive to launch cross-border investment initiatives.
Generally speaking, the weakening of global
demand and the resulting competitive pressure
pushed most operators to turn their focus to the
solidity of their balance sheet and the preservation
of shareholders’ returns rather than on investments
and growth. This trend involved both greenfield and
M&A projects.
In the absence of published FDI data by sector for
2012, this section relies on data on cross-border
M&As and on announced greenfield FDI invest-
ments1 (see web annex tables for FDI by sector and
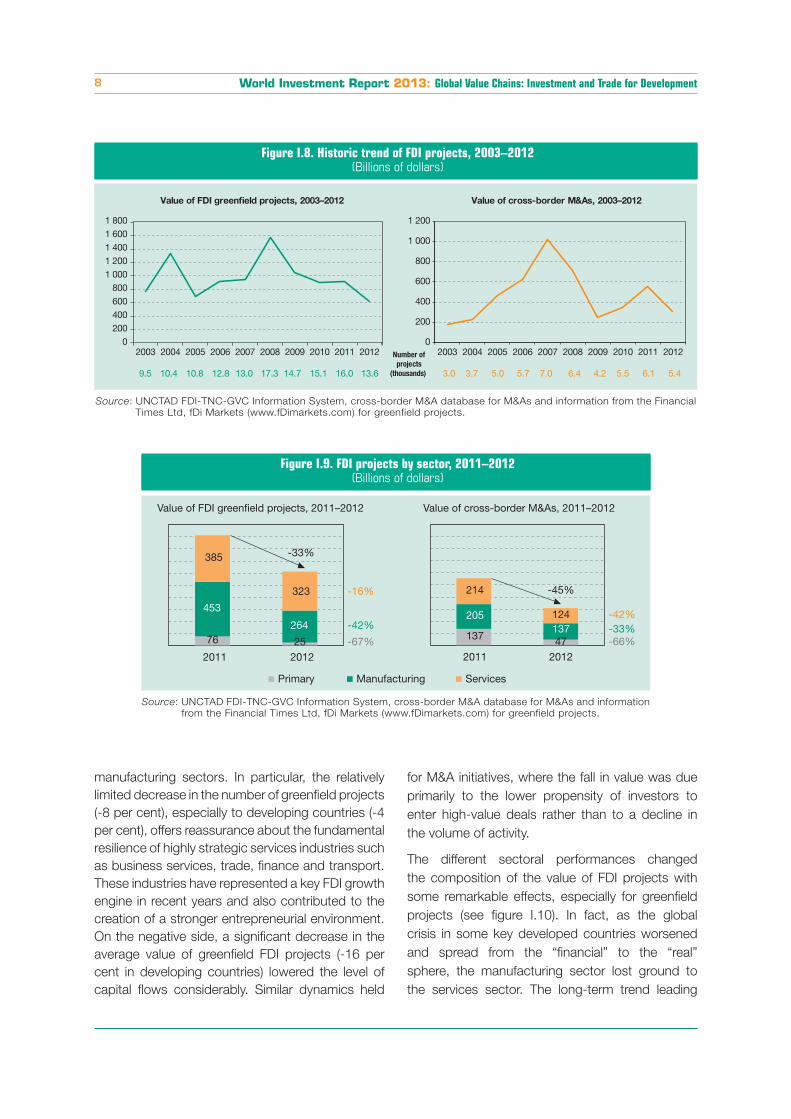
industry in 2011). The estimated capital expenditure
of announced greenfield projects fell by 33 per cent
compared with 2011, reaching $600 billion, the
lowest level in the past 10 years (figure I.8). The con-
traction was even more pronounced in developing
economies (-38 per cent), raising additional concerns
about the development impact of the downturn.
The value of cross-border M&As declined by 45 per
cent, back to levels similar to those of 2009 and
2010 (figure I.8), after the financial crisis had knocked
down M&A activity in developed economies.
Compared with the decline in the value of FDI
projects, the decline in the number of projects was
more moderate (-15 per cent for greenfield projects
and -11 per cent for M&A deals). The discrepancy
is explained by a significant reduction in the size of
projects; specifically, the average investment value
decreased by 21 per cent for greenfield projects
and 38 per cent for cross-border M&As.
All three sectors were heavily hit by the downturn,
although with different intensities (figure I.9).
The primary sector was the most heavily hit in relative
terms, in both greenfield projects and cross-border
M&As. The decline was driven by the downturn in
the mining, quarrying and petroleum industry, which
represents the bulk of the overall FDI activity in the
sector. The contraction was particularly dramatic in
developing countries, where the announced value
of greenfield projects fell to one fourth of the 2011
value. Similarly, FDI inflows to developing eco-
nomies generated by cross-border M&A activities
plunged from some $25 billion in 2011 to a slightly
negative value, revealing a predominant divestment
trend by foreign investors in the sector.
Manufacturing was the sector with the largest
decrease in FDI project value in absolute terms,
originating mainly from a decline in the value of
greenfield projects across all three groups of
economies – developed, developing and transition
economies. The retreat in greenfield project activity
is confirmed by a significant decline in the number
of such projects, down by 21 per cent globally. By
contrast, the decline in the value of cross-border
M&As was driven primarily by a decrease in the
average deal value, as weak business sentiment
– particularly in some developed economies –
prevented companies from engaging in large
projects.
Services turned out to be the sector least affected,
despite sharing the overall fall with the primary and
Figure I.7. FDI outflows by components for 37 selected developed countries,a 2007–2012
(Billions of dollars)
0
25
50
75
100
2007 2008 2009 2010 2011 2012
Equity outflows Reinvested earnings Other capital
30%61%
Source: UNCTAD FDI-TNC-GVC Information System, FDI
database (www.unctad.org/fdistatistics).
a Countries included are Australia, Austria, Belgium, Bermuda,
Bulgaria, Canada, Cyprus, the Czech Republic, Denmark,
Estonia, Finland, France, Germany, Greece, Hungary, Iceland,
Ireland, Israel, Italy, Japan, Latvia, Lithuania, Luxembourg,
Malta, the Netherlands, New Zealand, Norway, Poland,
Portugal, Romania, Slovakia, Slovenia, Spain, Sweden,
Switzerland, the United Kingdom and the United States.
Note: Data for reinvested earnings may be underestimated
as they are reported together with equity in some
countries.
The deterioration of the global
crisis hit FDI in all three
sectors. Services displayed
higher resilience and
gained share at the expense
of both the primary and
manufacturing sectors.
World Investment Report 2013: Global Value Chains: Investment and Trade for Development8
manufacturing sectors. In particular, the relatively
limited decrease in the number of greenfield projects
(-8 per cent), especially to developing countries (-4
per cent), offers reassurance about the fundamental
resilience of highly strategic services industries such
as business services, trade, finance and transport.
These industries have represented a key FDI growth
engine in recent years and also contributed to the
creation of a stronger entrepreneurial environment.
On the negative side, a significant decrease in the
average value of greenfield FDI projects (-16 per
cent in developing countries) lowered the level of
capital flows considerably. Similar dynamics held
for M&A initiatives, where the fall in value was due
primarily to the lower propensity of investors to
enter high-value deals rather than to a decline in
the volume of activity.
The different sectoral performances changed
the composition of the value of FDI projects with
some remarkable effects, especially for greenfield
projects (see figure I.10). In fact, as the global
crisis in some key developed countries worsened
and spread from the “financial” to the “real”
sphere, the manufacturing sector lost ground to
the services sector. The long-term trend leading
Figure I.8. Historic trend of FDI projects, 2003–2012(Billions of dollars)
Number ofprojects
(thousands)
Value of FDI greenfield projects, 2003–2012 Value of cross-border M&As, 2003–2012
0 200 400 600 800
1 0001 2001 4001 6001 800
2003 2004 2005 2006 2007 2008 2009 2010 2011 2012 0
200
400
600
800
1 000
1 200
2003 2004 2005 2006 2007 2008 2009 2010 2011 2012
9.5 10.4 10.8 12.8 13.0 17.3 14.7 15.1 16.0 13.6 3.0 3.7 5.0 5.7 7.0 6.4 4.2 5.5 6.1 5.4
Source: UNCTAD FDI-TNC-GVC Information System, cross-border M&A database for M&As and information from the Financial
Times Ltd, fDi Markets (www.fDimarkets.com) for greenfield projects.
Figure I.9. FDI projects by sector, 2011–2012(Billions of dollars)
76 25
453
264
385
323
ServicesManufacturingPrimary
137 47
205137
214
124
2011 2012 2011 2012
-16%
-33%
-42%
-67%
-42%
-45%
-33%-66%
Value of FDI greenfield projects, 2011–2012 Value of cross-border M&As, 2011–2012
Source: UNCTAD FDI-TNC-GVC Information System, cross-border M&A database for M&As and information
from the Financial Times Ltd, fDi Markets (www.fDimarkets.com) for greenfield projects.

CHAPTER I Global Investment Trends 9
differences became apparent in how individual
industries were affected (figure I.11).
Mining, quarrying and petroleum, representing by
far the bulk of the primary sector, was heavily hit
by falling commodity prices and declining demand.
Manufacturing industries that are closely linked
upstream to extractive activity were exposed to
similar adverse industrial dynamics, resulting in
a comparably poor FDI performance. In fact, the
three industries in which FDI declined most in
2012 were mining, quarrying and petroleum and
two manufacturing industries (metals and metal
products and coke, petroleum products and
nuclear fuel) that process extractive material.
Together, the three industries accounted for almost
50 per cent of the overall decrease in the value of
announced greenfield projects (corresponding to
some $130 billion).
The FDI contraction was particularly dramatic in
developing economies, where the already unstable
market environment was further complicated by
the changes of the investment climate in some
countries rich in natural resources.
On the M&A side, the FDI picture confirms a
pessimistic investment outlook for the extractive
Figure I.11. Ten industries with the largest declines in greenfield FDI projects in 2012(Billions of dollars and per cent)
302
12
15
19
21
21
26
26
33
46
51
All
Rubber and plastic products
Business services
Electrical and electronic equipment
Motor vehicles and other transport equipment
Chemicals and chemical products excl. pharmaceuticals
Transport, storage and communications
Electricity, gas and water
Metals and metal products
Coke, petroleum products and nuclear fuel
Mining, quarrying and petroleum
2 381
154
94
251
251
175
26
116
135
71
76
$ billion Per cent Number Per cent
-67% -46%-69% -49%
-53% -27%-28% -30%-35% -3%-39% -28%-25% -22%
-41% -22%
-21% -3%-48% -32%
-33% -15%
Loss in value, 2012 vs 2011 Loss in number of projects, 2012 vs 2011
Source: UNCTAD, based on information from the Financial Times Ltd, fDi Markets (www.fDimarkets.com).
Figure I.10. Distribution of the value of greenfield investment projects, by sector, 2003–2012
(Per cent)
Source: UNCTAD based on information from the Financial
Times Ltd, fDi Markets (www.fDimarkets.com).
0
20
40
60
80
100
2003 2004 2005 2006 2007 2008 2009 2010 2011 2012
Primary Manufacturing Services
to the dominance of services activity in FDI was
reinforced, though its amount declined. Also,
growing marginalization trend of the primary sector
seems to have picked up, with the sector’s share
in announced greenfield projects declining to some
4 per cent, corresponding to half of its 2011 share
and less than one fourth of its 2003 share.
Although the impact of the crisis was widespread,
across the spectrum of productive activities, clear
World Investment Report 2013: Global Value Chains: Investment and Trade for Development10
industry, characterized by a prevalence of
divestments in developing economies as
highlighted by the negative value of M&A flows.
Specific examples include the divestments of Anglo
American PLC of part of its activities in copper ore
mining in Chile, for $2.9 billion, and in other metal
ores in South Africa and Zimbabwe, for a total of
$0.7 billion. Another example is the sale by BG
Group PLC of a majority stake in the Companhia de
Gas de São Paulo in Brazil, valued at $1.7 billion.
Other manufacturing industries responded
differently to the downturn. Consumer industries,
such as motor vehicles and other transport
equipment and electrical and electronic equipment,
were among those most affected. Because
of their highly cyclical nature, they are more
affected by weak global demand than are other
manufacturing industries. Two factors contributed
to depressed demand: the crisis in the Eurozone
and the deceleration of growth in emerging market
economies, in particular China and India. As weak
demand squeezed industry margins, companies
increasingly resorted to investment cuts in an
attempt to mop up large overcapacity, restore
financial strength and save cash. However, some
less cyclical manufacturing activities, such as food,
beverages and tobacco and pharmaceuticals,
managed to limit FDI losses.
Industries in the services sector were more resilient
than other industries. For example, business
services and transport, storage and communication
managed to preserve their volume of projects
despite significant reductions in announced
investment value owing to the smaller sizes of
individual projects. This shows that international
companies were still actively seeking opportunities
to expand their service activities, especially into
developing countries, though with less aggressive
investment operations than in 2011. The decrease
in electricity, gas and water was confined almost
entirely to developed economies, where it reflects
the declining demand caused by the current crisis.
On a positive note, for the first time since the onset
of the crisis in 2008 the construction industry
registered an increase in both the value and the
number of FDI projects, raising hopes for a more
structural recovery.
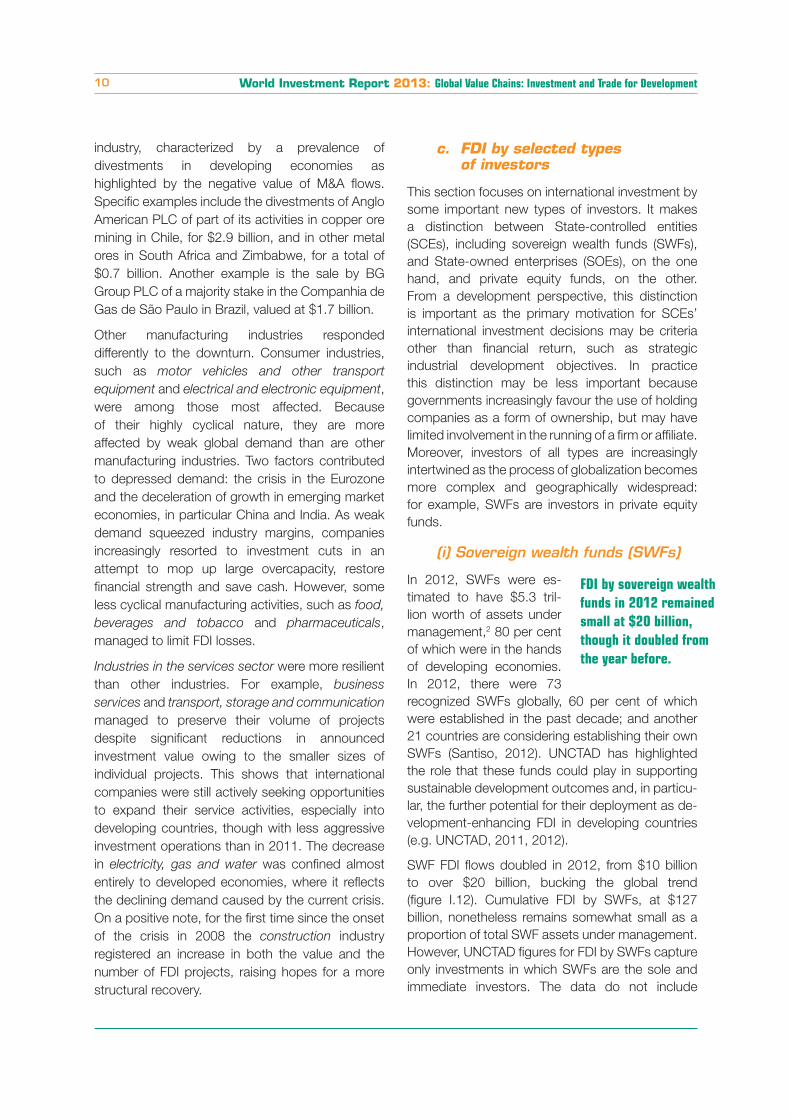
c. FDI by selected types of investors
This section focuses on international investment by
some important new types of investors. It makes
a distinction between State-controlled entities
(SCEs), including sovereign wealth funds (SWFs),
and State-owned enterprises (SOEs), on the one
hand, and private equity funds, on the other.
From a development perspective, this distinction
is important as the primary motivation for SCEs’
international investment decisions may be criteria
other than financial return, such as strategic
industrial development objectives. In practice
this distinction may be less important because
governments increasingly favour the use of holding
companies as a form of ownership, but may have
limited involvement in the running of a firm or affiliate.
Moreover, investors of all types are increasingly
intertwined as the process of globalization becomes
more complex and geographically widespread:
for example, SWFs are investors in private equity
funds.
(i) Sovereign wealth funds (SWFs)
In 2012, SWFs were es-
timated to have $5.3 tril-
lion worth of assets under
management,2 80 per cent
of which were in the hands
of developing economies.
In 2012, there were 73
recognized SWFs globally, 60 per cent of which
were established in the past decade; and another
21 countries are considering establishing their own
SWFs (Santiso, 2012). UNCTAD has highlighted
the role that these funds could play in supporting
sustainable development outcomes and, in particu-
lar, the further potential for their deployment as de-
velopment-enhancing FDI in developing countries
(e.g. UNCTAD, 2011, 2012).
SWF FDI flows doubled in 2012, from $10 billion
to over $20 billion, bucking the global trend
(figure I.12). Cumulative FDI by SWFs, at $127
billion, nonetheless remains somewhat small as a
proportion of total SWF assets under management.
However, UNCTAD figures for FDI by SWFs capture
only investments in which SWFs are the sole and
immediate investors. The data do not include
FDI by sovereign wealth
funds in 2012 remained
small at $20 billion,
though it doubled from
the year before.

CHAPTER I Global Investment Trends 11
investments by other entities established by SWFs
or those made jointly with other investors. It is likely
that total SWF FDI is in fact higher than the figure
above suggests.
During the period 2003–2012, cross-border M&As
accounted for 89 per cent of SWF FDI, reflecting their
position as strategic investment funds, in contrast
to the bulk of global FDI, which is invested through
greenfield projects. Strategically, the majority of
SWF investment through FDI targets the services
sector (70 per cent), and in particular finance, real
estate, construction and utilities. Finance remains
the most popular industry for SWF investment,
attracting over $21 billion in cumulative flows over
the period 2003–2012 (figure I.13). Following the
large jump in investment by SWFs in the utilities
industries in 2011 (electricity, gas and water), the
trend continued in 2012, with cumulative flows
increasing by 26 per cent. A similar story can be
seen in real estate, where cumulative flows leapt
by 44 per cent between 2011 and 2012. Despite
attracting lower levels of FDI in absolute terms, the
transport, storage and communications industries
experienced a 81 per cent jump in flows from 2011
to 2012, from $6 billion to $11 billion. These trends
Figure I.13. FDI by SWFs, cumulative value, by region and by sector/industry, 2012(Per cent)
Transition economies 2%
Developed economies
Developing economies
Latin Americaand the
Caribbean 3.4%
South Asia+ East and South-East
Asia
Africa 5.4% West Asia
2%
United States14.3% Other
19.8%
European Union42.9%
10.4%
Services
PrimaryElectricity, gas and water8.8%
Construction2.6%
Manufacturing
Others0.1%
Motor vehicles8.7%
Others6.2%
Coke andpetroleumproducts
4.7%
Mining10.1%Real estate
15.4%
Finance16.8%
Others26.8%
Cumulative FDI Value: $127.4 billion
By region/country By sector/industry
Source: UNCTAD FDI-TNC-GVC Information System, cross-border M&A database for M&As and information from the Financial
Times Ltd, fDi Markets (www.fDimarkets.com) for greenfield projects.
Figure I.12. Annual and cumulative value of FDI by SWFs, 2000–2012(Billions of dollars)
0
20
40
60
80
100
120
140
0
5
10
15
20
25
30
2000
2001
2002
2003
2004
2005
2006
2007
2008
2009
2010
2011
2012
Annual flows (left scale)Cumulative flows (right scale)
Source: UNCTAD FDI-TNC-GVC Information System, cross-
border M&A database for M&As and information from
the Financial Times Ltd, fDi Markets (www.fDimarkets.
com) for greenfield projects.
Note: Data include value of flows for both cross-border M&As
and greenfield FDI projects and only investments by
SWFs which are the sole and immediate investors. Data
do not include investments made by entities established
by SWFs or those made jointly with other investors.
In 2003–2012, cross-border M&As accounted for 89
per cent of total.

World Investment Report 2013: Global Value Chains: Investment and Trade for Development12
in non-finance sectors may reflect the changing
priorities of SWFs in terms of their investment
strategies.
With regard to geographical distribution, the
majority of SWF FDI is in developed economies,
which received more than 70 per cent of inflows
in 2012. Of this figure, Europe accounts for nearly
two thirds, but the United States experienced a
noticeable jump (39 per cent) in inward SWF FDI.
Although cumulative SWF FDI to developing and
transition countries increased from 2011 to 2012,
the share of these countries in global SWF FDI
actually fell, from 25 per cent to 23 per cent. This
share has been in constant decline since its high
of over 30 per cent in 2008, which may suggest
changing SWF investment strategies, in terms of
the geographical orientation of their FDI.
In the face of the multitude of complex and
unpredictable challenges confronting all countries,
long-term financial planning and investment
(including overseas) provide countries with a
necessary form of self-insurance. Some of the
strategic concerns that a government may seek to
address through a SWF include correcting currency
fluctuation and maintaining macroeconomic stability
(as in the case of Brazil’s SWF); addressing long-
term population changes such as aging; hedging
against the existential threat of climate change (one
of the reasons that the Government of the Maldives
established its SWF); and intergenerational equity and
preserving current revenues for future generations
(e.g. Norway).
Distinct objectives, motives and approaches of
individual SWFs may also have a bearing on their
investment decisions in terms of sector, asset
class and geographical scope, and different SWFs
deploy different investment strategies accordingly.
Looking ahead, the increase in the number of
countries seeking to establish SWFs means that
SWF investments, including FDI, are almost certain
to increase in the near future. Although several
developed countries, including Italy and France,
have established SWFs in the past few years,
the main home countries of sovereign investment
are likely to remain in emerging markets in the
global South. However, it is still not clear how
SWF investment potential will be realized as it will
probably vary by country and fund.
(ii) State-owned enterprises (SOEs)
The trend towards liber-
alization and privatization
in the past 30 years has
been accompanied by the
rising importance of the
State in foreign ownership.
This is true for SWFs and
also for SOEs, which are
increasingly international-
izing and becoming lead-
ing players in international
investment. Although the
number of SOEs has been shrinking, their market
power has been increasing, in part due to their
consolidation into national champions across a
range of strategic industries.3 There are now 18
SOEs among the world’s top 100 TNCs. The Chi-
nese State is the largest shareholder in that coun-
try’s 150 biggest firms, and State companies make
up 80 per cent of the stock market value; in the
Russian Federation, they account for 62 per cent
and in Brazil, 38 per cent. With this increasing
market power and financial strength, many SOEs
are expanding abroad; indeed, their share of ac-
quisitions in total FDI flows is much greater than
the share of SOEs in the total number of TNCs
(UNCTAD, 2011).
State-owned TNCs (SO-TNCs) remained important
international investors. Their number increased
from 659 in 2010 to 845 in 2012, and they account
for one tenth of global FDI outflows (figure I.14).
Overall, however, FDI by SO-TNCs fell by 23 per
cent, from $189 billion to $145 billion.
Looking at FDI projects (including cross-border M&A
purchases and greenfield investments), SO-TNCs –
unlike SWFs – have historically preferred greenfield
investment as their dominant mode of entry. Since
2009, however, the value of greenfield projects has
been declining significantly relative to the value of
M&As. In 2012, greenfield investment appeared
to collapse by a further 40 per cent to $75 billion,
or roughly half of all SO-TNC investment. This is
in direct contrast to global greenfield investment,
which still represents two thirds of all FDI flows
despite falling to its lowest level ever in 2012. This
trend can be accounted for primarily by SOEs based
in developed countries, whose new investments
have been seriously affected by the financial crisis.
State-owned enterprises
slowly continued their
international expansion,
with the value of their
cross-border M&As
increasing by 8 per cent
in 2012, mostly led
by developing country
firms in pursuit of
strategic assets.

CHAPTER I Global Investment Trends 13
The absolute value of M&As by SO-TNCs increased
by 8 per cent from 2011 to 2012, mirroring the
overall rise in M&A activity by TNCs from developing
countries, where the majority of global SO-TNC
M&As originate. This perhaps also reveals the
strategic nature of SOE investments abroad, which
seek to acquire technology, intellectual property or
brand names, as well as natural resources.
SOEs continue to internationalize, as the number
of SO-TNCs has increased significantly in the past
two years, to 845 in 2012.4 Their composition is
changing. The relative share of developing and
transition country SO-TNCs in the total number of
SOEs investing abroad also rose, from 53 per cent
of all major SOE international investors in 2010 to
over 60 per cent in 2012. Notable home countries
include Malaysia, India and the Russian Federation,
where the number of SOEs investing abroad has
more than doubled since 2010.
The distribution of SO-TNC investment by sector
and industry has not changed much in the past
two years: the vast majority of SOEs investing
abroad (about 70 per cent of firms) are in the
services sector – in particular, financial services,
transportation and communications, and utilities
(electricity, gas and water). In 2012, the international
investment strategies of developed and developing
country SO-TNCS continued to reflect the sectors
in which their principal SOEs are involved: the most
active SO-TNCs from developed countries tend to
be utilities; in developing economies, they are more
likely to be involved in extractive industries.
(iii) Private equity funds
Although private equity is
considered separately in
this section, institutional
investors, like government-
owned pension funds and
SWFs, also participate in private equity funds, which
makes public-private distinctions less clear cut.
Following the crash in private equity investment
after the global economic crisis, there was a small
recovery in flows from 2009 to 2011. This recovery
appears to have come to an end in 2012, with net
private equity FDI falling by 34 per cent, from $77
billion to $51 billion (table I.2). At the same time,
divestment of foreign affiliates by private equity
funds increased, illustrated by the growing ratio of
net to gross deals, which is the largest on record
for which data are available (table I.2). However,
while the value of deals fell, the net number of deals
involving private equity and hedge funds stood at
its second highest level (and the gross number at
an all-time high), increasing by 22 per cent from
2011. The period of the mega-deal appears over,
but the proliferation in the number of deals last
year demonstrates that private equity is still viable,
despite being constrained by a less favourable
credit environment since the global crisis.
Debt-driven private equity deals – leveraged
buy-outs (LBOs) – which peaked just before
the economic crisis in 2007 will continue to face
refinancing problems in 2014. The favourable
credit conditions that characterized pre-crisis debt
markets helped fuel the increase in private equity,
and in particular highly leveraged acquisitions;
post-crisis, credit conditions have become less
favourable, partly explaining the fall in the value
of LBOs.
A look at the sectoral distribution of cross-border
M&As by private equity firms shows a preference for
Figure I.14. Value of FDI projectsa by SO-TNCsb and share in total FDI outflows, 2005–2012
(Billions of dollars and per cent)
Source: UNCTAD FDI-TNC-GVC Information System, cross-
border M&A database for M&As and information from
the Financial Times Ltd, fDi Markets (www.fDimarkets.
com) for greenfield projects.
a Includes both greenfield investments and cross-border
M&As. The value of the former dataset refers to estimated
amounts of capital investment of the project.b Data cover only SO-TNCs where the state has a 50 per
cent or more share.
Greenfield investments (announced value)M&AsShare in global FDI outflows
0
5
10
15
20
25
0
50
100
150
200
250
300
350
400
2005 2006 2007 2008 2009 2010 2011 2012%
$ b
illio
n
Private equity firms engaged
in a growing number of M&A
deals, though their net FDI
fell by 34 per cent.
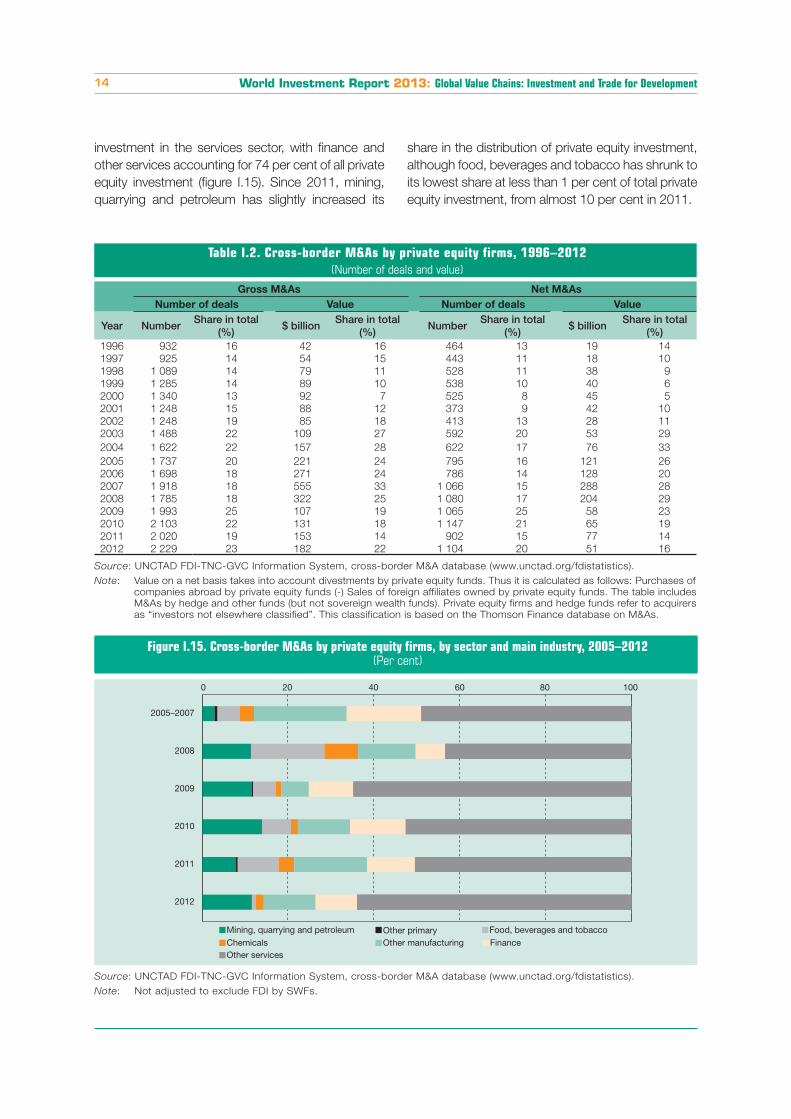
World Investment Report 2013: Global Value Chains: Investment and Trade for Development14
investment in the services sector, with finance and
other services accounting for 74 per cent of all private
equity investment (figure I.15). Since 2011, mining,
quarrying and petroleum has slightly increased its
share in the distribution of private equity investment,
although food, beverages and tobacco has shrunk to
its lowest share at less than 1 per cent of total private
equity investment, from almost 10 per cent in 2011.
Table I.2. Cross-border M&As by private equity firms, 1996–2012(Number of deals and value)
Gross M&As Net M&As
Number of deals Value Number of deals Value
Year NumberShare in total
(%)$ billion
Share in total (%)
NumberShare in total
(%)$ billion
Share in total (%)
1996 932 16 42 16 464 13 19 14
1997 925 14 54 15 443 11 18 10
1998 1 089 14 79 11 528 11 38 9
1999 1 285 14 89 10 538 10 40 6
2000 1 340 13 92 7 525 8 45 5
2001 1 248 15 88 12 373 9 42 10
2002 1 248 19 85 18 413 13 28 11
2003 1 488 22 109 27 592 20 53 29
2004 1 622 22 157 28 622 17 76 33
2005 1 737 20 221 24 795 16 121 26
2006 1 698 18 271 24 786 14 128 20
2007 1 918 18 555 33 1 066 15 288 28
2008 1 785 18 322 25 1 080 17 204 29
2009 1 993 25 107 19 1 065 25 58 23
2010 2 103 22 131 18 1 147 21 65 19
2011 2 020 19 153 14 902 15 77 14
2012 2 229 23 182 22 1 104 20 51 16
Source: UNCTAD FDI-TNC-GVC Information System, cross-border M&A database (www.unctad.org/fdistatistics).
Note: Value on a net basis takes into account divestments by private equity funds. Thus it is calculated as follows: Purchases of
companies abroad by private equity funds (-) Sales of foreign affiliates owned by private equity funds. The table includes
M&As by hedge and other funds (but not sovereign wealth funds). Private equity firms and hedge funds refer to acquirers
as “investors not elsewhere classified”. This classification is based on the Thomson Finance database on M&As.
Figure I.15. Cross-border M&As by private equity firms, by sector and main industry, 2005–2012(Per cent)
2012
0 20 40 60 80 100
2011
2010
2009
2008
2005–2007
Mining, quarrying and petroleum Other primary Food, beverages and tobaccoChemicals Other manufacturing FinanceOther services
Source: UNCTAD FDI-TNC-GVC Information System, cross-border M&A database (www.unctad.org/fdistatistics).
Note: Not adjusted to exclude FDI by SWFs.
CHAPTER I Global Investment Trends 15
d. FDI and offshore finance
Since the beginning of
2008, driven in large part
by increased pressure on
public finances as a result
of the financial crisis, the in-
ternational community has
renewed and strength-
ened efforts to reduce tax
avoidance and increase
transparency in international
financial flows. For example,
improving tax transparency
and promoting information exchange have been key
features of deliberations at G-20 summits since their
inception. Significant pressure has been put on tax
havens by the international community, on individu-
als and firms by governments, and on multinationals
by activist groups to limit their facilitation or use of tax
avoidance schemes.
Offshore finance in FDI flows and stocks:
macro trends
Offshore finance mechanisms in FDI include mainly
(i) offshore financial centres (OFCs) or tax havens5
and (ii) special purpose entities (SPEs). SPEs are
foreign affiliates that are established for a specific
purpose (e.g. administration, management of
foreign exchange risk, facilitation of financing of
investment) or a specific structure (e.g. holding
companies). They tend to be established in low-
tax countries or in countries that provide specific
tax benefits for SPEs. They may not conduct
any economic activity of their own and have few
employees and few non-financial assets. Both
OFCs and SPEs are used to channel funds to and
from third countries.
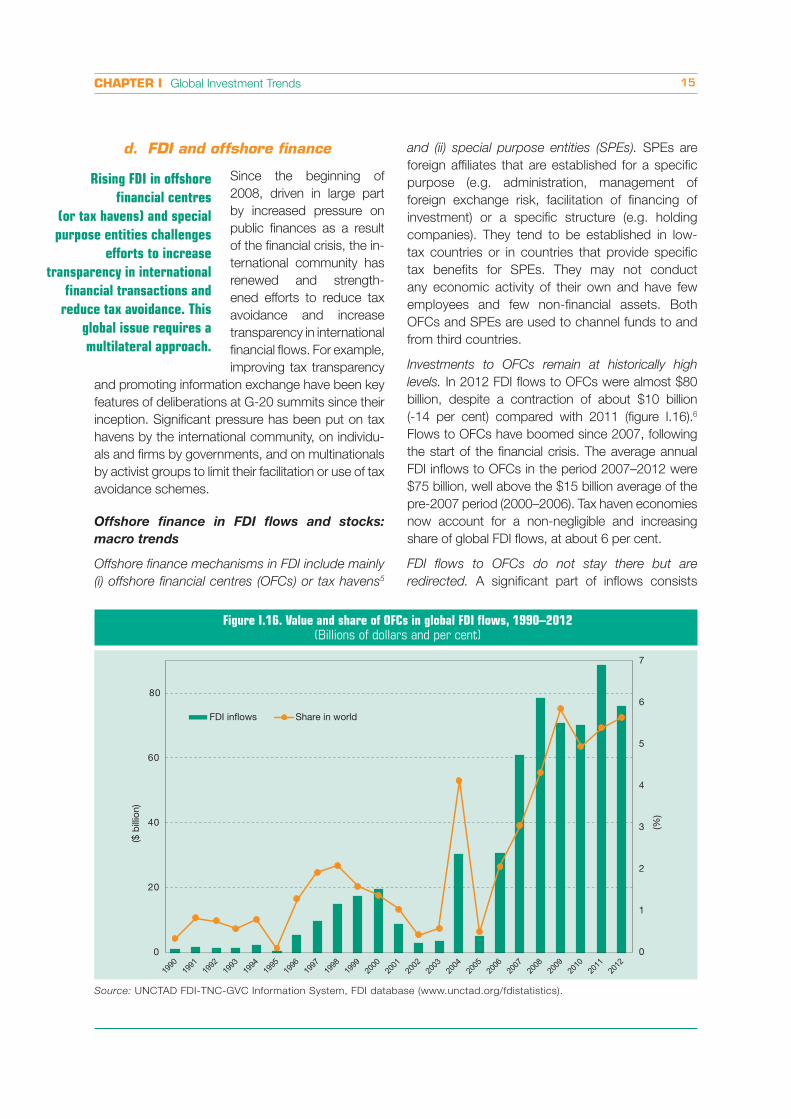
Investments to OFCs remain at historically high
levels. In 2012 FDI flows to OFCs were almost $80
billion, despite a contraction of about $10 billion
(-14 per cent) compared with 2011 (figure I.16).6
Flows to OFCs have boomed since 2007, following
the start of the financial crisis. The average annual
FDI inflows to OFCs in the period 2007–2012 were
$75 billion, well above the $15 billion average of the
pre-2007 period (2000–2006). Tax haven economies
now account for a non-negligible and increasing
share of global FDI flows, at about 6 per cent.
FDI flows to OFCs do not stay there but are
redirected. A significant part of inflows consists
Rising FDI in offshore
financial centres
(or tax havens) and special
purpose entities challenges
efforts to increase
transparency in international
financial transactions and
reduce tax avoidance. This
global issue requires a
multilateral approach.
Figure I.16. Value and share of OFCs in global FDI flows, 1990–2012 (Billions of dollars and per cent)
0
1
2
3
4
5
6
7
0
20
40
60
80
(%)
($ b
illio
n)
FDI inflows Share in world
Source: UNCTAD FDI-TNC-GVC Information System, FDI database (www.unctad.org/fdistatistics).
World Investment Report 2013: Global Value Chains: Investment and Trade for Development16
Figure I.17. FDI stock in financial holding companies, selected economies
Economy/Reference
year
Share in total, per cent
OutwardInward
Hungary
Portugal
United States
Hong Kong, China
Singapore
Cyprus
Denmark
France
Luxembourg
Netherlands
20062011
19972010
19901998
19952011
19902010
20042009
19962011
19992010
20042011
19992011
92
93
68
83
22
67
33
63
2
41
21
35
0
33
1
26
4
12
1
1
N/A
94
94
67
77
N/A
76
78
86
3
36
N/A
1
31
0
22
2
4
15
22
Source: UNCTAD FDI-TNC-GVC Information System, FDI database (www.unctad.org/fdistatistics).
Note: Data for Hong Kong (China) in 2011 refer to investment holdings, real estate and various business activities.
of “round–tripping” FDI to the original source
countries. For example, the top three destinations
of FDI flows from the Russian Federation – Cyprus,
the Netherlands and the British Virgin Islands –
coincide with the top three investors in the Russian
Federation (see also the discussion in chapter
II.A.6). Such flows are more akin to domestic
investments disguised as FDI. The bulk of inflows in
OFCs consists of FDI in transit that is redirected to
other countries.
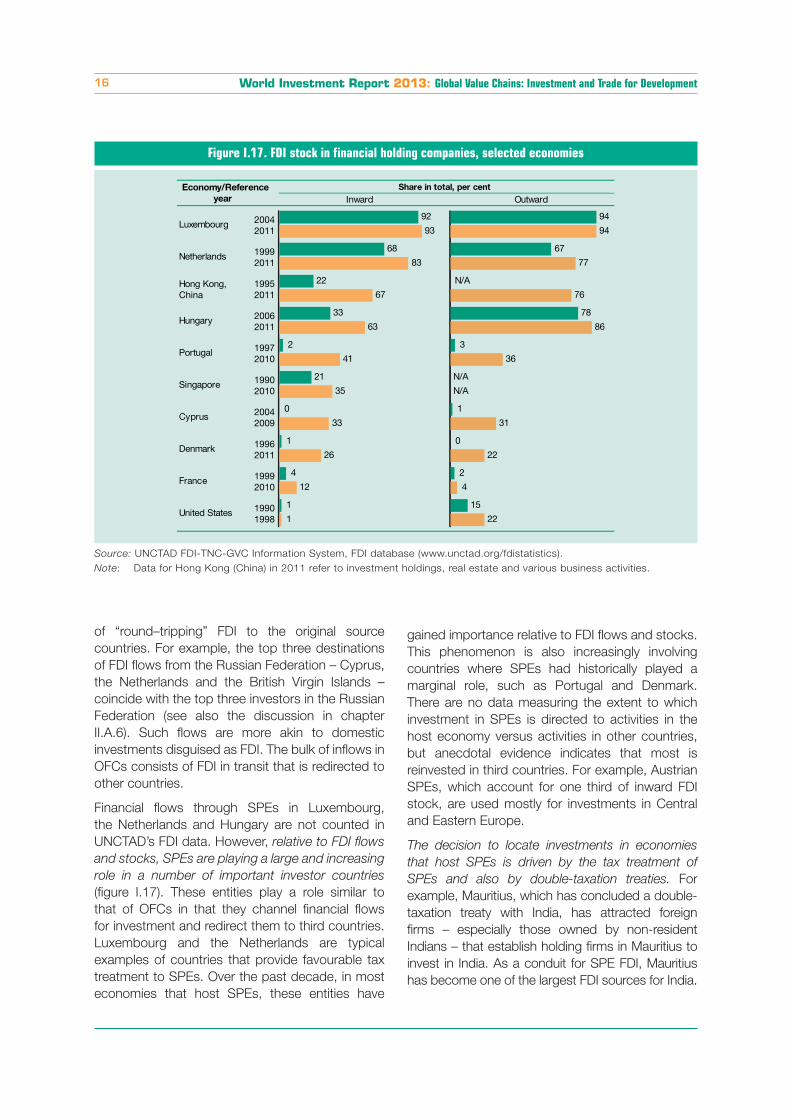
Financial flows through SPEs in Luxembourg,
the Netherlands and Hungary are not counted in
UNCTAD’s FDI data. However, relative to FDI flows
and stocks, SPEs are playing a large and increasing
role in a number of important investor countries
(figure I.17). These entities play a role similar to
that of OFCs in that they channel financial flows
for investment and redirect them to third countries.
Luxembourg and the Netherlands are typical
examples of countries that provide favourable tax
treatment to SPEs. Over the past decade, in most
economies that host SPEs, these entities have
gained importance relative to FDI flows and stocks.
This phenomenon is also increasingly involving
countries where SPEs had historically played a
marginal role, such as Portugal and Denmark.
There are no data measuring the extent to which
investment in SPEs is directed to activities in the
host economy versus activities in other countries,
but anecdotal evidence indicates that most is
reinvested in third countries. For example, Austrian
SPEs, which account for one third of inward FDI
stock, are used mostly for investments in Central
and Eastern Europe.
The decision to locate investments in economies
that host SPEs is driven by the tax treatment of
SPEs and also by double-taxation treaties. For
example, Mauritius, which has concluded a double-
taxation treaty with India, has attracted foreign
firms – especially those owned by non-resident
Indians – that establish holding firms in Mauritius to
invest in India. As a conduit for SPE FDI, Mauritius
has become one of the largest FDI sources for India.
CHAPTER I Global Investment Trends 17
Although tax considerations are the main driver
for the use of OFCs and SPEs, there are other
motivations, e.g.:
�� They can be used for tax-neutral solutions,
for example, for joint venture partners from
countries with different tax regimes.
�� They can be used for legal neutrality for share-
holders dispersed across different jurisdictions.
�� They can help firms from countries with weak
institutions to set up an international business
more easily and to gain access to international
capital markets and legal systems.
International efforts to reduce tax avoidance
and increase transparency, and their effects
Concrete efforts to combat tax avoidance
in international financial transactions, mostly
promoted by the OECD, have generally focused on
OFCs. However, FDI flows to OFCs do not appear
to be decreasing, mainly for two reasons:
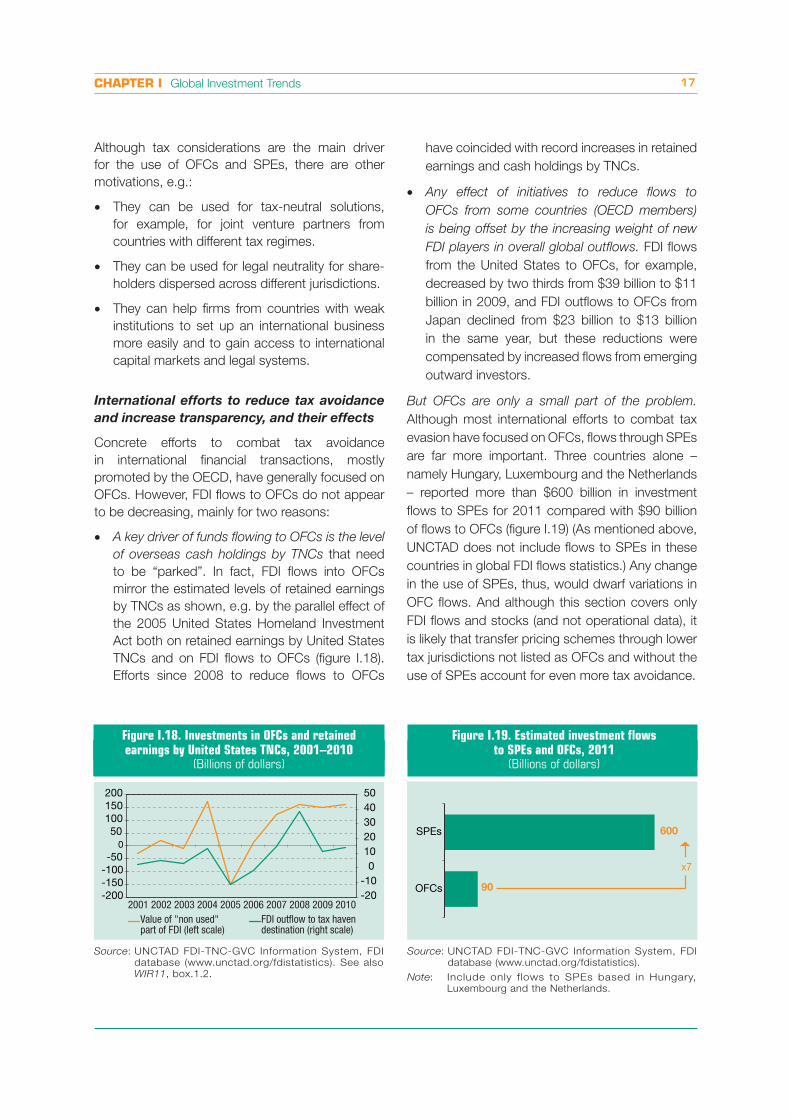
�� A key driver of funds flowing to OFCs is the level
of overseas cash holdings by TNCs that need
to be “parked”. In fact, FDI flows into OFCs
mirror the estimated levels of retained earnings
by TNCs as shown, e.g. by the parallel effect of
the 2005 United States Homeland Investment
Act both on retained earnings by United States
TNCs and on FDI flows to OFCs (figure I.18).
Efforts since 2008 to reduce flows to OFCs
have coincided with record increases in retained
earnings and cash holdings by TNCs.
�� Any effect of initiatives to reduce flows to
OFCs from some countries (OECD members)
is being offset by the increasing weight of new
FDI players in overall global outflows. FDI flows
from the United States to OFCs, for example,
decreased by two thirds from $39 billion to $11
billion in 2009, and FDI outflows to OFCs from
Japan declined from $23 billion to $13 billion
in the same year, but these reductions were
compensated by increased flows from emerging
outward investors.
But OFCs are only a small part of the problem.
Although most international efforts to combat tax
evasion have focused on OFCs, flows through SPEs
are far more important. Three countries alone –
namely Hungary, Luxembourg and the Netherlands
– reported more than $600 billion in investment
flows to SPEs for 2011 compared with $90 billion
of flows to OFCs (figure I.19) (As mentioned above,
UNCTAD does not include flows to SPEs in these
countries in global FDI flows statistics.) Any change
in the use of SPEs, thus, would dwarf variations in
OFC flows. And although this section covers only
FDI flows and stocks (and not operational data), it
is likely that transfer pricing schemes through lower
tax jurisdictions not listed as OFCs and without the
use of SPEs account for even more tax avoidance.
-20-10
01020304050
-200-150-100-50
050
100150200
2001 2002 2003 2004 2005 2006 2007 2008 2009 2010Value of "non used" part of FDI (left scale)
FDI outflow to tax haven destination (right scale)
Figure I.18. Investments in OFCs and retained earnings by United States TNCs, 2001–2010
(Billions of dollars)
Source: UNCTAD FDI-TNC-GVC Information System, FDI
database (www.unctad.org/fdistatistics). See also
WIR11, box.1.2.
Figure I.19. Estimated investment flows to SPEs and OFCs, 2011
(Billions of dollars)
90
600
OFCs
SPEs
x7
Source: UNCTAD FDI-TNC-GVC Information System, FDI
database (www.unctad.org/fdistatistics).
Note: Include only flows to SPEs based in Hungary,
Luxembourg and the Netherlands.

World Investment Report 2013: Global Value Chains: Investment and Trade for Development18
The way forward: policy considerations
Possible policy responses are complex, but a
number of observations can be made:
�� Tackling OFCs alone is clearly not enough, and
is not addressing the main problem.
�� Engaging emerging new outward FDI players is a
must. An assessment of the role of new outward
investors should take into account that their use
of OFCs is often not only for tax avoidance but
for other potential benefits they cannot obtain
in their home economies (e.g. easy company
set-up, trade policy advantages, international
investment agreements). Also, their relative
use of sophisticated alternative tax avoidance
mechanisms and SPEs is lower.
�� Tax avoidance and transparency in international
financial transactions are global issues that
require an intensified multilateral approach.
�� Ultimately, moves to combat tax avoidance
through OFCs and SPEs must go hand in
hand with a discussion of corporate tax rate
differentials between countries, the application
of extraterritorial tax regimes, and the utility
of triggering tax liabilities upon repatriation of
earnings. Without parallel action on those fronts,
efforts to reduce tax avoidance through OFCs
and SPEs remain akin to swimming against
the tide. Such a discussion could also include
transfer pricing mechanisms beyond OFCs and
SPEs, including radical solutions to distribute
tax revenues fairly across the operations of
TNCs based on real value added produced (e.g.
based on a formula including sales, assets and
employees, in a unitary approach).
�� Policymakers could have a useful discussion
on a list of “acceptable” or “benign” non-tax
drivers of use of OFCs (and SPEs). That would
help focus any future measures on combating
the malign aspects of tax avoidance and lack of
transparency.
�� Finally, investment flows to and from OFCs and
SPEs requires attention from policymakers, and
monitoring such investment flows is important.
International organizations recommend that
the data-compiling countries collect detailed
information on transactions by SPEs and make
it available separately from traditional FDI data.
However, data remain scarce and the visibility
of sources and destinations of FDI funds is
marginal. Further research will be helpful in
improving transparency on the issue.
2. Global FDI prospects in 2013–2015
a. General FDI prospects
FDI flows in 2013 are
expected to remain close
to the 2012 level, with
an upper range of $1.45
trillion. As investors regain
confidence in the medium
term, flows are expected
to reach levels of $1.6
trillion in 2014 and $1.8
trillion in 2015 (figure
I.20). This scenario is based on various leading
indicators, as well as the results of UNCTAD’s World
Investment Prospects Survey 2013–2015 (WIPS),
an econometric model of forecasting FDI inflows
(WIR11), and data for the first four months of 2013
for cross-border M&As and greenfield investment
values.
Responses to this year’s WIPS (box I.2) support
this scenario. According to this year’s WIPS one
half of all respondents remain neutral about the
global investment outlook for 2013. However, their
expectations for 2014 and 2015 improve sharply
(figure I.21). When asked about their intended FDI
expenditures, half of the respondents forecast an
increase over 2012 levels in each of the next three
years. Among the factors positively affecting FDI
over the next three years, the two mentioned most
were the state of the economy in the BRICS and
the United States.
Similarly, the econometric model shows that FDI
flows in 2013 are projected to remain almost at the
same level or increase slightly at best, reaching their
pre-crisis level. Several international organizations
and research institutes forecast slightly higher FDI
in 2013. For example, the IMF’s current World
Economic Outlook estimated a moderate increase
in net FDI inflows in emerging economies to $477
billion in 2013 from $446 billion in 2012 (IMF, 2013).
Estimates of net FDI inflows from the Institute of
Global FDI flows in
2013 are expected to
remain at the 2012 level.
As investors regain
confidence, flows will
rise in 2014–2015.
However, significant risks
remain.

CHAPTER I Global Investment Trends 19
International Finance for 30 emerging economies
are $517 billion in 2013 compared with $499 billion
in 2012 (IIF, 2013).
Firm-level factors also support the UNCTAD forecast.
Annual TNC profits in 2012 were lower than in 2011
but remained at high levels (figure I.22). There is an
indication that in the first quarter of 2013, the level
of cash holdings of the largest TNCs has been lower
than that in the same period last year, as companies
are using part of their available cash to acquire
companies abroad. Data on greenfield investment
and cross-border M&As in the first few months of
2013 have not indicated an upward trend. This may
be translated into higher levels of investment in the
near future.
However, significant risks to this growth scenario
remain. Factors such as structural weaknesses
in the global financial system, the possible
deterioration of the macroeconomic environment,
and significant policy uncertainty in areas crucial for
investor confidence might lead to a further decline
in FDI flows.
When asked about the principal factors affecting
FDI flows in the medium term, TNCs in the survey
put the state of the EU economy at the top of their
worries, followed closely by political factors, such
as the adoption of austerity policies, the rise of
trade protectionism, and sovereign debt concerns.
Figure I.20. Global FDI flows, 2004–2012, and projections, 2013–2015(Billions of dollars)
500
1 000
1 500
2 000
2004 2005 2006 2007 2008 2009 2010 2011 2012 2013 2014 2015
Source: UNCTAD FDI/TNC database (http://www.unctad.org/fdistatistics).
21
4054
50
53
43
29
8 4
2013 2014 2015
Optimistic and very optimisticNeutralPessimistic and very pessimistic
Figure I.21. TNCs’ perception of the global investment climate, 2013–2015
(Percentage of respondents)
Source: UNCTAD survey.
Note: Based on 159 company responses.

World Investment Report 2013: Global Value Chains: Investment and Trade for Development20
Box I.2. World Investment Prospects Survey, 2013–2015: methodology and results
The aim of the WIPS is to provide insights into the medium-term prospects for FDI flows. This year’s survey was
directed to executives among the largest 5,000 non-financial TNCs and professionals working in 245 national and sub-
national investment promotion agencies (IPAs). Questions for TNC executives were designed to capture their views on
the global investment climate, their companies’ expected changes in FDI expenditures and internationalization levels,
and the importance their companies give to various regions and countries. IPAs were asked about their views on the
global investment climate and which investor countries and industries were most promising in terms of inward FDI.
This year’s survey results are based on 159 and 64 validated responses by TNCs and by IPAs, respectively, collected
by e-mail and through a dedicated website between February and April 2013. TNCs in developed economies
accounted for 79 per cent of responses, while TNCs from developing and transition countries represented 21 per
cent of responses. In terms of sectoral distribution, 66 per cent of respondent TNCs were classified as operating in
the manufacturing sector, 27 per cent in the services sector, and 7 per cent in the primary sector. For IPAs, 69 per
cent of respondents were located in developing or transition economies and 31 per cent were located in developed
economies.
Source: UNCTAD.
0
1
2
3
4
5
6
7
8
0
200
400
600
800
1 000
1 200
1 400
1 600
Profits Profitability
$ b
illio
n
%
Figure I.22. Profitability and profit levels of TNCs, 2000–2012
(Billions of dollars and per cent)
Source: UNCTAD, based on data from Thomson ONE.
Note: The number of TNCs covered in this calculation is 3,039.
Profitability is calculated as the ratio of net income to
total sales.
A number of countries have also implemented a
significant number of policies that regulate or restrict
investment, bringing the share of such measures
to a recent high, although investment liberalization
and promotion remained the dominant feature of
national investment policies (chapter III).
consultancy. African IPAs expect further investments
in the agriculture sector, while Latin American
b. FDI prospects by sector/industry
Reflecting the general
trend shown by the WIPS
survey, TNCs across all
major sectors are cautious
about the international
investment climate in 2013
but more optimistic in the
medium term. Short-term
FDI plans vary across
sectors and industries, with
respondents from some manufacturing industries
such as leather, stone, clay and glass products and
metals, as well as from transportation services and
metal mining indicating falling investments in the
short term. In contrast, more than half of the TNCs
active in the remaining manufacturing industries and
in the trade and other services industries already
foresee an increase in their FDI budgets in 2013.
By 2015, almost half of TNCs in all sectors expect
to see an increase in their FDI expenditures, in line
with their rising optimism for the global investment
environment.
On the host country side, the view from investment
promotion agencies (IPAs) for inward FDI differs by
region (figure I.23). IPAs in developed economies
anticipate good prospects for FDI in business
services, such as computer programming and
FDI expenditures are set to
increase, but short-term
concerns about the global
investment climate are
common across industries.
Certain manufacturing
industries face gloomy
short-term prospects.
CHAPTER I Global Investment Trends 21
exist, however, when comparing medium-term
prospects. In particular, less than 4 per cent of
developed-country TNCs expect their FDI budgets
to decline in 2015, compared with almost 12 per
cent of TNCs from developing countries. A possible
trend in the medium term therefore could be a shift
back towards developed-country TNCs as main
outward investors.
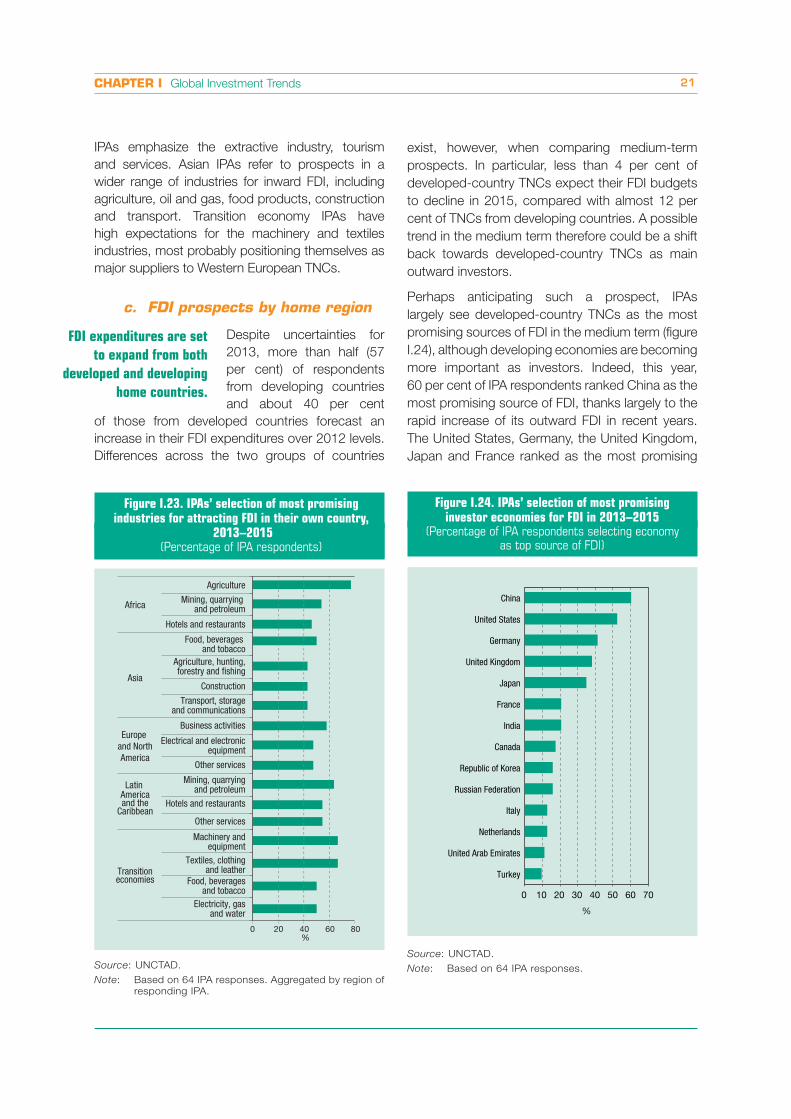
Perhaps anticipating such a prospect, IPAs
largely see developed-country TNCs as the most
promising sources of FDI in the medium term (figure
I.24), although developing economies are becoming
more important as investors. Indeed, this year,
60 per cent of IPA respondents ranked China as the
most promising source of FDI, thanks largely to the
rapid increase of its outward FDI in recent years.
The United States, Germany, the United Kingdom,
Japan and France ranked as the most promising
IPAs emphasize the extractive industry, tourism
and services. Asian IPAs refer to prospects in a
wider range of industries for inward FDI, including
agriculture, oil and gas, food products, construction
and transport. Transition economy IPAs have
high expectations for the machinery and textiles
industries, most probably positioning themselves as
major suppliers to Western European TNCs.
c. FDI prospects by home region
Despite uncertainties for
2013, more than half (57
per cent) of respondents
from developing countries
and about 40 per cent
of those from developed countries forecast an
increase in their FDI expenditures over 2012 levels.
Differences across the two groups of countries
Figure I.23. IPAs’ selection of most promising industries for attracting FDI in their own country,
2013–2015(Percentage of IPA respondents)
Source: UNCTAD.
Note: Based on 64 IPA responses. Aggregated by region of
responding IPA.
0 20 40 60 80
and theCaribbean
Transition
Africa
Asia
Europe and NorthAmerica
America
economies
Latin
%
Agriculture
Mining, quarrying and petroleum
Hotels and restaurants
Food, beverages and tobacco
Agriculture, hunting, forestry and fishing
Construction
Transport, storage and communications
Business activities
Electrical and electronic equipment
Other services
Mining, quarrying and petroleum
Hotels and restaurants
Other services
Machinery and equipment
Textiles, clothing and leather
Food, beverages and tobacco
Electricity, gas and water
Figure I.24. IPAs’ selection of most promising investor economies for FDI in 2013–2015
(Percentage of IPA respondents selecting economy as top source of FDI)
0 10 20 30 40 50 60 70
China
United States
Germany
United Kingdom
Japan
France
India
Canada
Republic of Korea
Russian Federation
Italy
Netherlands
United Arab Emirates
Turkey
%
Source: UNCTAD.
Note: Based on 64 IPA responses.
FDI expenditures are set
to expand from both
developed and developing
home countries.

World Investment Report 2013: Global Value Chains: Investment and Trade for Development22
developed-economy investors, underscoring
their continuing role in global FDI flows. India, the
Republic of Korea, the Russian Federation, the
United Arab Emirates and Turkey (for the first time)
are also seen as major developing country sources
of FDI, while Brazil fell out of the ranking, most likely
because of last year’s slower outflow activity.
d. FDI prospects by host region
For the medium term, IPAs
– regardless of location –
exhibited rising optimism
in terms of FDI inflows,
although those in developing
and transition economies were most optimistic. This
optimism is not unwarranted. TNCs that respond
to the survey have increasingly ranked developing
host regions as highly important. The ranking of the
top five host economies is the same as last year,
with China leading the list and cited by 46 per cent
of all respondents, followed closely by the United
States, cited by 45 per cent. Developing countries
make up four of the top five host economies (figure
I.25). Six of the top 10 prospective host countries
also come from the developing world, with Mexico
and Thailand appearing for the first time. Among
developed countries, Japan jumped three positions
largely because of reconstruction efforts after the
2011 tsunami, and recent expansionary monetary
policies have together increased the country’s
attractiveness for foreign investment in the medium
term. At the same time, Australia, the Russian
Federation and the United Kingdom slipped down
the rankings from last year’s survey, while Germany
gained two positions.
Figure I.25. TNCs’ top prospective host economies for 2013–2015(Percentage of respondents selecting economy as a top destination)
46
45
0 5 10 15 20 25 30 35
1 China (1)2 United States (2)
3 India (3)4 Indonesia (4)
5 Brazil (5)6 Germany (8)7 Mexico (12)
8 Thailand (12)9 United Kingdom (6)
10 Japan (13)11 Russian Federation (8)
11 Viet Nam (11)13 Australia (6)14 Poland (14)
15 South Africa (14)16 Canada (-)
16 France (19)16 Malaysia (19)
19 Hong Kong, China (-)19 Philippines (-)
19 Turkey (-)
(x) = 2012 ranking
Developing economies
Developed economies
Transition economies
Source: UNCTAD survey.
Note: Based on 159 company responses.
Developing economies
will continue to experience
strong FDI inflows in the
medium term.

CHAPTER I Global Investment Trends 23
1. Overall trends
International production
continues to expand, with
all indicators of foreign
affiliate activity increasing,
although at a slower
rate than in earlier years
(table I.3). Sales rose 7.4
per cent over 2011, continuing their recovery from
the lows during the crisis. Employment of foreign
affiliates rose by 5.7 per cent, reaching 72 million,
while exports of foreign affiliates remained relatively
stable in 2012 registering only a small increase of
0.6 per cent. Likewise, value added and assets of
foreign affiliates, increased slowly – by 5.5 and 4.3
per cent, respectively, over the previous year. This
state of affairs reflects weak economic conditions
around the world (section A.1.d). Sluggish
economic growth in developed countries affected
both developing and transition economies in 2012,
through a sharp deceleration in demand from key
advanced economies and the end of investment
booms in some major emerging market economies.
Global trends in international production are
reflected in the internationalization levels of the
world’s largest TNCs. Data for the top 100 TNCs,
mostly from developed economies, show that their
internationalization in 2012 slowed. Foreign sales
of the largest 100 TNCs in the world declined
2.1 per cent in 2012, while their domestic sales –
largely in developed economies – remained stable
(table I.4). Likewise, foreign employment and
foreign assets stagnated, while their domestic
employment and assets increased by 6.8 and 5 per
cent, respectively. These data reflect both a change
in strategy by the top 100 TNCs that seems to
focus more on domestic production and a change
in the composition of the top 100 in 2012.
In 2012, some long-established companies
significantly reduced their assets (both total and
foreign), slipping out of the global top 100 TNC list
(e.g. Bayer AG, Nokia OYJ and ThyssenKrupp AG).
This enabled some more active corporations from
developing and transition economies (e.g. Hon Hai
Precision Industries, Vimpelcom Ltd, and América
B. INTERNATIONAL PRODUCTION
Móvil SAB) to enter the global ranking for the
first time.
In fact, data on internationalization indicators for
the largest 100 TNCs headquartered in developing
and transition economies reveal a strong inter-
nationalization effort with steep increases in foreign
assets and sales. The foreign assets of TNCs from
these economies rose 19.7 per cent in 2011, a rate
faster than that of the largest 100 TNCs and almost
double the remarkable 11 per cent increase in
domestic assets (see table I.4). In 2011, their foreign
sales increased by more than a third with respect to
the previous year, easily surpassing the growth in
domestic sales. The only area where this trend did
not hold was in employment, where the growth of
domestic jobs slightly outpaced that of foreign jobs
in 2011. This trend suggests that while TNCs from
developing countries and transition economies are
quickly internationalizing their operations, the core
of their production process is still based at home.
The importance of the largest TNCs in the universe
of TNCs is declining slowly. Their share of all TNCs’
foreign assets in 2011 was down to 9.3 per cent,
compared with 12 per cent a decade earlier,
though their share of foreign affiliates’ employment
increased marginally from 13.7 per cent in 2001 to
14.4 per cent in 2011. The largest 100 TNCs’ share
in foreign global sales increased sharply, however,
from 13 per cent to 21 per cent over the same time
period. The decrease in foreign assets coupled
with the increase in foreign sales largely reflects
the importance of non-equity modes; i.e. a rising
share of foreign production is controlled through
contracts rather than direct ownership.
By contrast, the largest 100 TNCs from developing
and transition countries are strengthening their
position within the TNC universe. Their share in
global production is rising: the foreign assets share
rose from 0.8 to 1.6 per cent between 2001 and
2011, that of foreign sales went up from 0.9 to 5.9
per cent, and that of foreign employment increased
from 1 to 8 per cent during the same period.
Some differences also emerge when comparing
M&A deals (figure I.26). The majority of M&A deals
by the 100 largest TNCs were conducted in
developed economies (just over 300 cross-border
TNCs’ internationalization
process grew at a
slower pace in 2012, with
foreign affiliates’ value added
and exports rising
only moderately.

World Investment Report 2013: Global Value Chains: Investment and Trade for Development24
M&A purchases in developed countries against
fewer than 100 in developing and transition
economies in 2012), while the majority of M&A
purchases by developing and transition economies
took place in other developing and transition
economies (nearly 120 in 2012 against 70 in
developed economies). Data suggest that the 100
largest TNCs conduct both vertical and horizontal
investments7 (with variation by year). The 100 largest
TNCs from developing and transition economies
engage significantly more in vertical investment,
both in developed countries (more than 20 vertical
purchases against fewer than 10 in 2012) and in
developing and transition economies.
Both the largest TNCs and the TNCs from
developing and transition economies implement
the largest number of greenfield projects in
developing and transition economies. In these host
economies, TNCs from developing and transition
economies tend to establish proportionately more
new affiliates than the largest TNCs. By contrast,
nearly half of greenfield ventures in developed
countries take place through expansion, and the
largest TNCs engage more in co-location than
the 100 TNCs from developing and transition
economies (figure I.27).
Table I.3. Selected indicators of FDI and international production, 1990–2012
Value at current prices
(Billions of dollars)
Item 19902005–2007 pre-crisis average
2010 2011 2012
FDI inflows 207 1 491 1 409 1 652 1 351
FDI outflows 241 1 534 1 505 1 678 1 391
FDI inward stock 2 078 14 706 20 380 20 873 22 813
FDI outward stock 2 091 15 895 21 130 21 442 23 593
Income on inward FDIa 75 1 076 1 377 1 500 1 507
Rate of return on inward FDIb (per cent) 4 7 6.8 7.2 6.6
Income on outward FDIa 122 1 148 1 387 1 548 1 461
Rate of return on outward FDIb (per cent) 6 7 6.6 7.2 6.2
Cross-border M&As 99 703 344 555 308
Sales of foreign affiliates 5 102 19 579 22 574 24 198c
25 980c
Value added (product) of foreign affiliates 1 018 4 124 5 735 6 260c
6 607c
Total assets of foreign affiliates 4 599 43 836 78 631 83 043c
86 574c
Exports of foreign affiliates 1 498 5 003 6 320 7 436d
7 479d
Employment by foreign affiliates (thousands) 21 458 51 795 63 043 67 852c
71 695c
Memorandum:
GDP 22 206 50 319 63 468 70 221e
71 707e
Gross fixed capital formation 5 109 11 208 13 940 15 770 16 278
Royalties and licence fee receipts 27 161 215 240 235
Exports of goods and services 4 382 15 008 18 956 22 303e
22 432e
Source: UNCTAD.
a Based on data from 168 countries for income on inward FDI and 136 countries for income on outward FDI in 2012, in both cases
representing more than 90 per cent of global inward and outward stocks.b Calculated only for countries with both FDI income and stock data.c Data for 2011 and 2012 are estimated based on a fixed effects panel regression of each variable against outward stock and a
lagged dependent variable for the period 1980–2010.d Data for 1995–1997 are based on a linear regression of exports of foreign affiliates against inward FDI stock for the period 1982–1994.
For 1998–2012, the share of exports of foreign affiliates in world export in 1998 (33.3 per cent) was applied to obtain values.e Data from IMF, World Economic Outlook, April 2013.
Note: Not included in this table are the value of worldwide sales by foreign affiliates associated with their parent firms through
non-equity relationships and of the sales of the parent firms themselves. Worldwide sales, gross product, total assets,
exports and employment of foreign affiliates are estimated by extrapolating the worldwide data of foreign affiliates of
TNCs from Australia, Austria, Belgium, Canada, Cyprus, the Czech Republic, Finland, France, Germany, Greece, Hungary,
Israel, Italy, Japan, Latvia, Lithuania, Luxembourg, Norway, Portugal, Romania, Slovakia, Slovenia, Spain, Sweden, the
United Kingdom and the United States for sales; those from Cyprus, the Czech Republic, France, Israel, Japan, Portugal,
Romania, Slovenia, Sweden, and the United States for value added (product); those from Austria, Germany, Japan and
the United States for assets; and those from Australia, Austria, Belgium, Canada, Cyprus, the Czech Republic, Finland,
France, Germany, Greece, Hungary, Italy, Japan, Latvia, Lithuania, Luxembourg, Macao (China), Norway, Portugal, Romania,
Slovakia, Slovenia, Spain, Sweden, Switzerland, the United Kingdom and the United States for employment, on the basis
of the shares of those countries in worldwide outward FDI stock.
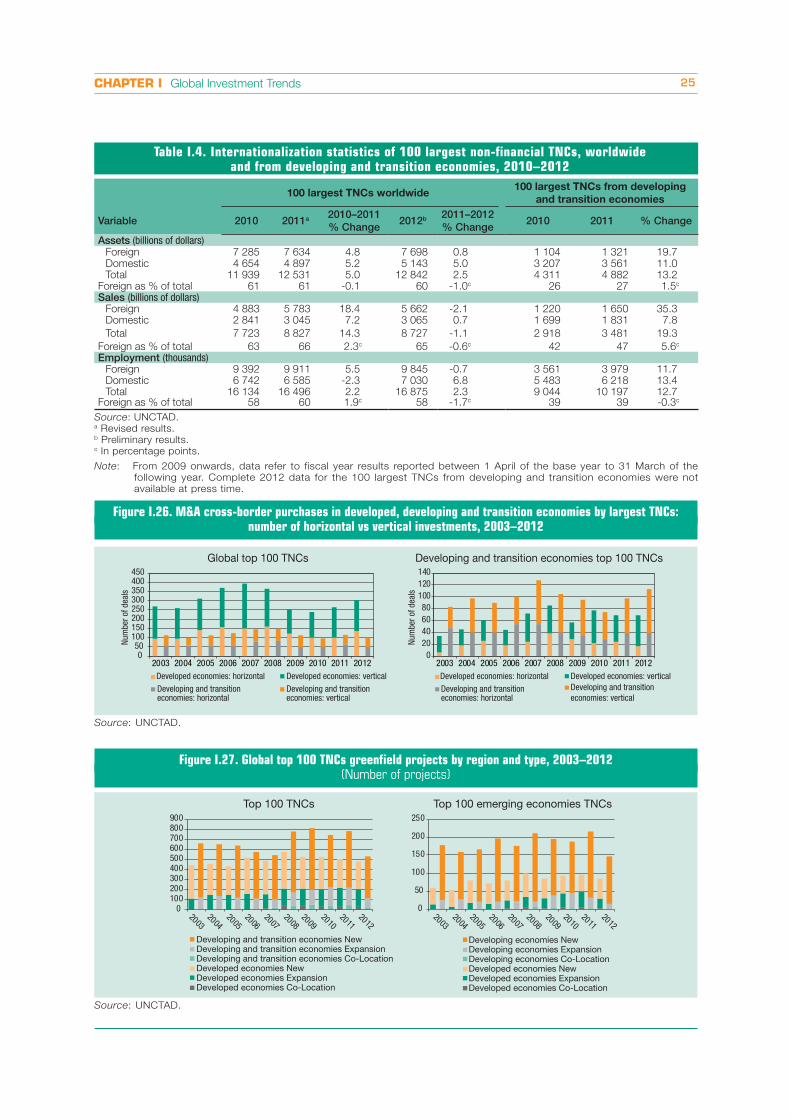
CHAPTER I Global Investment Trends 25
Table I.4. Internationalization statistics of 100 largest non-financial TNCs, worldwide and from developing and transition economies, 2010–2012
100 largest TNCs worldwide100 largest TNCs from developing
and transition economies
Variable 2010 2011a 2010–2011 % Change
2012b 2011–2012 % Change
2010 2011 % Change
Assets (billions of dollars)Foreign 7 285 7 634 4.8 7 698 0.8 1 104 1 321 19.7Domestic 4 654 4 897 5.2 5 143 5.0 3 207 3 561 11.0Total 11 939 12 531 5.0 12 842 2.5 4 311 4 882 13.2
Foreign as % of total 61 61 -0.1 60 -1.0c 26 27 1.5c
Sales (billions of dollars)Foreign 4 883 5 783 18.4 5 662 -2.1 1 220 1 650 35.3Domestic 2 841 3 045 7.2 3 065 0.7 1 699 1 831 7.8
Total 7 723 8 827 14.3 8 727 -1.1 2 918 3 481 19.3
Foreign as % of total 63 66 2.3c 65 -0.6c 42 47 5.6c
Employment (thousands)Foreign 9 392 9 911 5.5 9 845 -0.7 3 561 3 979 11.7Domestic 6 742 6 585 -2.3 7 030 6.8 5 483 6 218 13.4Total 16 134 16 496 2.2 16 875 2.3 9 044 10 197 12.7
Foreign as % of total 58 60 1.9c 58 -1.7c 39 39 -0.3c
Source: UNCTAD.a Revised results. b Preliminary results. c In percentage points.
Note: From 2009 onwards, data refer to fiscal year results reported between 1 April of the base year to 31 March of the
following year. Complete 2012 data for the 100 largest TNCs from developing and transition economies were not
available at press time.
Source: UNCTAD.
Figure I.26. M&A cross-border purchases in developed, developing and transition economies by largest TNCs: number of horizontal vs vertical investments, 2003–2012
050
100150200250300350400450
2003 2004 2005 2006 2007 2008 2009 2010 2011 2012
Num
ber o
f dea
ls
Global top 100 TNCs
Developed economies: horizontal Developed economies: verticalDeveloping and transition economies: horizontal
Developing and transition economies: vertical
020406080
100120140
2003 2004 2005 2006 2007 2008 2009 2010 2011 2012
Num
ber o
f dea
ls
Developing and transition economies top 100 TNCs
Developed economies: horizontal Developed economies: verticalDeveloping and transition economies: horizontal
Developing and transition economies: vertical
Source: UNCTAD.
Figure I.27. Global top 100 TNCs greenfield projects by region and type, 2003–2012(Number of projects)
Top 100 TNCs Top 100 emerging economies TNCs
0100200300400500600700800900
20032004
20052006
20072008
20092010
20112012
0
50
100
150
200
250
20032004
20052006
20072008
20092010
20112012
Developing and transition economies NewDeveloping and transition economies ExpansionDeveloping and transition economies Co-LocationDeveloped economies NewDeveloped economies ExpansionDeveloped economies Co-Location
Developing economies NewDeveloping economies ExpansionDeveloping economies Co-LocationDeveloped economies NewDeveloped economies ExpansionDeveloped economies Co-Location

World Investment Report 2013: Global Value Chains: Investment and Trade for Development26
2. Repositioning: the strategic divestment, relocation and reshoring of foreign operations
A decline in global FDI
outflows may result from
fewer (or smaller) global
investment projects and
also from divestment
decisions by TNCs (box I.3).
In some cases, divestment
from a location is part of
a TNC’s repositioning of
operations internationally
to reflect changing patterns
of demand or locational competitiveness. TNCs can
relocate either to a third country or to their home
country (reshoring). TNCs engage in reshoring of
activities when costs associated with offshoring
become high or the distance between markets or
activities is disadvantageous.8
Divestments are a consti tuent element of TNCs’
international strategies, repre senting an aspect
of their positioning of assets and activities in a
dynamic global economy. Divestment decisions may
involve the complete or partial sale of foreign
affiliates by parent firms to local or third-country
firms, or reduce equity investment by parent firms
in their foreign affiliates, or complete closure of
affiliates. Divestment can also be partly or purely
financial. Where an operation in a host country is
closed, this may be accompanied by the reshoring
of operations or activities back to a TNC’s home
country and/or their relocation from one host
country to another.
Although data on divestment are scarce, evidence
shows that it is a significant phenomenon. France,
Germany, Japan, the United Kingdom and the
United States are among the few countries that
report statistics on divestment as a part of their FDI
dataset. For these countries, the scale of divestment
is significant, ranging from one third (Japan) to
two thirds of gross equity outflows (France) in
2011. For example, in the United Kingdom, gross
equity outflows were $95 billion in 2011, but equity
divestment from the country was $43 billion, which
means that net equity outflows were only $53 billion
(figure I.28). The scale of divestment varies over time,
depending on factors such as the business cycle,
corporate strategies and the business environment.
Over the period 2000–2010, for instance, the ratio
of equity divestment to gross equity outflows for
France was only 39.9 per cent, far lower than the
2011 figure (67 per cent) (see figure I.28).
Repositioning decisions may arise from a major
realignment of locational factors. For instance,
many United States manufacturing TNCs are
reconsidering the location of some international
operations because four trends – rising wage costs
in developing countries, a weak dollar, technological
advances such as 3D printing, and falling energy
costs in the economy (arising from the extensive
exploitation of shale gas) – are improving the United
States' manufacturing competitiveness. As a whole,
however, most repositioning decisions are more
modest, reflecting the ongoing evolution of the world
economy, GVCs and TNC strategies.
If divestment is linked to relocation (to a third
country) or reshoring (back to the home country),
it is not synonymous with a decline in the number
of overseas operations by a TNC. Similarly, under
the best circumstances for a host economy, if
another company invests in the operation that the
TNC is divesting from, divestment may not result
in loss of local employment or productive capacity.
However, this may not be the case: full closures or
Many TNCs reprofiled
their investment overseas
through divestment.
Reshoring and relocation of
foreign affiliates
are important elements
of corporate divestment
strategy.
Figure I.28. Equity divestment in 2011 and its ratio to gross equity outflows, 2000–2010,from France, Germany, Japan, the United Kingdom
and the United States(Billions of dollars and per cent)
Source: UNCTAD, based on information from the Banque de
France; Deutsche Bundesbank, Bank of Japan, United
Kingdom Office of National Statistics and United States
Bureau of Economic Analysis.
Gross equity outflows, 2011
42.6
32.3
31.0
64.1
39.9 France
Germany
Japan
United Kingdom
United States
Divestment, 2011
Ratio of divestments
to gross equityoutflows
2000–2010(Per cent)
87
91
123
95
97
29
46
83
53
52
58
45
40
43
44
58
45
43
44
40
Net equity outflow

CHAPTER I Global Investment Trends 27
Box I.3. TNCs’ strategic repositioning and divestment
TNCs adopt dynamic strategies towards the global configuration of their activities and, for this reason, divestment
and new investments go hand in hand. TNCs govern a complex internal system of interlocking value added activities
positioned across countries. This system evolves continuously, with expansion in one sector or territory sometimes
accompanied by contraction in another. The composition and organization of value added activities by a TNC
change continuously to respond to exogenous environmental, technological and social factors, as well as new
endogenous strategic priorities. The key forms of strategic positioning are defined below.
Offshoring Offshoring is the process of transferring part or all of the value added activities conducted by a TNC
from the home country to another. When it engages in offshoring, the TNC maintains ownership over activities
conducted overseas. This differs from offshore outsourcing, which involves purchasing products or services from
another firm located overseas.
Divestment Divestment is the process of reverse investment, involving capital withdrawals and reduction in the
stock of assets TNCs hold abroad. Divestment can involve either full or partial withdrawals of foreign assets. It is
difficult to measure globally because FDI statistics are recorded on a balance-of-payments basis. National statistics
do not report the magnitude of divestment explicitly because they record only net flows or stocks.
Relocation Relocation is the movement of existing assets, resources and people from one location to another. It can be
linked to divestment. TNCs may decide to relocate all or part of value added activities in response to new environmental
conditions or to reflect new strategies adopted by the firm. Relocation can take place within a host country, across
borders to a new host country or back to the home country of the TNC.
Reshoring Reshoring is the process through which a TNC relocates all or part of value added activities conducted
abroad back to the home country of the TNC.
Nearshoring Nearshoring is the process of positioning all or part of the value added activities in a country that is
geographically, economically and culturally close to the country of origin of the TNC.
In terms of operational elements, equity divestment involves asset sales, liquidation and relocation (box figure I.3.1).
Box figure I.3.1. Structure of equity divestment
Source: UNCTAD.
Complete closure(liquidation)
Asset sales
To local firms
To other countries’ firms
To home country (reshoring)
To other countries, including nearshoring
Equity divestment
Relocation
scaling down of operations can lead to losses in
employment, local incomes, tax receipts, etc. As
TNCs continue to give a proportionally greater role to
NEMs, as opposed to affiliates in their international
production networks, divestment or reshoring may
be further intensified. For instance, the impact of
reshoring information technology (IT) services away
from a host country partner is similar to that of
divesting an affiliate, and with less cost for the TNC,
which may make such decisions more likely. It is
therefore incumbent on host country governments
to be aware of TNCs’ positioning, divestment and
relocation strategies (including reshoring), both in
general and in how they are likely to affect the host
country.
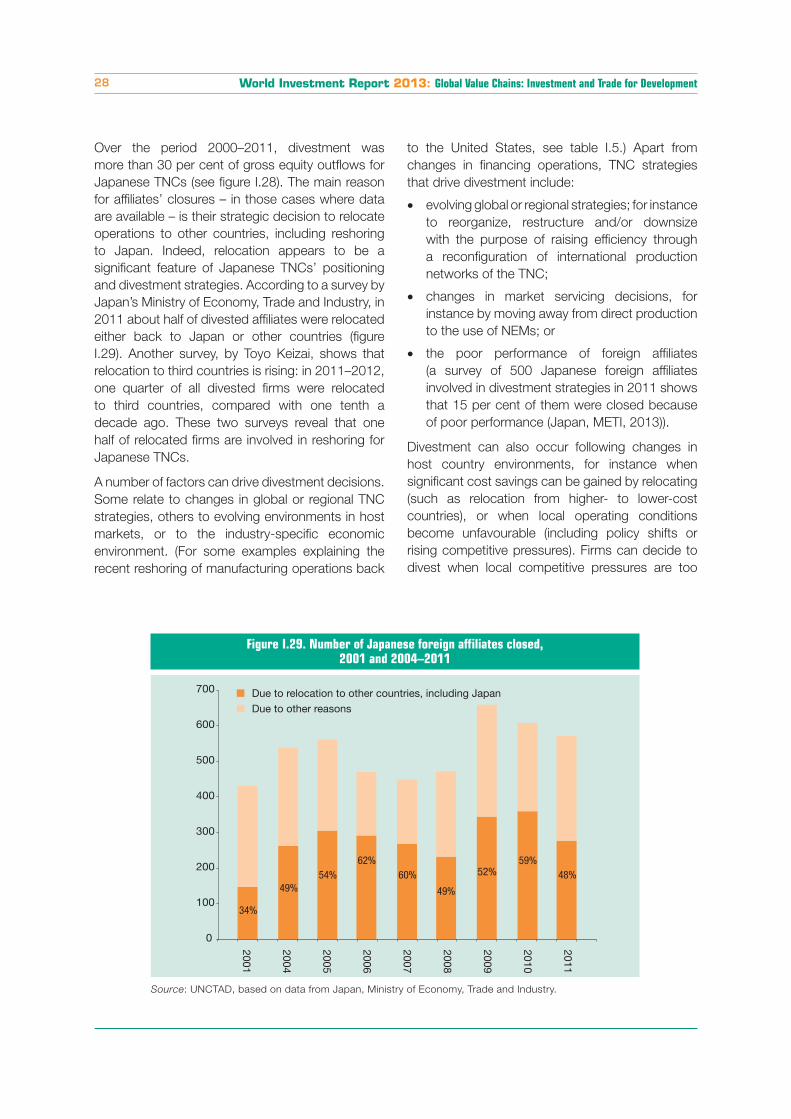
World Investment Report 2013: Global Value Chains: Investment and Trade for Development28
Figure I.29. Number of Japanese foreign affiliates closed, 2001 and 2004–2011
Source: UNCTAD, based on data from Japan, Ministry of Economy, Trade and Industry.
34%
49%54%
62%60%
49%
52%59%
48%
0
100
200
300
400
500
600
700
2001
2004
2005
2006
2007
2008
2009
2010
2011
Due to other reasonsDue to relocation to other countries, including Japan
Over the period 2000–2011, divestment was
more than 30 per cent of gross equity outflows for
Japanese TNCs (see figure I.28). The main reason
for affiliates’ closures – in those cases where data
are available – is their strategic decision to relocate
operations to other countries, including reshoring
to Japan. Indeed, relocation appears to be a
significant feature of Japanese TNCs’ positioning
and divestment strategies. According to a survey by
Japan’s Ministry of Economy, Trade and Industry, in
2011 about half of divested affiliates were relocated
either back to Japan or other countries (figure
I.29). Another survey, by Toyo Keizai, shows that
relocation to third countries is rising: in 2011–2012,
one quarter of all divested firms were relocated
to third countries, compared with one tenth a
decade ago. These two surveys reveal that one
half of relocated firms are involved in reshoring for
Japanese TNCs.
A number of factors can drive divestment decisions.
Some relate to changes in global or regional TNC
strategies, others to evolving environments in host
markets, or to the industry-specific economic
environment. (For some examples explaining the
recent reshoring of manufacturing operations back
to the United States, see table I.5.) Apart from
changes in financing operations, TNC strategies
that drive divestment include:
�� evolving global or regional strategies; for instance
to reorganize, restructure and/or downsize
with the purpose of raising efficiency through
a reconfiguration of international production
networks of the TNC;
�� changes in market servicing decisions, for
instance by moving away from direct production
to the use of NEMs; or
�� the poor performance of foreign affiliates
(a survey of 500 Japanese foreign affiliates
involved in divestment strategies in 2011 shows
that 15 per cent of them were closed because
of poor performance (Japan, METI, 2013)).
Divestment can also occur following changes in
host country environments, for instance when
significant cost savings can be gained by relocating
(such as relocation from higher- to lower-cost
countries), or when local operating conditions
become unfavourable (including policy shifts or
rising competitive pressures). Firms can decide to
divest when local competitive pressures are too

CHAPTER I Global Investment Trends 29
high. For instance, the divestment ratio tends to be
high in the United States, where foreign affiliates’
profitability is low (the rate of return to FDI in 2011
was 4.8 per cent).
Finally, industry- and technology-related factors
can drive divestment decisions, which result from
dynamic changes occurring through the industry life
cycle or industry-level consolidation (as industries
mature). High-tech knowledge-based industry
segments quickly reach a stage of maturity or
require different types of technology. These shifts in
technology may lead to divestment decisions.
There are a number of policy implications to draw
from the divestment activities of TNCs. For host
economies, the key questions are about the type and
strategy of investment conducted by TNCs; whether
divestment leads to a sale (capital divestment) or
a closure (liquidation) of the foreign affiliate; and
the reasons behind divestments. Companies may
decide to divest because locational advantages
offered by the country are no longer favourable.
Host governments therefore need to consider how
attractive their country is to new investment as much
as to existing firms. As countries develop, it can be
expected that low value added types of activities
will relocate to countries that offer cheaper factors
of production. Divestment of certain segments of
GVCs, in this case, may reflect the development
objectives of host governments. But this should
go hand in hand with a shift towards higher value-
added types of activities. When a divestment
is driven by shrinking opportunities worldwide,
often coupled with financial difficulties faced by
TNCs, host governments may consider intensifying
their aftercare services with a view to retaining FDI
in the country.
Research on divestment is in its early stages, in part
because data are insufficient. Further research and
detailed data on divestment are required because it
is a significant phenomenon and entails a number
of implications for policymaking.
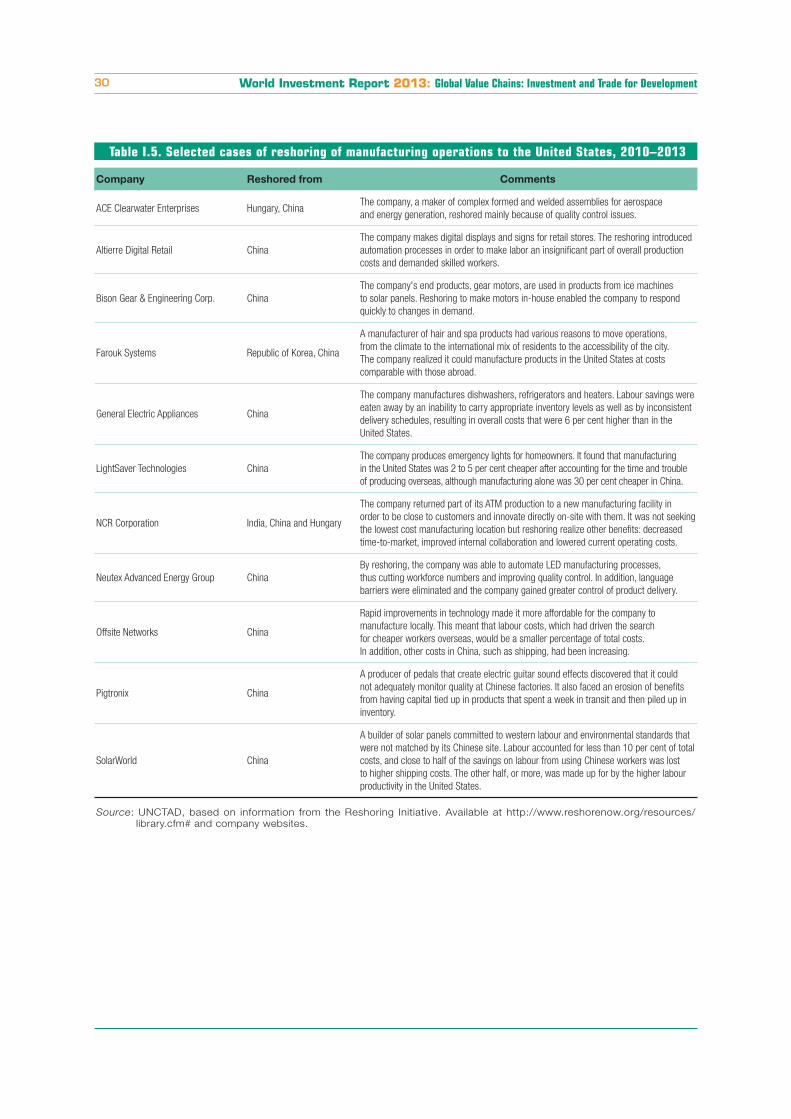
World Investment Report 2013: Global Value Chains: Investment and Trade for Development30
Table I.5. Selected cases of reshoring of manufacturing operations to the United States, 2010–2013
Company Reshored from Comments
ACE Clearwater Enterprises Hungary, ChinaThe company, a maker of complex formed and welded assemblies for aerospace
and energy generation, reshored mainly because of quality control issues.
Altierre Digital Retail China
The company makes digital displays and signs for retail stores. The reshoring introduced
automation processes in order to make labor an insignificant part of overall production
costs and demanded skilled workers.
Bison Gear & Engineering Corp. China
The company's end products, gear motors, are used in products from ice machines
to solar panels. Reshoring to make motors in-house enabled the company to respond
quickly to changes in demand.
Farouk Systems Republic of Korea, China
A manufacturer of hair and spa products had various reasons to move operations,
from the climate to the international mix of residents to the accessibility of the city.
The company realized it could manufacture products in the United States at costs
comparable with those abroad.
General Electric Appliances China
The company manufactures dishwashers, refrigerators and heaters. Labour savings were
eaten away by an inability to carry appropriate inventory levels as well as by inconsistent
delivery schedules, resulting in overall costs that were 6 per cent higher than in the
United States.
LightSaver Technologies China
The company produces emergency lights for homeowners. It found that manufacturing
in the United States was 2 to 5 per cent cheaper after accounting for the time and trouble
of producing overseas, although manufacturing alone was 30 per cent cheaper in China.
NCR Corporation India, China and Hungary
The company returned part of its ATM production to a new manufacturing facility in
order to be close to customers and innovate directly on-site with them. It was not seeking
the lowest cost manufacturing location but reshoring realize other benefits: decreased
time-to-market, improved internal collaboration and lowered current operating costs.
Neutex Advanced Energy Group China
By reshoring, the company was able to automate LED manufacturing processes,
thus cutting workforce numbers and improving quality control. In addition, language
barriers were eliminated and the company gained greater control of product delivery.
Offsite Networks China
Rapid improvements in technology made it more affordable for the company to
manufacture locally. This meant that labour costs, which had driven the search
for cheaper workers overseas, would be a smaller percentage of total costs.
In addition, other costs in China, such as shipping, had been increasing.
Pigtronix China
A producer of pedals that create electric guitar sound effects discovered that it could
not adequately monitor quality at Chinese factories. It also faced an erosion of benefits
from having capital tied up in products that spent a week in transit and then piled up in
inventory.
SolarWorld China
A builder of solar panels committed to western labour and environmental standards that
were not matched by its Chinese site. Labour accounted for less than 10 per cent of total
costs, and close to half of the savings on labour from using Chinese workers was lost
to higher shipping costs. The other half, or more, was made up for by the higher labour
productivity in the United States.
Source: UNCTAD, based on information from the Reshoring Initiative. Available at http://www.reshorenow.org/resources/
library.cfm# and company websites.
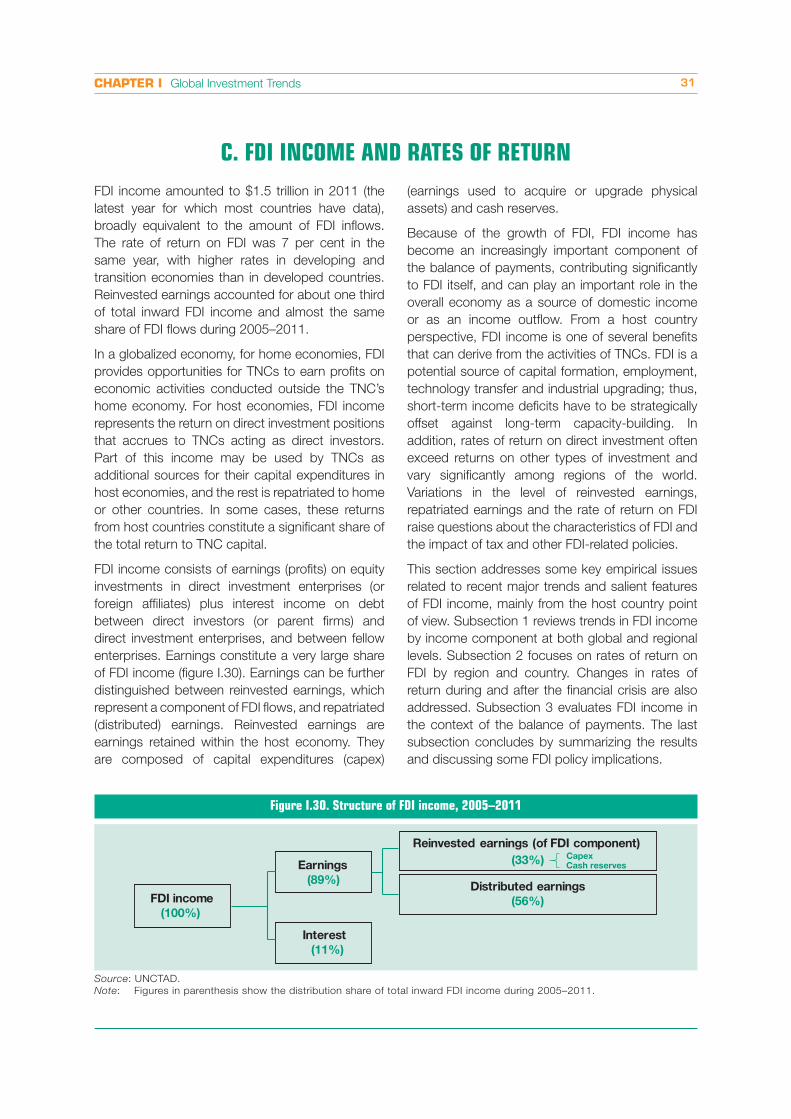
CHAPTER I Global Investment Trends 31
C. FDI INCOME AND RATES OF RETURN
FDI income amounted to $1.5 trillion in 2011 (the
latest year for which most countries have data),
broadly equivalent to the amount of FDI inflows.
The rate of return on FDI was 7 per cent in the
same year, with higher rates in developing and
transition economies than in developed countries.
Reinvested earnings accounted for about one third
of total inward FDI income and almost the same
share of FDI flows during 2005–2011.
In a globalized economy, for home economies, FDI
provides opportunities for TNCs to earn profits on
economic activities conducted outside the TNC’s
home economy. For host economies, FDI income
represents the return on direct investment positions
that accrues to TNCs acting as direct investors.
Part of this income may be used by TNCs as
additional sources for their capital expenditures in
host economies, and the rest is repatriated to home
or other countries. In some cases, these returns
from host countries constitute a significant share of
the total return to TNC capital.
FDI income consists of earnings (profits) on equity
investments in direct investment enterprises (or
foreign affiliates) plus interest income on debt
between direct investors (or parent firms) and
direct investment enterprises, and between fellow
enterprises. Earnings constitute a very large share
of FDI income (figure I.30). Earnings can be further
distinguished between reinvested earnings, which
represent a component of FDI flows, and repatriated
(distributed) earnings. Reinvested earnings are
earnings retained within the host economy. They
are composed of capital expenditures (capex)
(earnings used to acquire or upgrade physical
assets) and cash reserves.
Because of the growth of FDI, FDI income has
become an increasingly important component of
the balance of payments, contributing significantly
to FDI itself, and can play an important role in the
overall economy as a source of domestic income
or as an income outflow. From a host country
perspective, FDI income is one of several benefits
that can derive from the activities of TNCs. FDI is a
potential source of capital formation, employment,
technology transfer and industrial upgrading; thus,
short-term income deficits have to be strategically
offset against long-term capacity-building. In
addition, rates of return on direct investment often
exceed returns on other types of investment and
vary significantly among regions of the world.
Variations in the level of reinvested earnings,
repatriated earnings and the rate of return on FDI
raise questions about the characteristics of FDI and
the impact of tax and other FDI-related policies.
This section addresses some key empirical issues
related to recent major trends and salient features
of FDI income, mainly from the host country point
of view. Subsection 1 reviews trends in FDI income
by income component at both global and regional
levels. Subsection 2 focuses on rates of return on
FDI by region and country. Changes in rates of
return during and after the financial crisis are also
addressed. Subsection 3 evaluates FDI income in
the context of the balance of payments. The last
subsection concludes by summarizing the results
and discussing some FDI policy implications.
Figure I.30. Structure of FDI income, 2005–2011
Source: UNCTAD.
Note: Figures in parenthesis show the distribution share of total inward FDI income during 2005–2011.
FDI income
(100%)
Earnings
(89%)
Interest
(11%)
Reinvested earnings (of FDI component)
(33%)
Distributed earnings
(56%)
CapexCash reserves

World Investment Report 2013: Global Value Chains: Investment and Trade for Development32
1. Trends in FDI income
a. General trends
Global FDI income
increased sharply in 2011
for the second consecutive
year, after declining in both
2008 and 2009 during the
depths of the global financial
crisis. FDI income rose to
$1.5 trillion in 2011 from
$1.4 trillion in 2010, an increase of 9 per cent (figure
I.31). FDI income, a component of the balance of
payments, accounted for 6.4 per cent of the global
current account.
The fall in FDI income in 2008 and 2009 suggests
that foreign affiliate operations were severely
affected at the outset of the global downturn. This
is consistent with sharp declines in the corporate
profits in many economies. By 2010, however,
global FDI income had surpassed the previous
peak reached in 2007. For developed economies,
FDI income generated by investing TNCs has not
completely recovered to its pre-crisis 2007 level,
primarily because of slow growth in the EU that
reflects the region’s continuing sovereign debt
crisis. For developing economies, FDI income
declined modestly in 2009 before growing strongly
in 2010, especially in East and South-East Asia. For
transition economies, FDI income declined sharply
in 2009 but rebounded strongly in 2010 and 2011.
b. Rates of return
Rates of return on FDI9
or FDI profitability can be
compared across regions,
by direction of investment,
and with other types of
cross-border investment.
For instance, for the United
States, the cross-border
portfolio rate of return
was 2.7 per cent, while
the FDI rate of return was
4.8 per cent in 2011 – the latest year for which data
are almost complete. FDI rates of return can also
Figure I.31. FDI income by region(Billions of dollars)
606720
866708
631772
845
238
289
368
407397
529
555
28
48
65
93
58
76
100
2005 2006 2007 2008 2009 2010
Transition economies
Developing economies
Developed economies
872
1,057
1,299
1,208
1,086
1,377
1,500
22%
-8%
18%
2011
Annual growth
Source: UNCTAD based on data from the IMF Balance of Payments database.
Globally, FDI rates of
return declined to less than
6 per cent in 2009, but
have recovered since then.
In 2011, rates of return
were highest in developing
and transition economies,
at 8.4 and 13 per cent,
respectively.
Global FDI income was
$1.5 trillion, almost equivalent
to FDI inflows. It increased for
all three groups of economies,
with the largest increases
in developing and transition
host economies.

CHAPTER I Global Investment Trends 33
be compared with rates of return for investment
conducted by locally owned corporations in host
economies (on a country-by-country basis). In the
United States, the rate of return on inward FDI is
lower than that of locally owned entities (for 2011,
4.8 per cent as against 7.5 per cent10), but this
varies from country to country. There are a number
of reasons why rates of return may be different
between FDI and locally owned firms in a host
economy. They may include firms’ characteristics
(such as length of operations), possession of
intangible assets, transfer pricing and other tax
minimization strategies, and relative risk.
In 2011, the global rate of return on FDI was
7.2 per cent, up slightly from 6.8 per cent in 2010
(table I.6). Rates of return have decreased since 2008
in developed economies. In developing and transition
economies, FDI rates of return are higher than those
in developed economies, and vary over time and by
region. For example, while the global average rate
of return on FDI for 2006–2011 was 7.0 per cent,
the average inward rate for developed economies
was 5.1 per cent. In contrast, the average rates for
developing and transition economies were 9.2 per
cent and 12.9 per cent, respectively. For instance, in
Africa and transition economies, natural resources,
extractive and processing industries consistently
contribute to higher rates of return. At the individual
country level, therefore, many such economies rank
high in the list of the top economies with the highest
rates of return, and all but one of the 20 economies
are developing or transition economies (figure I.32).
Table I.6. Inward FDI rates of return, 2006–2011(Per cent)
Region 2006 2007 2008 2009 2010 2011
World 7.3 7.2 7.7 5.9 6.8 7.2
Developed economies 6.3 6.1 4.6 4.0 4.6 4.8
Developing economies 9.7 9.8 9.7 8.7 9.0 8.4
Africa 10.0 13.4 15.8 10.8 8.9 9.3
Asia 9.5 9.1 8.9 8.8 9.8 8.8
East and South-East
Asia9.7 9.3 9.1 9.2 10.5 9.2
South Asia 14.2 12.9 10.6 8.6 8.5 8.8
West Asia 3.9 3.8 6.7 5.4 4.9 5.1
Latin America and the
Caribbean10.2 10.3 9.9 7.6 7.1 7.1
Transition economies 14.5 12.0 16.5 10.7 10.8 13.0
Source: UNCTAD, based on data from the IMF Balance of
Payments database.
Figure I.32. Top 20 economies with highest inward FDI rates of return, 2011
(Per cent)
0 20 40 60Chile
HondurasZambia
Russian FederationCzech Republic
BoliviaNamibia
ColombiaGuatemala
MalaysiaParaguay
Solomon IslandsMyanmar
BangladeshKazakhstan
PeruNigeria
KyrgyzstanBahrainAngola
Developing and transitioneconomies
Developed economies
12121313131314161717171819
222627
3641
5087
Source: UNCTAD, based on data from the IMF Balance of
Payments database.
c. Reinvested earnings versus repatriated earnings
Reinvested earnings are a
major component of FDI
flows in the financial ac-
count of the balance of
payments. It is important
to note, however, that re-
invested earnings can be
used by TNCs either to (i) acquire or establish new
foreign affiliates or to increase capital expenditures
at existing affiliates, or (ii) to retain as cash holdings.
In fact, TNC affiliates around the world have accu-
mulated record levels of cash and other short-term
assets from their reinvested earnings (section A).
At the global level, in 2011, $499 billion in FDI
earnings were reinvested in host countries (table I.7),
while $1 trillion were repatriated to home or other
countries. The share of reinvested earnings in total
One third of inward FDI
income is retained within
host countries as reinvested
earnings that are a major
component of global FDI
inflows.
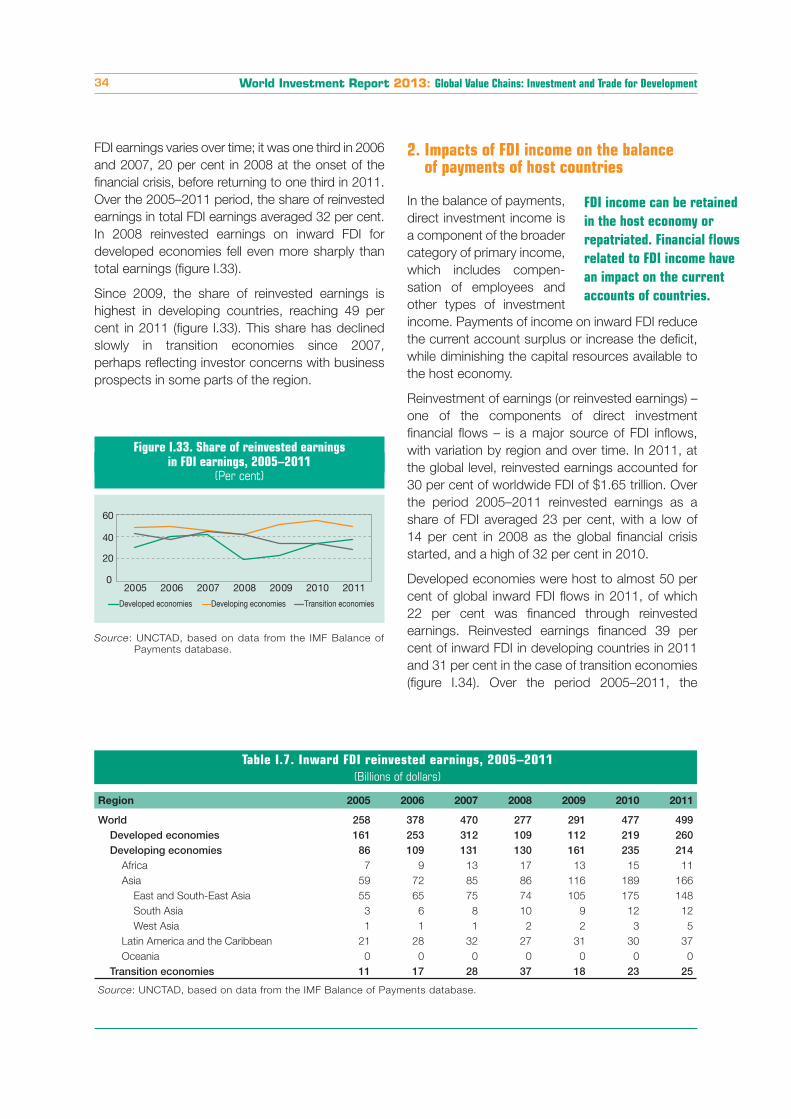
World Investment Report 2013: Global Value Chains: Investment and Trade for Development34
FDI earnings varies over time; it was one third in 2006
and 2007, 20 per cent in 2008 at the onset of the
financial crisis, before returning to one third in 2011.
Over the 2005–2011 period, the share of reinvested
earnings in total FDI earnings averaged 32 per cent.
In 2008 reinvested earnings on inward FDI for
developed economies fell even more sharply than
total earnings (figure I.33).
Since 2009, the share of reinvested earnings is
highest in developing countries, reaching 49 per
cent in 2011 (figure I.33). This share has declined
slowly in transition economies since 2007,
perhaps reflecting investor concerns with business
prospects in some parts of the region.
Figure I.33. Share of reinvested earnings in FDI earnings, 2005–2011
(Per cent)
Source: UNCTAD, based on data from the IMF Balance of
Payments database.
Developed economies Developing economies Transition economies
0
20
40
60
2005 2006 2007 2008 2009 2010 2011
Table I.7. Inward FDI reinvested earnings, 2005–2011(Billions of dollars)
Region 2005 2006 2007 2008 2009 2010 2011
World 258 378 470 277 291 477 499Developed economies 161 253 312 109 112 219 260Developing economies 86 109 131 130 161 235 214
Africa 7 9 13 17 13 15 11
Asia 59 72 85 86 116 189 166
East and South-East Asia 55 65 75 74 105 175 148
South Asia 3 6 8 10 9 12 12
West Asia 1 1 1 2 2 3 5
Latin America and the Caribbean 21 28 32 27 31 30 37
Oceania 0 0 0 0 0 0 0
Transition economies 11 17 28 37 18 23 25
Source: UNCTAD, based on data from the IMF Balance of Payments database.
FDI income can be retained
in the host economy or
repatriated. Financial flows
related to FDI income have
an impact on the current
accounts of countries.
2. Impacts of FDI income on the balance of payments of host countries
In the balance of payments,
direct investment income is
a component of the broader
category of primary income,
which includes compen-
sation of employees and
other types of investment
income. Payments of income on inward FDI reduce
the current account surplus or increase the deficit,
while diminishing the capital resources available to
the host economy.
Reinvestment of earnings (or reinvested earnings) –
one of the components of direct investment
financial flows – is a major source of FDI inflows,
with variation by region and over time. In 2011, at
the global level, reinvested earnings accounted for
30 per cent of worldwide FDI of $1.65 trillion. Over
the period 2005–2011 reinvested earnings as a
share of FDI averaged 23 per cent, with a low of
14 per cent in 2008 as the global financial crisis
started, and a high of 32 per cent in 2010.
Developed economies were host to almost 50 per
cent of global inward FDI flows in 2011, of which
22 per cent was financed through reinvested
earnings. Reinvested earnings financed 39 per
cent of inward FDI in developing countries in 2011
and 31 per cent in the case of transition economies
(figure I.34). Over the period 2005–2011, the
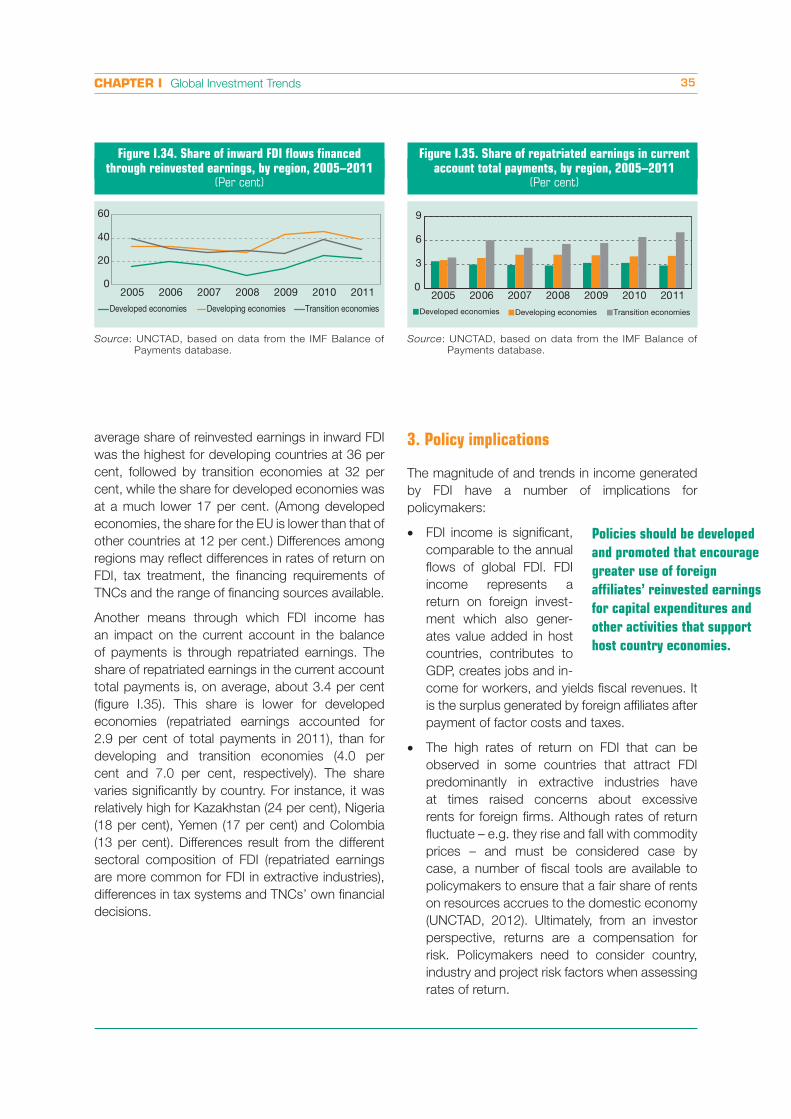
CHAPTER I Global Investment Trends 35
3. Policy implications
The magnitude of and trends in income generated
by FDI have a number of implications for
policymakers:
�� FDI income is significant,
comparable to the annual
flows of global FDI. FDI
income represents a
return on foreign invest-
ment which also gener-
ates value added in host
countries, contributes to
GDP, creates jobs and in-
come for workers, and yields fiscal revenues. It
is the surplus generated by foreign affiliates after
payment of factor costs and taxes.
�� The high rates of return on FDI that can be
observed in some countries that attract FDI
predominantly in extractive industries have
at times raised concerns about excessive
rents for foreign firms. Although rates of return
fluctuate – e.g. they rise and fall with commodity
prices – and must be considered case by
case, a number of fiscal tools are available to
policymakers to ensure that a fair share of rents
on resources accrues to the domestic economy
(UNCTAD, 2012). Ultimately, from an investor
perspective, returns are a compensation for
risk. Policymakers need to consider country,
industry and project risk factors when assessing
rates of return.
Figure I.34. Share of inward FDI flows financed through reinvested earnings, by region, 2005–2011
(Per cent)
Source: UNCTAD, based on data from the IMF Balance of
Payments database.
Developed economies Developing economies Transition economies
0
20
40
60
2005 2006 2007 2008 2009 2010 2011
average share of reinvested earnings in inward FDI
was the highest for developing countries at 36 per
cent, followed by transition economies at 32 per
cent, while the share for developed economies was
at a much lower 17 per cent. (Among developed
economies, the share for the EU is lower than that of
other countries at 12 per cent.) Differences among
regions may reflect differences in rates of return on
FDI, tax treatment, the financing requirements of
TNCs and the range of financing sources available.
Another means through which FDI income has
an impact on the current account in the balance
of payments is through repatriated earnings. The
share of repatriated earnings in the current account
total payments is, on average, about 3.4 per cent
(figure I.35). This share is lower for developed
economies (repatriated earnings accounted for
2.9 per cent of total payments in 2011), than for
developing and transition economies (4.0 per
cent and 7.0 per cent, respectively). The share
varies significantly by country. For instance, it was
relatively high for Kazakhstan (24 per cent), Nigeria
(18 per cent), Yemen (17 per cent) and Colombia
(13 per cent). Differences result from the different
sectoral composition of FDI (repatriated earnings
are more common for FDI in extractive industries),
differences in tax systems and TNCs’ own financial
decisions.
Figure I.35. Share of repatriated earnings in current account total payments, by region, 2005–2011
(Per cent)
Source: UNCTAD, based on data from the IMF Balance of
Payments database.
Developed economies Developing economies Transition economies
0
3
6
9
2005 2006 2007 2008 2009 2010 2011
Policies should be developed
and promoted that encourage
greater use of foreign
affiliates’ reinvested earnings
for capital expenditures and
other activities that support
host country economies.
World Investment Report 2013: Global Value Chains: Investment and Trade for Development36
�� High rates of return, in some cases, coincide
with high shares of repatriated earnings in total
FDI income. This is partly a function of the
industries where this occurs: FDI projects that
require high upfront investments in economies
that provide relatively little opportunity for
follow-up investment in the same industry will
see higher shares of repatriated earnings. This
has raised concerns in some countries of the
potential negative long-term effects of FDI
on the balance of payments. The data have
shown that in most countries the magnitude of
income transfers relative to total current account
payment is limited, also due to the export-
generating effects of FDI.
�� Profits generated by foreign affiliates and
repatriated earnings are a more general concern
for policymakers, to the extent that they may be
perceived as “income leakage” for the domestic
economy. Although value added created by
foreign affiliates contributes to a country’s GDP,
the surplus generated by foreign affiliates (after
tax) is not part of the country’s gross national
income. A key policy objective should be to
maximize the reinvestment rate in order to
keep as much of the rents as possible on FDI
in the domestic economy and generate further
productive capacity for development.
�� Finally, earnings retained in the economy do not
automatically translate into capital expenditures.
For host countries of FDI, the same measures
that promote investment will help maximize the
extent to which retained earnings are reinvested.
In addition, some countries adopt targeted
incentives to facilitate reinvestment.
Notes1 Greenfield projects data refer to announced greenfield FDI. The
value of greenfield projects indicates the capital expenditure
planned by the investor at the time of the announcement. Although
these data provide an important indicator of investor feeling about
the launch of cross-border expansion investments, they can be
substantially different from the official FDI data as reported, as
companies can raise capital locally, phase their investments over
time and channel their investment through different countries for tax
efficiency. In addition, the project may be cancelled or may not start
in the year it is announced.
2 SWF Institute Fund Rankings, updated February 2013. Accessed
on 13 March 2013 at www.swfinstitute.org/fund-rankings.
3 The Economist, “The state advances”, 6 October 2012.
4 UNCTAD research suggests that this number is still very small as a
proportion of all SOEs (WIR11, p. 31).
5 For the purpose of this report, the countries and territories falling into
this group include Andorra, Anguilla, Antigua and Barbuda, Aruba,
Bahrain, Barbados, Belize, the British Virgin Islands, the Cayman
Islands, the Cook Islands, Dominica, Gibraltar, Grenada, the Isle of
Man, Liberia, Liechtenstein, Maldives, the Marshall Islands, Monaco,
Montserrat, Nauru, Netherlands Antilles, Niue, Panama, Saint Kitts
and Nevis, Saint Lucia, Saint Vincent and the Grenadines, Samoa,
Seychelles, Tonga, Turks and Caicos Islands, US Virgin Islands and
Vanuatu. Based on OECD, “Towards Global Tax Co-operation”.
6 FDI flows to OFCs are likely to be underestimated as many OFCs
do not report FDI data. For example, data on FDI inflows to the
British Virgin Islands are collected from home countries that report
investments there. This estimation method tends to underestimate
the level of flows.
7 An investment is horizontal if the target company operates in the
same industry as the acquiring TNC and thus has the same primary
SIC code at the two-digit level. A vertical investment is a purchase
of a company operating in another industry.
8 “Outsourcing and offshoring: Here, there and every
where”, Special report, The Economist, 19 January 2013.
9 Annual rates of return are measured as annual FDI income for year
divided by the average of the end-of-year FDI positions for years t
and t-1. For this study, rates of return have been calculated only
for those countries that reported both FDI income and positions
for a given year. Rates of return by sector are not provided in this
report because FDI income data by sector are not readily available
for most countries.
10 Data from United States Department of Commerce.