global investment outlook - blackrock · global investment outlook 2018 for institutional,...
TRANSCRIPT
Global Investment Outlook2018
FOR INSTITUTIONAL, PROFESSIONAL AND QUALIFIED INVESTORS/CLIENTS. FOR PUBLIC DISTRIBUTION IN U.S.
BII1217U/E-323050-958844

FOR INSTITUTIONAL, PROFESSIONAL AND QUALIFIED INVESTORS/CLIENTS. FOR PUBLIC DISTRIBUTION IN U.S.
2
Kate MooreChief Equity Strategist
BlackRock Investment Institute
Jean BoivinHead of Economic and Markets Research
BlackRock Investment Institute
Isabelle Mateos y LagoChief Multi-Asset Strategist
BlackRock Investment Institute
Jeff Rosenberg Chief Fixed Income Strategist
BlackRock Investment Institute
Richard TurnillGlobal Chief
Investment Strategist
BlackRock Investment Institute
SETTING THE SCENE ....... 3
2018 THEMES .............. 4–6Room to runInflation comebackReduced reward for risk
OUTLOOK DEBATE .....7–10Volatility regime shiftsAssessing vulnerabilitiesChina on the global stageGeopolitical risk
MARKETS ..................11–15Government bonds and creditEquitiesCommodities and currenciesFactors and private marketsAssets in brief
G L O B A L I N V E S T M E N T O U T L O O K S U M M A R Y
We debated the prospects for inflation, the sustainability of low volatility, the market impact of elevated political risks and a range of other topics at our 13th semi-annual Investment Outlook Forum in mid-November. Our key views:
• 2018 themes: We see a synchronized global expansion with room to run in 2018 and beyond, albeit
with less scope for upside growth surprises. We see inflation making a modest comeback, led by the
U.S., and expect the Federal Reserve to make slow but steady progress in normalizing policy. U.S. tax
cuts could boost near-term growth and quicken the Fed’s pace. The eurozone and Japan are behind on
policy normalization, but their next steps in this direction will likely come into greater focus as the year
progresses. We expect rewards for taking risk to be more muted across the board in 2018.
• Outlook debate: We believe low market volatility (vol) can persist amid the stable economic backdrop.
Yet even a small uptick in vol could upend leveraged income strategies and spook markets. We see few
signs of leverage building in the financial system. The exception is China, where we believe much-
needed economic reforms risk slowing growth and triggering temporary credit crunches. We see the
North American Free Trade Agreement (NAFTA) negotiations as a bellwether for global trade risks. We
lay out a framework for assessing whether localized risks can morph into systemic ones.
• Market views: We prefer to take economic risk in equities over credit given tight spreads, low yields and
a maturing cycle. We see rising profitability powering equity returns, especially in Japan and emerging
markets (EMs), but earnings growth could wane. We like financials and tech. The steady expansion
supports the momentum style factor, albeit with potential reversals; we see other factors as diversifiers.
Plentiful global savings and a thirst for income should cap any rises in long-term bond yields. We prefer
inflation-protected over nominal bonds, especially in the U.S., and an up-in-quality stance in credit.
BII1217U/E-323050-958844
FOR INSTITUTIONAL, PROFESSIONAL AND QUALIFIED INVESTORS/CLIENTS. FOR PUBLIC DISTRIBUTION IN U.S.
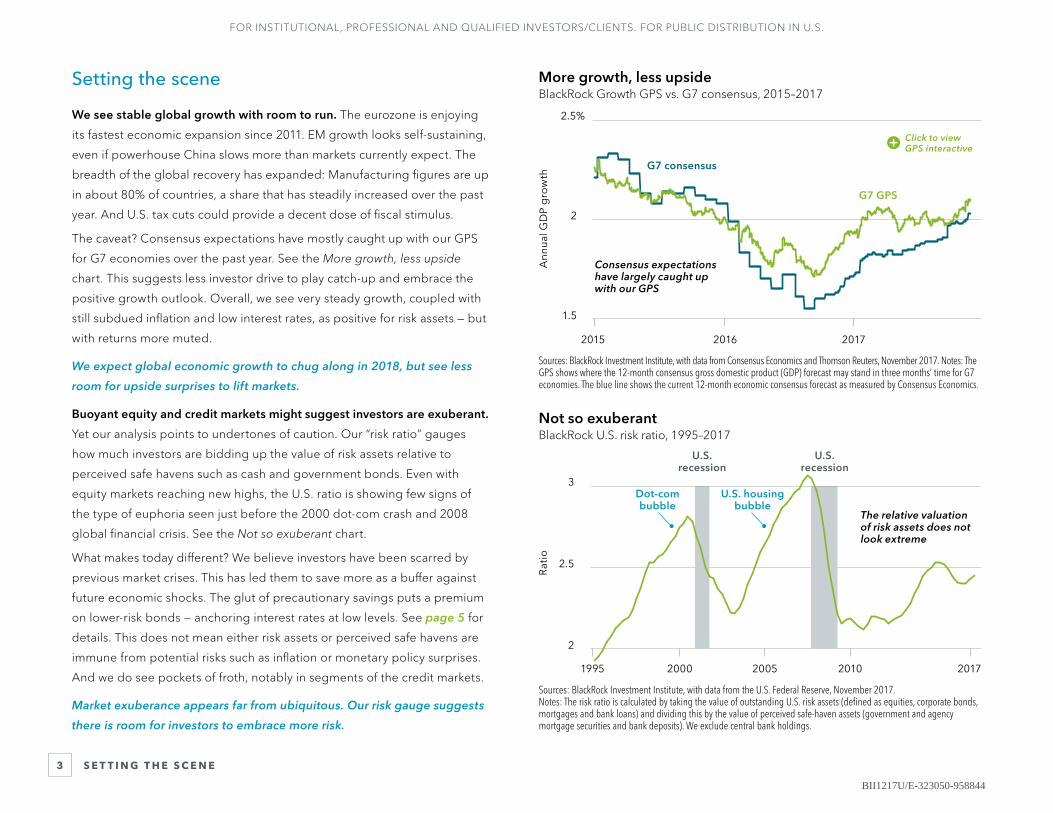
More growth, less upsideBlackRock Growth GPS vs. G7 consensus, 2015–2017
2015 2016 2017
Ann
ual G
DP
gro
wth
1.5
2
2.5%
G7 consensus
G7 GPS
Consensus expectations have largely caught up with our GPS
Sources: BlackRock Investment Institute, with data from Consensus Economics and Thomson Reuters, November 2017. Notes: The GPS shows where the 12-month consensus gross domestic product (GDP) forecast may stand in three months’ time for G7 economies. The blue line shows the current 12-month economic consensus forecast as measured by Consensus Economics.
Not so exuberantBlackRock U.S. risk ratio, 1995–2017
1995 20052000 2010 2017
Rat
io
2
2.5
3
U.S. recession
Dot-com bubble
U.S. housing bubble
The relative valuation of risk assets does not look extreme
U.S. recession
Sources: BlackRock Investment Institute, with data from the U.S. Federal Reserve, November 2017.Notes: The risk ratio is calculated by taking the value of outstanding U.S. risk assets (defined as equities, corporate bonds, mortgages and bank loans) and dividing this by the value of perceived safe-haven assets (government and agency mortgage securities and bank deposits). We exclude central bank holdings.
3 S E T T I N G T H E S C E N E
Click to view GPS interactive
Setting the scene
We see stable global growth with room to run. The eurozone is enjoying
its fastest economic expansion since 2011. EM growth looks self-sustaining,
even if powerhouse China slows more than markets currently expect. The
breadth of the global recovery has expanded: Manufacturing figures are up
in about 80% of countries, a share that has steadily increased over the past
year. And U.S. tax cuts could provide a decent dose of fiscal stimulus.
The caveat? Consensus expectations have mostly caught up with our GPS
for G7 economies over the past year. See the More growth, less upside
chart. This suggests less investor drive to play catch-up and embrace the
positive growth outlook. Overall, we see very steady growth, coupled with
still subdued inflation and low interest rates, as positive for risk assets — but
with returns more muted.
We expect global economic growth to chug along in 2018, but see less
room for upside surprises to lift markets.
Buoyant equity and credit markets might suggest investors are exuberant.
Yet our analysis points to undertones of caution. Our “risk ratio” gauges
how much investors are bidding up the value of risk assets relative to
perceived safe havens such as cash and government bonds. Even with
equity markets reaching new highs, the U.S. ratio is showing few signs of
the type of euphoria seen just before the 2000 dot-com crash and 2008
global financial crisis. See the Not so exuberant chart.
What makes today different? We believe investors have been scarred by
previous market crises. This has led them to save more as a buffer against
future economic shocks. The glut of precautionary savings puts a premium
on lower-risk bonds — anchoring interest rates at low levels. See page 5 for
details. This does not mean either risk assets or perceived safe havens are
immune from potential risks such as inflation or monetary policy surprises.
And we do see pockets of froth, notably in segments of the credit markets.
Market exuberance appears far from ubiquitous. Our risk gauge suggests
there is room for investors to embrace more risk.
BII1217U/E-323050-958844
4
FOR INSTITUTIONAL, PROFESSIONAL AND QUALIFIED INVESTORS/CLIENTS. FOR PUBLIC DISTRIBUTION IN U.S.
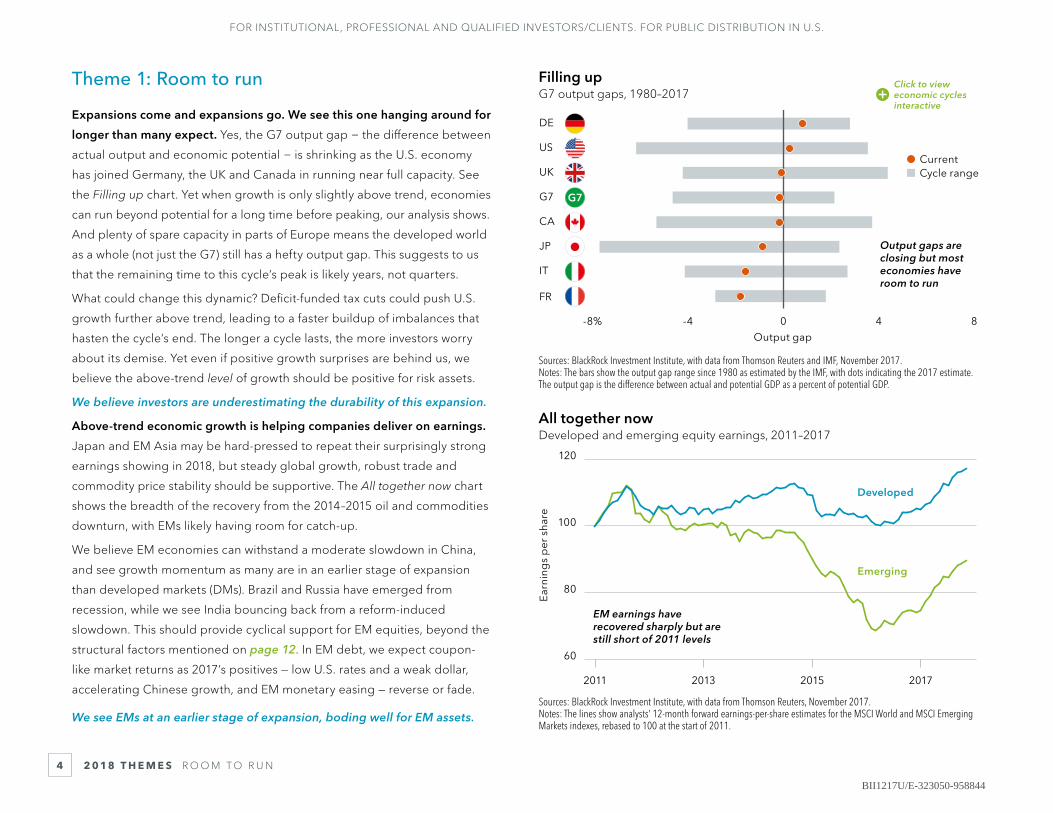
Filling upG7 output gaps, 1980–2017
Output gap
Output gaps are closing but most economies have room to run
DE
US
UK
G7
CA
JP
IT
FR
Cycle rangeCurrent
-8% -4 0 4 8
Sources: BlackRock Investment Institute, with data from Thomson Reuters and IMF, November 2017.Notes: The bars show the output gap range since 1980 as estimated by the IMF, with dots indicating the 2017 estimate. The output gap is the difference between actual and potential GDP as a percent of potential GDP.
All together nowDeveloped and emerging equity earnings, 2011–2017
2017
Ear
ning
s p
er s
hare
Developed
Emerging
60
80
100
120
201520132011
EM earnings have recovered sharply but are still short of 2011 levels
Sources: BlackRock Investment Institute, with data from Thomson Reuters, November 2017.Notes: The lines show analysts’ 12-month forward earnings-per-share estimates for the MSCI World and MSCI Emerging Markets indexes, rebased to 100 at the start of 2011.
2 0 18 T H E M E S R O O M T O R U N
Click to view economic cycles interactive
Theme 1: Room to run
Expansions come and expansions go. We see this one hanging around for
longer than many expect. Yes, the G7 output gap − the difference between
actual output and economic potential − is shrinking as the U.S. economy
has joined Germany, the UK and Canada in running near full capacity. See
the Filling up chart. Yet when growth is only slightly above trend, economies
can run beyond potential for a long time before peaking, our analysis shows.
And plenty of spare capacity in parts of Europe means the developed world
as a whole (not just the G7) still has a hefty output gap. This suggests to us
that the remaining time to this cycle’s peak is likely years, not quarters.
What could change this dynamic? Deficit-funded tax cuts could push U.S.
growth further above trend, leading to a faster buildup of imbalances that
hasten the cycle’s end. The longer a cycle lasts, the more investors worry
about its demise. Yet even if positive growth surprises are behind us, we
believe the above-trend level of growth should be positive for risk assets.
We believe investors are underestimating the durability of this expansion.
Above-trend economic growth is helping companies deliver on earnings.
Japan and EM Asia may be hard-pressed to repeat their surprisingly strong
earnings showing in 2018, but steady global growth, robust trade and
commodity price stability should be supportive. The All together now chart
shows the breadth of the recovery from the 2014–2015 oil and commodities
downturn, with EMs likely having room for catch-up.
We believe EM economies can withstand a moderate slowdown in China,
and see growth momentum as many are in an earlier stage of expansion
than developed markets (DMs). Brazil and Russia have emerged from
recession, while we see India bouncing back from a reform-induced
slowdown. This should provide cyclical support for EM equities, beyond the
structural factors mentioned on page 12. In EM debt, we expect coupon-
like market returns as 2017’s positives — low U.S. rates and a weak dollar,
accelerating Chinese growth, and EM monetary easing — reverse or fade.
We see EMs at an earlier stage of expansion, boding well for EM assets.
BII1217U/E-323050-958844
5
FOR INSTITUTIONAL, PROFESSIONAL AND QUALIFIED INVESTORS/CLIENTS. FOR PUBLIC DISTRIBUTION IN U.S.
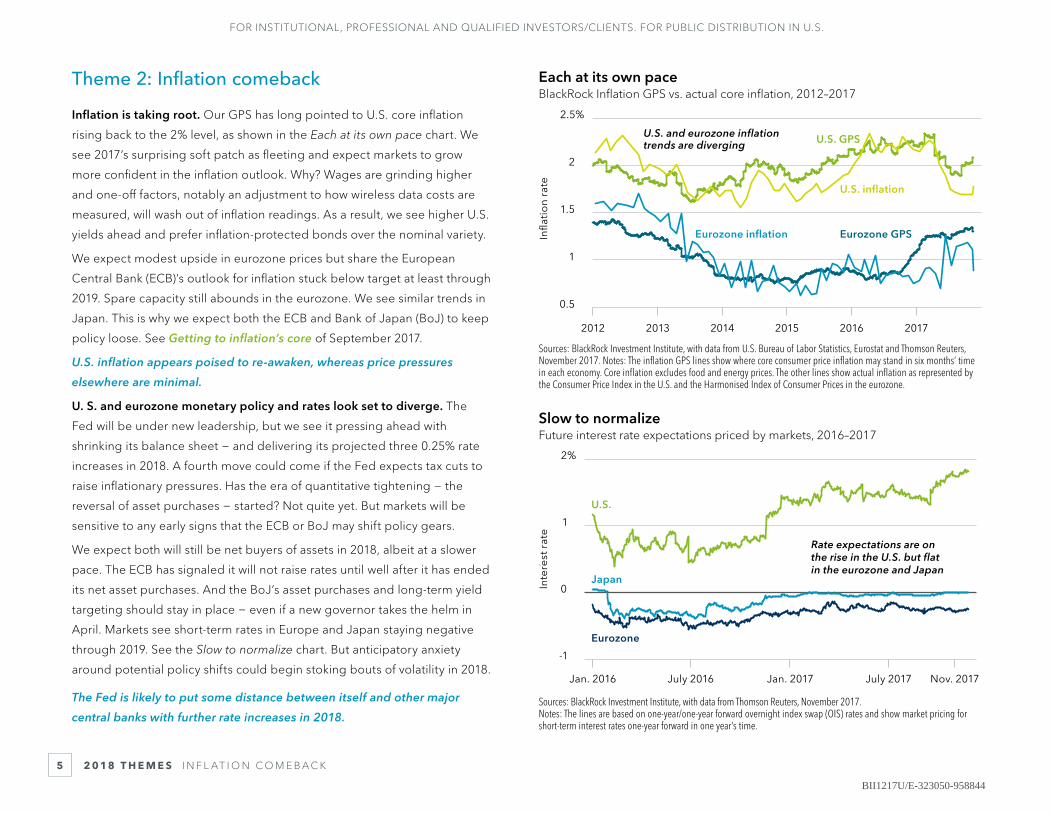
Each at its own paceBlackRock Inflation GPS vs. actual core inflation, 2012–2017
Infla
tio
n ra
te U.S. inflation
Eurozone inflation
U.S. GPS
Eurozone GPS
0.5
1
1.5
2
2.5%
201720162015201420132012
U.S. and eurozone inflation trends are diverging
Sources: BlackRock Investment Institute, with data from U.S. Bureau of Labor Statistics, Eurostat and Thomson Reuters, November 2017. Notes: The inflation GPS lines show where core consumer price inflation may stand in six months’ time in each economy. Core inflation excludes food and energy prices. The other lines show actual inflation as represented by the Consumer Price Index in the U.S. and the Harmonised Index of Consumer Prices in the eurozone.
Slow to normalizeFuture interest rate expectations priced by markets, 2016–2017
`
Sources: BlackRock Investment Institute, with data from Thomson Reuters, November 2017.Notes: The lines are based on one-year/one-year forward overnight index swap (OIS) rates and show market pricing for short-term interest rates one-year forward in one year’s time.
2 0 18 T H E M E S I N F L AT I O N C O M E B A C K
Inte
rest
rat
e
U.S.
Eurozone
Japan
-1
0
1
2%
Jan. 2016 July 2016 Jan. 2017 July 2017 Nov. 2017
Rate expectations are on the rise in the U.S. but flat in the eurozone and Japan
Theme 2: Inflation comeback
Inflation is taking root. Our GPS has long pointed to U.S. core inflation
rising back to the 2% level, as shown in the Each at its own pace chart. We
see 2017’s surprising soft patch as fleeting and expect markets to grow
more confident in the inflation outlook. Why? Wages are grinding higher
and one-off factors, notably an adjustment to how wireless data costs are
measured, will wash out of inflation readings. As a result, we see higher U.S.
yields ahead and prefer inflation-protected bonds over the nominal variety.
We expect modest upside in eurozone prices but share the European
Central Bank (ECB)’s outlook for inflation stuck below target at least through
2019. Spare capacity still abounds in the eurozone. We see similar trends in
Japan. This is why we expect both the ECB and Bank of Japan (BoJ) to keep
policy loose. See Getting to inflation’s core of September 2017.
U.S. inflation appears poised to re-awaken, whereas price pressures
elsewhere are minimal.
U. S. and eurozone monetary policy and rates look set to diverge. The
Fed will be under new leadership, but we see it pressing ahead with
shrinking its balance sheet − and delivering its projected three 0.25% rate
increases in 2018. A fourth move could come if the Fed expects tax cuts to
raise inflationary pressures. Has the era of quantitative tightening − the
reversal of asset purchases − started? Not quite yet. But markets will be
sensitive to any early signs that the ECB or BoJ may shift policy gears.
We expect both will still be net buyers of assets in 2018, albeit at a slower
pace. The ECB has signaled it will not raise rates until well after it has ended
its net asset purchases. And the BoJ’s asset purchases and long-term yield
targeting should stay in place − even if a new governor takes the helm in
April. Markets see short-term rates in Europe and Japan staying negative
through 2019. See the Slow to normalize chart. But anticipatory anxiety
around potential policy shifts could begin stoking bouts of volatility in 2018.
The Fed is likely to put some distance between itself and other major
central banks with further rate increases in 2018.
BII1217U/E-323050-958844
6
FOR INSTITUTIONAL, PROFESSIONAL AND QUALIFIED INVESTORS/CLIENTS. FOR PUBLIC DISTRIBUTION IN U.S.
2 0 18 T H E M E S R E D U C E D R E W A R D F O R R I S K
Shrinking rewardsU.S. equity risk premium and investment grade (IG) credit spread, 1995–2017
Asset valuations have become more expensive
201720102005
0
2
4
6
8%
IG credit spread
BlackRock U.S. equity risk premium
20001995
Past performance is not a reliable indicator of future results. It is not possible to invest directly in an index. Sources: BlackRock Investment Institute, with data from Bloomberg Barclays and Thomson Reuters, November 2017. Notes: The IG credit spread is represented by the Bloomberg Barclays U.S. Investment Grade Credit Index. The U.S. equity risk premium is calculated as MSCI USA Index’s dividend yield plus expected dividend growth minus the expected real rate. The real rate is the 10-year U.S. Treasury yield minus expected inflation and a BlackRock estimated term premium.
Where’s the upside?U.S. high yield bond and equity prices, 2015–2017
Hig
h yi
eld
pri
ce (i
n U
SD)
Russell 2000 index level
We see more upside in equites than credit
Nov. 2017
Jan. 2016
1000 1500
85
95
$105
1250
Jan. 2015Jan. 2017
Past performance is not a reliable indicator of future results. It is not possible to invest directly in an index. Sources: BlackRock Investment Institute, with data from Bloomberg, November 2017.Notes: The dots show monthly observations for the par-weighted price for the Merrill Lynch U.S. High Yield Index (y-axis) and the Russell 2000 Index (x-axis) from January 2015 to November 2017.
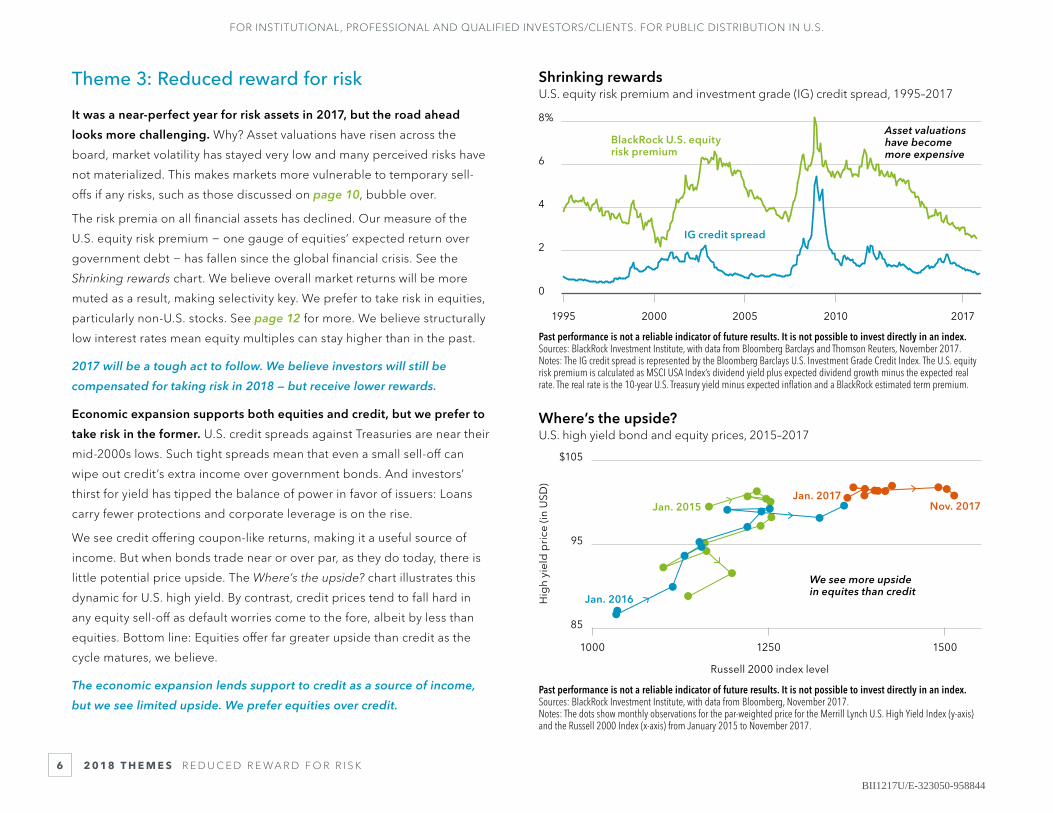
Theme 3: Reduced reward for risk
It was a near-perfect year for risk assets in 2017, but the road ahead
looks more challenging. Why? Asset valuations have risen across the
board, market volatility has stayed very low and many perceived risks have
not materialized. This makes markets more vulnerable to temporary sell-
offs if any risks, such as those discussed on page 10, bubble over.
The risk premia on all financial assets has declined. Our measure of the
U.S. equity risk premium − one gauge of equities’ expected return over
government debt − has fallen since the global financial crisis. See the
Shrinking rewards chart. We believe overall market returns will be more
muted as a result, making selectivity key. We prefer to take risk in equities,
particularly non-U.S. stocks. See page 12 for more. We believe structurally
low interest rates mean equity multiples can stay higher than in the past.
2017 will be a tough act to follow. We believe investors will still be
compensated for taking risk in 2018 — but receive lower rewards.
Economic expansion supports both equities and credit, but we prefer to
take risk in the former. U.S. credit spreads against Treasuries are near their
mid-2000s lows. Such tight spreads mean that even a small sell-off can
wipe out credit’s extra income over government bonds. And investors’
thirst for yield has tipped the balance of power in favor of issuers: Loans
carry fewer protections and corporate leverage is on the rise.
We see credit offering coupon-like returns, making it a useful source of
income. But when bonds trade near or over par, as they do today, there is
little potential price upside. The Where’s the upside? chart illustrates this
dynamic for U.S. high yield. By contrast, credit prices tend to fall hard in
any equity sell-off as default worries come to the fore, albeit by less than
equities. Bottom line: Equities offer far greater upside than credit as the
cycle matures, we believe.
The economic expansion lends support to credit as a source of income,
but we see limited upside. We prefer equities over credit.
BII1217U/E-323050-958844
7
FOR INSTITUTIONAL, PROFESSIONAL AND QUALIFIED INVESTORS/CLIENTS. FOR PUBLIC DISTRIBUTION IN U.S.
Low vol = normalRealized monthly U.S. equity volatility, 1985–2017
Rea
lized
vo
lati
lity
Equity volatility can stay in a low regime for long periods
2000 20051990 19951985 2010 2017
High-volatility regime
Low-volatility regime
Volatility
0
10
20
30%
High economic volatility regimes
Sources: BlackRock Investment Institute, with data from Thomson Reuters and Robert Shiller, November 2017.Notes: Realized volatility is calculated as the annualized standard deviation of monthly changes in U.S. equities over a rolling 12-month period. Using a Markov-Switching regression model we calculate two volatility regimes: a high-volatility regime (orange) and a low-volatility regime (green). The orange and green lines plot the average level of volatility during each regime based on data from 1985 to 2017. We use a similar methodology to identify economic volatility regimes. Periods of high economic volatility are shaded in gray.
Warning signFinancial leverage metrics by region, 2017
HighPercentile vs. historyLow
Leverage appears low in developed markets
DE
US
UK
CN
JP
FR
0% 10050
FinancialCorporateHousehold
Sources: BlackRock Investment Institute, with data from Haver Analytics, November 2017. Notes: The bars show the percentile ranking of financial leverage measures versus their history. Countries cannot be directly compared due to differing time periods and metrics. Historical ranges are from 1953 for the U.S., from 1999 for Europe and Japan, and from 2006 for China. Financial leverage is based on financial corporate debt-to-equity except in China, where it is based on lending to non-bank financial institutions as a share of GDP (a proxy for shadow banking activity). Corporate leverage is based on non-financial corporate debt to equity except in China, where it is based on credit to non-financial corporates as a share of GDP. Household leverage is based on household debt-service ratios and not measured for China.
O U T L O O K D E B AT E V O L AT I L I T Y R E G I M E S H I F T S
Click to view global debt interactive
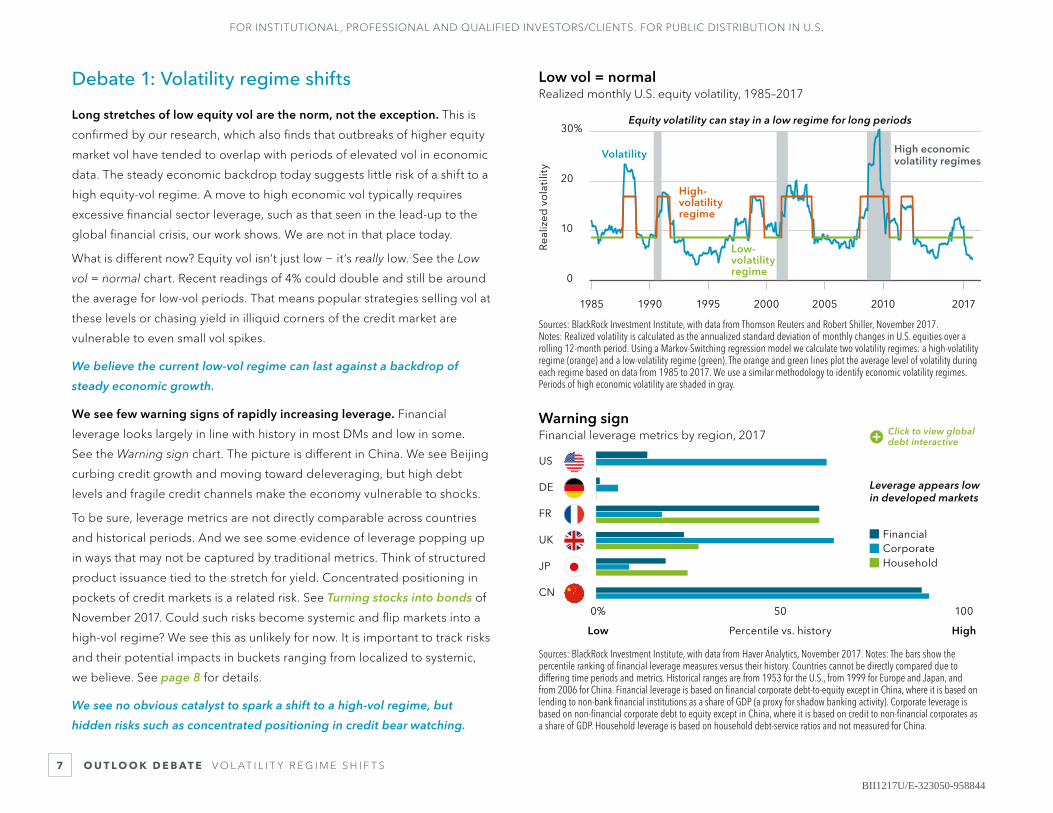
Debate 1: Volatility regime shifts
Long stretches of low equity vol are the norm, not the exception. This is
confirmed by our research, which also finds that outbreaks of higher equity
market vol have tended to overlap with periods of elevated vol in economic
data. The steady economic backdrop today suggests little risk of a shift to a
high equity-vol regime. A move to high economic vol typically requires
excessive financial sector leverage, such as that seen in the lead-up to the
global financial crisis, our work shows. We are not in that place today.
What is different now? Equity vol isn’t just low − it’s really low. See the Low
vol = normal chart. Recent readings of 4% could double and still be around
the average for low-vol periods. That means popular strategies selling vol at
these levels or chasing yield in illiquid corners of the credit market are
vulnerable to even small vol spikes.
We believe the current low-vol regime can last against a backdrop of
steady economic growth.
We see few warning signs of rapidly increasing leverage. Financial
leverage looks largely in line with history in most DMs and low in some.
See the Warning sign chart. The picture is different in China. We see Beijing
curbing credit growth and moving toward deleveraging, but high debt
levels and fragile credit channels make the economy vulnerable to shocks.
To be sure, leverage metrics are not directly comparable across countries
and historical periods. And we see some evidence of leverage popping up
in ways that may not be captured by traditional metrics. Think of structured
product issuance tied to the stretch for yield. Concentrated positioning in
pockets of credit markets is a related risk. See Turning stocks into bonds of
November 2017. Could such risks become systemic and flip markets into a
high-vol regime? We see this as unlikely for now. It is important to track risks
and their potential impacts in buckets ranging from localized to systemic,
we believe. See page 8 for details.
We see no obvious catalyst to spark a shift to a high-vol regime, but
hidden risks such as concentrated positioning in credit bear watching.
BII1217U/E-323050-958844
8
FOR INSTITUTIONAL, PROFESSIONAL AND QUALIFIED INVESTORS/CLIENTS. FOR PUBLIC DISTRIBUTION IN U.S.
Bucketing risksBlackRock framework for categorizing market risks and their evolution, 2017
O U T L O O K D E B AT E A S S E S S I N G V U L N E R A B I L I T I E S
Localized risk episodes Broad risk episodes Persistent market drawdown Systemic crisis
Description
Bursts of volatility caused by short-term factors such as changes in liquidity and sentiment,
followed by quick recovery and no effect on the real economy
Losses in contained parts of the market lead to a broad sell-off as reallocation of capital results in shifting sector and
equity style factor leadership
Major declines in market prices, high correlations, difficulty trading and marking to market, fire sales, increases
in counterparty risk and widespread contagion feed into the real economy and lead to global recession
Type Mispricing/liquidityMispricing/reassessment
of fundamentalsMacroeconomic
LocationLocalized correction in specific part(s) of
the market
Broad-based market correction across asset
classes and regions
Broad-based market correction across asset classes and regions
Broad-based change in risk appetite. Correlated risk-off sentiment across markets. Ripple effect of losses and risk
aversion across market participants
Systematic amplification
Events remain contained within markets due to lack of inherent macro vulnerabilities
No contagion or broad macro impact Inherent vulnerabilities amplify episode into systemic crisis
DurationShort-lived
(one day to three months)Medium term
(three months to two years)Long term
(over two years)
Historical examples
Catalonia independence referendum, 2017
China yuan devaluation, 2015
Dot-com bust, 2000 Global financial crisis, 2008
Sources: BlackRock Investment Institute, November 2017. Notes: The graphic shows four different categories of risk. For illustrative purposes only.
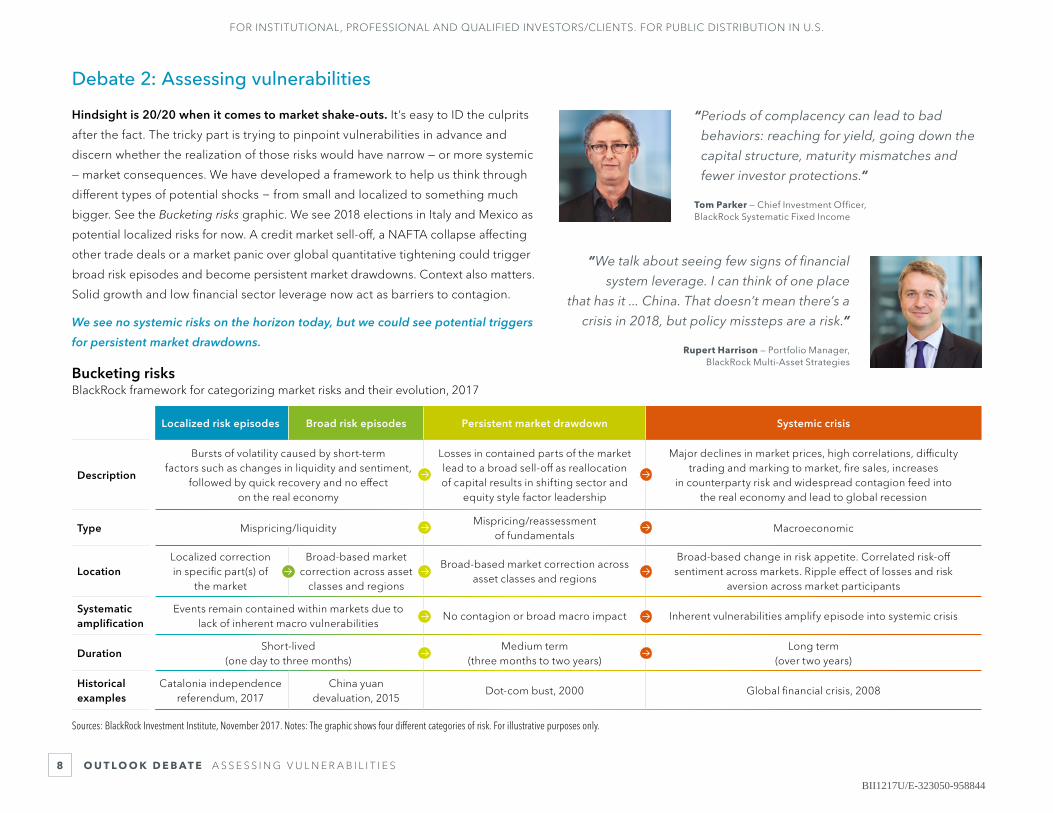
Debate 2: Assessing vulnerabilities
Hindsight is 20/20 when it comes to market shake-outs. It’s easy to ID the culprits
after the fact. The tricky part is trying to pinpoint vulnerabilities in advance and
discern whether the realization of those risks would have narrow — or more systemic
— market consequences. We have developed a framework to help us think through
different types of potential shocks − from small and localized to something much
bigger. See the Bucketing risks graphic. We see 2018 elections in Italy and Mexico as
potential localized risks for now. A credit market sell-off, a NAFTA collapse affecting
other trade deals or a market panic over global quantitative tightening could trigger
broad risk episodes and become persistent market drawdowns. Context also matters.
Solid growth and low financial sector leverage now act as barriers to contagion.
We see no systemic risks on the horizon today, but we could see potential triggers
for persistent market drawdowns.
“ Periods of complacency can lead to bad
behaviors: reaching for yield, going down the
capital structure, maturity mismatches and
fewer investor protections.”
Tom Parker — Chief Investment Officer, BlackRock Systematic Fixed Income
“We talk about seeing few signs of financial
system leverage. I can think of one place
that has it ... China. That doesn’t mean there’s a
crisis in 2018, but policy missteps are a risk.”
Rupert Harrison — Portfolio Manager, BlackRock Multi-Asset Strategies
BII1217U/E-323050-958844
9
FOR INSTITUTIONAL, PROFESSIONAL AND QUALIFIED INVESTORS/CLIENTS. FOR PUBLIC DISTRIBUTION IN U.S.
Tale of two economies China old- and new-economy activity, 2011–2017
2017
Ann
ual c
hang
e
Old economy
New economy
0
10
20%
201520132011
Private enterprises and new-economy sectors are driving China’s growth
Sources: BlackRock Investment Institute, with data from Bloomberg, November 2017.Notes: The lines show annual growth of the Bloomberg real activity indexes that track the strength of monthly economic activity and the rebalancing of China’s economy. New economy is based on a weighted average of consumption of medicine, vehicle exports, clean energy electricity production, communication equipment and computer production, and output of private enterprises. Old economy is based on real estate investment, textile exports, thermal electricity production, metal ore production, and output of state-owned enterprises.
Made-in-China inflation?China export prices and U.S. import prices from China, 2006–2017
2017
Ann
ual c
hang
e
U.S. import prices from China
China export prices
-10
-5
0
5
10%
20142012201020082006
China could start exporting inflation to the world
Sources: BlackRock Investment Institute, with data from National Bureau of Statistics of China, U.S. Bureau of Labor Statistics and Eurostat, November 2017. Note: U.S. import prices are based on total goods imported from China.
O U T L O O K D E B AT E C H I N A O N T H E G L O B A L S TA G E
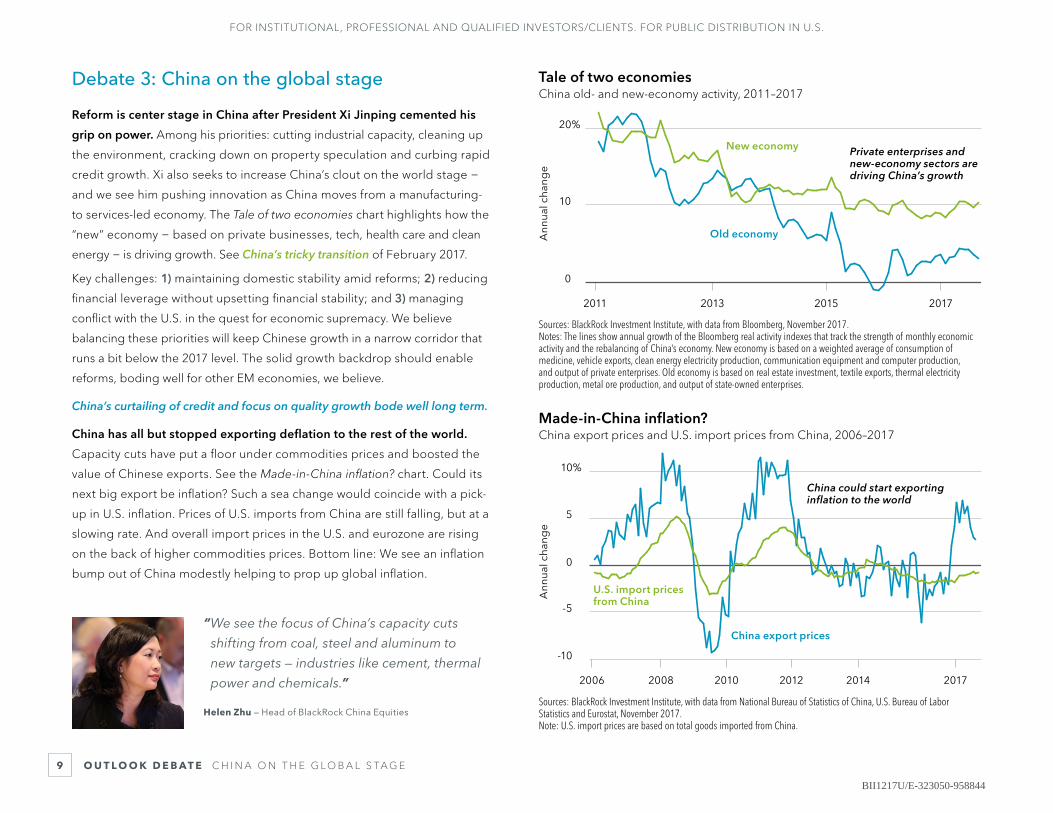
Debate 3: China on the global stage
Reform is center stage in China after President Xi Jinping cemented his
grip on power. Among his priorities: cutting industrial capacity, cleaning up
the environment, cracking down on property speculation and curbing rapid
credit growth. Xi also seeks to increase China’s clout on the world stage −
and we see him pushing innovation as China moves from a manufacturing-
to services-led economy. The Tale of two economies chart highlights how the
“new” economy − based on private businesses, tech, health care and clean
energy − is driving growth. See China’s tricky transition of February 2017.
Key challenges: 1) maintaining domestic stability amid reforms; 2) reducing
financial leverage without upsetting financial stability; and 3) managing
conflict with the U.S. in the quest for economic supremacy. We believe
balancing these priorities will keep Chinese growth in a narrow corridor that
runs a bit below the 2017 level. The solid growth backdrop should enable
reforms, boding well for other EM economies, we believe.
China’s curtailing of credit and focus on quality growth bode well long term.
China has all but stopped exporting deflation to the rest of the world.
Capacity cuts have put a floor under commodities prices and boosted the
value of Chinese exports. See the Made-in-China inflation? chart. Could its
next big export be inflation? Such a sea change would coincide with a pick-
up in U.S. inflation. Prices of U.S. imports from China are still falling, but at a
slowing rate. And overall import prices in the U.S. and eurozone are rising
on the back of higher commodities prices. Bottom line: We see an inflation
bump out of China modestly helping to prop up global inflation.
“ We see the focus of China’s capacity cuts
shifting from coal, steel and aluminum to
new targets — industries like cement, thermal
power and chemicals.”
Helen Zhu — Head of BlackRock China Equities
BII1217U/E-323050-958844
10
FOR INSTITUTIONAL, PROFESSIONAL AND QUALIFIED INVESTORS/CLIENTS. FOR PUBLIC DISTRIBUTION IN U.S.
O U T L O O K D E B AT E G E O P O L I T I C A L R I S K
Ups and downsBlackRock Geopolitical Risk Indicator, 2005–2017
2017
BG
RI s
core
-2
0
2
Global financial crisis
Eurozone sovereign debt crisis
Crimeainvasion
NorthKorea
U.S.election
2013 20152011200920072005
Geopolitical risk runs high
Sources: BlackRock Investment Institute, with data from Thomson Reuters and Dow Jones, November 2017.Notes: The BGRI is based on text analysis of our top 10 risks within the Dow Jones Global Newswire database and Thomson Reuters Broker Report database. We then assign a score based on the frequency of words that relate to the risks. The index is still under development and is meant for illustrative purposes only.
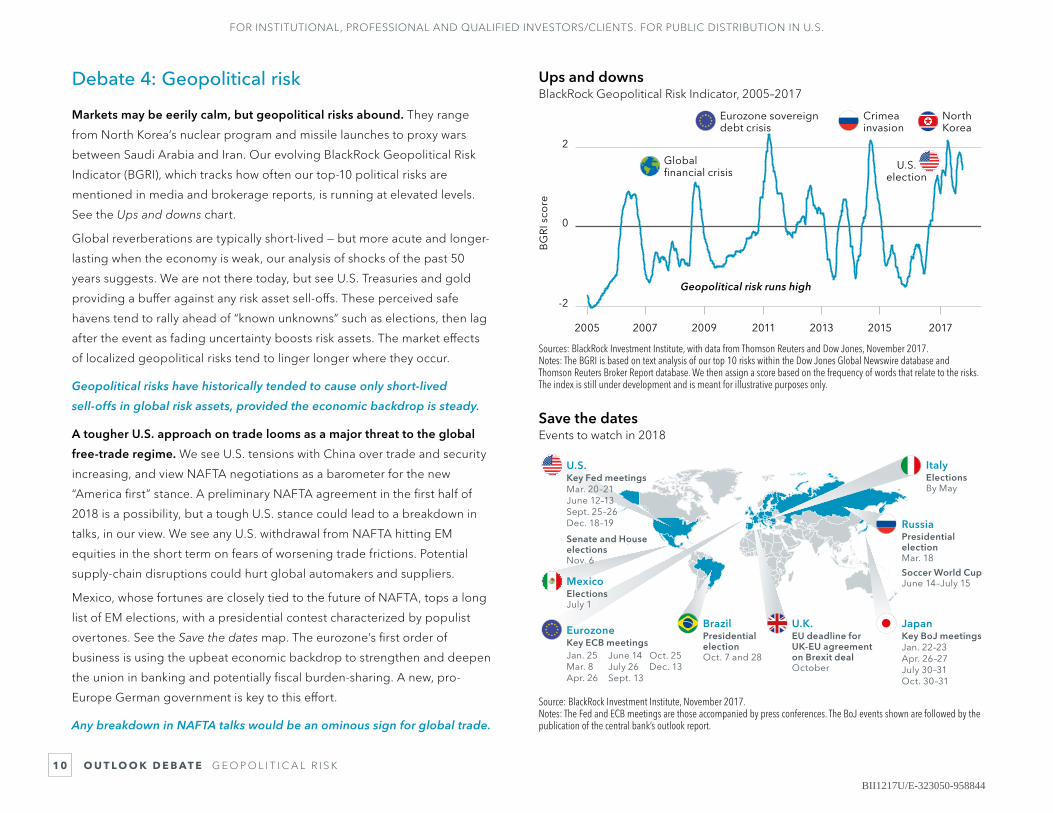
Save the datesEvents to watch in 2018
BrazilPresidential electionOct. 7 and 28
U.K.EU deadline for UK-EU agreement on Brexit dealOctober
RussiaPresidential election Mar. 18
Soccer World CupJune 14–July 15
JapanKey BoJ meetingsJan. 22–23Apr. 26–27July 30–31Oct. 30–31
ItalyElectionsBy May
EurozoneKey ECB meetings Jan. 25Mar. 8Apr. 26
June 14July 26Sept. 13
MexicoElectionsJuly 1
Oct. 25Dec. 13
U.S.Key Fed meetingsMar. 20–21June 12–13Sept. 25–26Dec. 18–19
Senate and House electionsNov. 6
Source: BlackRock Investment Institute, November 2017.Notes: The Fed and ECB meetings are those accompanied by press conferences. The BoJ events shown are followed by the publication of the central bank’s outlook report.
Debate 4: Geopolitical risk
Markets may be eerily calm, but geopolitical risks abound. They range
from North Korea’s nuclear program and missile launches to proxy wars
between Saudi Arabia and Iran. Our evolving BlackRock Geopolitical Risk
Indicator (BGRI), which tracks how often our top-10 political risks are
mentioned in media and brokerage reports, is running at elevated levels.
See the Ups and downs chart.
Global reverberations are typically short-lived — but more acute and longer-
lasting when the economy is weak, our analysis of shocks of the past 50
years suggests. We are not there today, but see U.S. Treasuries and gold
providing a buffer against any risk asset sell-offs. These perceived safe
havens tend to rally ahead of “known unknowns” such as elections, then lag
after the event as fading uncertainty boosts risk assets. The market effects
of localized geopolitical risks tend to linger longer where they occur.
Geopolitical risks have historically tended to cause only short-lived
sell-offs in global risk assets, provided the economic backdrop is steady.
A tougher U.S. approach on trade looms as a major threat to the global
free-trade regime. We see U.S. tensions with China over trade and security
increasing, and view NAFTA negotiations as a barometer for the new
“America first” stance. A preliminary NAFTA agreement in the first half of
2018 is a possibility, but a tough U.S. stance could lead to a breakdown in
talks, in our view. We see any U.S. withdrawal from NAFTA hitting EM
equities in the short term on fears of worsening trade frictions. Potential
supply-chain disruptions could hurt global automakers and suppliers.
Mexico, whose fortunes are closely tied to the future of NAFTA, tops a long
list of EM elections, with a presidential contest characterized by populist
overtones. See the Save the dates map. The eurozone’s first order of
business is using the upbeat economic backdrop to strengthen and deepen
the union in banking and potentially fiscal burden-sharing. A new, pro-
Europe German government is key to this effort.
Any breakdown in NAFTA talks would be an ominous sign for global trade.
BII1217U/E-323050-958844
11
FOR INSTITUTIONAL, PROFESSIONAL AND QUALIFIED INVESTORS/CLIENTS. FOR PUBLIC DISTRIBUTION IN U.S.
M A R K E T S G O V E R N M E N T B O N D S A N D C R E D I T
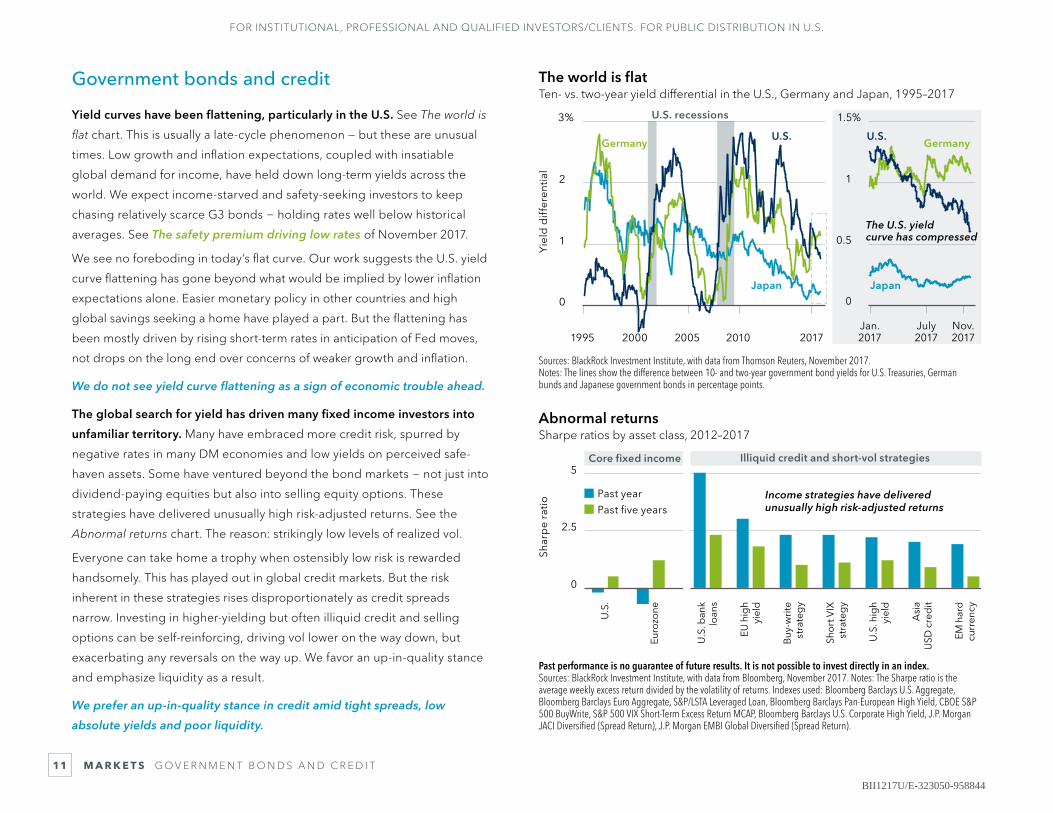
Abnormal returnsSharpe ratios by asset class, 2012–2017
Shar
pe
rati
o
0
2.5
5
U.S
.
Euro
zone
Buy
-wri
te
stra
teg
y
Sho
rt V
IX
stra
teg
y
U.S
. hig
h yi
eld
Asi
a U
SD c
red
it
EM h
ard
cu
rren
cy
U.S
. ban
k lo
ans
EU h
igh
yiel
d
Past year
Past five years
Illiquid credit and short-vol strategiesCore fixed income
Income strategies have delivered unusually high risk-adjusted returns
Past performance is no guarantee of future results. It is not possible to invest directly in an index. Sources: BlackRock Investment Institute, with data from Bloomberg, November 2017. Notes: The Sharpe ratio is the average weekly excess return divided by the volatility of returns. Indexes used: Bloomberg Barclays U.S. Aggregate, Bloomberg Barclays Euro Aggregate, S&P/LSTA Leveraged Loan, Bloomberg Barclays Pan-European High Yield, CBOE S&P 500 BuyWrite, S&P 500 VIX Short-Term Excess Return MCAP, Bloomberg Barclays U.S. Corporate High Yield, J.P. Morgan JACI Diversified (Spread Return), J.P. Morgan EMBI Global Diversified (Spread Return).
The world is flatTen- vs. two-year yield differential in the U.S., Germany and Japan, 1995–2017
Yie
ld d
iffe
ren
tial
1995 2000Jan. 2017
Nov. 2017
July 2017
Germany GermanyU.S. U.S.
2005 2010 2017
0
1
2
3% 1.5%
1
0.5
0Japan Japan
U.S. recessions
The U.S. yield curve has compressed
Sources: BlackRock Investment Institute, with data from Thomson Reuters, November 2017.Notes: The lines show the difference between 10- and two-year government bond yields for U.S. Treasuries, German bunds and Japanese government bonds in percentage points.
Government bonds and credit
Yield curves have been flattening, particularly in the U.S. See The world is
flat chart. This is usually a late-cycle phenomenon — but these are unusual
times. Low growth and inflation expectations, coupled with insatiable
global demand for income, have held down long-term yields across the
world. We expect income-starved and safety-seeking investors to keep
chasing relatively scarce G3 bonds − holding rates well below historical
averages. See The safety premium driving low rates of November 2017.
We see no foreboding in today’s flat curve. Our work suggests the U.S. yield
curve flattening has gone beyond what would be implied by lower inflation
expectations alone. Easier monetary policy in other countries and high
global savings seeking a home have played a part. But the flattening has
been mostly driven by rising short-term rates in anticipation of Fed moves,
not drops on the long end over concerns of weaker growth and inflation.
We do not see yield curve flattening as a sign of economic trouble ahead.
The global search for yield has driven many fixed income investors into
unfamiliar territory. Many have embraced more credit risk, spurred by
negative rates in many DM economies and low yields on perceived safe-
haven assets. Some have ventured beyond the bond markets − not just into
dividend-paying equities but also into selling equity options. These
strategies have delivered unusually high risk-adjusted returns. See the
Abnormal returns chart. The reason: strikingly low levels of realized vol.
Everyone can take home a trophy when ostensibly low risk is rewarded
handsomely. This has played out in global credit markets. But the risk
inherent in these strategies rises disproportionately as credit spreads
narrow. Investing in higher-yielding but often illiquid credit and selling
options can be self-reinforcing, driving vol lower on the way down, but
exacerbating any reversals on the way up. We favor an up-in-quality stance
and emphasize liquidity as a result.
We prefer an up-in-quality stance in credit amid tight spreads, low
absolute yields and poor liquidity.
BII1217U/E-323050-958844
12
FOR INSTITUTIONAL, PROFESSIONAL AND QUALIFIED INVESTORS/CLIENTS. FOR PUBLIC DISTRIBUTION IN U.S.
M A R K E T S E Q U I T I E S
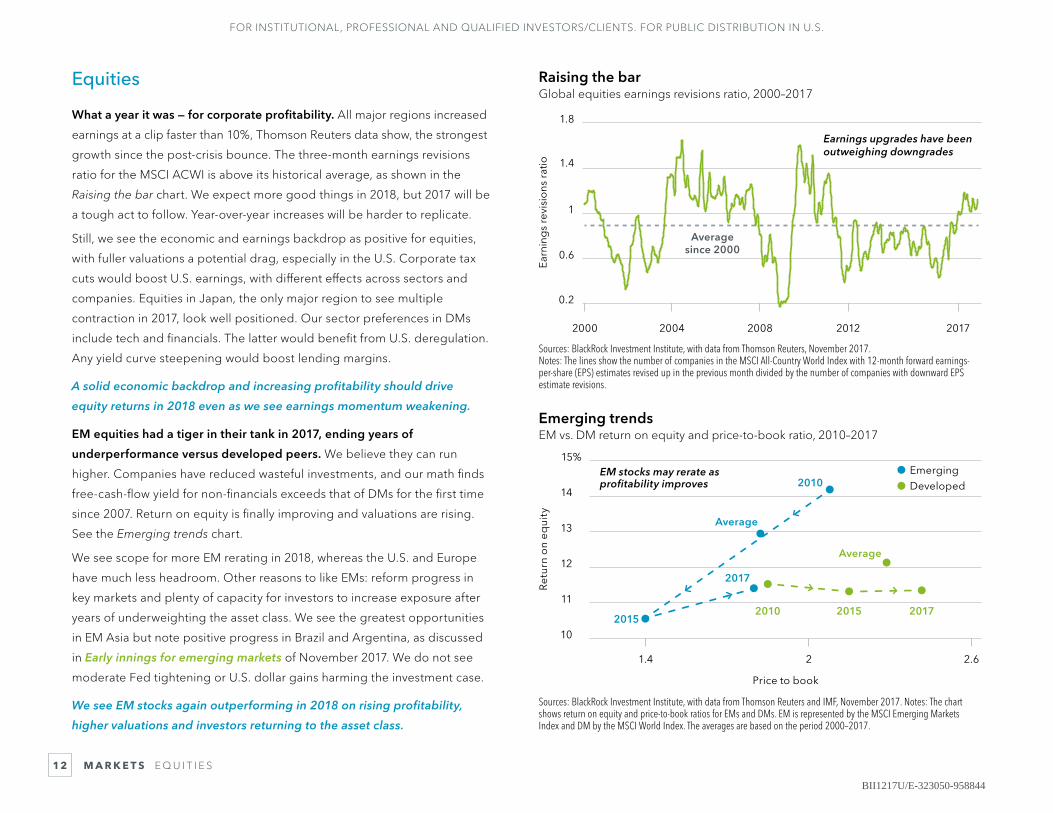
Emerging trendsEM vs. DM return on equity and price-to-book ratio, 2010–2017
2.6
Ret
urn
on
equi
ty
EmergingDeveloped
10
12
11
13
14
15%
21.4
EM stocks may rerate as profitability improves
Price to book
2010
20152010
2017
2015 2017
Average
Average
Sources: BlackRock Investment Institute, with data from Thomson Reuters and IMF, November 2017. Notes: The chart shows return on equity and price-to-book ratios for EMs and DMs. EM is represented by the MSCI Emerging Markets Index and DM by the MSCI World Index. The averages are based on the period 2000–2017.
Raising the barGlobal equities earnings revisions ratio, 2000–2017
Earn
ing
s re
visi
ons
rat
io
0.2
0.6
1
1.4
1.8
Average since 2000
20172012200820042000
Earnings upgrades have been outweighing downgrades
Sources: BlackRock Investment Institute, with data from Thomson Reuters, November 2017.Notes: The lines show the number of companies in the MSCI All-Country World Index with 12-month forward earnings-per-share (EPS) estimates revised up in the previous month divided by the number of companies with downward EPS estimate revisions.
Equities
What a year it was — for corporate profitability. All major regions increased
earnings at a clip faster than 10%, Thomson Reuters data show, the strongest
growth since the post-crisis bounce. The three-month earnings revisions
ratio for the MSCI ACWI is above its historical average, as shown in the
Raising the bar chart. We expect more good things in 2018, but 2017 will be
a tough act to follow. Year-over-year increases will be harder to replicate.
Still, we see the economic and earnings backdrop as positive for equities,
with fuller valuations a potential drag, especially in the U.S. Corporate tax
cuts would boost U.S. earnings, with different effects across sectors and
companies. Equities in Japan, the only major region to see multiple
contraction in 2017, look well positioned. Our sector preferences in DMs
include tech and financials. The latter would benefit from U.S. deregulation.
Any yield curve steepening would boost lending margins.
A solid economic backdrop and increasing profitability should drive
equity returns in 2018 even as we see earnings momentum weakening.
EM equities had a tiger in their tank in 2017, ending years of
underperformance versus developed peers. We believe they can run
higher. Companies have reduced wasteful investments, and our math finds
free-cash-flow yield for non-financials exceeds that of DMs for the first time
since 2007. Return on equity is finally improving and valuations are rising.
See the Emerging trends chart.
We see scope for more EM rerating in 2018, whereas the U.S. and Europe
have much less headroom. Other reasons to like EMs: reform progress in
key markets and plenty of capacity for investors to increase exposure after
years of underweighting the asset class. We see the greatest opportunities
in EM Asia but note positive progress in Brazil and Argentina, as discussed
in Early innings for emerging markets of November 2017. We do not see
moderate Fed tightening or U.S. dollar gains harming the investment case.
We see EM stocks again outperforming in 2018 on rising profitability,
higher valuations and investors returning to the asset class.
BII1217U/E-323050-958844
13
FOR INSTITUTIONAL, PROFESSIONAL AND QUALIFIED INVESTORS/CLIENTS. FOR PUBLIC DISTRIBUTION IN U.S.
M A R K E T S C O M M O D I T I E S A N D C U R R E N C I E S
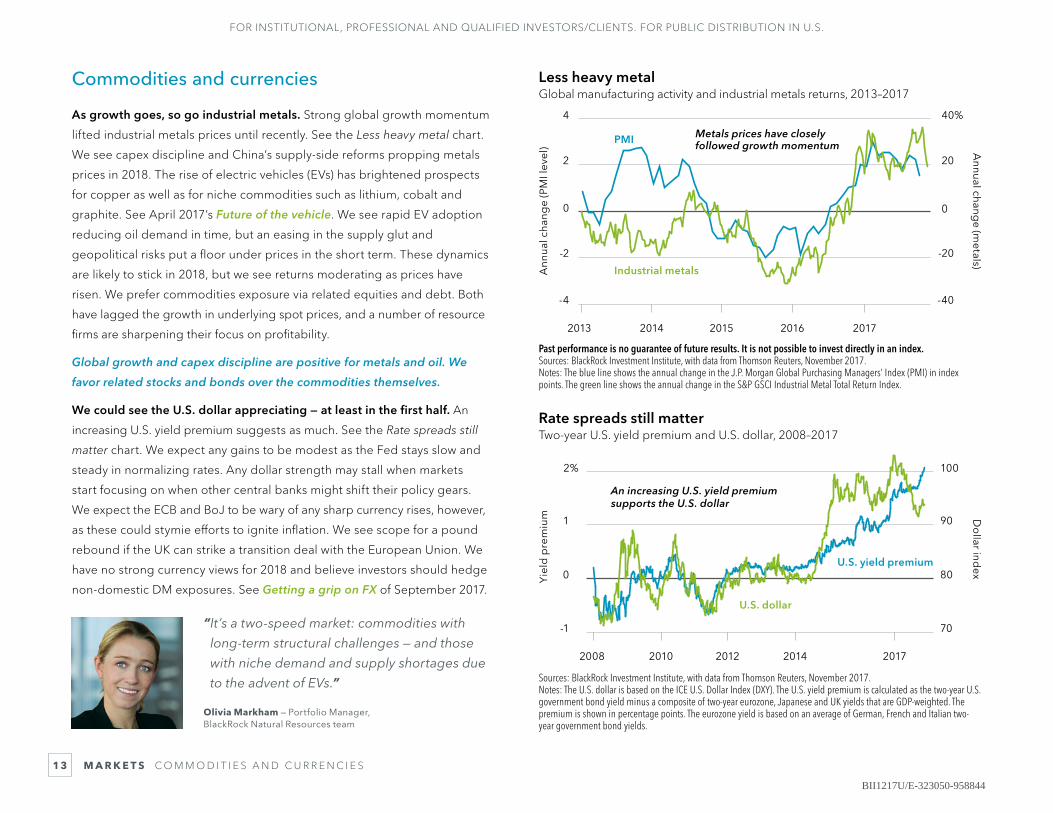
Rate spreads still matterTwo-year U.S. yield premium and U.S. dollar, 2008–2017
Yie
ld p
rem
ium
An increasing U.S. yield premium supports the U.S. dollar
Do
llar index
-1
0
1
2%
U.S. yield premium
20172014201220102008
70
80
90
100
U.S. dollar
Sources: BlackRock Investment Institute, with data from Thomson Reuters, November 2017.Notes: The U.S. dollar is based on the ICE U.S. Dollar Index (DXY). The U.S. yield premium is calculated as the two-year U.S. government bond yield minus a composite of two-year eurozone, Japanese and UK yields that are GDP-weighted. The premium is shown in percentage points. The eurozone yield is based on an average of German, French and Italian two-year government bond yields.
Less heavy metalGlobal manufacturing activity and industrial metals returns, 2013–2017
Ann
ual c
hang
e (P
MI l
evel
)
Metals prices have closely followed growth momentum A
nnual change (m
etals)
-4
-2
2
0
4
PMI
20172016201520142013
-40
-20
0
20
40%
Industrial metals
Past performance is no guarantee of future results. It is not possible to invest directly in an index. Sources: BlackRock Investment Institute, with data from Thomson Reuters, November 2017.Notes: The blue line shows the annual change in the J.P. Morgan Global Purchasing Managers’ Index (PMI) in index points. The green line shows the annual change in the S&P GSCI Industrial Metal Total Return Index.
Commodities and currencies
As growth goes, so go industrial metals. Strong global growth momentum
lifted industrial metals prices until recently. See the Less heavy metal chart.
We see capex discipline and China’s supply-side reforms propping metals
prices in 2018. The rise of electric vehicles (EVs) has brightened prospects
for copper as well as for niche commodities such as lithium, cobalt and
graphite. See April 2017’s Future of the vehicle. We see rapid EV adoption
reducing oil demand in time, but an easing in the supply glut and
geopolitical risks put a floor under prices in the short term. These dynamics
are likely to stick in 2018, but we see returns moderating as prices have
risen. We prefer commodities exposure via related equities and debt. Both
have lagged the growth in underlying spot prices, and a number of resource
firms are sharpening their focus on profitability.
Global growth and capex discipline are positive for metals and oil. We
favor related stocks and bonds over the commodities themselves.
We could see the U.S. dollar appreciating — at least in the first half. An
increasing U.S. yield premium suggests as much. See the Rate spreads still
matter chart. We expect any gains to be modest as the Fed stays slow and
steady in normalizing rates. Any dollar strength may stall when markets
start focusing on when other central banks might shift their policy gears.
We expect the ECB and BoJ to be wary of any sharp currency rises, however,
as these could stymie efforts to ignite inflation. We see scope for a pound
rebound if the UK can strike a transition deal with the European Union. We
have no strong currency views for 2018 and believe investors should hedge
non-domestic DM exposures. See Getting a grip on FX of September 2017.
“ It’s a two-speed market: commodities with
long-term structural challenges — and those
with niche demand and supply shortages due
to the advent of EVs.”
Olivia Markham — Portfolio Manager, BlackRock Natural Resources team
BII1217U/E-323050-958844
14
FOR INSTITUTIONAL, PROFESSIONAL AND QUALIFIED INVESTORS/CLIENTS. FOR PUBLIC DISTRIBUTION IN U.S.
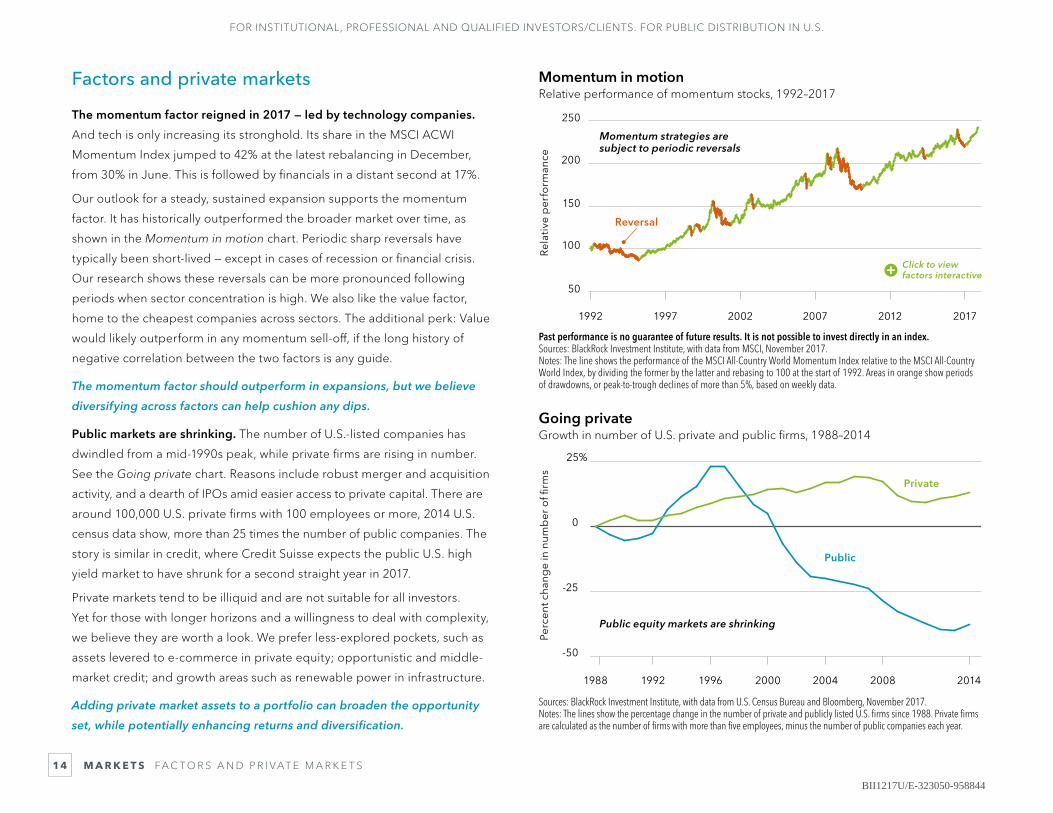
Momentum in motionRelative performance of momentum stocks, 1992–2017
Rel
ativ
e p
erfo
rman
ce
Momentum strategies are subject to periodic reversals
50
150
200
100
250
201720122007200219971992
Reversal
Past performance is no guarantee of future results. It is not possible to invest directly in an index.Sources: BlackRock Investment Institute, with data from MSCI, November 2017.Notes: The line shows the performance of the MSCI All-Country World Momentum Index relative to the MSCI All-Country World Index, by dividing the former by the latter and rebasing to 100 at the start of 1992. Areas in orange show periods of drawdowns, or peak-to-trough declines of more than 5%, based on weekly data.
Going privateGrowth in number of U.S. private and public firms, 1988–2014
Perc
ent c
hang
e in
num
ber
of fi
rms
-50
-25
0
25%
Public
Private
2014200820042000199619921988
Public equity markets are shrinking
Sources: BlackRock Investment Institute, with data from U.S. Census Bureau and Bloomberg, November 2017. Notes: The lines show the percentage change in the number of private and publicly listed U.S. firms since 1988. Private firms are calculated as the number of firms with more than five employees, minus the number of public companies each year.
M A R K E T S FA C T O R S A N D P R I VAT E M A R K E T S
Click to view factors interactive
Factors and private markets
The momentum factor reigned in 2017 — led by technology companies.
And tech is only increasing its stronghold. Its share in the MSCI ACWI
Momentum Index jumped to 42% at the latest rebalancing in December,
from 30% in June. This is followed by financials in a distant second at 17%.
Our outlook for a steady, sustained expansion supports the momentum
factor. It has historically outperformed the broader market over time, as
shown in the Momentum in motion chart. Periodic sharp reversals have
typically been short-lived — except in cases of recession or financial crisis.
Our research shows these reversals can be more pronounced following
periods when sector concentration is high. We also like the value factor,
home to the cheapest companies across sectors. The additional perk: Value
would likely outperform in any momentum sell-off, if the long history of
negative correlation between the two factors is any guide.
The momentum factor should outperform in expansions, but we believe
diversifying across factors can help cushion any dips.
Public markets are shrinking. The number of U.S.-listed companies has
dwindled from a mid-1990s peak, while private firms are rising in number.
See the Going private chart. Reasons include robust merger and acquisition
activity, and a dearth of IPOs amid easier access to private capital. There are
around 100,000 U.S. private firms with 100 employees or more, 2014 U.S.
census data show, more than 25 times the number of public companies. The
story is similar in credit, where Credit Suisse expects the public U.S. high
yield market to have shrunk for a second straight year in 2017.
Private markets tend to be illiquid and are not suitable for all investors.
Yet for those with longer horizons and a willingness to deal with complexity,
we believe they are worth a look. We prefer less-explored pockets, such as
assets levered to e-commerce in private equity; opportunistic and middle-
market credit; and growth areas such as renewable power in infrastructure.
Adding private market assets to a portfolio can broaden the opportunity
set, while potentially enhancing returns and diversification.
BII1217U/E-323050-958844
15
FOR INSTITUTIONAL, PROFESSIONAL AND QUALIFIED INVESTORS/CLIENTS. FOR PUBLIC DISTRIBUTION IN U.S.
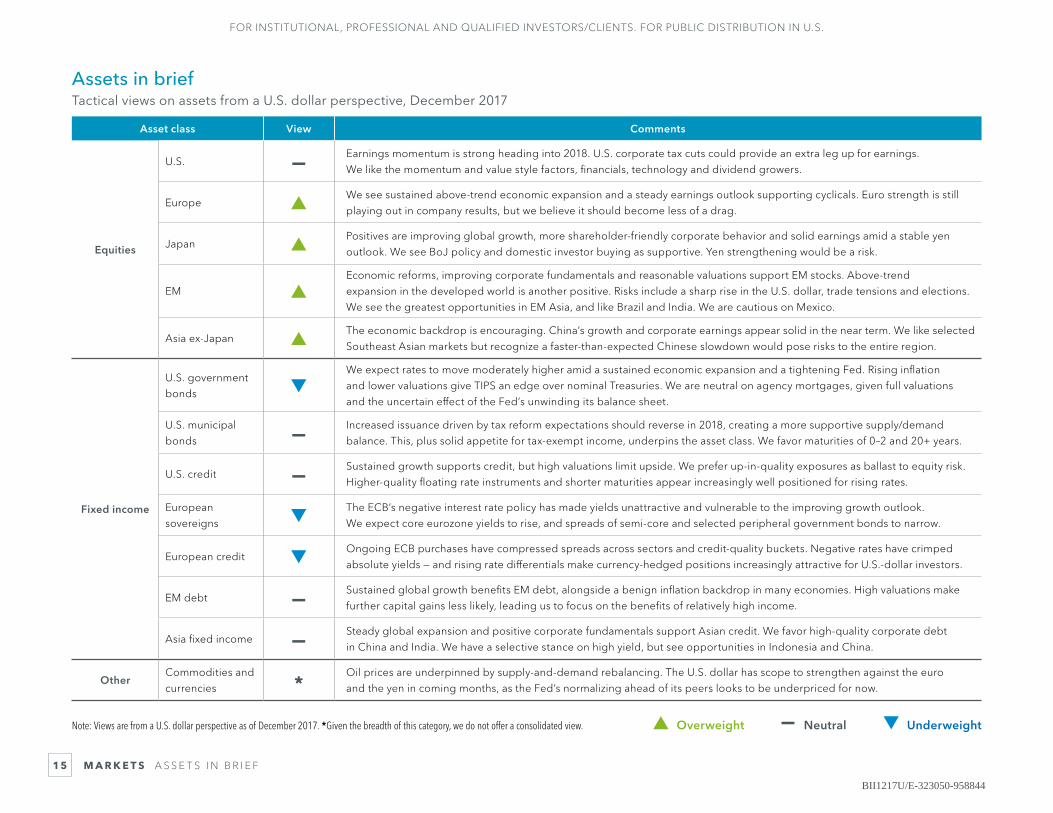
Assets in briefTactical views on assets from a U.S. dollar perspective, December 2017
M A R K E T S A S S E T S I N B R I E F
▲ Overweight — Neutral ▼ Underweight
Asset class View Comments
Equities
U.S. — Earnings momentum is strong heading into 2018. U.S. corporate tax cuts could provide an extra leg up for earnings.
We like the momentum and value style factors, financials, technology and dividend growers.
Europe ▲We see sustained above-trend economic expansion and a steady earnings outlook supporting cyclicals. Euro strength is still
playing out in company results, but we believe it should become less of a drag.
Japan ▲Positives are improving global growth, more shareholder-friendly corporate behavior and solid earnings amid a stable yen
outlook. We see BoJ policy and domestic investor buying as supportive. Yen strengthening would be a risk.
EM ▲Economic reforms, improving corporate fundamentals and reasonable valuations support EM stocks. Above-trend
expansion in the developed world is another positive. Risks include a sharp rise in the U.S. dollar, trade tensions and elections.
We see the greatest opportunities in EM Asia, and like Brazil and India. We are cautious on Mexico.
Asia ex-Japan ▲The economic backdrop is encouraging. China’s growth and corporate earnings appear solid in the near term. We like selected
Southeast Asian markets but recognize a faster-than-expected Chinese slowdown would pose risks to the entire region.
Fixed income
U.S. government
bonds ▼We expect rates to move moderately higher amid a sustained economic expansion and a tightening Fed. Rising inflation
and lower valuations give TIPS an edge over nominal Treasuries. We are neutral on agency mortgages, given full valuations
and the uncertain effect of the Fed’s unwinding its balance sheet.
U.S. municipal
bonds — Increased issuance driven by tax reform expectations should reverse in 2018, creating a more supportive supply/demand
balance. This, plus solid appetite for tax-exempt income, underpins the asset class. We favor maturities of 0–2 and 20+ years.
U.S. credit — Sustained growth supports credit, but high valuations limit upside. We prefer up-in-quality exposures as ballast to equity risk.
Higher-quality floating rate instruments and shorter maturities appear increasingly well positioned for rising rates.
European
sovereigns ▼The ECB’s negative interest rate policy has made yields unattractive and vulnerable to the improving growth outlook.
We expect core eurozone yields to rise, and spreads of semi-core and selected peripheral government bonds to narrow.
European credit ▼Ongoing ECB purchases have compressed spreads across sectors and credit-quality buckets. Negative rates have crimped
absolute yields — and rising rate differentials make currency-hedged positions increasingly attractive for U.S.-dollar investors.
EM debt — Sustained global growth benefits EM debt, alongside a benign inflation backdrop in many economies. High valuations make
further capital gains less likely, leading us to focus on the benefits of relatively high income.
Asia fixed income — Steady global expansion and positive corporate fundamentals support Asian credit. We favor high-quality corporate debt
in China and India. We have a selective stance on high yield, but see opportunities in Indonesia and China.
OtherCommodities and
currencies *Oil prices are underpinned by supply-and-demand rebalancing. The U.S. dollar has scope to strengthen against the euro
and the yen in coming months, as the Fed’s normalizing ahead of its peers looks to be underpriced for now.
Note: Views are from a U.S. dollar perspective as of December 2017. *Given the breadth of this category, we do not offer a consolidated view.
BII1217U/E-323050-958844

This material is prepared by BlackRock and is not intended to be relied upon as a forecast, research or investment advice, and is not a recommendation, offer or solicitation to buy or sell any securities or to adopt any investment strategy. The opinions expressed are as of December 2017 and may change as subsequent conditions vary. The information and opinions contained in this material are derived from proprietary and non-proprietary sources deemed by BlackRock to be reliable, are not necessarily all-inclusive and are not guaranteed as to accuracy. As such, no warranty of accuracy or reliability is given and no responsibility arising in any other way for errors and omissions (including responsibility to any person by reason of negligence) is accepted by BlackRock, its officers, employees or agents. This material may contain ‘forward-looking’ information that is not purely historical in nature. Such information may include, among other things, projections and forecasts. There is no guarantee that any forecasts made will come to pass. Reliance upon information in this material is at the sole discretion of the reader. This material is intended for informational purposes only and does not constitute investment advice or an offer or solicitation to purchase or sell in any securities, BlackRock funds or any investment strategy nor shall any securities be offered or sold to any person in any jurisdiction in which an offer, solicitation, purchase or sale would be unlawful under the securities laws of such jurisdiction. In the U.S., this material is intended for public distribution. In the EU, issued by BlackRock Investment Management (UK) Limited (authorised and regulated by the Financial Conduct Authority). Registered office: 12 Throgmorton Avenue, London, EC2N 2DL. Registered in England No. 2020394. Tel: 020 7743 3000. For your protection, telephone calls are usually recorded. BlackRock is a trading name of BlackRock Investment Management (UK) Limited. This material is for distribution to Professional Clients (as defined by the FCA Rules) and Qualified Investors and should not be relied upon by any other persons. For qualified investors in Switzerland, this material shall be exclusively made available to, and directed at, qualified investors as defined in the Swiss Collective Investment Schemes Act of 23 June 2006, as amended. Issued in the Netherlands by the Amsterdam branch office of BlackRock Investment Management (UK) Limited: Amstelplein 1, 1096 HA Amsterdam, Tel: 020 - 549 5200. In South Africa, please be advised that BlackRock Investment Management (UK) Limited is an authorised Financial Services provider with the South African Financial Services Board, FSP No. 43288. In Dubai: This information can be distributed in and from the Dubai International Financial Centre (DIFC) by BlackRock Advisors (UK) Limited — Dubai Branch which is regulated by the Dubai Financial Services Authority (‘DFSA’) and is only directed at ‘Professional Clients’ and no other person should rely upon the information contained within it. Neither the DFSA or any other authority or regulator located in the GCC or MENA region has approved this information. This information and associated materials have been provided to you at your express request, and for your exclusive use. This document is not intended for distribution to, or use by, any person or entity in any jurisdiction or country where such distribution would be unlawful under the securities laws of such. Any distribution, by whatever means, of this document and related material to persons other than those referred to above is strictly prohibited. In Singapore, this is issued by BlackRock (Singapore) Limited (Co. registration no. 200010143N). In Hong Kong, this material is issued by BlackRock Asset Management North Asia Limited and has not been reviewed by the Securities and Futures Commission of Hong Kong. In Korea, this material is for Professional Investors only. In Japan, this is issued by BlackRock Japan. Co., Ltd. (Financial Instruments Business Operator: The Kanto Regional Financial Bureau. License No375, Association Memberships: Japan Investment Advisers Association, the Investment Trusts Association, Japan, Japan Securities Dealers Association, Type II Financial Instruments Firms Association.) for Professional Investors only (Professional Investor is defined in Financial Instruments and Exchange Act). In Taiwan, independently operated by BlackRock Investment Management (Taiwan) Limited. Address: 28/F, No. 95, Tun Hwa South Road, Section 2, Taipei 106, Taiwan. Tel: (02)23261600. In Australia, issued by BlackRock Investment Management (Australia) Limited ABN 13 006 165 975, AFSL 230 523 (BIMAL). This material is not a securities recommendation or an offer or solicitation with respect to the purchase or sale of any securities in any jurisdiction. The material provides general information only and does not take into account your individual objectives, financial situation, needs or circumstances. Before making any investment decision, you should therefore assess whether the material is appropriate for you and obtain financial advice tailored to you having regard to your individual objectives, financial situation, needs and circumstances. BIMAL, its officers, employees and agents believe that the information in this material and the sources on which it is based (which may be sourced from third parties) are correct as at the date of publication. While every care has been taken in the preparation of this material, no warranty of accuracy or reliability is given and no responsibility for the information is accepted by BIMAL, its officers, employees or agents. Any investment is subject to investment risk, including delays on the payment of withdrawal proceeds and the loss of income or the principal invested. While any forecasts, estimates and opinions in this material are made on a reasonable basis, actual future results and operations may differ materially from the forecasts, estimates and opinions set out in this material. No guarantee as to the repayment of capital or the performance of any product or rate of return referred to in this material is made by BIMAL or any entity in the BlackRock group of companies. In China, this material may not be distributed to individuals resident in the People's Republic of China ("PRC", for such purposes, excluding Hong Kong, Macau and Taiwan) or entities registered in the PRC unless such parties have received all the required PRC government approvals to participate in any investment or receive any investment advisory or investment management services. For other APAC countries, this material is issued for Institutional Investors only (or professional/sophisticated/qualified investors, as such term may apply in local jurisdictions) and does not constitute investment advice or an offer or solicitation to purchase or sell in any securities, BlackRock funds or any investment strategy nor shall any securities be offered or sold to any person in any jurisdiction in which an offer, solicitation, purchase or sale would be unlawful under the securities laws of such jurisdiction. In Canada, this material is intended for permitted clients only. In Latin America and Iberia, this material is for educational purposes only and does not constitute investment advice nor an offer or solicitation to sell or a solicitation of an offer to buy any shares of any fund (nor shall any such shares be offered or sold to any person) in any jurisdiction in which an offer, solicitation, purchase or sale would be unlawful under the securities law of that jurisdiction. If any funds are mentioned or inferred to in this material, it is possible that some or all of the funds have not been registered with the securities regulator of Brazil, Chile, Colombia, Mexico, Panama, Peru, Portugal, Spain, Uruguay or any other securities regulator in any Latin American country and thus might not be publicly offered within any such country. The securities regulators of such countries have not confirmed the accuracy of any information contained herein. The information provided here is neither tax nor legal advice. Investors should speak to their tax professional for specific information regarding their tax situation. Investment involves risk including possible loss of principal. International investing involves risks, including risks related to foreign currency, limited liquidity, less government regulation, and the possibility of substantial volatility due to adverse political, economic or other developments. These risks are often heightened for investments in emerging/developing markets or smaller capital markets.
©2017 BlackRock, Inc. All Rights Reserved. BLACKROCK is a registered trademark of BlackRock, Inc. All other trademarks are those of their respective owners.
Lit. No. BII-OUTLOOK-2018 56120-1217
The BlackRock Investment Institute (BII) provides connectivity between BlackRock’s portfolio managers,
originates market research and publishes insights. Our goals are to help our fund managers become
better investors and to produce thought-provoking content for clients and policymakers.
BII1217U/E-323050-958844