global innovation competitive index (innovation capacity of 22 major economies)
DESCRIPTION
Global Innovation Competitive Index (GICI) is a holistic index comprised of 16 indicators categorized into 9 sub-categories and 3 major categories namely resources for innovation, infrastructure for innovation, and efficiency of innovation. GICI presently analyzes innovation competency and competitiveness of 22 major economiesTRANSCRIPT

1 INNOVACCER GLOBAL INNOVATION COMPETITIVE INDEX www.innovaccer.com
KANAV Grizli777
[Pick the date]
Global Innovation Competitive Index Innovation Capacity of 22 major economies This report aims at studying innovation capacity of major economies. A country needs resources, infrastructure support, and efficiency to innovate. Using a list of 16 indicators in three categories, we define a country’s capacity and competence to innovate. This index does not reflect absolute capacity but a capacity normalized to its economy (GDP, GNI) and population.

2 INNOVACCER GLOBAL INNOVATION COMPETITIVE INDEX www.innovaccer.com
EXECUTIVE SUMMARY
Innovation is an overly talked about term in today’s globalized and inter-
connected world. Credit goes to the nations which aligned innovation
strategies to benefit their economic growth and competitive advantage.
We at INNOVACCER closely work with innovation stakeholders
including professors conducting research on innovation, governmental
organizations associated with innovation, technology corporate and
start-ups. Working towards our vision of assisting in India’s and global
innovation ecosystem, we provide the world with a series of reports and
data on innovation. This report happens to be one of them.
Here, we try to analyze Innovation Competitiveness of a country by
providing a holistic index of 16 indicators categorized into resources for
innovation, infrastructure for innovation, and efficiency of innovation.
Global Innovation Index developed by INSEAD and BCG were attempts
to understand innovation as a whole. With this Global Innovation
Competitive Index developed by INNOVACCER, we try to understand
resources, support system, and efficiency of innovation for a country.
Being more specific to technology innovations, this index will support
policymakers and strategists to devise strategies in aligning their
technology innovation, intellectual property laws, research expenditure
and research institutions for benefit of the economy.
We promise to contribute further in this research, improve with every
attempt, and come closer to understanding innovation and economic
dynamics. We also hope that researchers benefit from this research
and take a lead forward to develop more sophisticated tools to
understand innovation.
Kanav Hasija
Chief Research & Strategy Officer
INNOVACCER
© INNOVACCER 2011-12. All
Rights Reserved.
For queries, please
visit our FAQ page
http://www.innovacc
er.com/reports/faqs/
For media, data requests,
recommendations, suggestions,
or feedbacks, please e-mail at:
+91 (11) 40537968
DISCLAIMER
Public Data: Use of publically
available data or data collected
from external sources without
the permission of
INNOVACCER is not prohibited.
Copyright Work:
Graphs, Charts, Tables,
Representations, and matrices
introduced in this report are
rights of INNOVACCER. Using
any of above mentioned items
without consent of
INNOVACCER is prohibited.
Academic Domain:
Academicians for the purpose
of academic awareness or
research can use data available
in this report provided they
properly cite this report and give
credit to INNOVACCER.

3 INNOVACCER GLOBAL INNOVATION COMPETITIVE INDEX www.innovaccer.com
TABLE OF CONTENT
Executive Summary …………… 2
Introduction …………… 4
Innovation Ecosystem …………… 5
Global Innovation Competitive Index (GICI) …………… 6
Data and Methodology …………… 7
GICI at a Glance (2003-2008) …………… 8
GICI 2008 Top 5 Countries indicator-wise …………… 9
Use of GICI …………… 10
Country Profiles - GICI …………… 11
Austria, Belgium, Brazil, Canada …………… 12 - 15
China, Denmark, Finland, France …………… 16 - 19
Germany, Hungary, India, Ireland …………… 20 - 23
Japan, Korea, Norway, Poland …………… 24 - 27
Russia, Singapore, Spain, Sweden …………… 28 - 31
United Kingdom, United States …………… 32 - 33
About INNOVACCER …………… 34
INNOVACCER Research …………… 34

4 INNOVACCER GLOBAL INNOVATION COMPETITIVE INDEX www.innovaccer.com
:
INNOVATION has been the buzz word
globally since the past decade after empirical
evidence of innovation’s contribution to economic
growth for some countries. Also, 80% of total assets
of S&P 500 companies are intangible in nature.
There are many definitions of innovation in the
marketplace. We define innovation on similar lines to
Vijay Govindrajan and Chris Temple, two great
scholars & leaders in the field of innovation
management. According to them, Creativity is about
coming up with a big idea, but Innovation is about
executing the idea. That’s what differentiates
Inventions (new idea) and Innovation (Use of new
idea).
Use of new idea or method
to improve or create new or
more effective products,
processes, services,
technologies, or ideas.
CAN WE MEASURE INNOVATION? This would be one of the most controversial questions of this era and the answer
is yes and no. Firstly, Innovation is a random process and you don’t know when
the next innovation is going to happen. Thus, we for sure cannot predict the time
for next big innovation. Now, can we measure innovation outputs and growth? The
answer is yes, but with some limitations. We cannot measure all innovations as
some of them take place at a very micro level which is either undetectable or
information regarding those inventions do not enter the public domain. Whereas,
technological innovations that are likely to be patented are under the radar of
published patent applications or annual patent filing trends.
Best way to measure a country’s innovation is not measure innovation itself, but
its drivers, support system, and efficiency or output generated from it

5 INNOVACCER GLOBAL INNOVATION COMPETITIVE INDEX www.innovaccer.com
1
1 Porter, Michael E. & Stern, Scott (1999), The New Challenge to America’s Prosperity: Findings from the Innovation
Index, Council on Competitiveness, Washington, D.C., Mar 1999.
WHAT DRIVES INNOVATION?
Measuring innovation output is one way of measuring
innovation success for a nation. Though, policy
makers and corporate are more interested in what
drives innovation and how to improve their support
systems for such a drive? The answer lies in the
competitiveness report on Innovation by Porter and
Stern in 1999.1 They found a direct correlation of these
factors with success of nation’s innovation system:
Size of R&D labor force
Amount of R&D investments
Resources devoted to higher education
National Policy on Innovation
Sustainable Innovation Ecosystem is required for a
nation to prosper with its innovative activities. The
most simplistic structure of an innovation ecosystem
which can be sustainable over a period of time is
depicted to the left. Commercial Economy pulls out a
share of its revenues or profits to spend in Research &
Development which in turn generates innovation that
is economically beneficial, and a sustainable
innovation ecosystem is one in which economic
benefits of innovation surpasses the expenditure on
research and development.

6 INNOVACCER GLOBAL INNOVATION COMPETITIVE INDEX www.innovaccer.com
GLOBAL INNOVATION COMPETITIVE INDEX
(GICI)
A country is competitive to innovate if it has a rich resource of researchers and R&D
expenditure at the very first instance. Then, it needs education system to generate a
continuous quantity and quality of researchers. Support system from the government
like energy, information & communication technology, and economic freedom plays an
important role in research support and infrastructure ecosystem. Finally, efficiency and
outputs of innovation also depicts competitiveness of a country to innovate. Keeping all
these indicators and measures in mind, we have designed a Global Innovation
Competitive Index (GICI) as illustrated below. GICI has 3 major categories and 9 sub-
categories totaling to 16 innovation indicators.

7 INNOVACCER GLOBAL INNOVATION COMPETITIVE INDEX www.innovaccer.com
DATA AND METHODOLOGY
Most of the indicators were taken from World Bank Indicators database.2 Data relating
to number of resident patent application was extracted from WIPO Patent Statistics.3
While economic freedom was extracted from Heritage Foundation Index of Economic
Freedom.4
All indicators were normalized between 50 and 100. Weighted average of these
indicators in their major category gave us final index of that major category. Each of the
three major categories: Resources, Infrastructure, and Efficiency carried equal weights
in our analysis and thus their average gives us final GICI Index. Weights of each
indicator are mentioned below.
INDICATOR WEIGHT
Resources 1
Enrollment % (Secondary School) 1
Researchers per million people 2
R&D% of GDP 2
Adjusted Savings: Education Expenditure (% of GNI) 1
Infrastructure 1
Energy Use (kg. oil equivalent/population) 1
Telephone Lines (per 100 people) 0.33
Internet Users (per 100 people) 0.33
Mobile Users (per 100 people) 0.33
Innovation Economic Freedom 1
Efficiency 1
Patent(Resident) per Researcher 3
S&T Journal Articles per Researchers 1
S&T Journal Articles per R&D (in million US$ PPP) 1
Patent(Resident) per R&D (in million$ PPP) 3
High Tech Exports (% of Total Exports) 2
GDP Growth Percentage 2
2 http://data.worldbank.org/indicator
3 http://www.wipo.int/ipstats/en/statistics/patents/
4http://www.heritage.org/Index/Explore?view=by-region-country-year. For economic freedom, we choose Fiscal,
Business, Investment, and Financial Freedom as relevant indicators developed by Heritage Foundation for innovation. Economic
Freedom used in this index is average of these above mentioned four indicators.
8 INNOVACCER GLOBAL INNOVATION COMPETITIVE INDEX www.innovaccer.com
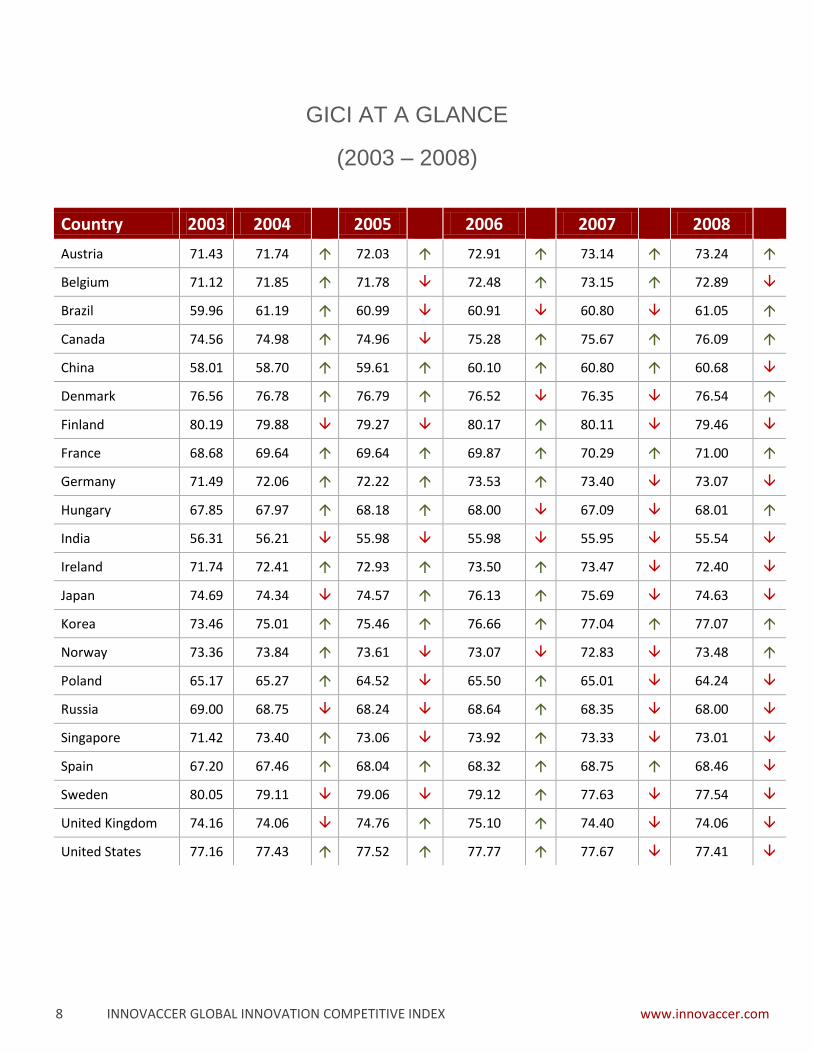
GICI AT A GLANCE
(2003 – 2008)
Country 2003 2004
2005
2006
2007
2008
Austria 71.43 71.74 72.03 72.91 73.14 73.24
Belgium 71.12 71.85 71.78 72.48 73.15 72.89
Brazil 59.96 61.19 60.99 60.91 60.80 61.05
Canada 74.56 74.98 74.96 75.28 75.67 76.09
China 58.01 58.70 59.61 60.10 60.80 60.68
Denmark 76.56 76.78 76.79 76.52 76.35 76.54
Finland 80.19 79.88 79.27 80.17 80.11 79.46
France 68.68 69.64 69.64 69.87 70.29 71.00
Germany 71.49 72.06 72.22 73.53 73.40 73.07
Hungary 67.85 67.97 68.18 68.00 67.09 68.01
India 56.31 56.21 55.98 55.98 55.95 55.54
Ireland 71.74 72.41 72.93 73.50 73.47 72.40
Japan 74.69 74.34 74.57 76.13 75.69 74.63
Korea 73.46 75.01 75.46 76.66 77.04 77.07
Norway 73.36 73.84 73.61 73.07 72.83 73.48
Poland 65.17 65.27 64.52 65.50 65.01 64.24
Russia 69.00 68.75 68.24 68.64 68.35 68.00
Singapore 71.42 73.40 73.06 73.92 73.33 73.01
Spain 67.20 67.46 68.04 68.32 68.75 68.46
Sweden 80.05 79.11 79.06 79.12 77.63 77.54
United Kingdom 74.16 74.06 74.76 75.10 74.40 74.06
United States 77.16 77.43 77.52 77.77 77.67 77.41

1 INNOVACCER GLOBAL INNOVATION COMPETITIVE INDEX www.innovaccer.com
GICI 2008 TOP 5 INDICATOR – WISE
50 60 70 80 90 100
Ireland
Sweden
Belgium
Norway
Denmark
Education
50 60 70 80 90 100
Norway
Japan
Denmark
Singapore
Finland
Researchers
50.0 60.0 70.0 80.0 90.0 100.0
United States
Korea, Rep.
Finland
Japan
Sweden
R&D Expenditure
50 60 70 80 90 100
Austria
Norway
Finland
United States
Canada
Energy Use
50 60 70 80 90 100
Norway
United Kingdom
Denmark
Sweden
Germany
ICT
50 60 70 80 90 100
Russia
United States
Canada
United Kingdom
Ireland
Economic Freedom
50 60 70 80 90 100
United Kingdom
Hungary
Poland
Japan
Korea, Rep.
Patent Efficiency
50 60 70 80 90 100
United Kingdom
Ireland
Korea, Rep.
Sweden
Canada
S&T Journal Efficiency
50 60 70 80 90 100
United States
Brazil
Korea, Rep.
Singapore
China
Innovation Economic Efficiency

10 INNOVACCER GLOBAL INNOVATION COMPETITIVE INDEX www.innovaccer.com
USE OF GICI
Global Innovation Competitive Index at a broader level can be used to track a country’s
innovation capacity and competency. Also, it gives a deeper understanding on
performance of innovation drivers and support system.
Government
Keep track of all nine sub-categories over the years and make policies to
improve condition of any indicator which is performing poorly for more than two
consecutive years
Find Correlation between each indicator in their own jurisdiction. Growth or fall
of an indicator might be affecting other indicator’s growth or fall over the years in
a particular country and these correlations will not be uniform for all economies,
thus have to be performed country-wise.
National Innovation Strategy roadmap for a country takes into account current
short-term and long-term goals and benefits for a country. It must also take into
account strategies to improve conditions of these indicators over time for creation
of an inclusive and sustainable innovation ecosystem.
Corporate
Location of Global Research Centers is a strategic decision for corporate
based on many factors including tax, economic freedom, political & legal
environment. Research Centre’s location must also be based on some of the
GICI indicators like Energy Use (for energy use intensive research), researchers,
patent efficiency and economic freedom.
Become a part of Country’s Innovation Ecosystem. Become proactive in
contributing or taking part in efforts to improve poorly performing indicators in
GICI.

11 INNOVACCER GLOBAL INNOVATION COMPETITIVE INDEX www.innovaccer.com
COUNTRY PROFILES
22 Countries. 6 Years.
12 INNOVACCER GLOBAL INNOVATION COMPETITIVE INDEX www.innovaccer.com
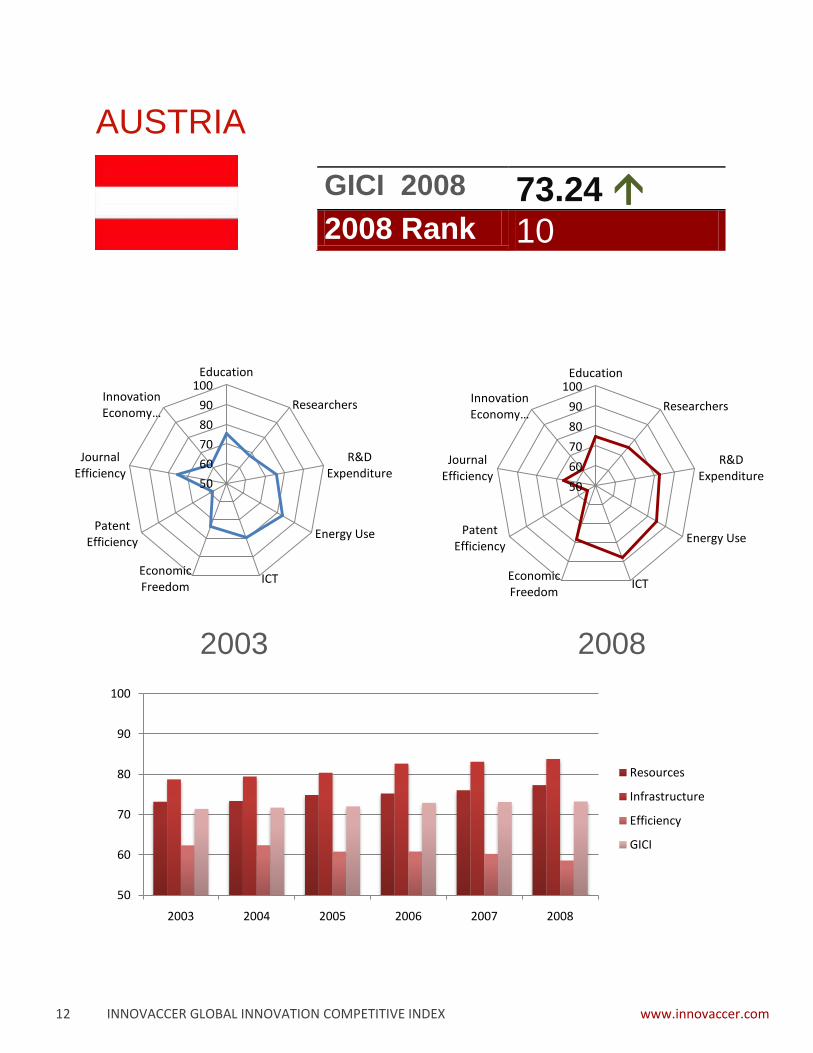
AUSTRIA
2003 2008
50
60
70
80
90
100
2003 2004 2005 2006 2007 2008
Resources
Infrastructure
Efficiency
GICI
GICI 2008 73.24 2008 Rank 10
50
60
70
80
90
100Education
Researchers
R&D Expenditure
Energy Use
ICTEconomic Freedom
Patent Efficiency
Journal Efficiency
Innovation Economy …
50
60
70
80
90
100Education
Researchers
R&D Expenditure
Energy Use
ICTEconomic Freedom
Patent Efficiency
Journal Efficiency
Innovation Economy …

13 INNOVACCER GLOBAL INNOVATION COMPETITIVE INDEX www.innovaccer.com
BELGIUM
2003 2008
50
60
70
80
90
100
2003 2004 2005 2006 2007 2008
Resources
Infrastructure
Efficiency
GICI
GICI 2008 72.89 2008 Rank 13
50
60
70
80
90
100Education
Researchers
R&D Expenditure
Energy Use
ICTEconomic Freedom
Patent Efficiency
Journal Efficiency
Innovation Economy Efficiency
50
60
70
80
90
100Education
Researchers
R&D Expenditure
Energy Use
ICTEconomic Freedom
Patent Efficiency
Journal Efficiency
Innovation Economy Efficiency

14 INNOVACCER GLOBAL INNOVATION COMPETITIVE INDEX www.innovaccer.com
BRAZIL
2003 2008
50
60
70
80
90
100
2003 2004 2005 2006 2007 2008
Resources
Infrastructure
Efficiency
GICI
GICI 2008 61.05 2008 Rank 20
50
60
70
80
90
100Education
Researchers
R&D Expenditure
Energy Use
ICTEconomic Freedom
Patent Efficiency
Journal Efficiency
Innovation Economy Efficiency
50
60
70
80
90
100Education
Researchers
R&D Expenditure
Energy Use
ICTEconomic Freedom
Patent Efficiency
Journal Efficiency
Innovation Economy Efficiency

15 INNOVACCER GLOBAL INNOVATION COMPETITIVE INDEX www.innovaccer.com
CANADA
2003 2008
50
60
70
80
90
100
2003 2004 2005 2006 2007 2008
Resources
Infrastructure
Efficiency
GICI
GICI 2008 76.09 2008 Rank 6
50
60
70
80
90
100Education
Researchers
R&D Expenditure
Energy Use
ICTEconomic Freedom
Patent Efficiency
Journal Efficiency
Innovation Economy Efficiency
50
60
70
80
90
100Education
Researchers
R&D Expenditure
Energy Use
ICTEconomic Freedom
Patent Efficiency
Journal Efficiency
Innovation Economy Efficiency

16 INNOVACCER GLOBAL INNOVATION COMPETITIVE INDEX www.innovaccer.com
CHINA
2003 2008
50
60
70
80
90
100
2003 2004 2005 2006 2007 2008
Resources
Infrastructure
Efficiency
GICI
GICI 2008 60.68 2008 Rank 21
50
60
70
80
90
100Education
Researchers
R&D Expenditure
Energy Use
ICTEconomic Freedom
Patent Efficiency
Journal Efficiency
Innovation Economy Efficiency
50
60
70
80
90
100Education
Researchers
R&D Expenditure
Energy Use
ICTEconomic Freedom
Patent Efficiency
Journal Efficiency
Innovation Economy Efficiency

17 INNOVACCER GLOBAL INNOVATION COMPETITIVE INDEX www.innovaccer.com
DENMARK
2003 2008
50
60
70
80
90
100
2003 2004 2005 2006 2007 2008
Resources
Infrastructure
Efficiency
GICI
GICI 2008 76.54 2008 Rank 5
50
60
70
80
90
100Education
Researchers
R&D Expenditure
Energy Use
ICTEconomic Freedom
Patent Efficiency
Journal Efficiency
Innovation Economy Efficiency
50
60
70
80
90
100Education
Researchers
R&D Expenditure
Energy Use
ICTEconomic Freedom
Patent Efficiency
Journal Efficiency
Innovation Economy Efficiency

18 INNOVACCER GLOBAL INNOVATION COMPETITIVE INDEX www.innovaccer.com
FINLAND
2003 2008
50
60
70
80
90
100
2003 2004 2005 2006 2007 2008
Resources
Infrastructure
Efficiency
GICI
GICI 2008 79.46 2008 Rank 1
50
60
70
80
90
100Education
Researchers
R&D Expenditure
Energy Use
ICTEconomic Freedom
Patent Efficiency
Journal Efficiency
Innovation Economy Efficiency
50
60
70
80
90
100Education
Researchers
R&D Expenditure
Energy Use
ICTEconomic Freedom
Patent Efficiency
Journal Efficiency
Innovation Economy Efficiency

19 INNOVACCER GLOBAL INNOVATION COMPETITIVE INDEX www.innovaccer.com
FRANCE
2003 2008
50
60
70
80
90
100
2003 2004 2005 2006 2007 2008
Resources
Infrastructure
Efficiency
GICI
GICI 2008 71.00 2008 Rank 15
50
60
70
80
90
100Education
Researchers
R&D Expenditure
Energy Use
ICTEconomic Freedom
Patent Efficiency
Journal Efficiency
Innovation Economy Efficiency
50
60
70
80
90
100Education
Researchers
R&D Expenditure
Energy Use
ICTEconomic Freedom
Patent Efficiency
Journal Efficiency
Innovation Economy Efficiency

20 INNOVACCER GLOBAL INNOVATION COMPETITIVE INDEX www.innovaccer.com
GERMANY
2003 2008
50
60
70
80
90
100
2003 2004 2005 2006 2007 2008
Resources
Infrastructure
Efficiency
GICI
GICI 2008 73.07 2008 Rank 11
50
60
70
80
90
100Education
Researchers
R&D Expenditure
Energy Use
ICTEconomic Freedom
Patent Efficiency
Journal Efficiency
Innovation Economy Efficiency
50
60
70
80
90
100Education
Researchers
R&D Expenditure
Energy Use
ICTEconomic Freedom
Patent Efficiency
Journal Efficiency
Innovation Economy Efficiency

21 INNOVACCER GLOBAL INNOVATION COMPETITIVE INDEX www.innovaccer.com
HUNGARY
2003 2008
50
60
70
80
90
100
2003 2004 2005 2006 2007 2008
Resources
Infrastructure
Efficiency
GICI
GICI 2008 68.01 2008 Rank 17
50
60
70
80
90
100Education
Researchers
R&D Expenditure
Energy Use
ICTEconomic Freedom
Patent Efficiency
Journal Efficiency
Innovation Economy Efficiency
50
60
70
80
90
100Education
Researchers
R&D Expenditure
Energy Use
ICTEconomic Freedom
Patent Efficiency
Journal Efficiency
Innovation Economy Efficiency

22 INNOVACCER GLOBAL INNOVATION COMPETITIVE INDEX www.innovaccer.com
INDIA
2003 2008
50
60
70
80
90
100
2003 2004 2005 2006 2007 2008
Resources
Infrastructure
Efficiency
GICI
GICI 2008 55.54 2008 Rank 22
50
60
70
80
90
100Education
Researchers
R&D Expenditure
Energy Use
ICTEconomic Freedom
Patent Efficiency
Journal Efficiency
Innovation Economy Efficiency
50
60
70
80
90
100Education
Researchers
R&D Expenditure
Energy Use
ICTEconomic Freedom
Patent Efficiency
Journal Efficiency
Innovation Economy Efficiency
23 INNOVACCER GLOBAL INNOVATION COMPETITIVE INDEX www.innovaccer.com
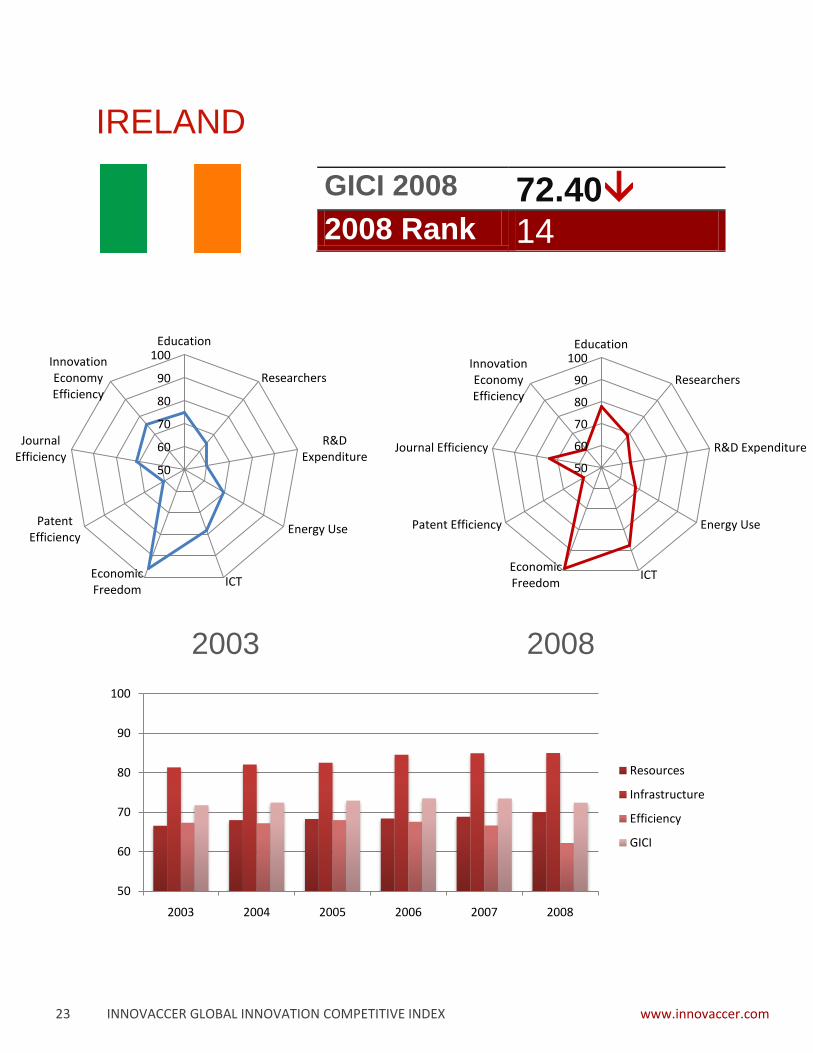
IRELAND
2003 2008
50
60
70
80
90
100
2003 2004 2005 2006 2007 2008
Resources
Infrastructure
Efficiency
GICI
GICI 2008 72.40 2008 Rank 14
50
60
70
80
90
100Education
Researchers
R&D Expenditure
Energy Use
ICTEconomic Freedom
Patent Efficiency
Journal Efficiency
Innovation Economy Efficiency
50
60
70
80
90
100Education
Researchers
R&D Expenditure
Energy Use
ICTEconomic Freedom
Patent Efficiency
Journal Efficiency
Innovation Economy Efficiency

24 INNOVACCER GLOBAL INNOVATION COMPETITIVE INDEX www.innovaccer.com
JAPAN
2003 2008
50
60
70
80
90
100
2003 2004 2005 2006 2007 2008
Resources
Infrastructure
Efficiency
GICI
GICI 2008 74.63 2008 Rank 7
50
60
70
80
90
100Education
Researchers
R&D Expenditure
Energy Use
ICTEconomic Freedom
Patent Efficiency
Journal Efficiency
Innovation Economy Efficiency
50
60
70
80
90
100Education
Researchers
R&D Expenditure
Energy Use
ICTEconomic Freedom
Patent Efficiency
Journal Efficiency
Innovation Economy Efficiency

25 INNOVACCER GLOBAL INNOVATION COMPETITIVE INDEX www.innovaccer.com
KOREA
2003 2008
50
60
70
80
90
100
2003 2004 2005 2006 2007 2008
Resources
Infrastructure
Efficiency
GICI
GICI 2008 77.07 2008 Rank 4
50
60
70
80
90
100Education
Researchers
R&D Expenditure
Energy Use
ICTEconomic Freedom
Patent Efficiency
Journal Efficiency
Innovation Economy Efficiency
50
60
70
80
90
100Education
Researchers
R&D Expenditure
Energy Use
ICTEconomic Freedom
Patent Efficiency
Journal Efficiency
Innovation Economy Efficiency

26 INNOVACCER GLOBAL INNOVATION COMPETITIVE INDEX www.innovaccer.com
NORWAY
2003 2008
50
60
70
80
90
100
2003 2004 2005 2006 2007 2008
Resources
Infrastructure
Efficiency
GICI
GICI 2008 73.48 2008 Rank 9
50
60
70
80
90
100Education
Researchers
R&D Expenditure
Energy Use
ICTEconomic Freedom
Patent Efficiency
Journal Efficiency
Innovation Economy Efficiency
50
60
70
80
90
100Education
Researchers
R&D Expenditure
Energy Use
ICTEconomic Freedom
Patent Efficiency
Journal Efficiency
Innovation Economy Efficiency

27 INNOVACCER GLOBAL INNOVATION COMPETITIVE INDEX www.innovaccer.com
POLAND
2003 2008
50
60
70
80
90
100
2003 2004 2005 2006 2007 2008
Resources
Infrastructure
Efficiency
GICI
GICI 2008 64.24 2008 Rank 19
50
60
70
80
90
100Education
Researchers
R&D Expenditure
Energy Use
ICTEconomic Freedom
Patent Efficiency
Journal Efficiency
Innovation Economy Efficiency
50
60
70
80
90
100Education
Researchers
R&D Expenditure
Energy Use
ICTEconomic Freedom
Patent Efficiency
Journal Efficiency
Innovation Economy Efficiency

28 INNOVACCER GLOBAL INNOVATION COMPETITIVE INDEX www.innovaccer.com
RUSSIA
2003 2008
50
60
70
80
90
100
2003 2004 2005 2006 2007 2008
Resources
Infrastructure
Efficiency
GICI
GICI 2008 68.00 2008 Rank 18
50
60
70
80
90
100Education
Researchers
R&D Expenditure
Energy Use
ICTEconomic Freedom
Patent Efficiency
Journal Efficiency
Innovation Economy Efficiency
50
60
70
80
90
100Education
Researchers
R&D Expenditure
Energy Use
ICTEconomic Freedom
Patent Efficiency
Journal Efficiency
Innovation Economy Efficiency

29 INNOVACCER GLOBAL INNOVATION COMPETITIVE INDEX www.innovaccer.com
SINGAPORE
2003 2008
50
60
70
80
90
100
2003 2004 2005 2006 2007 2008
Resources
Infrastructure
Efficiency
GICI
GICI 2008 73.01 2008 Rank 12
50
60
70
80
90
100Education
Researchers
R&D Expenditure
Energy Use
ICTEconomic Freedom
Patent Efficiency
Journal Efficiency
Innovation Economy Efficiency
50
60
70
80
90
100Education
Researchers
R&D Expenditure
Energy Use
ICTEconomic Freedom
Patent Efficiency
Journal Efficiency
Innovation Economy Efficiency

30 INNOVACCER GLOBAL INNOVATION COMPETITIVE INDEX www.innovaccer.com
SPAIN
2003 2008
50
60
70
80
90
100
2003 2004 2005 2006 2007 2008
Resources
Infrastructure
Efficiency
GICI
GICI 2008 68.46 2008 Rank 16
50
60
70
80
90
100Education
Researchers
R&D Expenditure
Energy Use
ICTEconomic Freedom
Patent Efficiency
Journal Efficiency
Innovation Economy Efficiency
50
60
70
80
90
100Education
Researchers
R&D Expenditure
Energy Use
ICTEconomic Freedom
Patent Efficiency
Journal Efficiency
Innovation Economy Efficiency

31 INNOVACCER GLOBAL INNOVATION COMPETITIVE INDEX www.innovaccer.com
SWEDEN
2003 2008
50
60
70
80
90
100
2003 2004 2005 2006 2007 2008
Resources
Infrastructure
Efficiency
GICI
GICI 2008 77.54 2008 Rank 2
50
60
70
80
90
100Education
Researchers
R&D Expenditure
Energy Use
ICTEconomic Freedom
Patent Efficiency
Journal Efficiency
Innovation Economy Efficiency
50
60
70
80
90
100Education
Researchers
R&D Expenditure
Energy Use
ICTEconomic Freedom
Patent Efficiency
Journal Efficiency
Innovation Economy Efficiency

32 INNOVACCER GLOBAL INNOVATION COMPETITIVE INDEX www.innovaccer.com
UNITED KINGDOM
2003 2008
50
60
70
80
90
100
2003 2004 2005 2006 2007 2008
Resources
Infrastructure
Efficiency
GICI
GICI 2008 74.06 2008 Rank 8
50
60
70
80
90
100Education
Researchers
R&D Expenditure
Energy Use
ICTEconomic Freedom
Patent Efficiency
Journal Efficiency
Innovation Economy Efficiency
50
60
70
80
90
100Education
Researchers
R&D Expenditure
Energy Use
ICTEconomic Freedom
Patent Efficiency
Journal Efficiency
Innovation Economy Efficiency

33 INNOVACCER GLOBAL INNOVATION COMPETITIVE INDEX www.innovaccer.com
UNITED STATES
2003 2008
50
60
70
80
90
100
2003 2004 2005 2006 2007 2008
Resources
Infrastructure
Efficiency
GICI
GICI 2008 77.41 2008 Rank 3
50
60
70
80
90
100Education
Researchers
R&D Expenditure
Energy Use
ICTEconomic Freedom
Patent Efficiency
Journal Efficiency
Innovation Economy Efficiency
50
60
70
80
90
100Education
Researchers
R&D Expenditure
Energy Use
ICTEconomic Freedom
Patent Efficiency
Journal Efficiency
Innovation Economy Efficiency

34 INNOVACCER GLOBAL INNOVATION COMPETITIVE INDEX www.innovaccer.com
ABOUT INNOVACCER
INNOVACCER (Innovation Accelerated) is an innovation
management and acceleration company focused and dedicated
to provide high quality innovation management services to
accelerate every step of an innovation life-cycle. InnovAccer was
founded with a vision of three people in the fields of Intellectual
Property, Business Innovation, and Social Innovation to change
and accelerate the creation of innovation ecosystem in India.
INNOVACCER RESEARCH
InnovAccer Research is an India based unit of INNOVACCER
focused at conducting and assisting world class Research. Our
teams of top technology, business, and law graduates are
committed towards creating knowledge, establishing novel facts,
solving new problems and proving new theories.
For queries regarding this report, please visit our FAQ page
http://www.innovaccer.com/reports/faqs/
For media, data requests, recommendations, suggestions, or
feedbacks, please e-mail at: [email protected]
+91 (11) 405 37968
© INNOVACCER 2011-12. All
Rights Reserved.
DISCLAIMER
Public Data: Use of publically
available data or data collected
from external sources without
the permission of
INNOVACCER is not prohibited.
Copyright Work:
Graphs, Charts, Tables,
Representations, and matrices
introduced in this report are
rights of INNOVACCER. Using
any of above mentioned items
without consent of
INNOVACCER is prohibited.
Academic Domain:
Academicians for the purpose
of academic awareness or
research can use this data
provided they cite this report in
proper fashion giving credit to
the authors and INNOVACCER.