global high-yield bonds - mercer · 2019-06-27 · investment timing ... high-yield bonds have had...
TRANSCRIPT
GLOBAL HIGH-YIELD BONDS AN UPDATE
SEPTEMBER 2013

i
CONTENTS
Introduction ...............................................................................................................................................1 Strategic Case for High-Yield Bonds ........................................................................................................2 Defensive Nature of High-Yield Bonds .....................................................................................................2 Recent Performance of High-Yield Bonds ................................................................................................3 Current Economic Cycle ...........................................................................................................................4 Investment Timing ....................................................................................................................................6 Prospective Future Returns ......................................................................................................................8 Downside Risk to Our Assumptions..........................................................................................................9 Effect of Rising Government Bond Yields...............................................................................................10 Gaining Access to the Market .................................................................................................................11 High Yield as Part of a Broader Fixed-Income Mandate.........................................................................12 Summary ................................................................................................................................................13

1
INTRODUCTION In January 2012, Mercer released a paper outlining our views on high-yield bonds. In that paper, we
suggested that it was an opportune time for investors to make a strategic allocation to high-yield
bonds.1 At the time, we believed that with wide spread levels, it was also an attractive point for a
tactical allocation. High-yield bonds offer attractive returns over time with less volatility than equities
and it should offer more downside protection than the equity market typically provides. However, over
longer periods we would expect equities to exhibit higher returns, as they are the riskier asset class,
being lower in a company’s capital structure; theoretically, this should mean that investors receive a
higher reward for the extra risk they are taking.
In this paper, we look at a number of issues:
• The strategic case for high-yield bonds.
• Recent performance of the asset class since 2012.
• The cyclicality of the asset class and where we think we might be in the current cycle.
• How the timing of investments affects future returns and how spreads and default rates drive
returns.
• How high-yield bonds might perform in a rising rates environment.
• How high-yield bonds fit into growth-oriented fixed-income portfolios or into a multi-asset credit
fund.
1 By “high yield,” we mean an allocation to noninvestment-grade fixed income, with a typical benchmark being the Merrill Lynch Global High
Yield Index.

2
STRATEGIC CASE FOR HIGH-YIELD BONDS To reiterate what we discussed in our January 2012 paper introducing this asset class, high-yield
bonds:
• Have historically provided excellent risk/return characteristics.
• Help diversify the source of returns in the growth portfolio away from traditional equities.
- There are different companies in the High Yield universe compared with the
predominantly large cap companies in equity and investment grade credit indices
- Bonds are higher up the capital structure than equities and the return profile is different,
reflecting returns to credit as well as general corporate health.
• Have a defensive but cyclical nature.
DEFENSIVE NATURE OF HIGH-YIELD BONDS The January 2012 paper showed that, over the past 20 years, high-yield bonds have provided better
returns than public equities with lower volatility. Indeed, when considering how risk impacts the
frequency of and extent of negative returns, high-yield bonds have compared very favorably with
equities over this period, avoiding large losses during the bursting of the tech bubble in 2000 and during
the global financial crisis in 2007–2008. This is shown in the chart below.
Global High-Yield Bond and Global Equity Returns
-30%
-20%
-10%
0%
10%
20%
30%
40%
50%
60%
1991 1992 1993 1994 1995 1996 1997 1998 1999 2000 2001 2002 2003 2004 2005 2006 2007 2008 2009 2010
MSCI World Global HYSource: Databank 1990-2010
Source: Thomson Reuters Datastream

3
The equity market has more potential upside than high-yield bonds, but it also exhibits times of
severe downside that high-yield bonds tend to avoid. By avoiding large losses, the cumulative
performance of high-yield bonds has been better over this period.
RECENT PERFORMANCE OF HIGH-YIELD BONDS High-yield bonds have had robust performance since the start of 2012 until the end of June 2013,
although there has been a small sell off recently. Below we have charted the performance of a
number of major asset classes over this time period showing the return they produced plotted against
the return for every unit of risk taken. In this case it shows return per unit of risk as measured by
standard deviation.
Return vs Return/Risk (Dec 31, 2011 to June 30, 2013)
US Equities
Asian (ex Japan) Equities
Global Equities
EM Equities
US Investment Grade
US High Yield
EMD
-5
0
5
10
15
20
25
0.0 0.5 1.0 1.5 2.0 2.5 3.0
Return/risk (%p.a. / % annualised standard deviation of monthly returns)
Ret
urn
(% p
.a.)
Source: Thomson Reuters Datastream (Indices used: MSCI EM, MSCI World, MSCI AC Asia ex Japan, S&P 500, Barclays Capital US Aggregate Government, Barclays Capital US Corporate Investment Grade, Bank of America ML US High Yield Master II, JPM EMBI Global Diversified)
Although high-yield bonds were only the third-best performers on this chart behind US equities (S&P
500) and global equities, it still returned an annualized 11.2%. More impressively, it was the best
performer in terms of return for risk taken. This was largely due to the lower volatility of the asset
class over this period; this lower absolute level of volatility is something we would expect to see over
the longer term.

4
CURRENT ECONOMIC CYCLE Of course the recent impressive performance of the asset class does not mean that the future
performance will be equally impressive. In fact we now believe that returns from the asset class over
the next couple of years could be muted and we would be very surprised to see the performance of
the 18 months up till the end of June 2013 repeated in the near future. The main reason for this is
that spreads have tightened dramatically over the period of observation. In January 2012 the Merrill
Lynch Global High Yield index started the year with a spread of 807bps, by the end of June 2013 this
had fallen to 554bps. This spread tightening has driven the performance of the asset class.
In our previous paper, we pointed out how high-yield bonds are a cyclical asset class that tends to
perform better than equities in the early stages of the business cycle. This is shown on the following
diagram. As companies enter and go through a recession, they tend to focus on reducing their debts
(also commonly referred to as deleveraging) to help ensure survival during the hard times. During this
debt-reduction phase, credit will outperform equities. Once companies come through this debt-
reduction phase and the economy recovers, profits start to grow faster than debt. While this period is
good for credit, it is also good for equities as profits are rising. We suspect that we are somewhere
near the end of this period in the business cycle. After that, debt starts to grow faster as companies
look to improve equity holder returns and add leverage to help make this happen. This causes credit
to underperform as equity holders see enhanced returns, while the risk to debt holders increases.
Finally, this increased leverage could lead to the next recession — but we think we are long way from
that at the moment.
High-Yield Bonds Performance and the Business Cycle
Source: BlueBay

5
Another way of examining this cycle is to see how high-yield bonds perform in relation to equities
through the cycle. We have done this for the past two business cycles, using US high-yield bonds and
US equities, and also show the relative performance of the asset classes through the current cycle. We
took the data from the start of a recession and tracked the numbers to the start of the next recession.
This is shown in the following chart.
US High Yield Relative to US Equities
40
60
80
100
120
140
160
180
1
155
309
463
617
771
925
1079
1233
1387
1541
1695
1849
2003
2157
2311
2465
2619
Days since onset of recession
Reb
ased
at 1
00 1990-2001
2001-2007
2007-2013
Source: Thomson Reuters Datastream
This chart, in some ways, shows how hard it is to talk about the “average cycle,” as every cycle is
different. The period 1990–2001 showed high-yield bonds initially outperforming equities, as we would
expect however equities then go on a long extended period of outperformance, outperforming high-
yield bonds considerably over the full cycle. This cycle was the longest period of uninterrupted growth
in US history; it also combined with the “tech bubble” of the late 1990s that drove equities to extremely
high levels. We would not normally expect to see equities outperform by quite so much.
In the period 2001–2007, high-yield bonds once again outperformed through the recession and slowly
gave some ground back toward the end of the cycle. Over the full cycle, this time high-yield bonds
posted the best performance. As we noted earlier, we would not have expected this, as equities —
being the higher risk asset — should, in theory, outperform over the full cycle. Finally, the line that
charts the latest cycle shows high-yield bonds having an extremely large outperformance of the equity
market; however, this outperformance has slowly scaled back in recent months.
So how confident can we be that investors will not experience negative returns if investing in high-yield
bonds today?
6
INVESTMENT TIMING One way is to look at the level of portfolio defaults required to leave an investor with only a return of
initial capital after a certain period. This way, once we have estimated the level, it is possible to judge
whether the economic outlook is better or worse than this number of defaults suggests. The default rate
required to bring about a breakeven investment could be considered the “margin of safety” that an
investor has.
To do this, we took a five-year period, which tends to be around the timeframe of a normal business
cycle. We then had to make some assumptions to simplify the model. We assumed that recovery rates
remain stable at 30%. Normally, when a bond defaults there is some form of recovery value that the
bond investors receive after other creditors have been paid. The average recovery rate for high-yield
bonds tends to be higher than this. However, actual recovery rates will ultimately depend on the
prevailing economic conditions. Since 2000, the best year for recovery rates was 2007 with a rate of
66.4%, and the worst was 2000 with 24.9%.
Another assumption that we made was that base interest rates remain constant. In this case, we kept
rates at 0.9%. If this rate was higher initially, then it would improve returns over time and mean that
default rates would have to be higher to reach a breakeven point. We also kept spreads constant over
the whole period, something that would obviously not happen in the real marketplace, as they move on
a daily basis.
Finally, we assumed that all the companies that were there at the start of the five-year period were the
same ones at the end, unless they defaulted. Once again, this was a big assumption to make, as the
high-yield market tends to be quite dynamic with new companies coming to market; some companies
leaving the market as debt is repaid; some defaulting; and some being acquired.
Despite these limitations to the model, we believe that our results are still a good indication of possible
value in the market. The results of our work are shown in the chart on the next page.

7
Annual Default Rates Required for a 0% Return Over Five Years
14.1%
12.6%
11.2%
9.8%
8.4%
7.0%
5.5%
4.1%
0%
2%
4%
6%
8%
10%
12%
14%
16%
900 800 700 600 500 400 300 200Entry level spread (bps)
Req
uire
d de
faul
t rat
e (%
p.a
.) fo
r zer
o re
turn
ove
r 5 y
ears
The chart shows the annual default rate required for an investor to have a zero return over five years if
an allocation was made at a given spread level. For example, if the investor entered the market at a
spread level of 700 bps, then the investment would have to experience a default rate of 11.2% per
annum (with a recovery rate of 30%) to experience a 0% return over the five-year period. This is a
cumulative default rate of 48%, meaning that of the initial companies invested in, nearly half of them
would default over the time period. To put this into historical perspective, we have data going back to
1920 and the worst-ever five-year period experienced an annualized default rate of 9.2% per annum in
the 1930s during the Great Depression. In contrast, the best-ever five-year period in the history of high-
yield bonds was in the 1950s, when the annual default rate was 0.2%.
To represent this in terms of valuation, we believe that spreads of 600 bps and higher would represent
a decent entry point to the market. In theory, at that level, it would require a default record over the next
five years worse than at any period in history to lose money. We consider this a large margin of safety
for investors. If markets turned out more benign, then an investor could reasonably be expected to
profit in this period.

8
PROSPECTIVE FUTURE RETURNS To build on this, we also evaluated what kind of return an investor might expect given a certain default
rate. The following chart shows expected returns with an average default rate of 4.2% per annum. This
was the average default rate over the period 1980–2010. We kept all the other variables the same as in
the first chart. The average default rate over the period 1920–2010 is significantly lower at 2.7%.
Five-Year Annualized Returns Assuming Average Default Rates
7.9%
6.9%
5.9%
4.9%
3.9%
2.9%
1.9%
0.9%
-0.1%-1.0%
0.0%
1.0%
2.0%
3.0%
4.0%
5.0%
6.0%
7.0%
8.0%
9.0%
1000 900 800 700 600 500 400 300 200
Initial Spread Levels (bps)
Ret
urn
( % p
.a.)
As would be expected, the higher the spread when entering the market, the better the long-term
returns. However, it must be noted that when spreads are at their widest, this is always accompanied
by stress in the market. Investors tend to be looking for safe investments at these times, so making an
allocation at these levels is not an easy decision to make.
Taking this back to valuation, we would once again look to invest if spreads were higher than 600 bps.
This could result in an annualized return of 3.9% or better if spreads were higher at the entry point.
Although 3.9% a year does not sound like a particularly high return, when we consider that 10-year
government bond yields in the UK, Germany, and the US are all below 3.0%, we believe that this is an
acceptable return in the current market. When we combine this with the exceptionally high default rates
required to lose money over this period, we are comfortable with the entry point.
9
DOWNSIDE RISK TO OUR ASSUMPTIONS It is interesting that all our valuation metrics come up with similar outcomes. What we must stress,
however, is that these are looking at the asset class over a five-year period, not as a short-term tactical
investment. Probably the biggest risk to our assumptions would be a major dislocation in the market;
the most obvious current contender for this would be a breakup of the eurozone.
If such an event were to occur, then spreads would almost definitely rise dramatically, resulting in
substantial mark-to-market losses. However, over a five-year holding period, the probability of a
significant loss would seem small.
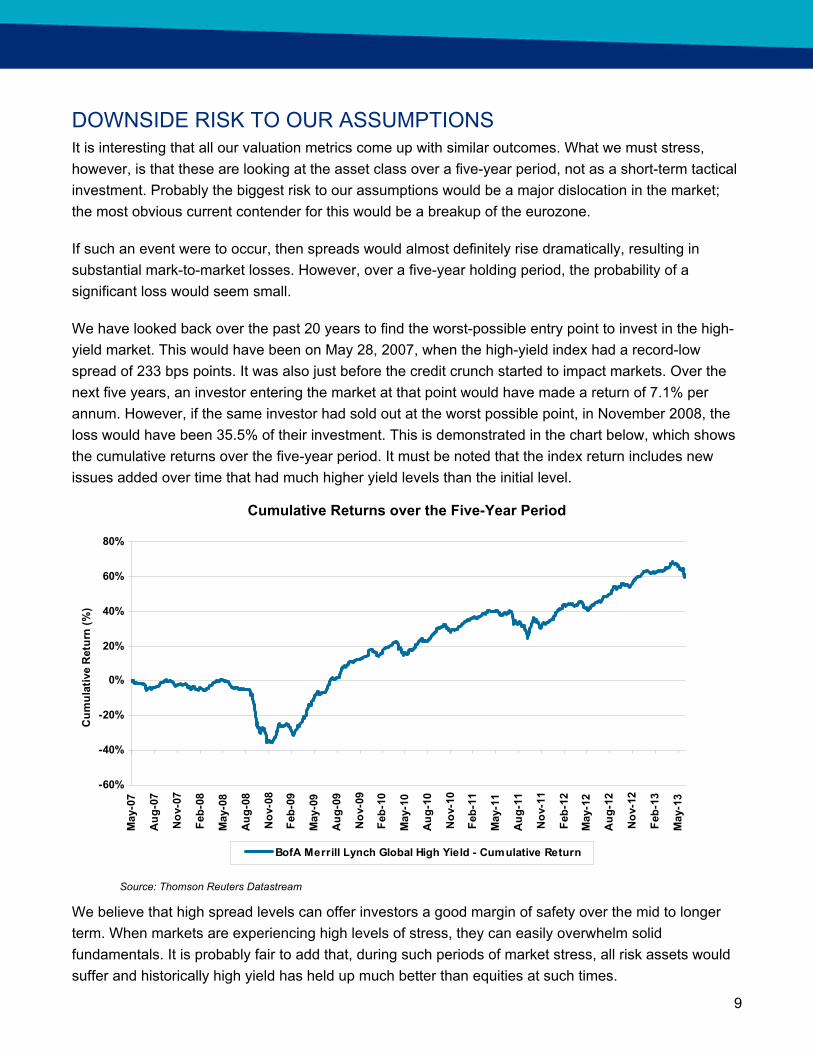
We have looked back over the past 20 years to find the worst-possible entry point to invest in the high-
yield market. This would have been on May 28, 2007, when the high-yield index had a record-low
spread of 233 bps points. It was also just before the credit crunch started to impact markets. Over the
next five years, an investor entering the market at that point would have made a return of 7.1% per
annum. However, if the same investor had sold out at the worst possible point, in November 2008, the
loss would have been 35.5% of their investment. This is demonstrated in the chart below, which shows
the cumulative returns over the five-year period. It must be noted that the index return includes new
issues added over time that had much higher yield levels than the initial level.
Cumulative Returns over the Five-Year Period
-60%
-40%
-20%
0%
20%
40%
60%
80%
May
-07
Aug
-07
Nov
-07
Feb-
08
May
-08
Aug
-08
Nov
-08
Feb-
09
May
-09
Aug
-09
Nov
-09
Feb-
10
May
-10
Aug
-10
Nov
-10
Feb-
11
May
-11
Aug
-11
Nov
-11
Feb-
12
May
-12
Aug
-12
Nov
-12
Feb-
13
May
-13
Cum
ulat
ive
Ret
urn
(%)
BofA Merrill Lynch Global High Yield - Cumulative Return
Source: Thomson Reuters Datastream
We believe that high spread levels can offer investors a good margin of safety over the mid to longer
term. When markets are experiencing high levels of stress, they can easily overwhelm solid
fundamentals. It is probably fair to add that, during such periods of market stress, all risk assets would
suffer and historically high yield has held up much better than equities at such times.

10
EFFECT OF RISING GOVERNMENT BOND YIELDS So far, our analysis has largely concentrated on spreads in the high-yield market. However, the total
yield on a high-yield bond is made up of a component that represents the current government bond
yield and the spread that is then added on top of this. It is widely believed that government bond yields
are going to rise over the next few years and may do so considerably from the current low levels.
At the end of June, the total yield to maturity on the Merrill Lynch Global High Yield Index was 7%. This
is made up of a spread of 554 bps and a government bond yield equivalent of 146 bps. In the past, a
rising government bond yield had little effect on the high-yield market, as the increase in the
government bond yield would have been small in comparison to the total yield in the market. On top of
this, the duration of the high-yield market tends to be short, so the rise in yields had a smaller effect
than in markets with longer duration. In the current market, a 1% increase in government bond yields
will have a significant impact on the market because of lower overall yields, although duration is still
small in comparison to other markets. How much of an impact rising yields will have is governed by the
speed of the rise. A dramatic rise in yields over a short period would result in a large loss for bond
holders. A slow rise over time would result in muted returns for bond holders but no overall losses.
Of course, trying to predict the speed of bond yield rises and where they will eventually rise to is
difficult. Instead, in the chart below we have shown a range of scenarios in which government bond
yields rise by a fixed amount per annum over the next three years, ranging from 25 bps a year to 100
bps a year. The lines show the total return in the high-yield market, assuming an average default rate of
4.2%. In reality, we would probably expect higher returns, as the rise in government bond yields would
result in new issues having higher starting yields. Also, rising yields are normally associated with a
strong economy, which would suggest lower default rates. However, for consistency with our other
calculations, we kept yields static over the period.
Rate Rise Scenarios
-2%
0%
2%
4%
6%
8%
10%
Year 0 Year 1 Year 2 Year 3
Cum
lativ
e R
etur
n
25bps Per Annum 50bps Per Annum
75bps Per Annum 100bps Per Annum

11
It can clearly be seen that the faster bond yields rise, the lower the return over the period. Under our
worst-case scenario, the government bond yield would have increased 3% over the period, and this
would result in a total return of -0.3%. It must be noted that the market is currently pricing in interest-
rate rises significantly lower than this.
GAINING ACCESS TO THE MARKET Active vs. Passive Index-tracking exposure in the high-yield market is problematic. Replicating the index is difficult and
expensive. High-yield bonds go in and out of high-yield benchmarks far more often than stocks go into
or out of equity-related indices. This creates high turnover and transaction costs for index-tracking
funds. Many high-yield bonds are illiquid, with many transactions taking place in a relatively opaque
market that trades off-exchange, infrequently, and with high associated trading costs.
Data from Bloomberg show that over the five-year period ending May 2012, the only US high-yield ETF
available underperformed its benchmark index by 4.1% per year. Not only do high-trading costs hit ETF
performance, but they will include all the companies that fail and have to absorb losses from these
defaults.
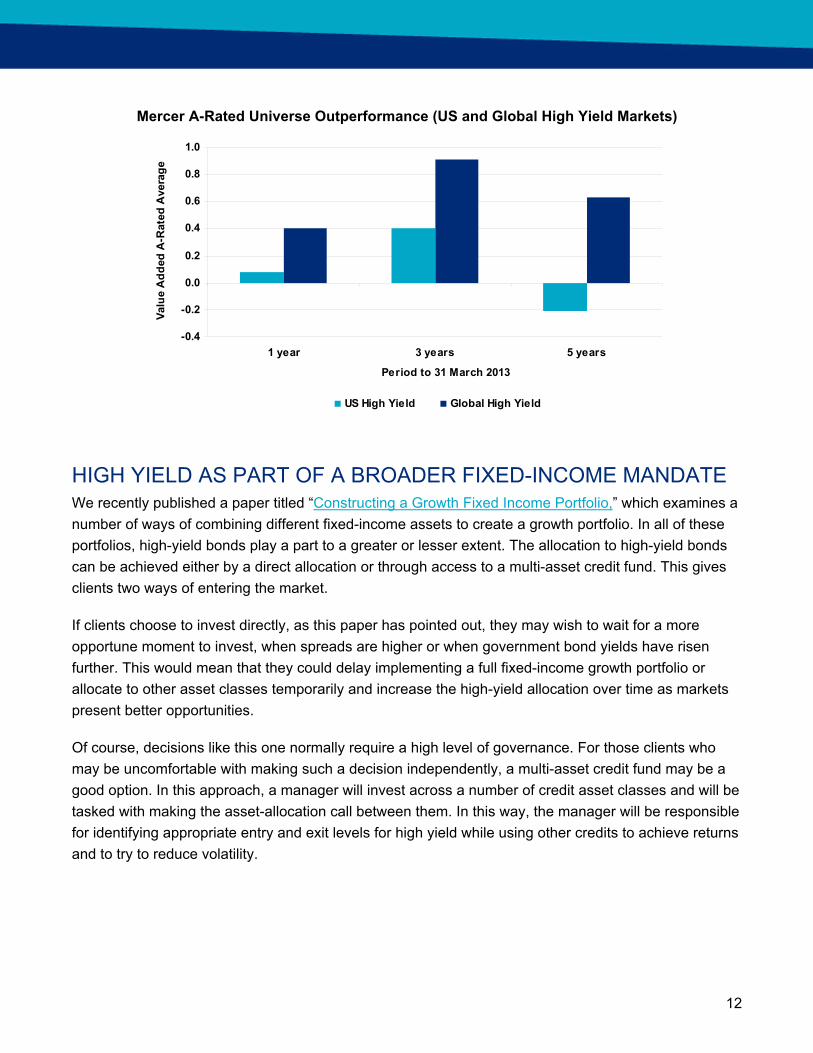
For these reasons, we believe that active managers have a good chance of outperforming in the high-
yield market. In the chart on the next page, we show the Mercer A-rated universe outperformance for
both the US and the global high-yield markets. The outperformance shown in the chart is fairly modest
over all periods, but this is largely a function of manager style. The Merrill Lynch Global High Yield
Index returned more than 70% in the five-year period. Normally, in periods when the index is
performing so well, managers struggle to keep up, remaining cautious of investing in the lowest-rated or
weakest companies. These are normally the companies that perform the best in rapidly rising markets,
as they have the highest yields, and when prices are depressed they rally the most. However, the more
cautious approach of our A-rated managers means that they normally have much lower default rates
than the index, and this leads to outperformance over time. This is especially the case when the market
sells off.
12
Mercer A-Rated Universe Outperformance (US and Global High Yield Markets)
-0.4
-0.2
0.0
0.2
0.4
0.6
0.8
1.0
1 year 3 years 5 years
Period to 31 March 2013
Valu
e A
dded
A-R
ated
Ave
rage
US High Yield Global High Yield
HIGH YIELD AS PART OF A BROADER FIXED-INCOME MANDATE We recently published a paper titled “Constructing a Growth Fixed Income Portfolio,” which examines a
number of ways of combining different fixed-income assets to create a growth portfolio. In all of these
portfolios, high-yield bonds play a part to a greater or lesser extent. The allocation to high-yield bonds
can be achieved either by a direct allocation or through access to a multi-asset credit fund. This gives
clients two ways of entering the market.
If clients choose to invest directly, as this paper has pointed out, they may wish to wait for a more
opportune moment to invest, when spreads are higher or when government bond yields have risen
further. This would mean that they could delay implementing a full fixed-income growth portfolio or
allocate to other asset classes temporarily and increase the high-yield allocation over time as markets
present better opportunities.
Of course, decisions like this one normally require a high level of governance. For those clients who
may be uncomfortable with making such a decision independently, a multi-asset credit fund may be a
good option. In this approach, a manager will invest across a number of credit asset classes and will be
tasked with making the asset-allocation call between them. In this way, the manager will be responsible
for identifying appropriate entry and exit levels for high yield while using other credits to achieve returns
and to try to reduce volatility.

13
SUMMARY Despite the rally in the high-yield markets over the past 18 months and the risk of a rising-interest-rate
environment, we still believe in the asset class as a strategic allocation. This would be added to a
growth portfolio as a diversifier to other risk assets, such as equities. The asset class continues to offer
downside protection in relation to equities. In fact, one of the main concerns around the asset class at
the moment is that government bond yields might increase. This would suggest that the economy is
performing well and that other risk assets would be performing well. Even from these relatively low
spread levels, an unexpected economic slowdown would almost certainly result in much larger losses
from holding equities than from high-yield bonds.
Although we are still confident in the long-term attributes of the asset class, we do believe that, in the
current cycle, the best returns from high-yield bonds could be behind us. While we do not see a large
sell-off in the asset class, unless economic fundamentals deteriorate dramatically, we would probably
expect low-to-mid-single-digit returns over the next few years. For investors who want returns higher
than this, we recommend waiting for a more opportune entry point. This would be when spreads are
higher, government bond yields have risen, or a combination of both has pushed up the total yield in
the high-yield market. Of course, for investors who are content with returns like we have outlined and
the lower volatility that the high-yield market displays (relative to equities), they may be happy to invest
at current levels.

14
IMPORTANT NOTICES References to Mercer shall be construed to include Mercer LLC and/or its associated companies.
© 2013 Mercer LLC. All rights reserved.
This contains confidential and proprietary information of Mercer and is intended for the exclusive use of the parties to whom it was provided by Mercer. Its content may not be modified, sold, or otherwise provided, in whole or in part, to any other person or entity, without Mercer’s written permission.
The findings, ratings, and/or opinions expressed herein are the intellectual property of Mercer and are subject to change without notice. They are not intended to convey any guarantees as to the future performance of the investment products, asset classes, or capital markets discussed. Past performance does not guarantee future results.
This does not contain investment advice relating to your particular circumstances. No investment decision should be made based on this information without first obtaining appropriate professional advice and considering your circumstances.
Information contained herein has been obtained from a range of third-party sources. While the information is believed to be reliable, Mercer has not sought to verify it. As such, Mercer makes no representations or warranties as to the accuracy of the information presented and takes no responsibility or liability (including for indirect, consequential or incidental damages) for any error, omission, or inaccuracy in the data supplied by any third party.
This does not constitute an offer or a solicitation of an offer to buy or sell securities, commodities, and/or any other financial instruments or products.
Saudi Arabia
Singapore
South Korea
Spain
Sweden
Switzerland
Taiwan
Thailand
Turkey
United Arab Emirates
United Kingdom
United States
Venezuela

For further information, please contact your local Mercer office or visit our website at: www.mercer.com
Argentina Hong Kong Portugal
Australia India Saudi Arabia
Austria Indonesia Singapore
Belgium Ireland South Korea
Brazil Italy Spain
Canada Japan Sweden
Chile Malaysia Switzerland
China Mexico Taiwan
Colombia Netherlands Thailand
Czech Republic New Zealand Turkey
Denmark Norway United Arab Emirates
Finland Peru United Kingdom
France Philippines United States
Germany Poland Venezuela