global global telecom · macquarie wealth management global telecom ... indosat isat ij rp...
TRANSCRIPT

Please refer to page 20 for important disclosures and analyst certification, or on our website
www.macquarie.com/research/disclosures.
GLOBAL
Fig 1 Subscriber market share outcomes from launch
Source: Company data, Macquarie Research, April 2017
Fig 2 Pathway to EBITDA Break-even
Source: Company data, Macquarie Research, April 2017
5 April 2017
Global Telecom New entrants: If you build it will they come? Event
We discuss the prospects for new entrants into Mobile markets.
Impact
High barriers to entry exist for aspiring mobile network operators
(MNOs), due to (a) the challenges in acquiring spectrum in a competitive
market, (b) the requirement for national coverage to provide a credible
service, (c) access to sites and infrastructure as part of the network rollout,
and (d) the high fixed capital expenditures required upfront to meet these
challenges.
Despite this, new entrants are not uncommon. We look at a dozen
companies that have built new mobile networks globally, and the challenges
they have faced and success or otherwise of their operations. We note that
despite the challenges above, these entrants are generally encouraged to
enter by one or more of three key factors. The first is the availability of
spectrum, and the competitive dynamic around the allocation/auction process.
The second is the capacity to strike roaming deals to facilitate network
coverage earlier than what could be achieved via an organic build-out. And
thirdly, access to fixed line assets and customers to leverage infrastructure,
systems, billing and brand/relationships.
Newer entrants flagging strategic differentiation to redefine the costs
base of an MNO: There are a number of examples of newer operators
looking to redefine the cost base for operating as an MNO in a market. For
example, with regard to its Italian operations, Iliad has noted that its ability to
build and manage networks, systems and IT in-house will see costs related to
these activities account for just 1% of its sales revenue, compared to 5-8% of
sales revenue at a typical carrier. TPG is also flagging a substantially lower
cost base than incumbents for its Singapore foray.
Outcomes are mixed: Not many new entrants have been successful. Some
have left the market, usually via consolidation by larger players interested in
their spectrum assets and customer base. Others have survived, but have
some way to go before justifying large capital outlays on spectrum and
network assets, as well as the incursion of start-up losses. There is no quick
pathway to success here, and return expectations need to be judged over
longer-term time horizons. Our analysis of outcomes suggests that, for those
that achieve it, EBITDA break-even often requires between 6-8% market
share, and ~4-6 years to achieve (both can vary). Financial justification
requires additional scale to generate a sufficient return on up front capital and
recoup start-up losses.
TPG, Iliad and Comcast next up to try their luck? TPG is a confirmed new
entrant for the Singapore market, with services to launch in 2018. It has also
expressed a desire to be a fourth MNO in Australia, where 700 MHz auctions
are currently taking place. Iliad is expanding its mobile strategy into Italy,
while Comcast is expected to confirm the acquisition of 600 MHz spectrum in
the US following recently concluded auctions. Telekom Malaysia launched a
mobile strategy in 3Q16. All these strategies threaten to be disruptive to
incumbent operators in these markets, but will also face significant challenges
themselves.
0%
5%
10%
15%
20%
25%
0 1 2 3 4 5 6 7 8
2degrees 3 Illiad
Telkom SA Videotron Shaw
Subscriber share
Years from launch
-150
-100
-50
0
50
100
150
200
250
300
350
0 1 2 3 4 5 6 7 8
2degrees 3 Telkom SA
Videotron uMobile
EBITDA (Indexed to -100, which represents max loss)
Years from launch

Macquarie Wealth Management Global Telecom
5 April 2017 2
Macquarie Global Telecoms coverage universe
Source: Bloomberg, Macquarie Research, Share prices as at 5 April 2017
Macquarie Ticker Currency Market Current Target Macq ND / EBITDA
A/NZ telecoms Cap (m) Price Price Recc. FY1 FY2 FY1 FY2 FY1 FY2 FY1
Telstra Corporation TLS AU A$ $55,542 $4.67 $5.00 Neutral 7.2x 7.1x 16.5x 16.4x 6.6% 6.6% 1.6x
Spark New Zealand SPK NZ NZ$ $6,616 $3.61 $3.40 Underperform 7.5x 7.5x 17.4x 17.3x 6.1% 6.1% 0.9x
TPG Telecom TPM AU A$ $5,693 $6.71 $7.80 Neutral 8.5x 7.9x 13.9x 14.0x 2.4% 2.4% 1.6x
Vocus VOC AU A$ $2,581 $4.16 $5.20 Outperform 8.3x 7.1x 12.6x 11.3x 4.0% 4.4% 2.2x
Chorus CNU NZ NZ$ $1,754 $4.31 $4.60 Outperform 5.0x 5.2x 13.6x 14.6x 4.9% 5.1% 2.3x
amaysim Australia AYS AU A$ $343 $1.85 $2.30 Outperform 8.5x 8.3x 13.4x 13.4x 5.6% 5.6% -0.1x
NEXTDC NXT AU A$ $1,131 $3.94 $4.30 Outperform 25.2x 21.9x 102.4x 89.8x 0.0% 0.0% 1.9x
Average A/NZ telecoms (ex NEXTDC) 7.5x 7.2x 14.6x 14.5x 4.9% 5.0% 1.4x
Median A/NZ telecoms (ex NEXTDC) 7.9x 7.3x 13.8x 14.3x 5.2% 5.3% 1.6x
Macquarie Ticker Currency Market Price Target Macq ND / EBITDA
Asia telecoms Cap Price Recc. FY1 FY2 FY1 FY2 FY1 FY2 FY1
Advanced Info Service ADVANC TB Bt 437,045 174.00 170.00 Outperform 10.4x 9.5x 19.0x 18.1x 5.3% 4.4% 1.7x
Total Access Communication DTAC TB Bt 89,385 42.25 33.00 Neutral 4.7x 4.3x 30.3x 32.1x 2.0% 1.9% 1.1x
Intouch Holdings INTUCH TB Bt 159,519 55.00 54.00 Outperform 11.9x 17.4x 12.0x 17.5x 8.3% 5.7% -0.1x
Jasmine Infrastructure Fund JASIF TB Bt 63,250 11.50 11.90 Neutral 11.8x 11.6x 11.8x 11.6x 8.6% 8.5% -0.1x
True Corporation TRUE TB Bt 238,583 6.70 10.30 Outperform 11.7x 8.7x nmf 353.84 0.0% 0.0% 2.5x
XL Axiata EXCL IJ Rp 24,689,188 3,090.00 4,000.00 Outperform 6.2x 5.5x 89.7x 39.6x 0.0% 0.9% 2.2x
Indosat ISAT IJ Rp 35,048,872 7,000.00 10,900.00 Outperform 4.7x 3.9x 35.9x 14.8x 0.7% 1.7% 1.6x
Tower Bersama Infrastructure TBIG IJ Rp 22,566,369 5,775.00 5,400.00 Neutral 14.5x 14.0x 26.8x 26.0x 0.0% 0.0% 5.9x
PT Telkom TLKM IJ Rp 401,183,960 4,250.00 4,600.00 Outperform 7.1x 6.6x 20.3x 19.5x 2.6% 2.9% 0.1x
Sarana Menara Nusantara TOWR IJ Rp 36,526,472 3,850.00 4,300.00 Outperform 11.6x 9.9x 18.3x 15.4x 0.0% 0.0% 2.0x
Axiata Group AXIATA MK RM 42,345 5.00 5.41 Neutral 8.0x 6.8x 30.4x 16.2x 3.0% 3.4% 2.7x
DiGi.com DIGI MK RM 39,730 5.11 3.90 Underperform 14.3x 14.1x 25.2x 24.5x 4.0% 4.1% 0.7x
Maxis Berhad MAXIS MK RM 44,912 6.40 6.30 Neutral 12.7x 12.3x 25.7x 23.0x 3.1% 4.4% 1.9x
Telekom Malaysia T MK RM 22,360 6.41 8.20 Outperform 7.9x 7.1x 35.1x 20.3x 2.9% 4.7% 1.5x
Time dotCom TDC MK RM 4,511 8.64 9.36 Outperform 16.1x 13.9x 27.0x 22.5x 2.4% 1.0% -0.1x
SK Telecom 017670 KS Won 20,751,647 257,000.00 320,000.00 Outperform 5.5x 5.1x 10.5x 8.8x 3.9% 4.3% 1.1x
KT Corp 030200 KS Won 8,473,079 32,450.00 40,000.00 Outperform 2.5x 2.3x 9.9x 9.0x 3.1% 3.4% 0.8x
LG U+ 032640 KS Won 6,330,865 14,500.00 17,000.00 Outperform 3.9x 3.6x 11.3x 9.9x 2.6% 2.8% 1.4x
Globe Telecom GLO PM P 276,104 2,080.00 2,000.00 Outperform 7.8x 7.7x 19.8x 19.0x 4.4% 3.6% 2.2x
PLDT TEL PM P 294,916 1,693.00 1,300.00 Neutral 8.2x 8.0x 13.5x 17.5x 6.2% 3.2% 2.2x
M1 M1 SP S$ 2,024 2.16 1.65 Underperform 7.6x 8.3x 14.3x 17.9x 5.6% 3.6% 1.2x
SingTel ST SP S$ 64,337 3.92 4.37 Outperform 15.0x 14.4x 16.0x 15.6x 4.5% 4.5% 2.2x
StarHub STH SP S$ 4,987 2.88 2.43 Underperform 9.3x 10.0x 18.4x 21.6x 5.6% 5.6% 1.4x
SoftBank 9984 JP ¥ 9,106,864 7,751.00 11,550.00 Outperform 7.7x 6.5x 8.4x 8.9x 0.6% 0.6% 4.4x
Average Asia telecoms 9.2x 8.8x 23.0x 32.6x 3.3% 3.1% 1.7x
Median Asia telecoms 8.1x 8.1x 19.0x 18.0x 3.0% 3.4% 1.6x
Macquarie Ticker Currency Market Price Target Macq ND / EBITDA
Europe telecoms Cap Price Recc. FY1 FY2 FY1 FY2 FY1 FY2 FY1
Royal KPN KPN NA € 11,952 2.80 2.50 Neutral 7.5x 7.4x 21.8x 19.5x 5.1% 5.5% 2.6x
Proximus PROX BB € 9,877 29.22 30.00 Outperform 6.2x 6.1x 17.2x 16.6x 5.1% 5.1% 1.0x
Drillisch DRI GR € 2,240 47.84 53.00 Outperform 22.6x 15.5x 55.7x 30.9x 3.7% 3.8% 0.6x
Deutsche Telekom DTE GR € 76,561 16.37 14.00 Underperform 6.1x 5.8x 18.9x 18.7x 4.0% 4.3% 2.7x
Telefonica Deutschland O2D GR € 13,930 4.68 3.00 Underperform 8.3x 8.4x nmf nmf 5.6% 5.6% 0.7x
BT Group BT/A LN £ 32,575 3.14 2.70 Neutral 5.9x 6.0x 11.1x 11.3x 4.9% 5.4% 1.8x
TalkTalk TALK LN £ 1,711 1.96 2.40 Outperform 7.8x 6.9x 13.4x 10.8x 8.1% 6.5% 2.2x
Vodafone Group VOD LN € 65,236 2.42 1.99 Underperform 6.8x 7.7x 52.2x 49.5x 6.1% 4.1% 2.4x
Cellnex Telecom CLNX SM € 3,575 15.43 20.00 Outperform 14.0x 12.7x 41.5x 33.2x 0.9% 1.3% 3.6x
Telefonica TEF SM € 52,595 10.44 11.50 Outperform 6.1x 5.7x 13.1x 11.0x 3.8% 3.8% 3.0x
Inwit INW IM € 2,988 4.98 5.50 Outperform 17.4x 15.4x 26.4x 22.4x 3.4% 4.0% 1.0x
Telecom Italia TIT IM € 12,284 0.81 1.10 Outperform 5.6x 5.3x 12.1x 10.7x 0.0% 2.5% 3.6x
Iliad ILD FP € 10,727 212.20 230.00 Outperform 8.3x 7.7x 28.6x 27.1x 0.2% 0.2% 0.9x
Orange ORA FP € 38,464 14.46 18.00 Outperform 5.0x 4.7x 13.0x 12.6x 4.5% 4.7% 2.0x
Swisscom SCMN VX CHF 23,756 458.60 435.00 Neutral 7.8x 8.0x 17.9x 19.7x 4.8% 4.4% 2.0x
Average Europe telecoms 9.0x 8.2x 24.5x 21.0x 4.0% 4.1% 2.0x
Median Europe telecoms 7.5x 7.4x 18.4x 19.1x 4.5% 4.3% 2.0x
Macquarie Ticker Currency Market Price Target Macq ND / EBITDA
Nth America telecoms Cap Price Recc. FY1 FY2 FY1 FY2 FY1 FY2 FY1
BCE BCE CN C$ 53,204 59.20 60.00 Neutral 8.0x 7.6x 17.1x 16.5x 4.8% 4.9% 2.2x
Rogers Communications RCI/B CN C$ 23,782 59.10 60.00 Outperform 8.7x 8.1x 18.4x 16.3x 3.4% 3.5% 3.0x
TELUS T CN C$ 25,582 43.36 47.00 Outperform 7.9x 7.6x 15.8x 14.9x 4.6% 4.9% 2.6x
AT&T T US US$ 255,305 41.57 48.00 Outperform 6.8x 6.4x 14.2x 13.5x 4.7% 4.8% 2.1x
CenturyLink CTL US US$ 12,899 23.60 28.00 Neutral 5.4x 5.1x 11.7x 10.2x 9.2% 9.2% 3.3x
Frontier Communications FTR US US$ 2,405 2.05 3.40 Neutral 5.6x 5.5x nmf nmf 20.6% 20.6% 4.9x
Shenandoah Telecommunications Co.SHEN US US$ 1,345 27.40 29.00 Neutral 7.7x 6.3x 16.3x 11.8x 0.9% 0.9% 2.8x
Sprint S US US$ 33,014 8.67 11.00 Outperform 7.1x 6.6x nmf 281.1x 0.0% 0.0% 3.5x
T-Mobile US TMUS US US$ 52,526 63.55 65.00 Neutral 7.3x 6.3x 35.3x 30.0x 0.0% 0.0% 2.1x
Verizon Communications VZ US US$ 200,472 49.18 53.00 Neutral 6.6x 6.3x 12.7x 12.3x 4.8% 4.9% 2.2x
Average Nth America telecoms 7.1x 6.6x 17.7x 45.2x 5.3% 5.4% 2.9x
Median Nth America telecoms 7.2x 6.4x 16.0x 14.9x 4.7% 4.9% 2.7x
Macquarie Ticker Currency Market Price Target Macq ND / EBITDA
South African telecoms Cap Price Recc. FY1 FY2 FY1 FY2 FY1 FY2 FY1
Vodacom VOD SJ R 230,633 151.45 155.50 Neutral 7.7x 7.3x 15.9x 14.5x 5.8% 6.4% 0.7x
Telkom TKG SJ R 38,494 71.81 65.48 Neutral 3.7x 3.7x 10.9x 11.5x 4.0% 4.3% 0.2x
MTN Group MTN SJ R 233,273 123.80 105.00 Underperform 7.0x 7.1x 19.1x 17.9x 5.7% 5.7% 1.5x
Average South African telecoms 6.6x 6.3x 18.2x 20.9x 4.3% 4.5% 1.8x
Median South African telecoms 7.1x 6.4x 16.0x 14.9x 4.8% 4.9% 2.1x
Average All Diversified telecoms 8.9x 8.3x 23.3x 31.0x 0.0x 0.0x 1.9x
Median All Diversified telecoms 7.8x 7.3x 17.9x 17.5x 0.0x 0.0x 2.0x
PEREV/EBITDA Dividend Yield
PEREV/EBITDA Dividend Yield
EV/EBITDA PER Dividend Yield
PEREV/EBITDA Dividend Yield
PEREV/EBITDA Dividend Yield

Macquarie Wealth Management Global Telecom
5 April 2017 3
Key takeaways
All mobile markets are different, and the entry of new players has had a different impact across
markets and with varying success rates. Against that backdrop, we think it is worthwhile drawing
some general conclusions around new market entries, and highlight factors that investors should
consider when trying to model the success and impact of new entrants.
We see three key enablers for a new operator looking to enter an established mobile market:
Spectrum auctions, particularly if they are designed to promote competition and favour new
entrants over existing players. For example, Singapore recently held auctions in which only
new entrants could participate and incumbent mobile operators were excluded; 2degrees/NZ
Communications attained early spectrum rights below market value. In addition to facilitating a
market entry, ownership of spectrum is also critical for operators looking to keep unit costs low
on a longer-term view. We expect successful operators to acquire north of 100 MHz of
spectrum to compete efficiently in a data-centric world, suggesting further spectrum
acquisitions will be likely for operators such as TPG in Singapore and Australia, Wind in
Canada, as well as Free in Italy.
Fig 3 Spectrum assets of 'new entrant' operators
600/700 MHz 850/900 MHz 1.8 GHz 2.1 GHz AWS 2.3 GHz 2.5/2.6 GHz Total
2degrees (NZ) 2x10 MHz 2x10 MHz 2x25 MHz 2x15 MHz 120 MHz Telkom Mobile (SA) 2x12 MHz 2x15 MHz 60 MHz 114 MHz Free/Iliad (FR) 2x10 MHz 2x5 MHz 2x15 MHz 2x5 MHz 2x20 MHz 110 MHz Videotron (Quebec) 2x5 MHz 2x35 MHz 2x10 MHz 100 MHz uMobile (MY) 2x5 MHz 2x15 MHz 2x15 MHz 2x10 MHz 90 MHz '3' (AU) 2x10 MHz* 2x15 MHz 2x15 MHz 80 MHz Free/Iliad (IT) 2x5 MHz 2x10 MHz 2x10 MHz 2x10 MHz 70 MHz TPG (SG) 2x10 MHz 40 MHz 10 MHz 70 MHz Wind (CA) 2x25 MHz 50 MHz Digitel (PH) 2x17.5 MHz 2x10 MHz 55 MHz TPG (AU) Auction? 2x10 MHz** 2x10 MHz 20 MHz Comcast (US) Auction?
* '3' Australia: 850MHz, spectrum held in Melbourne/Sydney only; 2.1 GHz, 2x15MHz in Melbourne/Sydney only, 2x10MHz in other capital cities.
** TPG: Regional only: Darwin, Sth Qld, Northern NSW, Canberra, Sth NSW, Regional Vic, Regional SA, Tasmania, plus 2 x 5 MHz in Adelaide and Western NSW.
Source: Macquarie Research, April 2017
The existence of roaming arrangements or the ability to roam with existing players.
Establishing reliable national/regional coverage is a key barrier to entry for new players given
the time and capital required to achieve this. To beat this, a number of new entrants have
successfully negotiated roaming arrangements with incumbent operators. Iliad’s agreement
with Orange has been critical to its rollout, while ‘3’ Australia leveraged a roaming agreement
with Telstra. In New Zealand, ComCom concluded that roaming should be a regulated
product, although the need to implement regulated pricing was circumvented by a commercial
deal between Vodafone and 2degrees.
Fixed line network assets and customers. A number of players have looked to leverage
fixed line assets – either access networks/backhaul, or customer bases, or both, as an entry
point to mobiles. Given the increasing level of shared infrastructure between wireless and
wireline assets this expansion is logical. Examples here include Free/Iliad (France), Telkom
Mobile (South Africa), and Videotron (Quebec). TPG, Charter and Comcast are currently
considering similar strategies.
Other market structures are also important: (1) We think being a new entrant in a data world
has additional complications to being a new entrant in a voice-centric world (pre-2005). It
essentially extends network requirements beyond simply a coverage outcome, to also encompass
depth/capacity (2) In addition, entering a market that is still emerging and growing is easier than
fighting incumbents in more mature markets. (3) Intuitively, entering markets with fewer existing
operators and where existing profitability is higher will increase the probability of a new entrant
being successful.

Macquarie Wealth Management Global Telecom
5 April 2017 4
Strategic differentiation to redefine the costs base: There are a number of examples of newer
operators looking to redefine the cost base for operating as an MNO in a market. For example,
Iliad has noted that its ability to build and manage networks, systems and IT in-house will see
costs related to these activities in Italy account for just 1% of its sales revenue, compared to 5-8%
of sales revenue at a typical carrier. In addition, Reliance Jio is seeking to optimise network
capacity and contain costs by focussing on VoLTE over switched calling in India. Other entrants
with existing fixed line infrastructure and customers can leverage that to effect scale across
infrastructure and customer service costs, while reducing cost to acquire. If executed well, this will
allow these operators to reduce start-up losses, and/or drive more aggressive pricing plans into
the market.
New entrant rollouts are a mixed bag, and many don’t reach scale: While this note focusses
on a number of examples of networks that have achieved scale or reasonable level of market
share, there are also a number of operations that have been less successful. India and Canada
are markets where spectrum was acquired by potential new entrants, however a number of
operators failed to reach scale in either their network or their customer bases. In most cases, this
resulted in market consolidation or the sale of spectrum and infrastructure assets as part of an exit
from the market.
A wide range of financial outcomes: Of the carriers discussed in additional detail during the
note, there are varying levels of success with regard to gaining scale and also with regard to
economic outcomes. The charts below highlight subscriber growth over time, and also the time to
path to positive earnings where disclosures are available. EBITDA break-even tends to come at
between 6-8% market share and ~4-6 years after services launch. TPG expects to reach EBITDA
breakeven at 5-6% subscriber share, while Iliad has noted that it expects to reach breakeven at
less than 10% market share. Of course, financial justification requires additional scale to generate
a sufficient return on upfront capital and recoup start-up losses.
Fig 4 Subscriber market share outcomes from launch
Fig 5 Pathways to EBITDA break-even
Source: Company data, Macquarie Research, April 2017. Note: Macquarie estimates used for a small number of periods where data not available. Source: Company data, Macquarie Research, April 2017.
Scope for new entrants
There are a number of players currently confirmed or looking to enter mobile markets, including:
TPG in Singapore: TPG acquired spectrum at the recent NESA auctions and will go live with
a network and mobile offering during 2018. The company has flagged initial network capex of
S$200-300m, and expects to reach EBITDA break-even at between 5-6% subscriber share.
Depending on pricing and ARPU, this implies a cost base at break-even of between S$135-
170m. We expect TPG will look to acquire additional spectrum and all up will invest in excess
of S$500m over the next few years to build out its offering. TPG is a greenfield operator in
Singapore, but will also enter the fixed line market utilising the NGNBN;
0%
5%
10%
15%
20%
25%
0 1 2 3 4 5 6 7 8
2degrees 3 Illiad
Telkom SA Videotron Shaw
Subscriber share
Years from launch-150
-100
-50
0
50
100
150
200
250
300
350
0 1 2 3 4 5 6 7 8
2degrees 3 Telkom SA
Videotron uMobile
EBITDA (Indexed to -100, which represents max loss)
Years from launch

Macquarie Wealth Management Global Telecom
5 April 2017 5
TPG in Australia: TPG has confirmed its interest in the Australian mobiles market, where a
700 MHz auction is currently taking place. If successful, we expect that TPG will need to pay
well in excess of the $286m reserve price per 2x5 MHz block (the auction will see a 2x10 MHz
block and then a 2x5 MHz block auctioned off). TPG would be able to leverage existing fixed
line backhaul infrastructure, which is expanding rapidly on the back of a backhaul deal struck
with Vodafone in 2015. From a network perspective, we expect TPG will focus on the more
concentrated capital cities for initial coverage, and have previously estimated rollout costs at
between $750m to $1.4bn. It would gain material operating leverage from its existing network
assets and its fixed broadband operations (brand, CPA, IT/billing, call centre);
Telekom Malaysia: Telekom Malaysia, the fixed line incumbent, launched a wireless service
running on 850 MHz and 2600 MHz spectrum with a roaming agreement on Celcom in 3Q16.
No subscriber or financial numbers are available as yet, but the business is having some
impact on the sector currently. Management has flagged an initial capex investment of
US$390m, and that it hopes to reach breakeven within three to five years. There is ongoing
speculation that a merger between TM and Celcom will take place, and the market will revert
to four major players;
Charter/Comcast in the US: Both Comcast and Charter have an MVNO agreement with
Verizon. We believe this is their step into the wireless market and ultimately, they will end up
with owner economics. With the broadcast incentive auction ending, we expect to finally get a
glimpse into the Comcast’s wireless ambitions and details around how much spectrum they
were able to secure.

Macquarie Wealth Management Global Telecom
5 April 2017 6
New Zealand – 2degrees (2009)
2degrees (then NZ Communications) (while trading as NZ Communications) secured 2.1GHz
spectrum for 3G purposes after the Government set aside a block for Maori economic
development purposes at a 5% discount to related auction outcomes, while also providing $5m in
seed funding to help develop the asset. It also acquired 850/900 spectrum from Telecom NZ in
2008 and 1800 MHz spectrum in 2012. In October 2013, 2degrees purchased 10MHz of 700MHz
spectrum for $44m.
Using its initial spectrum allocations, 2degrees entered the NZ mobile market in 2009 and has
successfully established itself as the third player. We estimate that 2degrees had acquired a
mobile subscriber share of ~23% at 31 December 2016, resulting in a mobile service revenue
share of ~19%. The majority of 2degrees’ customer base are prepaid (and lower ARPU), and
hence its revenue market share lags its subscriber share.
Fig 6 2degrees historical subscriber and service revenue share
Source: Company data, Macquarie Research, April 2017
Fig 7 2degrees earnings summary
2degrees (reported) (NZ$ m) CY09 CY10 CY11 CY12 CY13 CY14 CY15 CY16
Service 27.2 86.8 152.8 219.6 263.1 304.1 333.6 367.5 Non service 0.0 21.0 32.6 40.5 45.7 93.6 204.8 245.6 Mobile 27.2 107.8 185.4 260.1 308.7 397.6 538.4 613.1 Fixed 0.0 30.7 61.5 Total revenue 27.2 107.8 185.4 260.1 308.7 397.6 569.1 674.6 Other income 0.4 0.4 16.3 Total income 27.2 107.8 185.4 260.1 308.7 398.0 569.4 690.9 COGS -18.4 -65.6 -119.2 -120.0 -129.8 -192.5 -323.7 Gross profit 8.8 42.2 66.2 140.1 179.0 205.5 245.7 Opex -42.6 -76.5 -101.3 -125.7 -135.5 -148.1 -165.8 Associates 0.0 0.0 0.0 0.0 -0.2 -1.6 -1.3 EBITDA -33.8 -34.3 -35.1 14.4 43.3 55.8 78.5 112.4
Note: GP, Opex and Associates not provided in CY16. Source: Company data, Macquarie Research, April 2017
0%
5%
10%
15%
20%
25%
FY09 FY10 FY11 FY12 FY13 FY14 FY15 FY16
Service revenue share Subscriber share
Market share

Macquarie Wealth Management Global Telecom
5 April 2017 7
Australia – 3 (2000)
Hutchison Telecommunications Australia was a fourth entrant in the Australian mobiles market. It
launched CDMA services in 2000, using its own spectrum and network assets for the Sydney and
Melbourne markets, and via a wholesale roaming agreement with Telstra outside of that. In March
2000 it secured 1.8GHz spectrum licences for the five main capital cities for $671m. It also spent
$196m acquiring 2.1GHz spectrum in the same markets in 2001.
HTA used these spectrum assets to launch the country’s first 3G mobile network in April 2003 under
the global brand ‘3’. In 2004, HTA entered into a JV with Telstra for its 3G network, making the two
50/50 partners on the network, sharing spectrum and network assets, and with ‘3’ customers roaming
onto Telstra’s network outside of that.
Unlike many new entrants, ‘3’ was a technology leader with its 3G rollout, and used this to target
higher-value post-paid customers rather than heavily discounted pre-paid plans. It focussed on large
calling and data inclusions relative to competitors (despite high interconnect rates), and also
focussed on-net calling discounts. As a result of its customer bias, revenue share out-paced
subscriber share, which is unusual for new entrants.
‘3’ steadily built its business over this period, but eight years later still had net cash outflows (despite
positive EBITDA). In June 2009, it completed a merger with the number three player in the market,
Vodafone, which returned the Australian market to a three player outcome.
Fig 8 Australia – ‘3’: Achieved 8.2% subscriber share and 10.2% revenue share eight years after launch
Source: Macquarie Research, April 2017
Fig 9 HTA profitability and capex (CY01-08)
(A$ m) CY01 CY02 CY03 CY04 CY05 CY06 CY07 CY08
Sales revenue 124.3 192.7 340.1 767.9 907.3 1055.7 1315.4 1613.4 % ch vs pcp 55.0% 76.5% 125.8% 18.2% 16.4% 24.6% 22.7% Opex -242.2 -211.8 -573.5 -1018.0 -1096 -1043.7 -1247.7 -1463.6 % ch vs pcp -12.6% 170.8% 77.5% 7.7% -4.8% 19.5% 17.3% Cash EBITDA -117.9 -19.1 -233.4 -250.1 -188.7 12 67.7 149.8 % ch vs pcp -83.8% 1122.0% 7.2% -24.6% -106.4% 464.2% 121.3% Capitalised CAC/CRC 5 5 10 15 14.5 18.2 46.3 50.2 % ch vs pcp 0.0% 100.0% 50.0% -3.3% 25.5% 154.4% 8.4% Reported EBITDA -112.9 -14.1 -223.4 -235.1 -174.2 30.2 114 200 % ch vs pcp -87.5% 1484.4% 5.2% -25.9% -117.3% 277.5% 75.4% % EBITDA margin -90.8% -7.3% -65.7% -30.6% -19.2% 2.9% 8.7% 12.4% Capex -329.8 -410.5 -361.9 -307.4 -196.0 -169.8 -287.8 -243.0
Source: Company data, Macquarie Research, April 2017
0%
2%
4%
6%
8%
10%
12%
Jan-00 Jan-01 Jan-02 Jan-03 Jan-04 Jan-05 Jan-06 Jan-07 Jan-08
Revenue share Subscriber share
Macquarie Wealth Management Global Telecom
5 April 2017 8
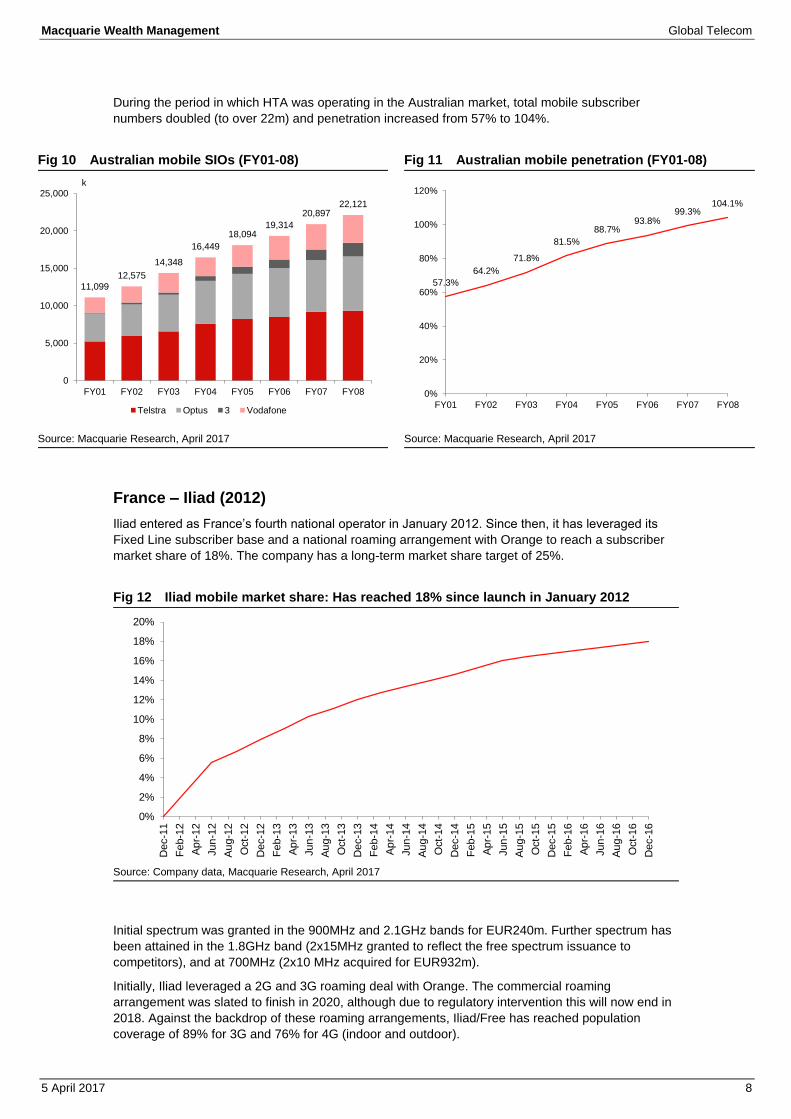
During the period in which HTA was operating in the Australian market, total mobile subscriber
numbers doubled (to over 22m) and penetration increased from 57% to 104%.
Fig 10 Australian mobile SIOs (FY01-08)
Fig 11 Australian mobile penetration (FY01-08)
Source: Macquarie Research, April 2017 Source: Macquarie Research, April 2017
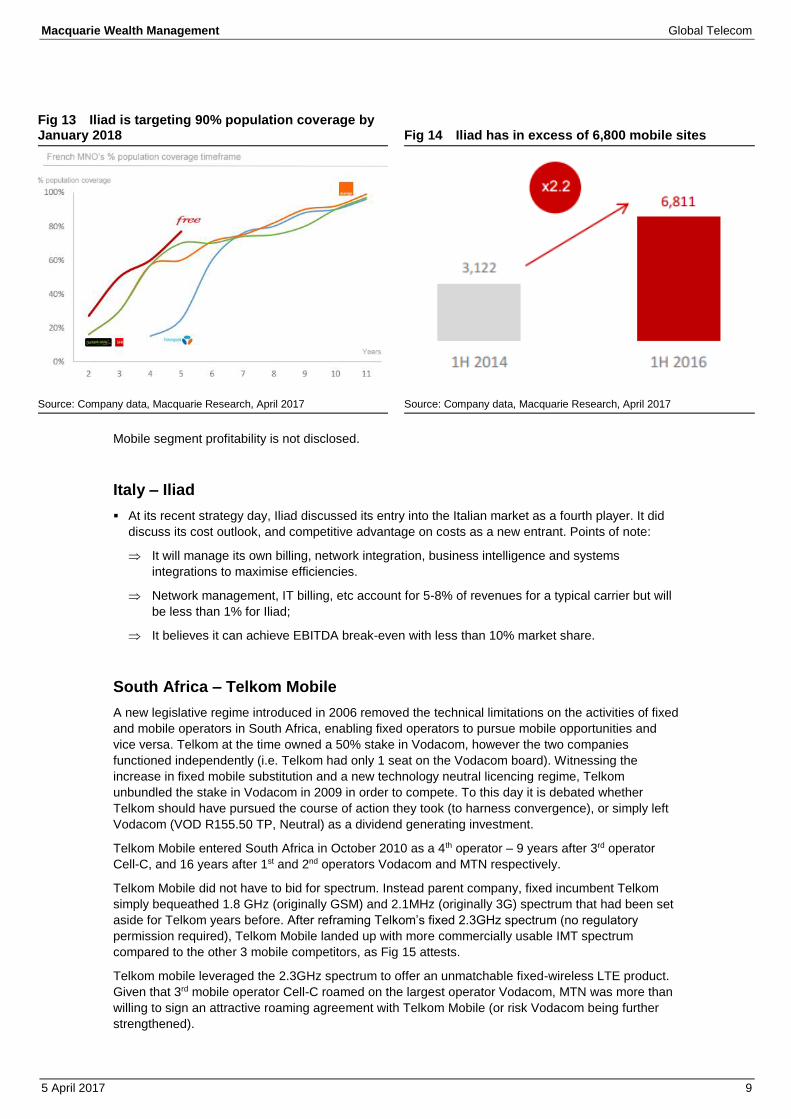
France – Iliad (2012)
Iliad entered as France’s fourth national operator in January 2012. Since then, it has leveraged its
Fixed Line subscriber base and a national roaming arrangement with Orange to reach a subscriber
market share of 18%. The company has a long-term market share target of 25%.
Fig 12 Iliad mobile market share: Has reached 18% since launch in January 2012
Source: Company data, Macquarie Research, April 2017
Initial spectrum was granted in the 900MHz and 2.1GHz bands for EUR240m. Further spectrum has
been attained in the 1.8GHz band (2x15MHz granted to reflect the free spectrum issuance to
competitors), and at 700MHz (2x10 MHz acquired for EUR932m).
Initially, Iliad leveraged a 2G and 3G roaming deal with Orange. The commercial roaming
arrangement was slated to finish in 2020, although due to regulatory intervention this will now end in
2018. Against the backdrop of these roaming arrangements, Iliad/Free has reached population
coverage of 89% for 3G and 76% for 4G (indoor and outdoor).
11,099
12,575
14,348
16,449
18,09419,314
20,89722,121
0
5,000
10,000
15,000
20,000
25,000
FY01 FY02 FY03 FY04 FY05 FY06 FY07 FY08
k
Telstra Optus 3 Vodafone
57.3%
64.2%
71.8%
81.5%
88.7%93.8%
99.3%104.1%
0%
20%
40%
60%
80%
100%
120%
FY01 FY02 FY03 FY04 FY05 FY06 FY07 FY08
0%
2%
4%
6%
8%
10%
12%
14%
16%
18%
20%
Dec-1
1
Feb-1
2
Ap
r-12
Jun
-12
Au
g-1
2
Oct-
12
Dec-1
2
Feb-1
3
Ap
r-13
Jun
-13
Au
g-1
3
Oct-
13
Dec-1
3
Feb-1
4
Ap
r-14
Jun
-14
Au
g-1
4
Oct-
14
Dec-1
4
Feb-1
5
Ap
r-15
Jun
-15
Au
g-1
5
Oct-
15
Dec-1
5
Feb-1
6
Ap
r-16
Jun
-16
Au
g-1
6
Oct-
16
Dec-1
6
Macquarie Wealth Management Global Telecom
5 April 2017 9
Fig 13 Iliad is targeting 90% population coverage by January 2018
Fig 14 Iliad has in excess of 6,800 mobile sites
Source: Company data, Macquarie Research, April 2017 Source: Company data, Macquarie Research, April 2017
Mobile segment profitability is not disclosed.
Italy – Iliad
At its recent strategy day, Iliad discussed its entry into the Italian market as a fourth player. It did
discuss its cost outlook, and competitive advantage on costs as a new entrant. Points of note:
It will manage its own billing, network integration, business intelligence and systems
integrations to maximise efficiencies.
Network management, IT billing, etc account for 5-8% of revenues for a typical carrier but will
be less than 1% for Iliad;
It believes it can achieve EBITDA break-even with less than 10% market share.
South Africa – Telkom Mobile
A new legislative regime introduced in 2006 removed the technical limitations on the activities of fixed
and mobile operators in South Africa, enabling fixed operators to pursue mobile opportunities and
vice versa. Telkom at the time owned a 50% stake in Vodacom, however the two companies
functioned independently (i.e. Telkom had only 1 seat on the Vodacom board). Witnessing the
increase in fixed mobile substitution and a new technology neutral licencing regime, Telkom
unbundled the stake in Vodacom in 2009 in order to compete. To this day it is debated whether
Telkom should have pursued the course of action they took (to harness convergence), or simply left
Vodacom (VOD R155.50 TP, Neutral) as a dividend generating investment.
Telkom Mobile entered South Africa in October 2010 as a 4th operator – 9 years after 3rd operator
Cell-C, and 16 years after 1st and 2nd operators Vodacom and MTN respectively.
Telkom Mobile did not have to bid for spectrum. Instead parent company, fixed incumbent Telkom
simply bequeathed 1.8 GHz (originally GSM) and 2.1MHz (originally 3G) spectrum that had been set
aside for Telkom years before. After reframing Telkom’s fixed 2.3GHz spectrum (no regulatory
permission required), Telkom Mobile landed up with more commercially usable IMT spectrum
compared to the other 3 mobile competitors, as Fig 15 attests.
Telkom mobile leveraged the 2.3GHz spectrum to offer an unmatchable fixed-wireless LTE product.
Given that 3rd mobile operator Cell-C roamed on the largest operator Vodacom, MTN was more than
willing to sign an attractive roaming agreement with Telkom Mobile (or risk Vodacom being further
strengthened).

Macquarie Wealth Management Global Telecom
5 April 2017 10
Telkom Mobile was able to obtain access to Telkom’s tower and fibre transmission infrastructure at
hassle free rates. Although a transfer pricing regime was voluntarily implemented, whether Telkom
Mobile bore the full costs of all their inputs is debatable. The bottom line is that Telkom Mobile
received structure advantages in terms of finance, and access to free spectrum and other
infrastructure that would not be available to a true new entrant.
Telkom Mobile’s entry into the market was fortuitous in that mobile termination rates (MTRs) had
begun a descent to current levels of 20c as per Fig 16. Further high termination rates payable to non-
Significant Market Power operators i.e. Telkom Mobile and Cell-C provided an economic boost to
Telkom Mobile since Oct 2014. Third operator Cell-C by comparison faced a margin squeeze /
market foreclosure scenario their first 10 years of operation as Vodacom and MTN increased peak-
period MTRs from 20c to R1.23, a few weeks before Cell-C’s launch. (The increase process started
once the intention to licence a 3rd operator began in 1999).
Mobile Number Portability had been launched in South Africa since 2005 i.e. 4 years after Cell-C’s
arrival, however prior to Telkom Mobile’s launch.
Telkom Mobile received no specific regulatory obligations i.e. coverage obligations, community
service telephones which had been imposed on the other 3 mobile operators.
Fig 15 South African mobile spectrum holdings
Fig 16 Telkom Mobile benefited from decreasing MTRs
Source: Macquarie Research, April 2017 Source: Macquarie Research, April 2017
Telkom Mobile is the leader on mobile broadband and domestic voice (free on-net), and on our
numbers is gaining subscribers x3 faster than the 3rd mobile operator Cell-C and x5 faster than
incumbents MTN and Vodacom. Growth in market share by SIMs and revenue is indicated in Fig 17
below.
As per Fig 18, Telkom mobile took 5 years to break-even, accumulating just over R7bn in EBITDA
losses. Adding R5.2bn depreciation & amortization on our numbers, yields an over R12.2bn EBIT
loss. Net losses are not given, nor are expected to be given as Telkom transitions to technology-
neutral reporting. However the momentum of the business unit suggests that after 8-9 years of
operation, the business should be net income profitable.
The 5th mobile operator (originally WBS) employed a not widely deployed variation of 3G colloquially
called i-Burst starting in May 2005. The company ran into financial difficulties (in large part due to
incorrect technology choice), and was bought out by MultiSource in 2015. The business model of the
latter appears to be to provide roaming services to operators, in particular Vodacom. The larger
operators i.e. Vodacom and MTN are running into spectrum shortage constraints as LTE spectrum
has not yet been brought to market in South Africa (nor is such on the horizon).
We would not be surprized if MTN similarly enters into a roaming agreement with what may become
the 6th operator, Neotel-Liquid Telecom. Neotel, as per Telkom, was also bequeathed 1800MHz and
2100MHz spectrum as part of a managed liberalization policy process.

Macquarie Wealth Management Global Telecom
5 April 2017 11
Fig 17 Telkom Mobile market shares since launch
Fig 18 Telkom Mobile EBITDA since launch (Oct CY10)
Source: Company data, Macquarie Research, April 2017 Source: Company data, Macquarie Research, April 2017
Canada – Videotron and Wind/Shaw
In Canada, the original AWS auction in 2009 produced a number of new entrants including Wind,
Mobilicity and Public Mobile outside of Quebec, and Videotron (now owned by Quebecor) inside
Quebec.
Mobilicity and Public Mobile were quite small, they went broke and pieces were sold to Rogers and
Telus in 2014. Wind was sold to Shaw in 2015, which became a more sizable competitor.
Due to this activity, there exists two recent examples in Canada of 4th player new entrants – being
Shaw (ex-Quebec), and Videotron (Quebec). Both have facilities based strategies with spectrum
acquired from auction (a set-aside policy gave them a big discount on spectrum).
Canada – Videotron
Videotron is a cable operator in Quebec, evolving from a TV platform to also supplying fixed voice
and data products. It entered mobiles via the acquisition of AWS spectrum in 2009 and has reached
north of a 16% domestic (Quebec-only) subscriber share. Its primary marketing strategy has been to
use its strong spectrum assets to offer large data caps at small price discount to incumbents. Also, it
has bundled the wireless product with cable which has had churn success. After acquiring spectrum,
Videotron built an expansive mobile network in its local market, which allowed it to sign an
advantageous roaming agreement outside of Quebec with Rogers.
Fig 19 Quebecor/Videotron Wireless financials (CY09-16)
(C$ m) 2009 2010 2011 2012 2013 2014 2015 2016
Sales revenue 41.4 53.3 112.7 171.6 220.5 287.7 403.7 510.4 SG&A 29.6 70.2 92.1 102.6 109.1 151.8 234.5 323.0 Marketing Costs 20.5 87.0 84.6 80.2 98.3 111.1 100.1 EBITDA 11.8 (37.4) (66.4) (15.6) 31.2 37.6 58.0 87.3 Capex (110.0) (273.0) (179.0) (160.0) (62.7) (55.8) (70.2) (86.7)
Source: Company data, Macquarie Research, April 2017
Macquarie Wealth Management Global Telecom
5 April 2017 12
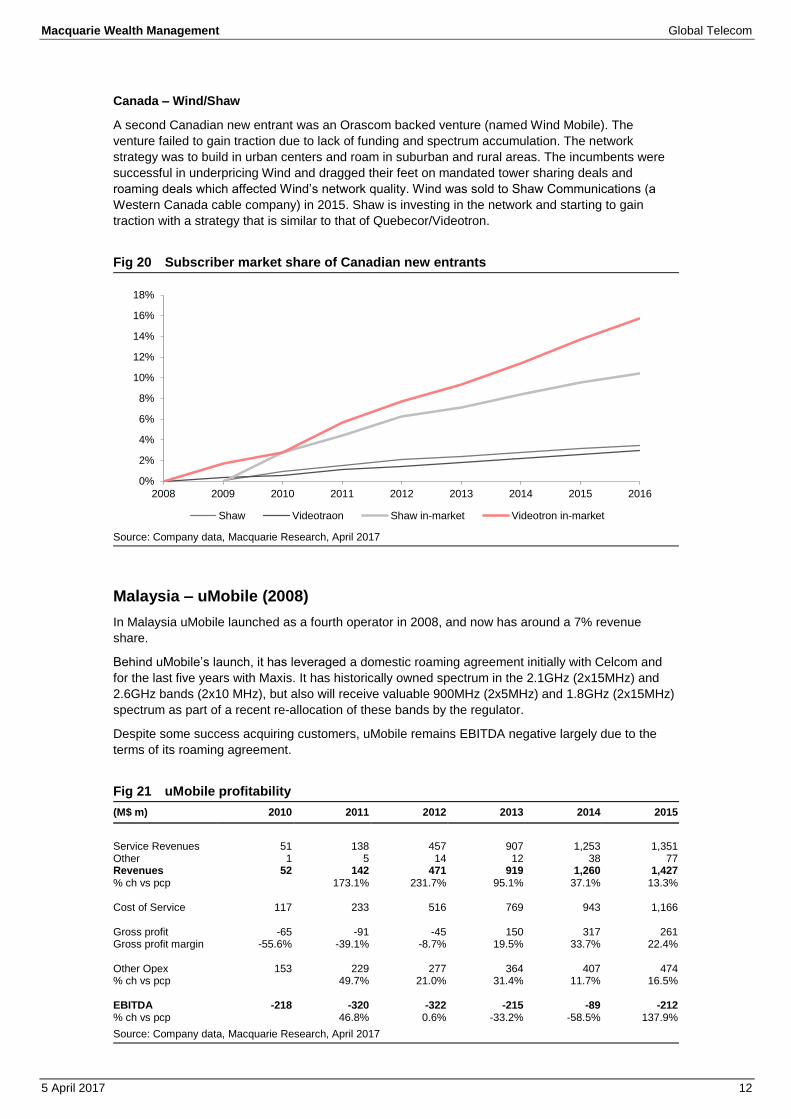
Canada – Wind/Shaw
A second Canadian new entrant was an Orascom backed venture (named Wind Mobile). The
venture failed to gain traction due to lack of funding and spectrum accumulation. The network
strategy was to build in urban centers and roam in suburban and rural areas. The incumbents were
successful in underpricing Wind and dragged their feet on mandated tower sharing deals and
roaming deals which affected Wind’s network quality. Wind was sold to Shaw Communications (a
Western Canada cable company) in 2015. Shaw is investing in the network and starting to gain
traction with a strategy that is similar to that of Quebecor/Videotron.
Fig 20 Subscriber market share of Canadian new entrants
Source: Company data, Macquarie Research, April 2017
Malaysia – uMobile (2008)
In Malaysia uMobile launched as a fourth operator in 2008, and now has around a 7% revenue
share.
Behind uMobile’s launch, it has leveraged a domestic roaming agreement initially with Celcom and
for the last five years with Maxis. It has historically owned spectrum in the 2.1GHz (2x15MHz) and
2.6GHz bands (2x10 MHz), but also will receive valuable 900MHz (2x5MHz) and 1.8GHz (2x15MHz)
spectrum as part of a recent re-allocation of these bands by the regulator.
Despite some success acquiring customers, uMobile remains EBITDA negative largely due to the
terms of its roaming agreement.
Fig 21 uMobile profitability
(M$ m) 2010 2011 2012 2013 2014 2015
Service Revenues 51 138 457 907 1,253 1,351 Other 1 5 14 12 38 77 Revenues 52 142 471 919 1,260 1,427 % ch vs pcp 173.1% 231.7% 95.1% 37.1% 13.3% Cost of Service 117 233 516 769 943 1,166 Gross profit -65 -91 -45 150 317 261 Gross profit margin -55.6% -39.1% -8.7% 19.5% 33.7% 22.4% Other Opex 153 229 277 364 407 474 % ch vs pcp 49.7% 21.0% 31.4% 11.7% 16.5% EBITDA -218 -320 -322 -215 -89 -212 % ch vs pcp 46.8% 0.6% -33.2% -58.5% 137.9%
Source: Company data, Macquarie Research, April 2017
0%
2%
4%
6%
8%
10%
12%
14%
16%
18%
2008 2009 2010 2011 2012 2013 2014 2015 2016
Shaw Videotraon Shaw in-market Videotron in-market

Macquarie Wealth Management Global Telecom
5 April 2017 13
Malaysia – Telekom Malaysia/webe (2016)
Telekom Malaysia, the fixed line incumbent, launched a wireless service running on 850 MHz and
2600 MHz spectrum with a roaming agreement in Celcom in 3Q16. No subscriber or financial
numbers are available as yet, but the business is having some impact on the sector currently.
Management has flagged an initial capex investment of US$390m, and that it hopes to reach
breakeven within three to five years. There is ongoing speculation that a merger between TM and
Celcom will take place, and the market will revert to four major players.
There are a few more small players with 2600 MHz and 2300 MHz based networks but they've
largely rented their spectrum to incumbents and have little market presence.
Philippines – Digitel (2004)
Between 2004 and 2011, Digitel rolled out a network of ~7000 cell sites at an average cost of around
US$250k per site. Digitel was highly disruptive in its pricing strategies, and managed to capture a
10.2% market share in 7 years, before being acquired by PLDT in 2011. Digitel was incurring annual
expenses (opex plus cost of sales) of US$150-250m in the three years prior to acquisition. Note that
during 2004-2011, the Philippine mobile market was less developed and had more points of entry
given a mobile penetration rate of ~70% (versus 110% today).
Singapore – TPG Telecom (2018)
TPG will become the fourth mobile network operator in Singapore, after successfully bidding S$105m
for 60 MHz of spectrum in the New Entrant Spectrum Auction in December. The spectrum is in 2
bands – 2 lots of 900MHz spectrum (paired) and 40 MHz of 2.3GHz spectrum. Spectrum acquired
via the NESA auction will become available in April 2017, and the new entrant will be required to
have a nationwide network by September-2018, at a determined Quality of Service. Further build-out
requirements (such as MTR coverage) are required by 2021.
TPG looking at an efficient network rollout, although further investment in network will
be required
TPG has flagged initial network rollout costs of S$200-300m. The company will leverage NGNBN
fibre backbone for the build, and no doubt will move quickly to secure appropriate site access for
radio equipment. Access to quality sites is often an issue for new mobile builds, and navigating
planning requirements and approvals will be a key challenge here.
Overall, we have allowed S$250m to build a national network (consistent with guidance), with an
additional $250m p.a. to build out the network in subsequent years. We have modelled long-term
maintenance capex of $80m p.a. from FY22. This may prove conservative given that networks have
historically been capital thirsty and operators are pressured to keep up with demand and
technological advances.
In addition, TPG has just announced the purchase of 10MHz of 2.5GHz spectrum at the General
Spectrum Auctions for S$23.8m. At those auctions, the four MNOs spent a total of $1.15bn on
spectrum across four bands.
Fig 22 Singapore: Existing spectrum holding by incumbent operators
700 MHz 900 MHz 1.8 GHz 2.1 GHz 2.3 GHz 2.5 GHz 2.6GHz Total (MHz)
SingTel 40 40 60 40 0 15 20 215 StarHub 30 10 50 40 0 20 20 170 M1 20 10 40 40 0 0 20 130 TPG Telecom 0 20 0 0 40 10 70
Source: Company data, Macquarie Research, April 2017

Macquarie Wealth Management Global Telecom
5 April 2017 14
EBITDA breakeven at 5-6% market share:
Management flagged the business will be EBITDA breakeven on a market share of 5-6%. Given
TPG is likely to enter with a materially lower ARPU than competitors, this would imply opex costs
at breakeven somewhere in the vicinity of $150m. Management has noted previously it is well
placed to leverage existing investments in billing and customer service platforms to contain its cost
base. Mobile services will be offered from 2018 and TPG will likely look to also offer fixed line
services leveraging the NGNBN in the Singapore market for both Consumer and Corporate
customers.
We have assumed that TPG can capture a ~9.3% subscriber share/6.0% revenue share of the
~S$4.3bn Singapore mobile market by FY22, and generating margins of ~27% at that stage.
Fig 23 TPG Mobiles: Macq earnings estimates
Summary table (US$ m) FY17 FY18 FY19 FY20e FY21e FY22e
TPG subscriber share 0.0% 0.0% 1.3% 3.6% 6.3% 9.3% # of subscribers 0 0 109 312 553 825 TPG revenue share 0.0% 0.0% 0.8% 2.3% 4.0% 6.0% ARPU 25.00 25.00 25.75 26.52 Revenues 0 0 33 94 171 263 % ch vs pcp 186.9% 82.2% 53.8% Opex 0 6 97 139 164 193 % ch vs pcp 1508.9% 43.7% 18.3% 17.3% EBITDA 0 -6 -64 -45 7 70 % ch vs pcp 964.3% -29.5% -114.8% 953.6% Spectrum 129 0 75 0 0 0 Network, other 47 141 97 150 150 130 Total Capex 176 141 172 150 150 130
Source: Macquarie Research, April 2017
TPG will also offer fixed line services in Singapore, although we expect the financial implications
will be small in the context of its Mobiles investment.
Long-term view of return generation
Generating an appropriate ROIC will require further growth (beyond a 5-6% share outcome to
reach EBITDA break-even) given the requirement for a return on the S$300-400m up front capex
(including spectrum), as well as allowing for additional spectrum purchases, network maintenance,
and increasing capacity requirements over time. TPG is optimistic, commenting that its expansion
will bring “tremendous value to Singaporean consumers whilst generating excellent long-term
returns for TPG shareholders”.

Macquarie Wealth Management Global Telecom
5 April 2017 15
Fig 24 TPG may need ~12.5% market share longer term to validate investment
Target ROIC pre-tax 12% Invested capital Initial spectrum 105 Initial rollout 275 Additional spectrum 100 Additional rollout 200 Start-up operating losses 50 Total invested capital 730 EBIT to generate ROIC 88 D&A estimate 50 EBITDA requirement 138 Break-even opex 150 Incremental opex 46 Total opex 196 Incremental margin 75% Break-even revenue 150 Incremental revenue 184 Revenue requirement 334 Singapore market size 4000 Implied revenue market share 8.3% Implied subscriber market share 12.5%
Source: Macquarie Research, April 2017
India – Reliance Jio (2016)
The following discussion on Reliance Jio’s entry into the Indian mobiles market is an extract from a
Macquarie report (India Telecom – Growing pains: big fight, bigger appetite) published in May 2016.
Phased launch likely from H2CY16: Reliance Jio is currently under beta for the employees of RIL
(launched in Dec-15); and commercial launch has been delayed twice. We believe that a phased
launch is likely starting in H2CY16, will full-fledged pan-India services towards the end of the year.
RIL has already spent US$18.6bn in setting up RJio; and hence has been a drag on the RIL stock.
We compare the key positives and negatives for RJio ahead of launch.
Macquarie Wealth Management Global Telecom
5 April 2017 16
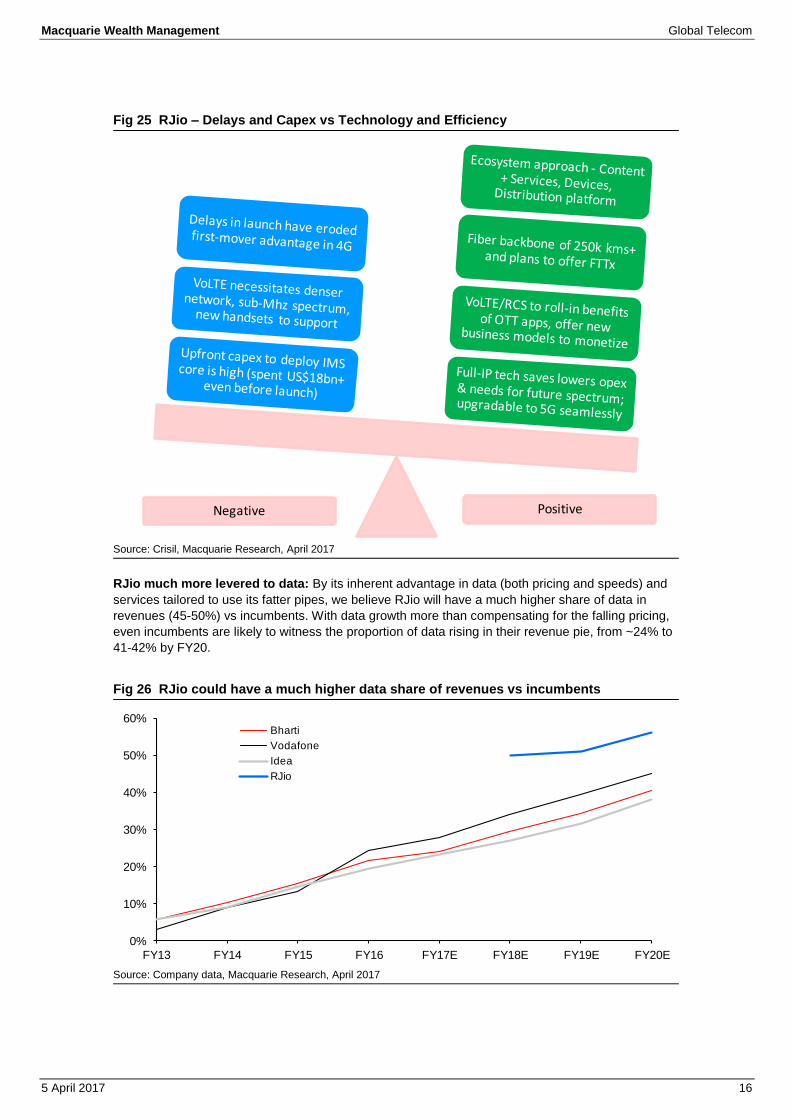
Fig 25 RJio – Delays and Capex vs Technology and Efficiency
Source: Crisil, Macquarie Research, April 2017
RJio much more levered to data: By its inherent advantage in data (both pricing and speeds) and
services tailored to use its fatter pipes, we believe RJio will have a much higher share of data in
revenues (45-50%) vs incumbents. With data growth more than compensating for the falling pricing,
even incumbents are likely to witness the proportion of data rising in their revenue pie, from ~24% to
41-42% by FY20.
Fig 26 RJio could have a much higher data share of revenues vs incumbents
Source: Company data, Macquarie Research, April 2017
Negative Positive
0%
10%
20%
30%
40%
50%
60%
FY13 FY14 FY15 FY16 FY17E FY18E FY19E FY20E
Bharti
Vodafone
Idea
RJio

Macquarie Wealth Management Global Telecom
5 April 2017 17
Key advantages
Jio is using superior technology (all-IP network with VoLTE) enabling better data-speeds (30-
50Mbps vs competition of 10-40Mbps in our recent network tests) at disruptive prices (likely lower
by 20-40%).
A strong fiber backbone of 250k km, which should double over 2 years as per RIL
Ecosystem-approach – Content and services (including apps), see appendix
Significantly lower data pricing and potentially higher speeds
Sub-MHz spectrum
Concerns
Lack of penetrative spectrum: This has been resolved via 800 MHz spectrum-sharing/trading
with RCOM. This concern now gets postponed to 2021, which is when a large chunk of Rcom’s
800 MHz spectrum comes up for renewal via auctions.
Voice services using VoLTE: We do recognize this as a concern, especially considering that
urban-India’s constraints make requisite densification of network for VoLTE a challenge. Also,
many 1-2 year old handsets may not be VoLTE enabled. Nevertheless, services can even be
launched with voice-fallback to 2G/3G using RCOM’s/BSNL network via intra-circle roaming pacts
as the VoLTE market matures.
Delays in launch: Delays in commercial launch of over a year have taken away the first-mover
advantage from RJio, as incumbents have launched 4G in all their key circles to derisk users from
switching away. While further delays to RJIO's launch would be a drag on the RIL stock, we
believe that it is much more important the customer experience be smooth from Day 1, especially
on commoditized-but-essential voice services on untested-in-India VoLTE.
Fig 27 Comparison of key telcos on key service parameters (subjective)
Source: BSE, Media reports, Macquarie Research, April 2017
Macquarie Wealth Management Global Telecom
5 April 2017 18
Potential new entrants
Charter/Comcast – US
Both Comcast and Charter have an MVNO agreement with Verizon. We believe this is their step
into the wireless market and ultimately, they will end up with owner economics.
With the broadcast incentive auction ending, we expect to finally get a glimpse into the Comcast’s
wireless ambitions and details around how much spectrum they were able to secure. Separately,
the company is hosting an Analyst Day on April 6th to discuss their wireless strategy. The focus will
be on churn characteristics, cross-selling opportunities, and wireless’ profitability profile. Details
could include its launch window this year, availability timeline on a per market basis (all X1);
and ideas around bundles and promotions. Comcast recently noted its wireless launch and
handset procurement will pressure margins and create an additional drag on working capital.
Importantly, this could finally resolve their wireless strategy and placate fears of wireless
substitution.
Meanwhile, we believe Charter’s Verizon MVNO fulfils management’s short to medium-term
goals. A mobile offering is expected to come in ’18, driving customer growth and lifetime value. In
the long-term, its wireless strategy will be flexible, leveraging its network capabilities and product
development. Charter is also launching 5G field trials using spectrum test licenses granted by the
FCC to gain insight on its network advantages for 5G.
TPG – Australia
TPG has expressed interest in participating in the current 700 MHz spectrum auctions and
becoming a fourth mobile network operator in Australia.
Rationale: Long-term, the rationale is to be one of four players in a large and growing telco
segment that currently generates $7bn+ in EBITDA. This opportunity far out-scales the fixed
broadband opportunity where we many more participants will fight for a share of notably smaller
EBITDA pool of ~$1.2-1.5bn (for access-seekers). It will allow TPG to more directly leverage its
fibre network beyond fixed line, and as we head into a 5G world.
Rollout cost: This depends entirely upon the strategy TPG looks to pursue. A greenfield rollout
(but using existing fibre assets) allowing $300-400k per site and assuming 2,500-3,500 sites
would equate to capex of $750m to $1.4bn. This is a wide range, and we note the high level of
uncertainty that currently exists with regards to TPG’s strategy here. Based on other network
rollouts ~2,500 sites could get a thin level of capital city coverage and a few other key markets
(65-70% population coverage). This would then be a limited network reach for consumers in many
areas and TPG would have to consider pricing accordingly. Whatever the initial rollout cost, mobile
networks are constantly thirsty for investment and we note both Telstra and Optus will spend over
$1bn on their established mobile networks this year.
In terms of estimating the required site numbers for a network rollout, we have looked at
disclosures from a number of operators who have launched services in Australia. We note, that
700MHz spectrum is “waterfront property” with respect to propagation characteristics (distance
and in-building), which will improve the efficiency of any rollout by TPG. (The volume of sites TPG
ultimately need might correlate more closely to the required depth/capacity for the network as
opposed to simply just population coverage objectives).
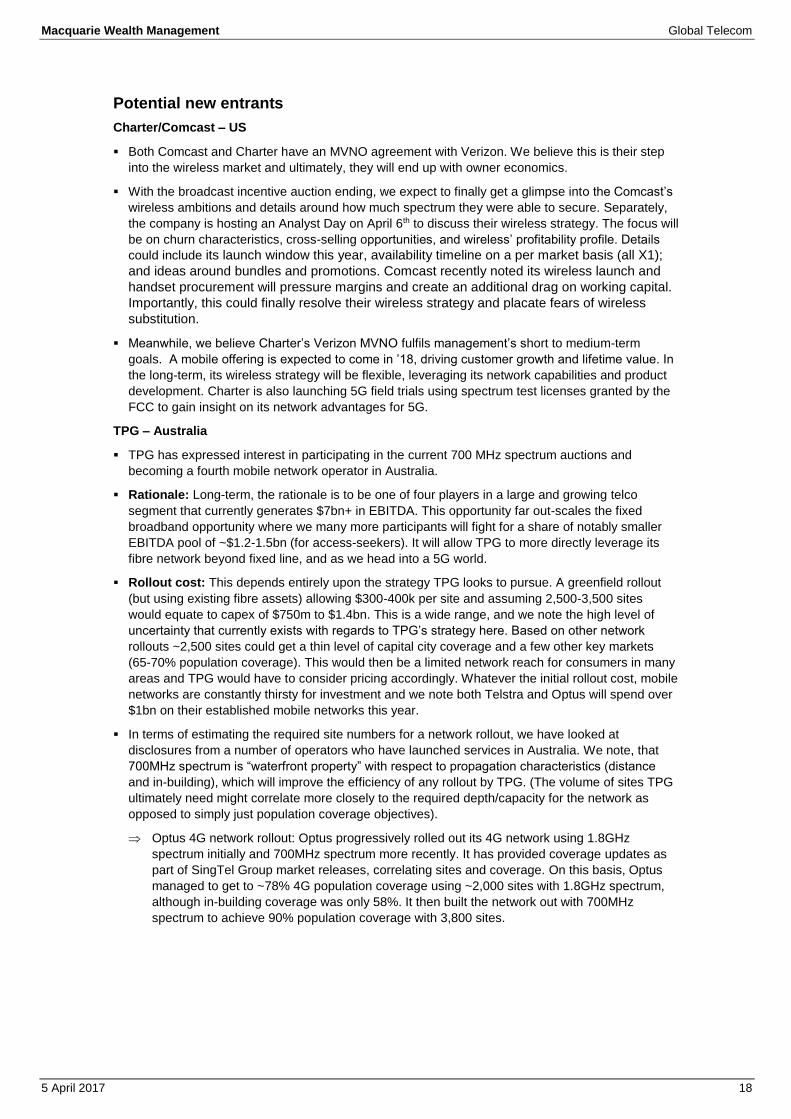
Optus 4G network rollout: Optus progressively rolled out its 4G network using 1.8GHz
spectrum initially and 700MHz spectrum more recently. It has provided coverage updates as
part of SingTel Group market releases, correlating sites and coverage. On this basis, Optus
managed to get to ~78% 4G population coverage using ~2,000 sites with 1.8GHz spectrum,
although in-building coverage was only 58%. It then built the network out with 700MHz
spectrum to achieve 90% population coverage with 3,800 sites.
Macquarie Wealth Management Global Telecom
5 April 2017 19
Fig 28 Optus 4G network rollout
Source: Company reports, Macquarie Research, April 2017
In 2001, '3' secured 2.1GHz spectrum and began rolling out a 3G network. In 2004 it put this
network into a JV with Telstra. According to ACCC documents, the 3GIS network JV
represented 57% population coverage premised on 2,700 base stations in 2009. This network
coverage predominantly relates to capital city coverage and some larger regional centres.
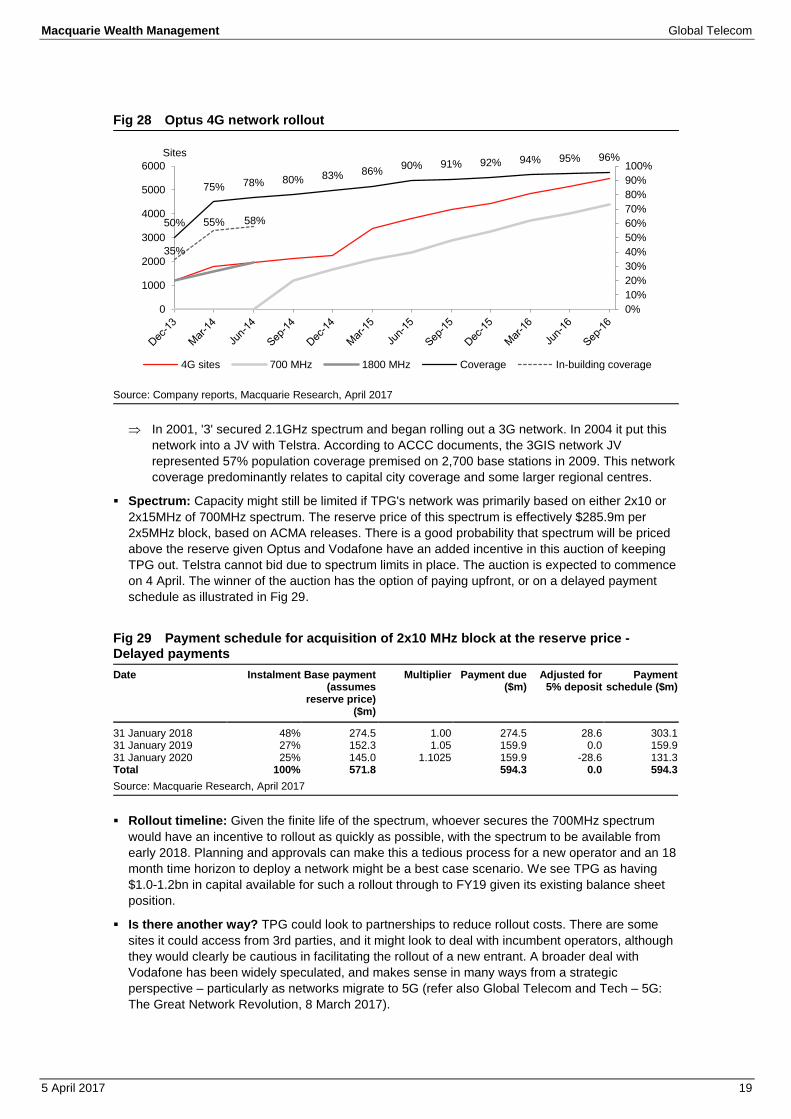
Spectrum: Capacity might still be limited if TPG's network was primarily based on either 2x10 or
2x15MHz of 700MHz spectrum. The reserve price of this spectrum is effectively $285.9m per
2x5MHz block, based on ACMA releases. There is a good probability that spectrum will be priced
above the reserve given Optus and Vodafone have an added incentive in this auction of keeping
TPG out. Telstra cannot bid due to spectrum limits in place. The auction is expected to commence
on 4 April. The winner of the auction has the option of paying upfront, or on a delayed payment
schedule as illustrated in Fig 29.
Fig 29 Payment schedule for acquisition of 2x10 MHz block at the reserve price - Delayed payments
Date Instalment Base payment (assumes
reserve price) ($m)
Multiplier Payment due ($m)
Adjusted for 5% deposit
Payment schedule ($m)
31 January 2018 48% 274.5 1.00 274.5 28.6 303.1 31 January 2019 27% 152.3 1.05 159.9 0.0 159.9 31 January 2020 25% 145.0 1.1025 159.9 -28.6 131.3 Total 100% 571.8 594.3 0.0 594.3
Source: Macquarie Research, April 2017
Rollout timeline: Given the finite life of the spectrum, whoever secures the 700MHz spectrum
would have an incentive to rollout as quickly as possible, with the spectrum to be available from
early 2018. Planning and approvals can make this a tedious process for a new operator and an 18
month time horizon to deploy a network might be a best case scenario. We see TPG as having
$1.0-1.2bn in capital available for such a rollout through to FY19 given its existing balance sheet
position.
Is there another way? TPG could look to partnerships to reduce rollout costs. There are some
sites it could access from 3rd parties, and it might look to deal with incumbent operators, although
they would clearly be cautious in facilitating the rollout of a new entrant. A broader deal with
Vodafone has been widely speculated, and makes sense in many ways from a strategic
perspective – particularly as networks migrate to 5G (refer also Global Telecom and Tech – 5G:
The Great Network Revolution, 8 March 2017).
50%
75% 78% 80% 83% 86%90% 91% 92% 94% 95% 96%
35%
55% 58%
0%
10%
20%
30%
40%
50%
60%
70%
80%
90%
100%
0
1000
2000
3000
4000
5000
6000
Sites
4G sites 700 MHz 1800 MHz Coverage In-building coverage
Macquarie Wealth Management Global Telecom
5 April 2017 20
Important disclosures:
Recommendation definitions
Macquarie - Australia/New Zealand Outperform – return >3% in excess of benchmark return Neutral – return within 3% of benchmark return Underperform – return >3% below benchmark return Benchmark return is determined by long term nominal GDP growth plus 12 month forward market dividend yield
Macquarie – Asia/Europe Outperform – expected return >+10% Neutral – expected return from -10% to +10% Underperform – expected return <-10%
Macquarie – South Africa Outperform – expected return >+10% Neutral – expected return from -10% to +10% Underperform – expected return <-10%
Macquarie - Canada
Outperform – return >5% in excess of benchmark return Neutral – return within 5% of benchmark return Underperform – return >5% below benchmark return
Macquarie - USA Outperform (Buy) – return >5% in excess of Russell 3000 index return Neutral (Hold) – return within 5% of Russell 3000 index return Underperform (Sell)– return >5% below Russell 3000 index return
Volatility index definition*
This is calculated from the volatility of historical price movements. Very high–highest risk – Stock should be
expected to move up or down 60–100% in a year – investors should be aware this stock is highly speculative. High – stock should be expected to move up or down at least 40–60% in a year – investors should be aware this stock could be speculative. Medium – stock should be expected to move up or down at least 30–40% in a year. Low–medium – stock should be expected to move up or down at least 25–30% in a year. Low – stock should be expected to move up or down at least 15–25% in a year. * Applicable to Asia/Australian/NZ/Canada stocks only
Recommendations – 12 months Note: Quant recommendations may differ from Fundamental Analyst recommendations
Financial definitions
All "Adjusted" data items have had the following adjustments made: Added back: goodwill amortisation, provision for catastrophe reserves, IFRS derivatives & hedging, IFRS impairments & IFRS interest expense Excluded: non recurring items, asset revals, property revals, appraisal value uplift, preference dividends & minority interests EPS = adjusted net profit / efpowa* ROA = adjusted ebit / average total assets ROA Banks/Insurance = adjusted net profit /average total assets ROE = adjusted net profit / average shareholders funds Gross cashflow = adjusted net profit + depreciation *equivalent fully paid ordinary weighted average number of shares All Reported numbers for Australian/NZ listed stocks are modelled under IFRS (International Financial Reporting Standards).
Recommendation proportions – For quarter ending 31 December 2016
AU/NZ Asia RSA USA CA EUR Outperform 57.53% 50.72% 45.57% 42.28% 60.58% 52.79% (for global coverage by Macquarie, 8.71% of stocks followed are investment banking clients)
Neutral 33.90% 33.97% 43.04% 50.11% 37.23% 35.62% (for global coverage by Macquarie, 8.05% of stocks followed are investment banking clients)
Underperform 8.56% 15.30% 11.39% 7.61% 2.19% 11.59% (for global coverage by Macquarie, 4.63% of stocks followed are investment banking clients)
Company-specific disclosures: Important disclosure information regarding the subject companies covered in this report is available at www.macquarie.com/research/disclosures.
Analyst certification: We hereby certify that all of the views expressed in this report accurately reflect our personal views about the subject company or companies and its or their securities. We also certify that no part of our compensation was, is or will be, directly or indirectly, related to the specific recommendations or views expressed in this report. The Analysts responsible for preparing this report receive compensation from Macquarie that is based upon various factors including Macquarie Group Limited (MGL) total revenues, a portion of which are generated by Macquarie Group’s Investment Banking activities. General disclosure: This research has been issued by Macquarie Securities (Australia) Limited ABN 58 002 832 126, AFSL 238947, a Participant of the ASX and Chi-X Australia Pty Limited. This research is distributed in Australia by Macquarie Wealth Management, a division of Macquarie Equities Limited ABN 41 002 574 923 AFSL 237504 ("MEL"), a Participant of the ASX, and in New Zealand by Macquarie Equities New Zealand Limited (“MENZ”) an NZX Firm. Macquarie Private Wealth’s services in New Zealand are provided by MENZ. Macquarie Bank Limited (ABN 46 008 583 542, AFSL No. 237502) (“MBL”) is a company incorporated in Australia and authorised under the Banking Act 1959 (Australia) to conduct banking business in Australia. None of MBL, MGL or MENZ is registered as a bank in New Zealand by the Reserve Bank of New Zealand under the Reserve Bank of New Zealand Act 1989. Apart from Macquarie Bank Limited ABN 46 008 583 542 (MBL), any MGL subsidiary noted in this research, , is not an authorised deposit-taking institution for the purposes of the Banking Act 1959 (Australia) and that subsidiary’s obligations do not represent deposits or other liabilities of MBL. MBL does not guarantee or otherwise provide assurance in respect of the obligations of that subsidiary, unless noted otherwise. This research contains general advice and does not take account of your objectives, financial situation or needs. Before acting on this general advice, you should consider the appropriateness of the advice having regard to your situation. We recommend you obtain financial, legal and taxation advice before making any financial investment decision. This research has been prepared for the use of the clients of the Macquarie Group and must not be copied, either in whole or in part, or distributed to any other person. If you are not the intended recipient, you must not use or disclose this research in any way. If you received it in error, please tell us immediately by return e-mail and delete the document. We do not guarantee the integrity of any e-mails or attached files and are not responsible for any changes made to them by any other person. Nothing in this research shall be construed as a solicitation to buy or sell any security or product, or to engage in or refrain from engaging in any transaction. This research is based on information obtained from sources believed to be reliable, but the Macquarie Group does not make any representation or warranty that it is accurate, complete or up to date. We accept no obligation to correct or update the information or opinions in it. Opinions expressed are subject to change without notice. The Macquarie Group accepts no liability whatsoever for any direct, indirect, consequential or other loss arising from any use of this research and/or further communication in relation to this research. The Macquarie Group produces a variety of research products, recommendations contained in one type of research product may differ from recommendations contained in other types of research. The Macquarie Group has established and implemented a conflicts policy at group level, which may be revised and updated from time to time, pursuant to regulatory requirements; which sets out how we must seek to identify and manage all material conflicts of interest. The Macquarie Group, its officers and employees may have conflicting roles in the financial products referred to in this research and, as such, may effect transactions which are not consistent with the recommendations (if any) in this research. The Macquarie Group may receive fees, brokerage or commissions for acting in those capacities and the reader should assume that this is the case. The Macquarie Group‘s employees or officers may provide oral or written opinions to its clients which are contrary to the opinions expressed in this research. Important disclosure information regarding the subject companies covered in this report is available at www.macquarie.com/disclosures © Macquarie Group
This publication was disseminated on 05 April 2017 at 13:13 UTC.