global gender
TRANSCRIPT


© BoardEx 2021, a part of the Euromoney Institutional Investor PLC Group. All rights reserved.This publication is for your information only and is not intended as an offer, or a solicitation of an offer, to buy or sell any product or other specific service. All information and opinions indicated are subject to change without notice.
Global Gender Balance Report
BoardEx | Global Gender Balance Report 2021
TABLE OF CONTENTS
1 Executive Summary
3 Introduction
4 Global Board Gender Balance at the End of 2020
9 Executive and Non-Executive Directors
13 Leadership Teams
16 Company-Level Analysis of Female Partcipation on Boards
18 Nationally Mandated Female Board Representation
21 About BoardEx
22 Attribution Policy
1BoardEx | Global Gender Balance Report 2021
EXECUTIVE SUMMARY
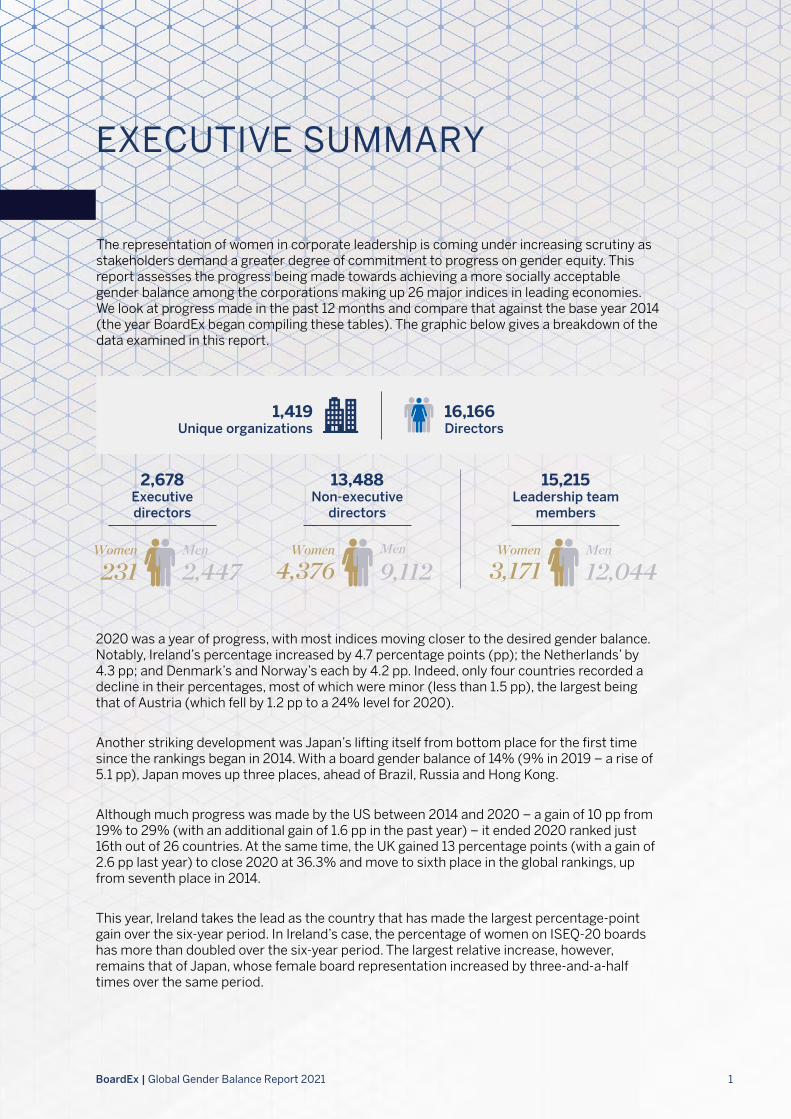
The representation of women in corporate leadership is coming under increasing scrutiny as stakeholders demand a greater degree of commitment to progress on gender equity. This report assesses the progress being made towards achieving a more socially acceptable gender balance among the corporations making up 26 major indices in leading economies. We look at progress made in the past 12 months and compare that against the base year 2014 (the year BoardEx began compiling these tables). The graphic below gives a breakdown of the data examined in this report.
2020 was a year of progress, with most indices moving closer to the desired gender balance. Notably, Ireland’s percentage increased by 4.7 percentage points (pp); the Netherlands’ by 4.3 pp; and Denmark’s and Norway’s each by 4.2 pp. Indeed, only four countries recorded a decline in their percentages, most of which were minor (less than 1.5 pp), the largest being that of Austria (which fell by 1.2 pp to a 24% level for 2020).
Another striking development was Japan’s lifting itself from bottom place for the first time since the rankings began in 2014. With a board gender balance of 14% (9% in 2019 – a rise of 5.1 pp), Japan moves up three places, ahead of Brazil, Russia and Hong Kong.
Although much progress was made by the US between 2014 and 2020 – a gain of 10 pp from 19% to 29% (with an additional gain of 1.6 pp in the past year) – it ended 2020 ranked just 16th out of 26 countries. At the same time, the UK gained 13 percentage points (with a gain of 2.6 pp last year) to close 2020 at 36.3% and move to sixth place in the global rankings, up from seventh place in 2014.
This year, Ireland takes the lead as the country that has made the largest percentage-point gain over the six-year period. In Ireland’s case, the percentage of women on ISEQ-20 boards has more than doubled over the six-year period. The largest relative increase, however, remains that of Japan, whose female board representation increased by three-and-a-half times over the same period.
2,678 Executive directors
231Women
2,447Men
13,488 Non-executive
directors
4,376Women
9,112Men
15,215 Leadership team
members
3,171Women
12,044Men
16,166Directors
1,419Unique organizations
2BoardEx | Global Gender Balance Report 2021
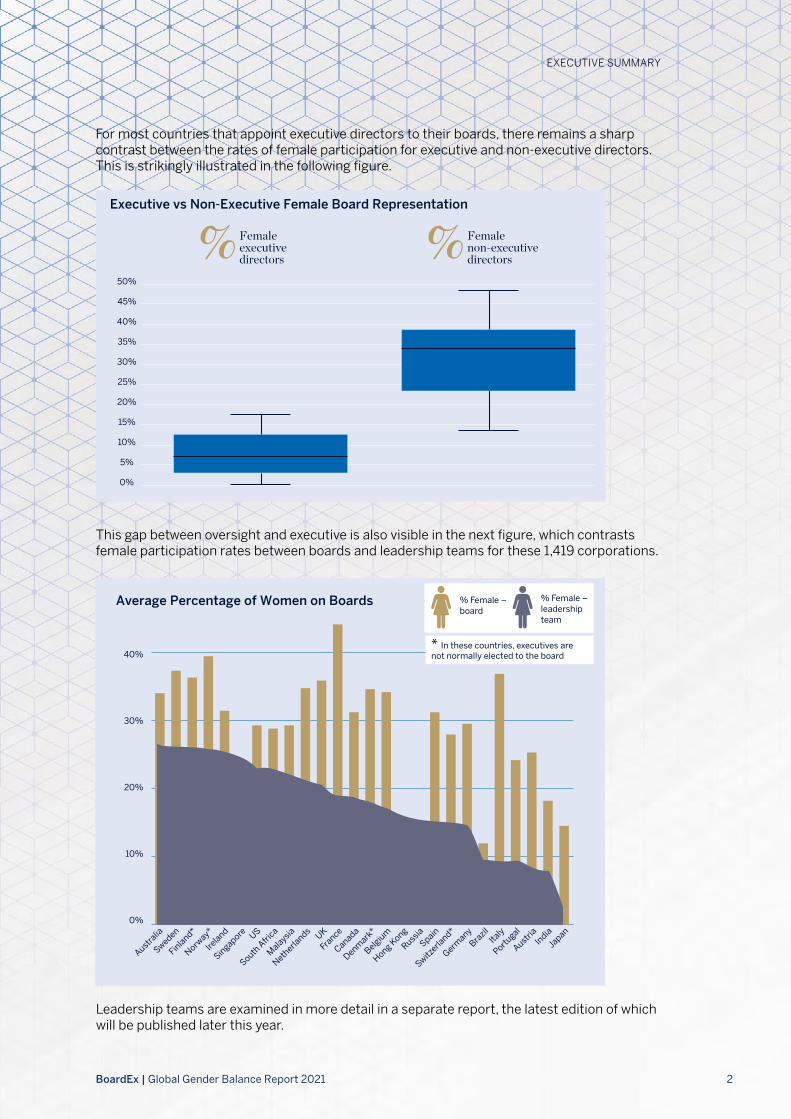
For most countries that appoint executive directors to their boards, there remains a sharp contrast between the rates of female participation for executive and non-executive directors. This is strikingly illustrated in the following figure.
These two box plots illustrate the striking di�erence in female board representation at executive and non-executive director levels. There is virtually no overlap between the two measures and no index exceeds 17.5% for female representation among its executive directors.
25%
30%
35%
40%
45%
50%
20%
15%
10%
5%
0%
Female executive directors
Female non-executive directors
Executive vs Non-Executive Female Board Representation
Australia
Sweden
Finland*
Norway*
Ireland
Singapore US
South A
frica
Malaysia
Netherla
nds
Canada
FranceUK
Denmark
*
Belgium
Hong Kong
RussiaSpain
Switzerla
nd*
Germany
Brazil
Italy
Portugal
India
Austria
Japan0%
10%
20%
30%
40%* In these countries, executives are not normally elected to the board
% Female – board
% Female – leadership team
Average Percentage of Women on Boards
This gap between oversight and executive is also visible in the next figure, which contrasts female participation rates between boards and leadership teams for these 1,419 corporations.
Leadership teams are examined in more detail in a separate report, the latest edition of which will be published later this year.
EXECUTIVE SUMMARY

3BoardEx | Global Gender Balance Report 2021
INTRODUCTION
In 2020, significant progress was made in advancing gender equity on the boards of major corporations across the world. Japan, perennial winner of the wooden spoon for gender balance, moved off the bottom this year, rising no fewer than three positions in the league table. However, this improvement has not been uniform; some countries continue to lag markedly behind best practice. Looking at the executive versus non-executive board split, we found that progress remains less pronounced. The difference in female participation that was evident last year remains in place, as does the gap between the ratios found at board and leadership-team levels. Clearly, much remains to be done; the progress to date could be characterized as the “first wave” of board equality, with a “second wave”, focused on executive gender equality, still – it is hoped – to come.
This report is a comparative study of gender balance across the major global indices. It looks at the performance of the corporations that make up the principal global equity indices at aggregate level and evaluates progress on increasing female participation at board, executive director and non-executive director levels. It also briefly considers the composition of leadership teams at these firms. This report is based on a subset of BoardEx data at the end of 2020. BoardEx includes profiles of more than 2 million organizations around the world and the more than 1.5 million people who lead them.
Dominick is Head of Data Science at Euromoney People Intelligence, a portfolio of brands that includes BoardEx. Before this he was Chief Data Officer of BoardEx. He has almost 40 years’ experience in data analytics and statistics, having worked in environmental science, investment banking (as chief economist) and Head of the Data Division at BoardEx. He has master’s degrees in economics, business administration and data analytics and is a professional fellow of the Royal Statistical Society.
Dominick SuttonHead of Data Science, Euromoney People [email protected]
Alex is Head of Data Visualisation for Euromoney’s People Intelligence pillar. He is in charge of internal reporting, data governance and initiatives on productising data. Previously he was at BoardEx (now part of Euromoney) for many years, working in data operations management, technology processes, collaborating with marketing and external clients, and producing reports, analytics and visualisations. He holds a degree in business and a master’s in international finance.
Alex ArchitektonidisHead of Data Visualisation, Euromoney People [email protected]

4BoardEx | Global Gender Balance Report 2021
GLOBAL BOARD GENDER BALANCE AT THE END OF 2020
The global gender-balance position is represented by 26 major countries in this analysis. They, in turn, are represented by 27 indices, the major index for each country plus the Europe-wide Eurotop index. It should be noted that corporations in four of these countries (Norway, Denmark, Finland and Switzerland) do not normally elect executive directors to their boards. The full list of countries and indices is given in Appendix 1.
Figure 1 shows the overall position of these countries and indices at the end of 2020.
In Figure 1, the mean female percentage in each case is indicated by the gold bar, the male by the silver. France tops the poll, with 44% of board positions held by women, up slightly from 43% in 2019; at the other end of the scale is Russia and Brazil, where just over 12% of directors are female. A big change at the bottom of this ranking in 2020 is Japan, moving from last position for the first time since the ranking was originally calculated in 20141. With a board gender balance of 14% (8.8% in 2019 – a change of 5.2 pp) it has moved up three places and now sits ahead of Brazil, Russia and Hong Kong. The mean percentage of women on boards across these countries and indices is 29% (up from 27% in 2019), with three countries (Malaysia, South Africa and the US) in line with this average.
0%
20%
40%
60%
80%
100%
France
Norway*
SwedenIta
ly
Finland*UK
Europe-w
ide
Denmark
*
Belgium
Netherla
nds
Australia
Ireland
Spain
Canada
Germany
Malaysia US
South A
frica
Switzerla
nd*
Austria
Portugal
SingaporeIn
dia
Japan
Hong Kong
RussiaBra
zil
44
56
40
60
3763
3763
3763
3664
3664
3664
3664
3466
3466
3169
3169
3169
3070
2971
2971
2971
2773
2476
2476
1783
1783
1486
1387
1288
1288
* Countries that do not normally appoint executive directors
Average Percentage of Women on Boards
Figure 1
1 A reclassification of some Danish dual boards has resulted in the Danish 2019 percentage moving from 27.3% to 31.6%. This is now reflected in the appendix tables in the Global Gender Balance Report 2021 Appendix document.
EUROPE CONTINUES TO LEAD BUT THERE IS STILL WORK TO DO

5BoardEx | Global Gender Balance Report 2021
In contrast, the mean percentage of women on boards across all of these countries and indices was 19% in 2014. That year, the poll was topped by Norway (with 38%); France came second with 32%. The US was also on the average that year at 19%.
There have been several other changes in board gender representation since last year, in addition to that of Japan. Most notably, Ireland’s percentage increased by 4.7 pp; the Netherlands’ by 4.3 pp; and Denmark’s and Norway’s each by 4.2 pp. Indeed, only four countries saw a decline in their percentages, all of which were minor (less than 1.5 pp), the largest being that of Austria (which fell by 1.2 pp to a 24.2% level for 2020).
The full tables for these countries from 2014 to 2020 are given in Appendix 2.
GLOBAL BOARD GENDER BALANCE AT THE END OF 2020
These box plots show the progress made across the board since 2014. All countries have clearly improved their performance in the period of 2020, with the bulk of countries (represented by the blue box) having made significant progress. Whereas, in 2014, 75% of indices had boards with less than 25% female members, by 2020, 75% of indices’ boards had more than 22% female members. To avoid double counting, these plots exclude the Europe-wide index.
25%
30%
35%
40%
45%
50%
20%
15%
10%
5%
0%
Female directors on boards
2020Female directors on boards
2014
A Snapshot of How Female Director Percentages Have Changed Since 2014
Figure 2
6BoardEx | Global Gender Balance Report 2021
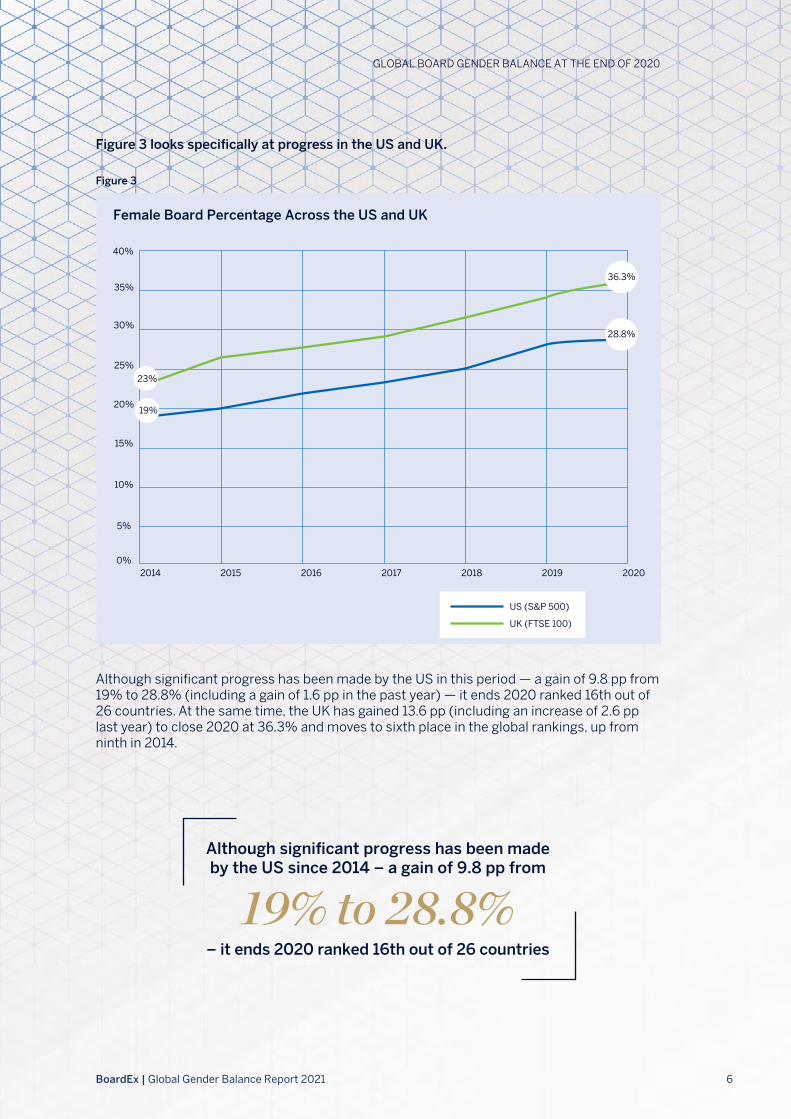
Figure 3 looks specifically at progress in the US and UK.
Although significant progress has been made by the US in this period — a gain of 9.8 pp from 19% to 28.8% (including a gain of 1.6 pp in the past year) — it ends 2020 ranked 16th out of 26 countries. At the same time, the UK has gained 13.6 pp (including an increase of 2.6 pp last year) to close 2020 at 36.3% and moves to sixth place in the global rankings, up from ninth in 2014.
25%
30%
35%
20%
15%
10%
5%
0%2014 2015 2016 2017 2018 2019 2020
40%
US (S&P 500)
UK (FTSE 100)
36.3%
28.8%
19%
23%
Female Board Percentage Across the US and UK
Figure 3
GLOBAL BOARD GENDER BALANCE AT THE END OF 2020
19% to 28.8%Although significant progress has been made by the US since 2014 – a gain of 9.8 pp from
– it ends 2020 ranked 16th out of 26 countries
7BoardEx | Global Gender Balance Report 2021
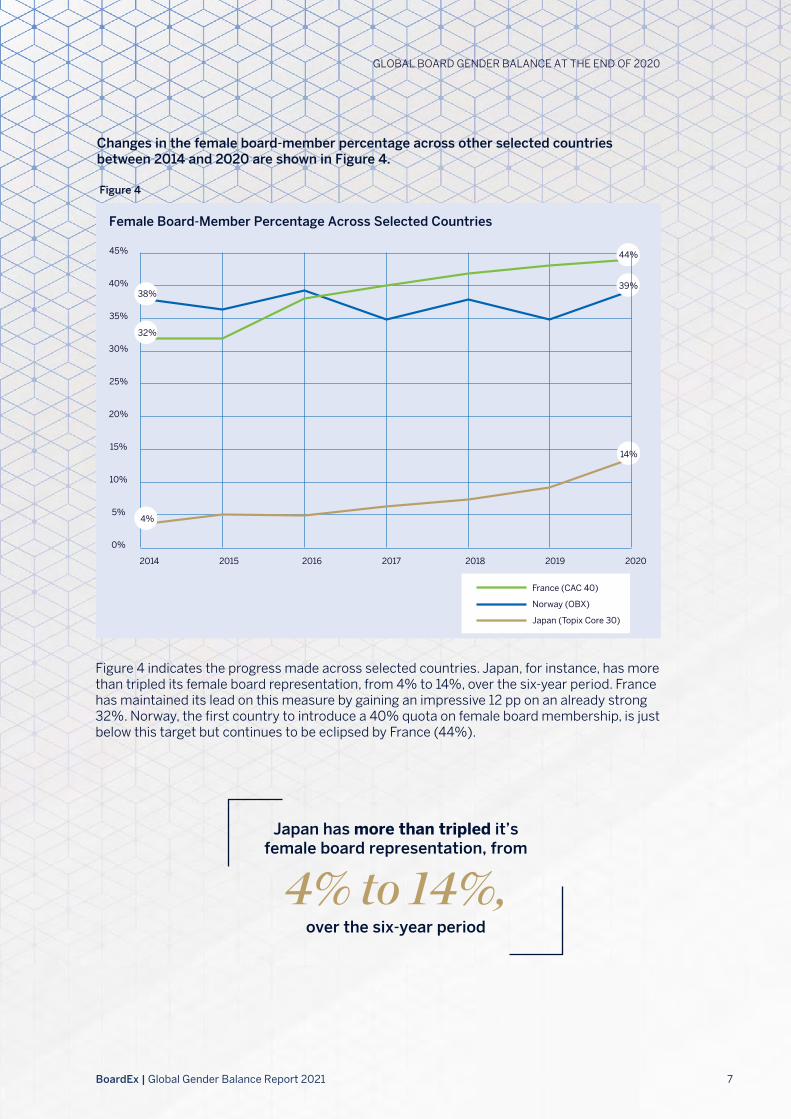
Figure 4 indicates the progress made across selected countries. Japan, for instance, has more than tripled its female board representation, from 4% to 14%, over the six-year period. France has maintained its lead on this measure by gaining an impressive 12 pp on an already strong 32%. Norway, the first country to introduce a 40% quota on female board membership, is just below this target but continues to be eclipsed by France (44%).
25%
30%
35%
40%
45%
20%
15%
10%
5%
0%
38%
32%
44%
39%
14%
4%
2014 2015 2016 2017 2018 2019
France (CAC 40)
Norway (OBX)
Japan (Topix Core 30)
2020
Female Board-Member Percentage Across Selected Countries
Figure 4
4% to 14%,Japan has more than tripled it’s
female board representation, from
over the six-year period
Changes in the female board-member percentage across other selected countries between 2014 and 2020 are shown in Figure 4.
GLOBAL BOARD GENDER BALANCE AT THE END OF 2020
8BoardEx | Global Gender Balance Report 2021
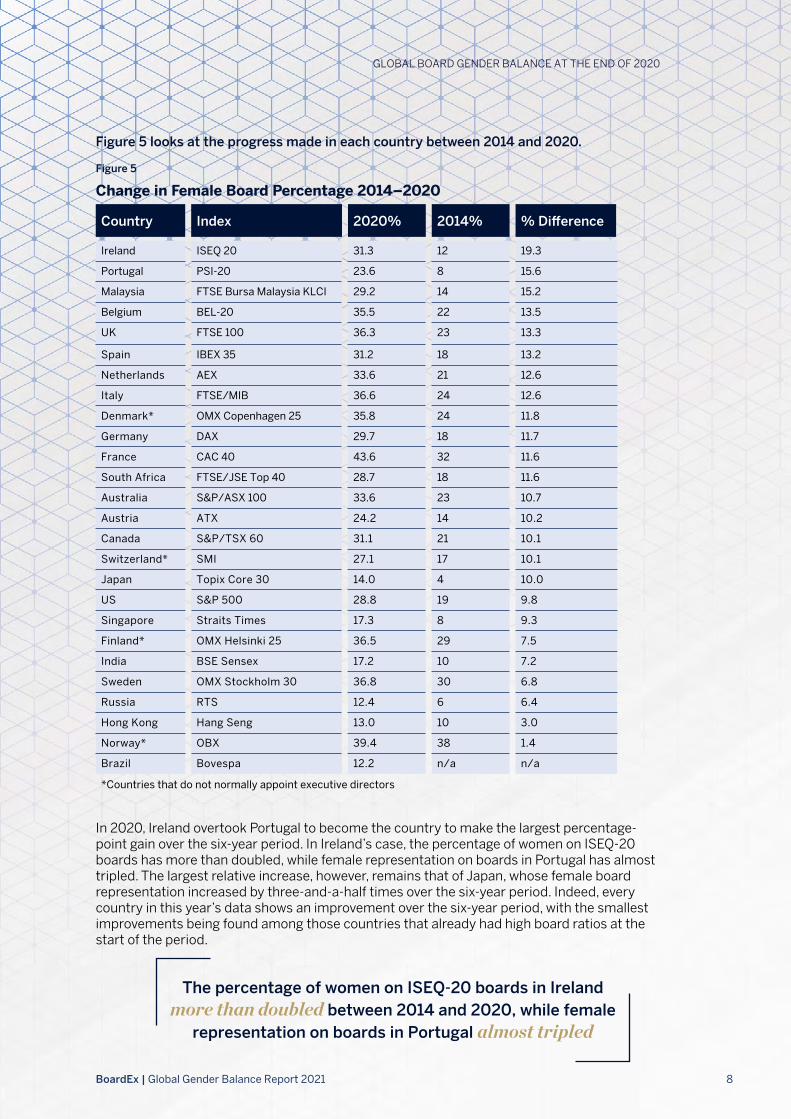
Figure 5 looks at the progress made in each country between 2014 and 2020.
In 2020, Ireland overtook Portugal to become the country to make the largest percentage-point gain over the six-year period. In Ireland’s case, the percentage of women on ISEQ-20 boards has more than doubled, while female representation on boards in Portugal has almost tripled. The largest relative increase, however, remains that of Japan, whose female board representation increased by three-and-a-half times over the six-year period. Indeed, every country in this year’s data shows an improvement over the six-year period, with the smallest improvements being found among those countries that already had high board ratios at the start of the period.
Figure 5
Change in Female Board Percentage 2014–2020
Ireland ISEQ 20 31.3 12 19.3
Portugal PSI-20 23.6 8 15.6
Malaysia FTSE Bursa Malaysia KLCI 29.2 14 15.2
Belgium BEL-20 35.5 22 13.5
UK FTSE 100 36.3 23 13.3
Spain IBEX 35 31.2 18 13.2
Netherlands AEX 33.6 21 12.6
Italy FTSE/MIB 36.6 24 12.6
Denmark* OMX Copenhagen 25 35.8 24 11.8
Germany DAX 29.7 18 11.7
France CAC 40 43.6 32 11.6
South Africa FTSE/JSE Top 40 28.7 18 11.6
Australia S&P/ASX 100 33.6 23 10.7
Austria ATX 24.2 14 10.2
Canada S&P/TSX 60 31.1 21 10.1
Switzerland* SMI 27.1 17 10.1
Japan Topix Core 30 14.0 4 10.0
US S&P 500 28.8 19 9.8
Singapore Straits Times 17.3 8 9.3
Finland* OMX Helsinki 25 36.5 29 7.5
India BSE Sensex 17.2 10 7.2
Sweden OMX Stockholm 30 36.8 30 6.8
Russia RTS 12.4 6 6.4
Hong Kong Hang Seng 13.0 10 3.0
Norway* OBX 39.4 38 1.4
Brazil Bovespa 12.2 n/a n/a
*Countries that do not normally appoint executive directors
Country Index 2020% 2014% % Difference
The percentage of women on ISEQ-20 boards in Ireland more than doubled between 2014 and 2020, while female
representation on boards in Portugal almost tripled
GLOBAL BOARD GENDER BALANCE AT THE END OF 2020
9BoardEx | Global Gender Balance Report 2021
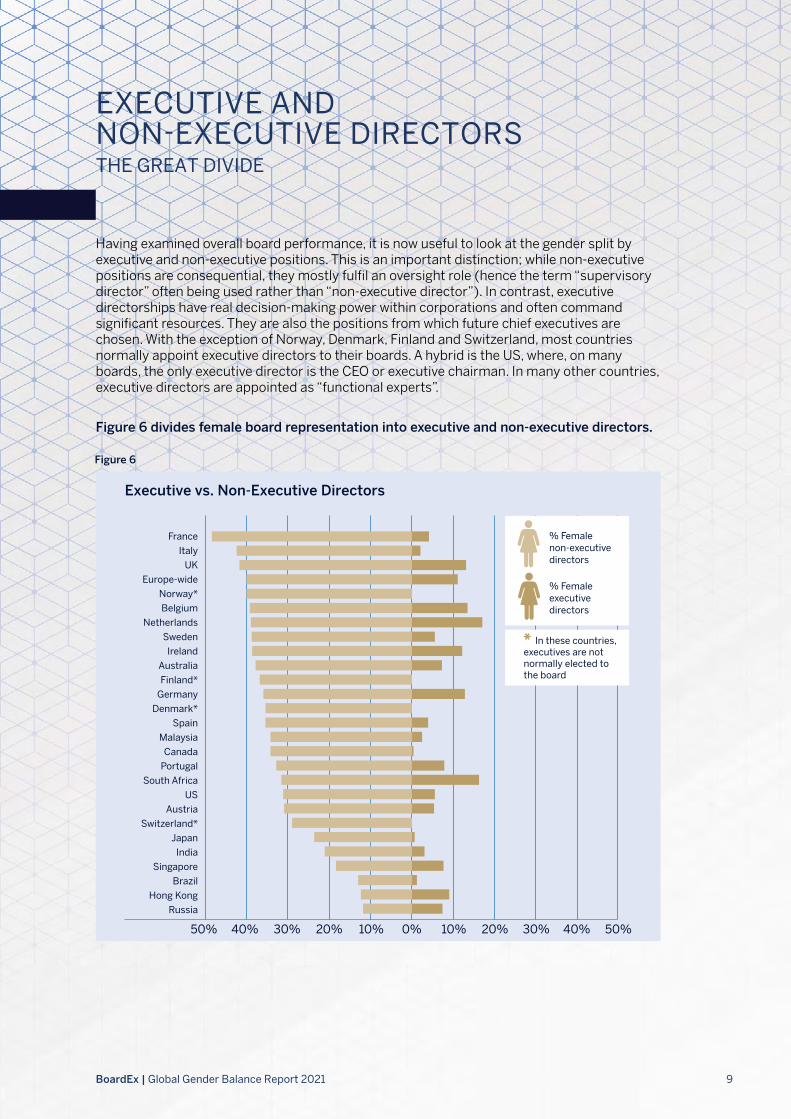
Having examined overall board performance, it is now useful to look at the gender split by executive and non-executive positions. This is an important distinction; while non-executive positions are consequential, they mostly fulfil an oversight role (hence the term “supervisory director” often being used rather than “non-executive director”). In contrast, executive directorships have real decision-making power within corporations and often command significant resources. They are also the positions from which future chief executives are chosen. With the exception of Norway, Denmark, Finland and Switzerland, most countries normally appoint executive directors to their boards. A hybrid is the US, where, on many boards, the only executive director is the CEO or executive chairman. In many other countries, executive directors are appointed as “functional experts”.
Figure 6 divides female board representation into executive and non-executive directors.
FranceItaly
UKEurope-wide
Norway*Belgium
NetherlandsSwedenIreland
AustraliaFinland*
GermanyDenmark*
SpainMalaysia
CanadaPortugal
South AfricaUS
AustriaSwitzerland*
JapanIndia
SingaporeBrazil
Hong KongRussia
50% 40% 30% 20% 10% 0% 10% 20% 30% 40% 50%
% Female non-executive directors
% Female executive directors
* In these countries, executives are not normally elected to the board
Executive vs. Non-Executive Directors
Figure 6
EXECUTIVE AND NON-EXECUTIVE DIRECTORSTHE GREAT DIVIDE
10BoardEx | Global Gender Balance Report 2021
Two things are immediately apparent here.
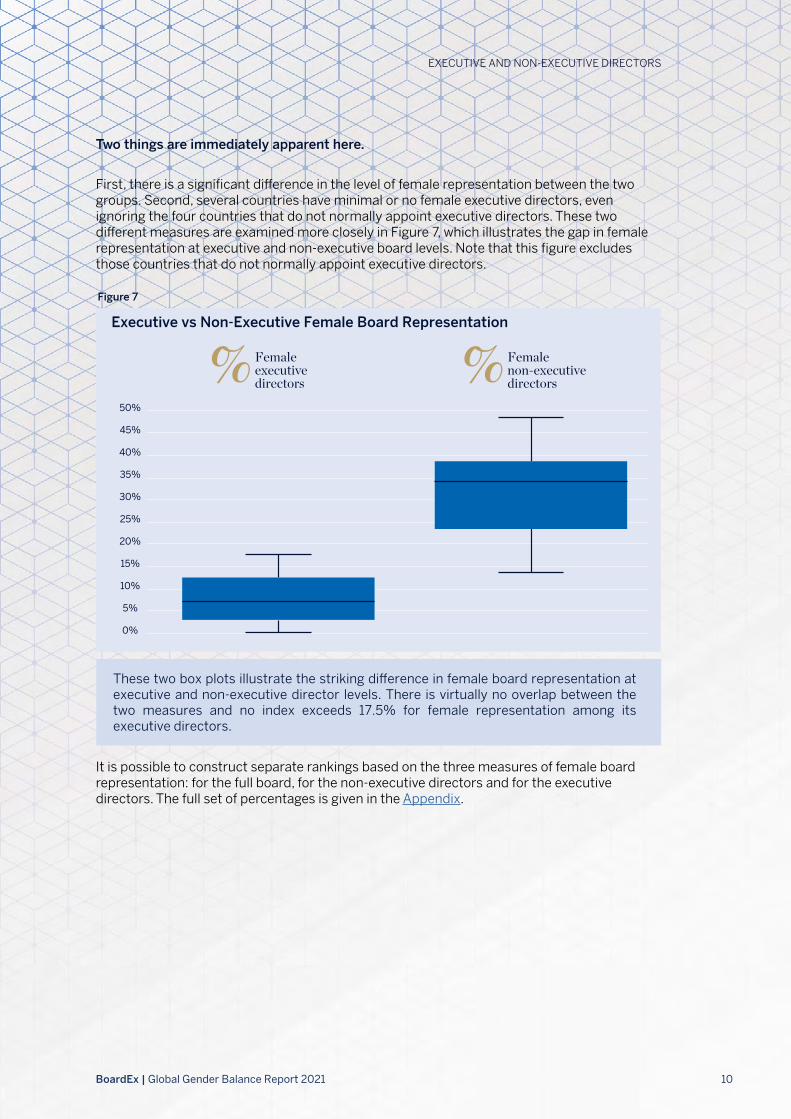
First, there is a significant difference in the level of female representation between the two groups. Second, several countries have minimal or no female executive directors, even ignoring the four countries that do not normally appoint executive directors. These two different measures are examined more closely in Figure 7, which illustrates the gap in female representation at executive and non-executive board levels. Note that this figure excludes those countries that do not normally appoint executive directors.
It is possible to construct separate rankings based on the three measures of female board representation: for the full board, for the non-executive directors and for the executive directors. The full set of percentages is given in the Appendix.
These two box plots illustrate the striking di�erence in female board representation at executive and non-executive director levels. There is virtually no overlap between the two measures and no index exceeds 17.5% for female representation among its executive directors.
25%
30%
35%
40%
45%
50%
20%
15%
10%
5%
0%
Female executive directors
Female non-executive directors
Executive vs Non-Executive Female Board Representation
Figure 7
EXECUTIVE AND NON-EXECUTIVE DIRECTORS
11BoardEx | Global Gender Balance Report 2021
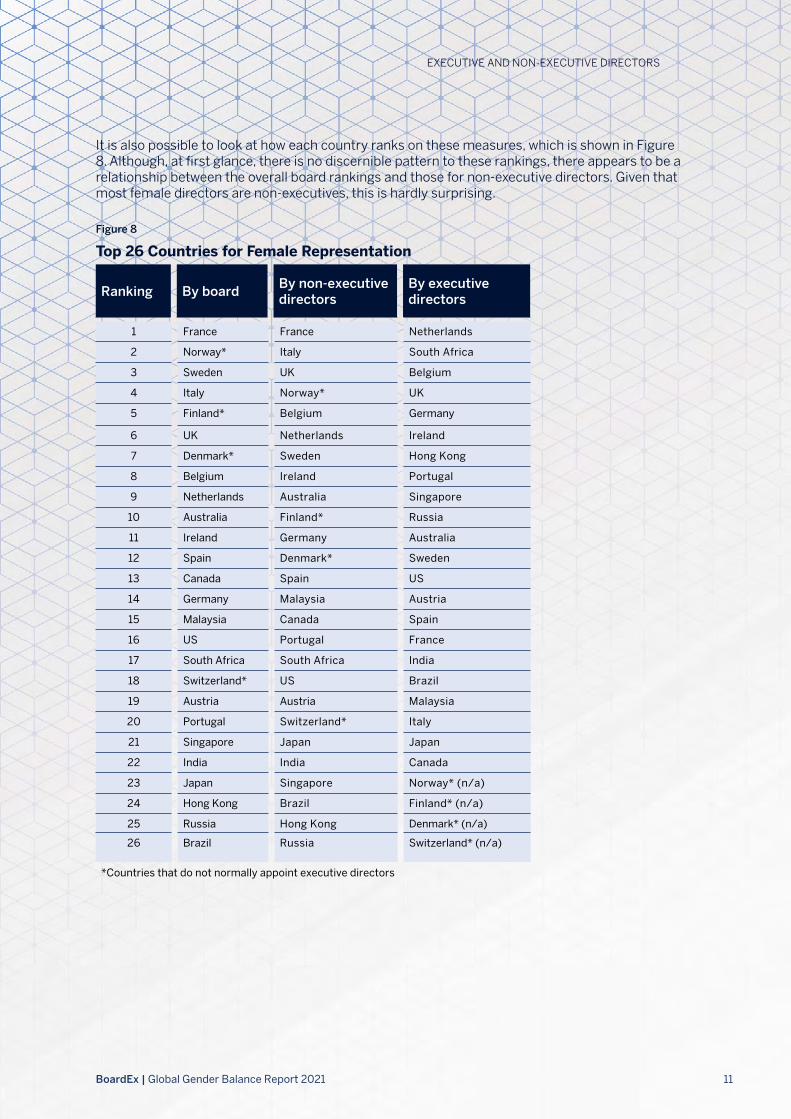
Figure 8
Top 26 Countries for Female Representation
Ranking By board By non-executive directors
By executive directors
EXECUTIVE AND NON-EXECUTIVE DIRECTORS
It is also possible to look at how each country ranks on these measures, which is shown in Figure 8. Although, at first glance, there is no discernible pattern to these rankings, there appears to be a relationship between the overall board rankings and those for non-executive directors. Given that most female directors are non-executives, this is hardly surprising.
1 France France Netherlands
2 Norway* Italy South Africa
3 Sweden UK Belgium
4 Italy Norway* UK
5 Finland* Belgium Germany
6 UK Netherlands Ireland
7 Denmark* Sweden Hong Kong
8 Belgium Ireland Portugal
9 Netherlands Australia Singapore
10 Australia Finland* Russia
11 Ireland Germany Australia
12 Spain Denmark* Sweden
13 Canada Spain US
14 Germany Malaysia Austria
15 Malaysia Canada Spain
16 US Portugal France
17 South Africa South Africa India
18 Switzerland* US Brazil
19 Austria Austria Malaysia
20 Portugal Switzerland* Italy
21 Singapore Japan Japan
22 India India Canada
23 Japan Singapore Norway* (n/a)
24 Hong Kong Brazil Finland* (n/a)
25 Russia Hong Kong Denmark* (n/a)
26 Brazil Russia Switzerland* (n/a)
*Countries that do not normally appoint executive directors
12BoardEx | Global Gender Balance Report 2021
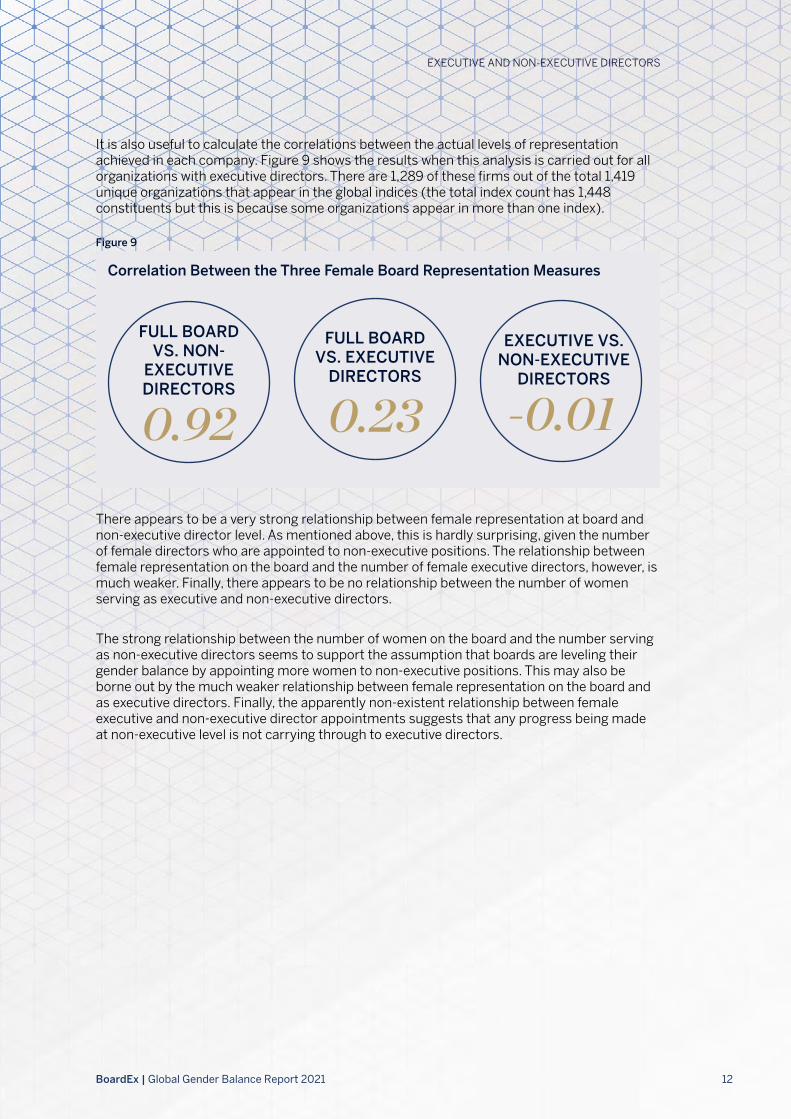
There appears to be a very strong relationship between female representation at board and non-executive director level. As mentioned above, this is hardly surprising, given the number of female directors who are appointed to non-executive positions. The relationship between female representation on the board and the number of female executive directors, however, is much weaker. Finally, there appears to be no relationship between the number of women serving as executive and non-executive directors.
The strong relationship between the number of women on the board and the number serving as non-executive directors seems to support the assumption that boards are leveling their gender balance by appointing more women to non-executive positions. This may also be borne out by the much weaker relationship between female representation on the board and as executive directors. Finally, the apparently non-existent relationship between female executive and non-executive director appointments suggests that any progress being made at non-executive level is not carrying through to executive directors.
EXECUTIVE AND NON-EXECUTIVE DIRECTORS
It is also useful to calculate the correlations between the actual levels of representation achieved in each company. Figure 9 shows the results when this analysis is carried out for all organizations with executive directors. There are 1,289 of these firms out of the total 1,419 unique organizations that appear in the global indices (the total index count has 1,448 constituents but this is because some organizations appear in more than one index).
Correlation Between the Three Female Board Representation Measures
FULL BOARD VS. NON-
EXECUTIVE DIRECTORS
0.92
FULL BOARD VS. EXECUTIVE
DIRECTORS
0.23
EXECUTIVE VS. NON-EXECUTIVE
DIRECTORS
-0.01
Figure 9
13BoardEx | Global Gender Balance Report 2021
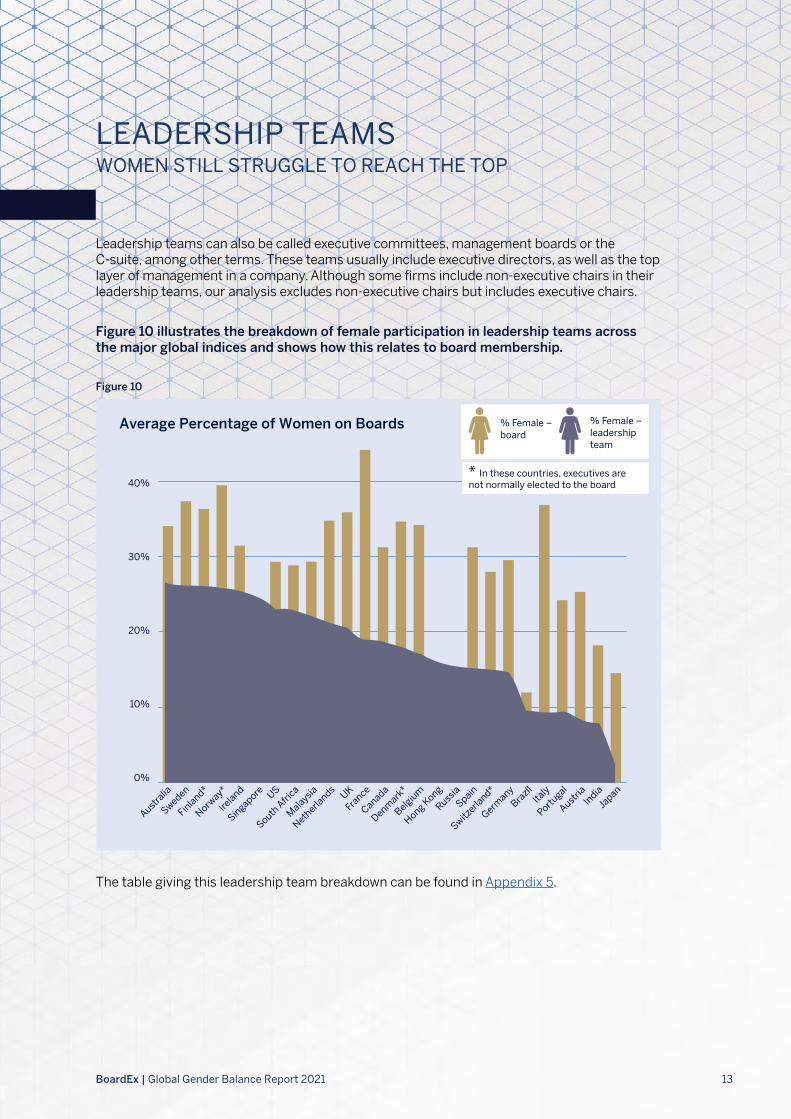
Leadership teams can also be called executive committees, management boards or the C-suite, among other terms. These teams usually include executive directors, as well as the top layer of management in a company. Although some firms include non-executive chairs in their leadership teams, our analysis excludes non-executive chairs but includes executive chairs.
Figure 10 illustrates the breakdown of female participation in leadership teams across the major global indices and shows how this relates to board membership.
The table giving this leadership team breakdown can be found in Appendix 5.
Figure 10
Australia
Sweden
Finland*
Norway*
Ireland
Singapore US
South A
frica
Malaysia
Netherla
nds
Canada
FranceUK
Denmark
*
Belgium
Hong Kong
RussiaSpain
Switzerla
nd*
Germany
Brazil
Italy
Portugal
India
Austria
Japan0%
10%
20%
30%
40%* In these countries, executives are not normally elected to the board
% Female – board
% Female – leadership team
Average Percentage of Women on Boards
LEADERSHIP TEAMSWOMEN STILL STRUGGLE TO REACH THE TOP

14BoardEx | Global Gender Balance Report 2021
Figure 11 shows the correlation between the percentage of women in leadership teams and on boards for the 1,419 unique companies covered in this report.
LEADERSHIP TEAMS
There is evidence that having more women in board-level positions improves non-board gender balance
2 See, for instance, “When and why diversity improves your board’s performance”, Harvard Business Review, March 27, 2019, which not only looks at diversity but also reviews the conditions that allow diversity to enhance performance.
Figure 11
Correlation between board and leadership team representation
LEADERSHIP TEAM VS.
FULL BOARD
0.32
LEADERSHIP TEAM VS.
NON-EXECUTIVE DIRECTORS
0.17
Indeed, the low correlation between non-executive directors and the leadership team continues to raise the question of whether the presence of more women on corporate boards is improving the chances of women being promoted to the highest levels of organizations. The forthcoming BoardEx report on leadership teams will examine the entire area of gender balance across leadership functions in greater detail.
Staying with the focus of this study – and, for the moment, leaving aside other important considerations, such as whether greater female board participation has increased the number of women holding positions of real corporate power – this also raises questions about future sources of female directors to maintain the drive for greater gender equity on boards. If not enough women are gaining the corporate experience necessary to qualify for the most powerful board roles, such as CEO, this may slow progress towards achieving equity at the highest levels of corporate power. As well as growing evidence that more balanced boards result in superior corporate performance2, there is also some evidence that having more women in influential board-level positions improves non-board gender balance.
15BoardEx | Global Gender Balance Report 2021
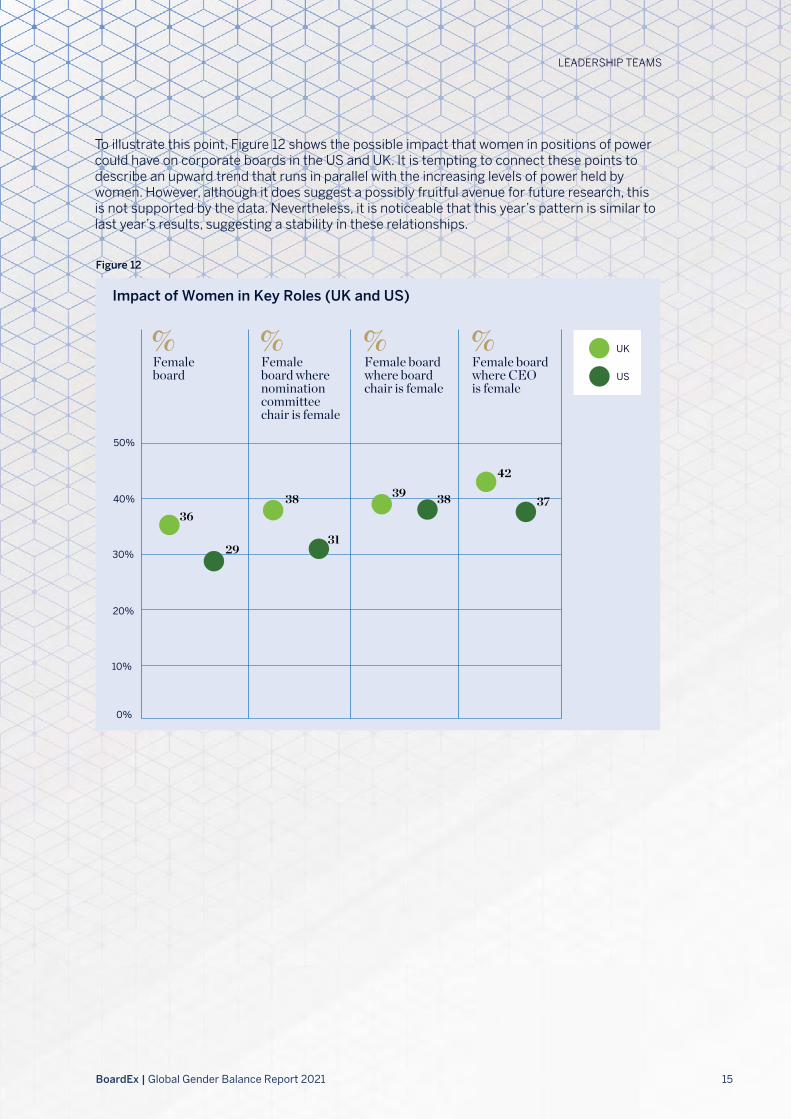
To illustrate this point, Figure 12 shows the possible impact that women in positions of power could have on corporate boards in the US and UK. It is tempting to connect these points to describe an upward trend that runs in parallel with the increasing levels of power held by women. However, although it does suggest a possibly fruitful avenue for future research, this is not supported by the data. Nevertheless, it is noticeable that this year’s pattern is similar to last year’s results, suggesting a stability in these relationships.
Figure 12
Female board
Female board where nomination committee chair is female
Female board where board chair is female
Female board where CEO is female
40%
50%
30%
20%
10%
0%
US
UK
36
29
38
31
39 38
42
37
Impact of Women in Key Roles (UK and US)
LEADERSHIP TEAMS
16BoardEx | Global Gender Balance Report 2021
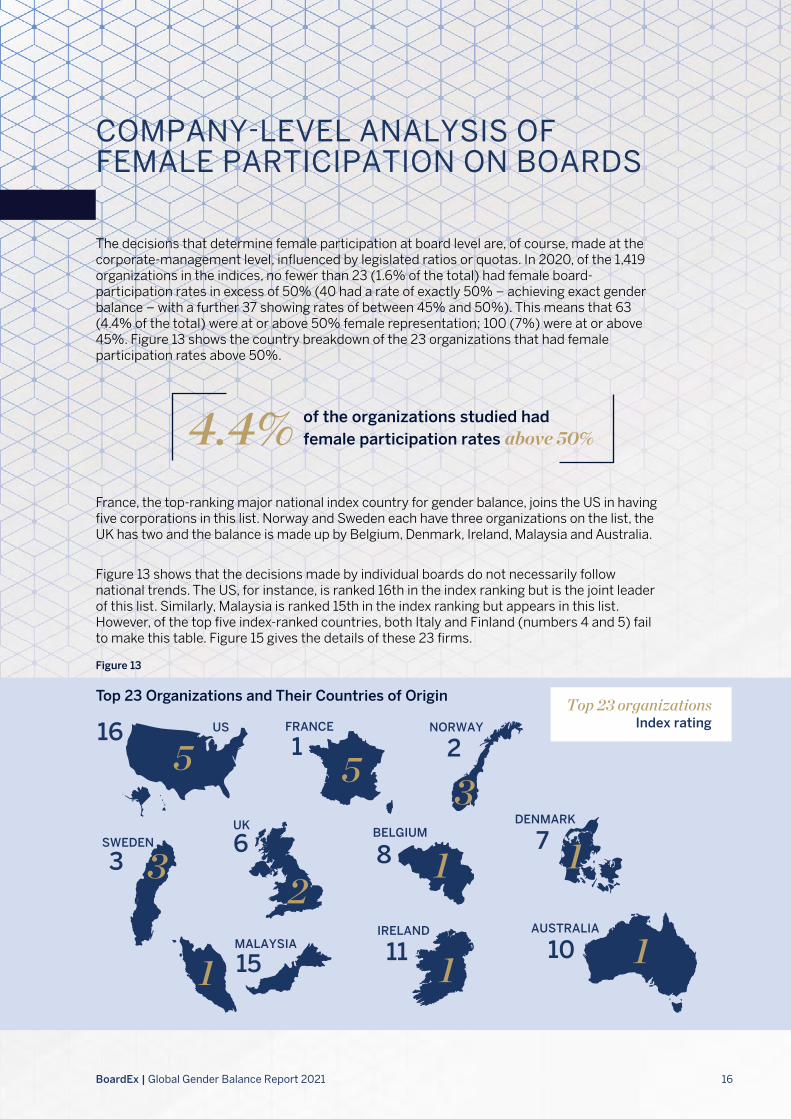
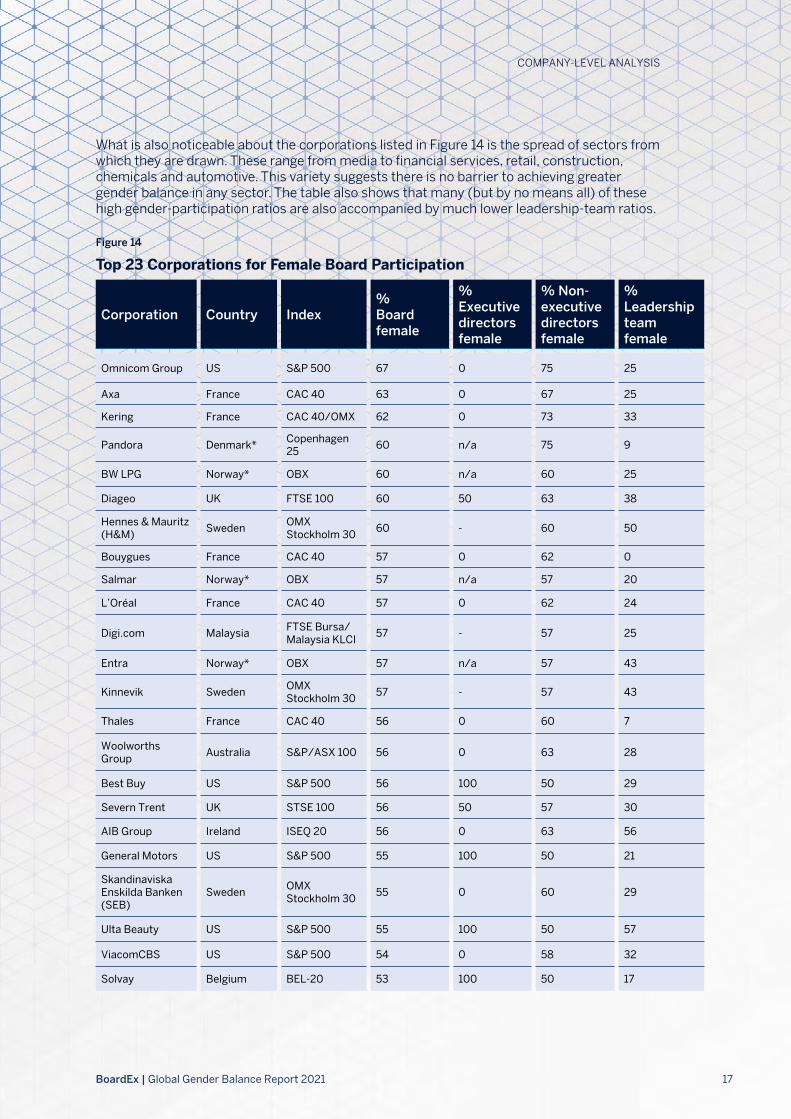
The decisions that determine female participation at board level are, of course, made at the corporate-management level, influenced by legislated ratios or quotas. In 2020, of the 1,419 organizations in the indices, no fewer than 23 (1.6% of the total) had female board-participation rates in excess of 50% (40 had a rate of exactly 50% – achieving exact gender balance – with a further 37 showing rates of between 45% and 50%). This means that 63 (4.4% of the total) were at or above 50% female representation; 100 (7%) were at or above 45%. Figure 13 shows the country breakdown of the 23 organizations that had female participation rates above 50%.
France, the top-ranking major national index country for gender balance, joins the US in having five corporations in this list. Norway and Sweden each have three organizations on the list, the UK has two and the balance is made up by Belgium, Denmark, Ireland, Malaysia and Australia.
Figure 13 shows that the decisions made by individual boards do not necessarily follow national trends. The US, for instance, is ranked 16th in the index ranking but is the joint leader of this list. Similarly, Malaysia is ranked 15th in the index ranking but appears in this list. However, of the top five index-ranked countries, both Italy and Finland (numbers 4 and 5) fail to make this table. Figure 15 gives the details of these 23 firms.
4.4% of the organizations studied had female participation rates above 50%
Figure 13
FRANCE
51
US
516
SWEDEN
33
MALAYSIA
1 15
UK
UK
26
AUSTRALIA
10 1
Index ratingTop 23 organizations
IRELAND
111
NORWAY
2
3BELGIUM
8 1DENMARK
7 1
COMPANY-LEVEL ANALYSIS OF FEMALE PARTICIPATION ON BOARDS
Top 23 Organizations and Their Countries of Origin
17BoardEx | Global Gender Balance Report 2021
Figure 14
Top 23 Corporations for Female Board Participation
Omnicom Group US S&P 500 67 0 75 25
Axa France CAC 40 63 0 67 25
Kering France CAC 40/OMX 62 0 73 33
Pandora Denmark* Copenhagen 25 60 n/a 75 9
BW LPG Norway* OBX 60 n/a 60 25
Diageo UK FTSE 100 60 50 63 38
Hennes & Mauritz (H&M) Sweden OMX
Stockholm 30 60 - 60 50
Bouygues France CAC 40 57 0 62 0
Salmar Norway* OBX 57 n/a 57 20
L’Oréal France CAC 40 57 0 62 24
Digi.com Malaysia FTSE Bursa/Malaysia KLCI 57 - 57 25
Entra Norway* OBX 57 n/a 57 43
Kinnevik Sweden OMX Stockholm 30 57 - 57 43
Thales France CAC 40 56 0 60 7
Woolworths Group Australia S&P/ASX 100 56 0 63 28
Best Buy US S&P 500 56 100 50 29
Severn Trent UK STSE 100 56 50 57 30
AIB Group Ireland ISEQ 20 56 0 63 56
General Motors US S&P 500 55 100 50 21
Skandinaviska Enskilda Banken (SEB)
Sweden OMX Stockholm 30 55 0 60 29
Ulta Beauty US S&P 500 55 100 50 57
ViacomCBS US S&P 500 54 0 58 32
Solvay Belgium BEL-20 53 100 50 17
Corporation Country Index% Board female
% Executive directors female
% Non- executive directors female
% Leadership team female
COMPANY-LEVEL ANALYSIS
What is also noticeable about the corporations listed in Figure 14 is the spread of sectors from which they are drawn. These range from media to financial services, retail, construction, chemicals and automotive. This variety suggests there is no barrier to achieving greater gender balance in any sector. The table also shows that many (but by no means all) of these high gender-participation ratios are also accompanied by much lower leadership-team ratios.
18BoardEx | Global Gender Balance Report 2021
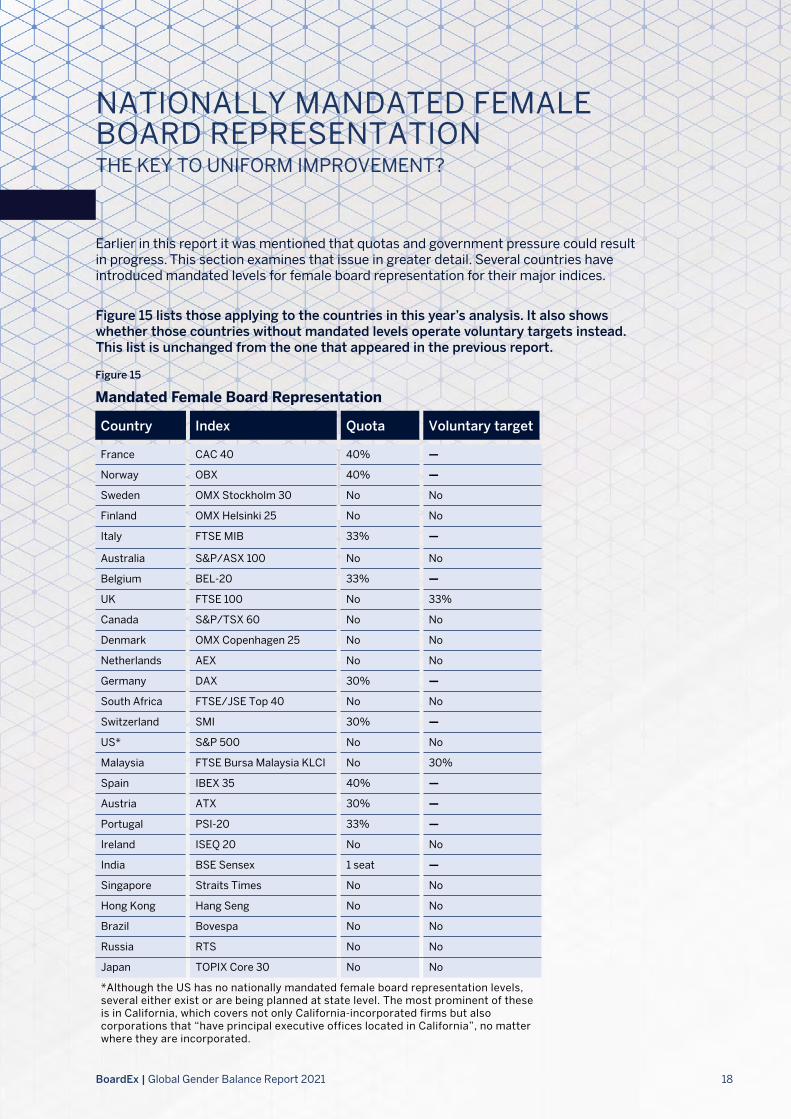
Earlier in this report it was mentioned that quotas and government pressure could result in progress. This section examines that issue in greater detail. Several countries have introduced mandated levels for female board representation for their major indices.
Figure 15 lists those applying to the countries in this year’s analysis. It also shows whether those countries without mandated levels operate voluntary targets instead. This list is unchanged from the one that appeared in the previous report.
Figure 15
Mandated Female Board Representation
France CAC 40 40% —
Norway OBX 40% —
Sweden OMX Stockholm 30 No No
Finland OMX Helsinki 25 No No
Italy FTSE MIB 33% —
Australia S&P/ASX 100 No No
Belgium BEL-20 33% —
UK FTSE 100 No 33%
Canada S&P/TSX 60 No No
Denmark OMX Copenhagen 25 No No
Netherlands AEX No No
Germany DAX 30% —
South Africa FTSE/JSE Top 40 No No
Switzerland SMI 30% —
US* S&P 500 No No
Malaysia FTSE Bursa Malaysia KLCI No 30%
Spain IBEX 35 40% —
Austria ATX 30% —
Portugal PSI-20 33% —
Ireland ISEQ 20 No No
India BSE Sensex 1 seat —
Singapore Straits Times No No
Hong Kong Hang Seng No No
Brazil Bovespa No No
Russia RTS No No
Japan TOPIX Core 30 No No
*Although the US has no nationally mandated female board representation levels, several either exist or are being planned at state level. The most prominent of these is in California, which covers not only California-incorporated firms but also corporations that “have principal executive offices located in California”, no matter where they are incorporated.
Country Index Quota Voluntary target
NATIONALLY MANDATED FEMALE BOARD REPRESENTATIONTHE KEY TO UNIFORM IMPROVEMENT?
19BoardEx | Global Gender Balance Report 2021
As can be seen from Figure 15, the mandated levels range from 40% in France, Norway and Spain to just one board seat in India.
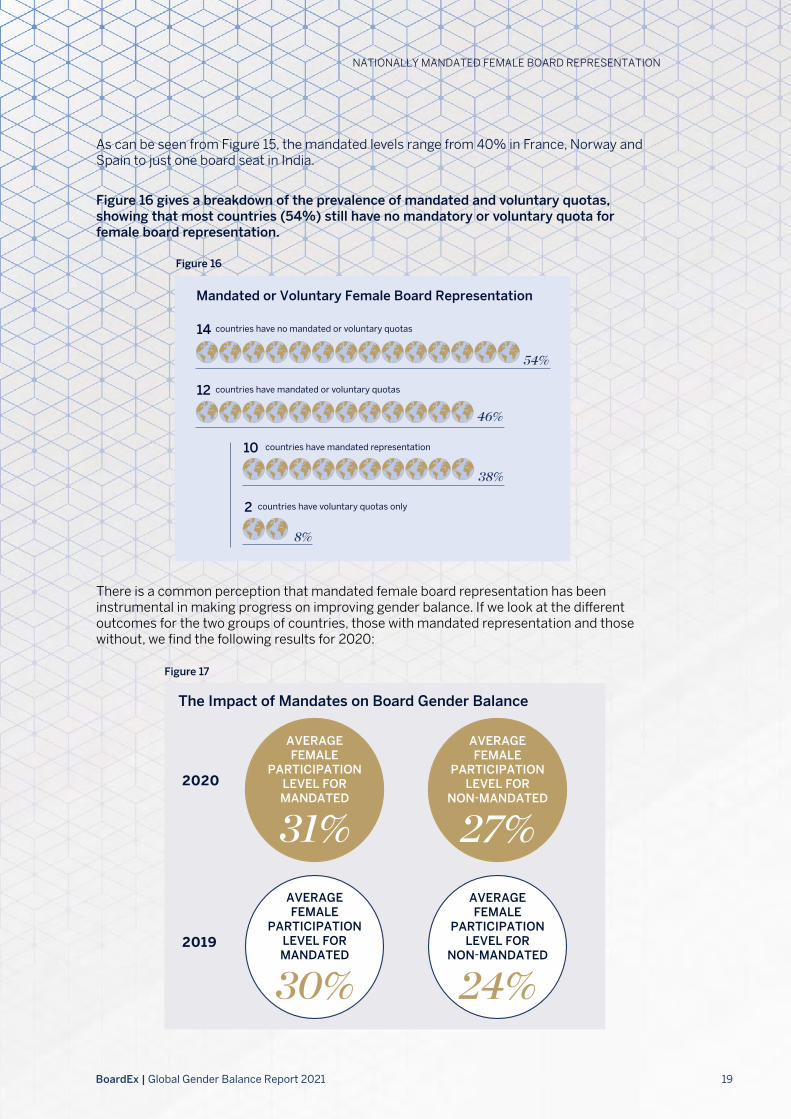
Figure 16 gives a breakdown of the prevalence of mandated and voluntary quotas, showing that most countries (54%) still have no mandatory or voluntary quota for female board representation.
There is a common perception that mandated female board representation has been instrumental in making progress on improving gender balance. If we look at the different outcomes for the two groups of countries, those with mandated representation and those without, we find the following results for 2020:
Figure 16
countries have mandated representation
38%
10
countries have mandated or voluntary quotas
46%
12
countries have no mandated or voluntary quotas
54%
14
countries have voluntary quotas only
8%
2
Mandated or Voluntary Female Board Representation
The Impact of Mandates on Board Gender Balance
AVERAGE FEMALE
PARTICIPATION LEVEL FOR
NON-MANDATED
27%
NATIONALLY MANDATED FEMALE BOARD REPRESENTATION
AVERAGE FEMALE
PARTICIPATION LEVEL FOR MANDATED
31%2020
2019
AVERAGE FEMALE
PARTICIPATION LEVEL FOR MANDATED
30%
AVERAGE FEMALE
PARTICIPATION LEVEL FOR
NON-MANDATED
24%
Figure 17
20BoardEx | Global Gender Balance Report 2021
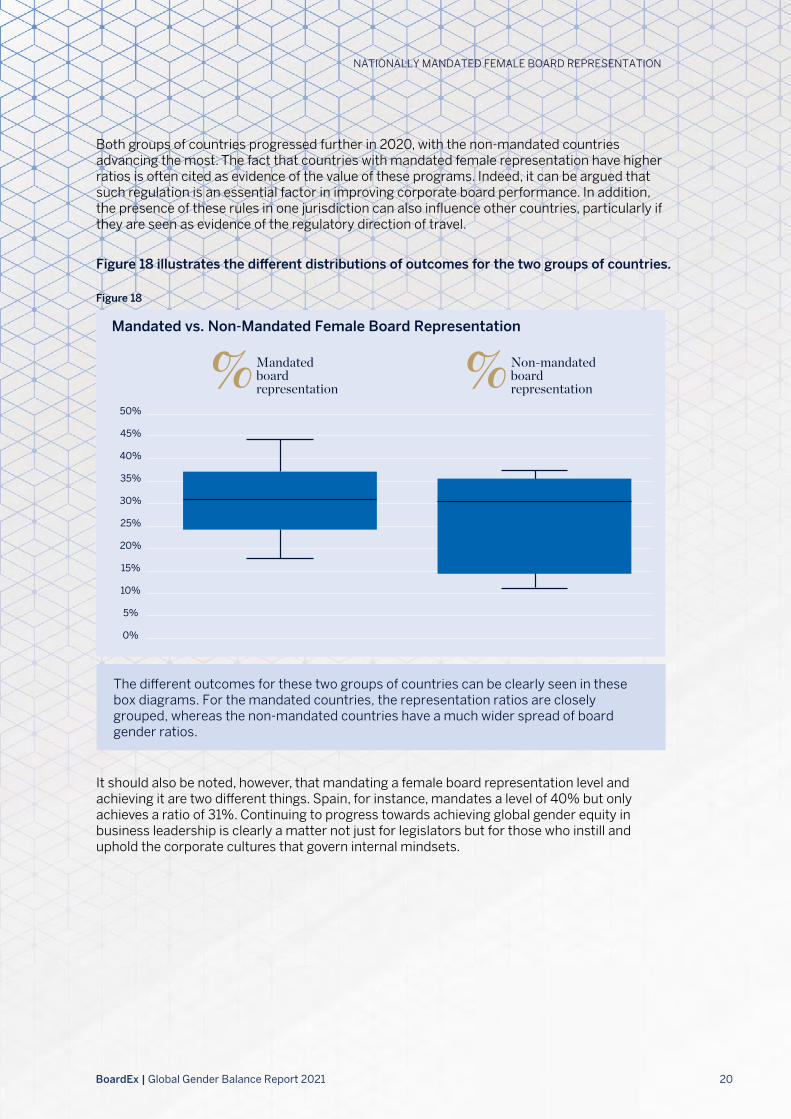
Both groups of countries progressed further in 2020, with the non-mandated countries advancing the most. The fact that countries with mandated female representation have higher ratios is often cited as evidence of the value of these programs. Indeed, it can be argued that such regulation is an essential factor in improving corporate board performance. In addition, the presence of these rules in one jurisdiction can also influence other countries, particularly if they are seen as evidence of the regulatory direction of travel.
Figure 18 illustrates the different distributions of outcomes for the two groups of countries.
It should also be noted, however, that mandating a female board representation level and achieving it are two different things. Spain, for instance, mandates a level of 40% but only achieves a ratio of 31%. Continuing to progress towards achieving global gender equity in business leadership is clearly a matter not just for legislators but for those who instill and uphold the corporate cultures that govern internal mindsets.
The di�erent outcomes for these two groups of countries can be clearly seen in these box diagrams. For the mandated countries, the representation ratios are closely grouped, whereas the non-mandated countries have a much wider spread of board gender ratios.
25%
30%
35%
40%
45%
50%
20%
15%
10%
5%
0%
Mandated board representation
Non-mandated board representation
Mandated vs. Non-Mandated Female Board Representation
Figure 18
NATIONALLY MANDATED FEMALE BOARD REPRESENTATION

21BoardEx | Global Gender Balance Report 2021
Founded in 1999, and with offices in New York, London and Chennai, BoardEx is a global data company specializing in relationship mapping and intelligence. BoardEx is a wholly owned subsidiary of Euromoney PLC. BoardEx helps private and public organizations discover valuable and influential executive connections critical to their success. It is a comprehensive, continuously growing global leadership database covering board and non-board members, C-suite executives, senior leaders and professional advisers. BoardEx contains more than 2 million profiles of public, private and not-for-profit organizations and the 1.5 million people who work for them. On average, 2,500 new profiles and 34,000 updates are made every week. All BoardEx data undergoes a rigorous quality assurance process — more than 350 analysts validate data sources from all over the world to ensure the data is accurate, relevant and fully up to date.
About Euromoney People Intelligence
Euromoney People Intelligence, a pillar of Euromoney PLC, provides organizations with unique data intelligence that connects them with the individuals who will have the greatest impact on their goals. Euromoney People Intelligence is comprised of four unique brands: BoardEx, RelSci, WealthEngine and Wealth-X. We empower our clients to build greater relationships, obtain and manage their best talent and reduce commercial risk.
ABOUT BOARDEX

22BoardEx | Global Gender Balance Report 2021
BoardEx is delighted that you wish to share some of our content. The BoardEx Attribution Policy is in place to manage republication of our company material, and applies to the publication or distribution of all BoardEx content and data, both in print and online. Any use of BoardEx-provided content and data by entities or their representatives requires adherence to the following guidelines. Use of BoardEx data constitutes consent to the policy unless otherwise indicated in superseding agreements, when reasonable.
ARTICLE ATTRIBUTION
This includes content and data published in print or online, including newspapers, blogs, white papers, opinion pieces, etc.
• The first mention of BoardEx in a publication will include a citation to the source and reference “BoardEx, a technology solution built to unlock the network of global business leaders and decision makers.”
• Any online publication citing BoardEx research will contain a hyperlink to the company website corp.boardex.com.
• References to BoardEx original content will contain a hyperlink to the URL of the specific content.
• The company must always be written as “BoardEx” rather than “Boardex”.
• BoardEx will receive copies of any academic publication that uses BoardEx content and data. This includes limited audience publications that are not accessible by, or distributed to, the general public, that is, they are available only to a limited audience, for example via a subscription. Copies of such publications will be provided to BoardEx in either print or electronic form.
GRAPHICS ATTRIBUTION
Content and data displayed in a visual representation will include the citation “Source: BoardEx” in each separate graph or image.
DATABASE ATTRIBUTION
Content and data represented as a database or table in either a print or online publication can be displayed according to the following guidelines:
• BoardEx will be mentioned as the provider of the data above the database or table and included in a citation as “Information provided by BoardEx.”
• Any online publication citing BoardEx research will contain a hyperlink to the company website corp.boardex.com.
• BoardEx reserves the right to reference any online publication on its own company website as well as company social media accounts while adhering to the publisher’s own attribution policies.
ATTRIBUTION POLICY
23BoardEx | Global Gender Balance Report 2021
INTELLECTUAL PROPERTY – TRADEMARKS
• When using BoardEx trademarks, such as the BoardEx logo, you may not alter any element of the trademark (elements that may not be changed include font, proportion, orientation and color).
• You may not use the BoardEx logo in a confusing way, including suggesting sponsorship or endorsement by BoardEx, or in a way that confuses BoardEx with another brand (including your own).
• If you are unsure, please contact us via [email protected].
PRESS RELEASE ATTRIBUTION
For press releases, please include the following descriptor in Notes to Editors: “BoardEx is the most comprehensive, highly accurate, continuously growing business leadership database. Covering more than 1.9 million public, private, and non-profit global organizations and the 1.3 million individuals that lead them, BoardEx empowers organizations to leverage their known and unknown connections more effectively to advance their relationship capital strategies and move their business forward.”
Please direct any inquires to [email protected].
ATTRIBUTION POLICY
North America
Hippodrome Building1120 Avenue of the AmericasNew York, NY 10036
Europe
1st Floor29 Ludgate HillLondonEC4M 7NXUnited Kingdom
Asia
The Deal India Pvt Ltd‘B’ Block, Ground FloorSabari Sunny Side8/17, ShafeeMohammed RoadNungambakkamChennai, 600 034

To obtain further information or to request a demonstration, please contact us at:
Tel US: +1-888 257-6082 Tel Europe: +44 (0) 20 7303 1791
Email: [email protected]: corp.boardex.com