global gas report 2017 - snam€¦ · · 2017-10-13that gas will be part of the world’s...
TRANSCRIPT

Global gas report2017
Prepared in collaboration with BCG Center for Energy Impact
The natural gas market is at an inflection point: what will it take for growth forecasts to be achieved going forwards?


Foreword
Welcome to the inaugural issue of the Global Gas Report!Natural gas - a low-carbon, efficient and flexible fuel - is an opportunity for the world as we look for efficient paths to decarbonization. But this is an opportunity that has yet to be fully realized, because of a combination of concerns on costs, supply security and long-term sustainability.
My take on the analysis in this report is that gas is better placed to increase its share in the global energy mix today than it was five to 10 years ago, thanks to growing LNG trade, which translates into improved liquidity and security. Meanwhile, exciting research is being done on renewable gas technologies, which suggests that gas will be part of the world’s long-term energy future.
The key barrier to increasing gas adoption - especially in developing markets, which is also where we will see primary energy demand growth - is cost. Gas is still too expensive, especially compared to coal. This means that switching from more polluting fuels to gas, and reaping its global and local benefits in terms of emissions and air quality, imposes an economic burden that the industry needs to work to reduce.
This will require a concerted effort and dialogue with stakeholders – from policymakers to suppliers and local communities; all things that Snam hopes to facilitate with this annual review.I hope you find it a useful resource.
Marco Alverà
Chief Executive Officer, Snam
For some time, it has generally been accepted as conventional wisdom that global natural gas consumption will grow significantly. Whether as a "transition" fuel or a permanent shift, many significant decisions have been made about natural gas that are underpinned by strong growth assumptions. And recent headlines have often supported this narrative, whether concerning North American shale or the rapid development of the Chinese gas market. Yet in recent years few have stopped to look back or assess what it will take for gas to grow in the future. This is the contribution that Snam has now made with this report. Through this analysis they have begun to tell the more complete story, particularly where gas growth has been challenged and why. Furthermore, by highlighting the drivers of gas growth they have shed light on what it will take for reality to match projections. As this report points out, gas is now at an important inflection point. With substantial new trade capacity coming online in the near term– most significantly as LNG, but also new pipelines – many are waiting to see if demand follows. At stake is substantial further investment across the global gas value chain which will, in turn, continue to set the long-term trajectory for natural gas as a fuel. J. Robinson West
Managing Director, BCG Center for Energy Impact
In 2011, the IEA asked “are we entering a golden age of gas?”1 . On the evidence of the following five years, the answer appeared to be negative, with the exception of the US where the scale and resilience of the shale gas revolution exceeded expectations. However, the evidence and analysis compiled in Snam’s inaugural Global Gas Report suggests that the global gas market may be at an inflection point.
The major developments of the last twelve months in gas highlight that, after a period of consumption decline in Europe and slower-than-expected adoption in Asia, gas demand is rebounding in key markets. There are also positive signs in terms of greater supply liquidity and cost decline which may support consumption growth going forwards.
So what does the future hold? As well as highlighting the main developments in global gas markets over the past year, the Global Gas Report provides an analysis of some key factors around cost competitiveness, availability and supply security; and examines evolving perceptions of its sustainability which will determine the next phase of development across North America, Europe, Asia, and the Middle East.
Of particular significance will be the competitiveness of gas compared to coal - particularly in Asia, which is set to grow overall energy demand – the pace of technological innovation, especially in transport and storage, and its ability to increase trade, liquidity and flexibility, and the role that gas ends up playing in a rapidly decarbonising world.
In areas such as transport, this focus may play in gas’s favour as cars and heavy vehicles move away from oil-based fuels to address local air quality and global CO2 emission issues. Gas’s significantly lower emissions intensity also plays in its favour versus coal in power generation. However, the industry is facing increasing scrutiny over methane fugitive emissions, which operators need to address as a matter of urgency. And gas faces the challenge of developing technology to enable a longer-term decarbonization, with work required on renewable gas (biomethane and syngas) and carbon capture and storage technologies.
So with these signs of a rebounding market, it is worth asking again; are we entering a golden age of gas? For now, it seems the golden age of gas has been delayed, but is by no means cancelled.
Executive summaryThe golden age of gas, delayed but not (necessarily) cancelled
1 IEA, World Energy Outlook 2011 special report

Executive summaryThe golden age of gas, delayed but not (necessarily) cancelled 1. LNG is continuing to grow,
becoming more globalized. LNG prices continued to decline and converge across regions in 2016.
Global LNG trade grew strongly, by 6% in 2016, compared to ca. 1% annual growth over the prior five years, supported by 31 billion cubic meters per annum (bcma) of liquefaction capacity coming online last year as a result of rapidly growing supply. The price for spot cargos fell by a quarter in both Asia and Europe, to $5.6/MMBtu (million British thermal units) and $5.0/MMBtu respectively. At times some sales were recorded as being below $5/MMBtu in Asia and near $4/MMBtu in Europe.
2. Gas consumption in key markets rebounded, with Europe leading the way.European gas consumption grew by more than 6% in 2016, accelerating the recovery which started in 2015 following the significant consumption decline from 2009-2014. This was led by the power sector in particular, where the lower supply cost of gas also coincided with a nuclear outage in France and an increase in the carbon price floor in the UK. Consumption in Asia continued to grow, led by a rebound in India and continuing growth in China which was driven by government policies to expand import infrastructure, develop domestic production, and incentivize gas consumption across sectors to reduce pollution.
3. Gas availability and market liquidity continue to expand as the market develops. The deployment of new LNG infrastructure and new technologies - such as Floating Storage Regasification Units (FSRUs) - can play a key role in promoting trade. However, rigidity in LNG contracting, domestic supply constraints and regulatory frameworks could continue to restrict demand in some markets. Meanwhile, judging by past trends, maximising domestic production where reserves are available – through a combination of stable and transparent policy and cost-efficient production - is likely to be a strong driver to grow consumption.
Key findings
4. The future of gas is inextricably tied up with that of coal, particularly in Asia.
Asia is the world’s key growth market for energy consumption, and it is still building coal-fired power generation. It will be no easy feat for gas to gain share from coal in this market. The cheapest LNG plants being built today (US brownfield conversions) cost less than $1000 per tonne of capacity, which supports a gas price in Asia that is still uncompetitive with coal. Assuming coal prices remained steady, making LNG competitive with domestically produced coal for electricity generation in Asia would require a cut of 20-30% in total LNG costs, or a combination of efficiencies and policy interventions to implement a carbon price.
5. Evolving perceptions of the sustainability of gas may play in its favour New uses of gas, in areas such as transport, can address local air quality and global CO2 emission issues as cars and heavy vehicles move away from oil-based fuels. Gas’s significantly lower emissions intensity also plays in its favour versus coal in power generation. However, the industry is facing increasing scrutiny over methane fugitive emissions, which operators need to address as a matter of urgency. And gas faces the challenge of developing technology to enable a longer term decarbonization, with work required on renewable gas (biomethane and syngas) and carbon capture and storage technologies.

Contents
Global gas report 5
1. Key highlights from 2016 6
2. Recent trends in global gas 7
3. Gas forecast to 2030-2040 18
4. Meeting gas demand forecasts 21
5. 2010-2015: regional analysis 25
6. The future path of natural gas 35
Conclusion 39
Appendix Global gas fact base 40

Global gas report 2017 5
Global gas reportIntroduction
Progress has been made on a number of key drivers for gas consumption growth
Natural gas has long been expected to show significant growth, both in absolute terms and in terms of its share within the global energy mix. Since around 2010, there has been a widespread view that the world was entering a “golden age of gas” in which natural gas production would grow dramatically as the rest of the world replicated the US shale phenomenon, and gas would move ahead of coal as the second most widely consumed fuel source (after oil) by 20301.
The strong growth trajectory underpinning these forecasts has to date not been realized. Gas consumption growth has been well below forecasts on a global level, specifically driven by a consumption decline in Europe and slower-than-expected adoption in Asia.
The situation is now evolving. At a global level, progress has been made on a number of key drivers for gas consumption growth in terms of improving market liquidity and supply security, higher cost competitiveness – although LNG is still expensive compared to coal outside North America - and evolving perceptions of its long-term sustainability.
This progress is confirmed by specific gas industry developments in 2016. Above all, in the past year the much anticipated global LNG supply glut has begun to take shape. With substantial new sources of liquefied natural gas now coming online, the global gas market is becoming increasingly liquid, costs are declining, and that in turn has driven consumption growth in critical markets. Through 2016 for example, gas consumption grew significantly in key regions including China and India, and rebounded strongly in Europe.
There are therefore reasons to believe that a high growth trajectory of gas may still be achieved. Nevertheless some critical barriers remain to achieving the expected gas growth, especially in specific regions and countries. This report aims to identify key trends in the gas market today, how these speak to the future prospects of gas, and what it will take for the growth forecasts for gas to be achieved going forwards.
1 This view was formalized in the 2011 IEA 2011 report “Are we entering a golden age of gas?”

Global gas report 2017 6
Early signs of the emerging LNG glut appeared
Liquefaction capacity continued to increase, with an additional 31 billion cubic meters per annum (bcma) coming online in 2016. This was led by project completions in Australia (Gorgon 1&2, Australia Pacific) and the opening of the first continental US export (Sabine Pass 1&2)2. Meanwhile, in 2016, the world continued to build LNG liquefaction capacity for the future; the total under construction was 156bcma, with FID taken on a further 9bcma capacity3.
Global LNG trade grew strongly, by 6% in 2016, up from <1% annual growth over the past five years4.
LNG prices continued to decline and converge across regions – The price for spot cargos fell significantly in 2016, in Asia from $7.5/MMBtu in 2015 to $5.6/MMBtu and in Europe from $6.7/MMBtu in 2015 to $5.0/MMBtu5. At times some sales were recorded as being below $5/MMBtu in Asia and near $4/MMBtu in Europe6. This price level is below full capital recovery economics for some new LNG projects, which raises questions about the long term sustainability of such prices unless LNG capital project costs are reduced. The decline in LNG prices in Europe and Asia represents a continued trajectory for global pricing convergence. While Asian NEA spot prices were at a $12/MMBtu+ premium to US Henry Hub in 2012, that has declined to $3.1/MMBtu in 2016. Through the first half of 2017 the premium to Henry Hub rose to $3.8/MMbtu relative to Asia NEA spot, while it declined in Europe falling to $2.3/MMbtu relative to NBP.
Gas consumption continued to rebound in Europe
European gas consumption grew by more than 6% in 2016, accelerating the rebound which emerged in 2015 following significant consumption decline from 2009-2014. This was led by the power sector in particular, where the lower supply cost of gas also coincided with a nuclear outage in France and the increase in the carbon price floor in the UK. Given
the long term trend of production decline in Europe, (down 1.3% in 2016) the result was significant growth in pipeline imports from Russia (up 15 billion cubic meters - bcm) and Algeria (up 10bcm) to Europe. Meanwhile, LNG deliveries to Europe remained stable7.
Consumption in Asia continued to grow, led by a rebound in India and continuing growth in China.
Indian consumption surged an estimated 9% in 2016, reversing the consistent decline since 2010, following the fall in LNG prices and a shift to a more competitive regulated price structure for industrial users of gas. Consumption in China grew by 8%, driven by government policies to expand import infrastructure, develop domestic production, and incentivize gas consumption across sectors to reduce pollution. Excluding China and India, consumption growth across the rest of Asia was less than 1% in 2016, highlighting continuing barriers to gas consumption growth in the region relating to cost competitiveness and the availability of supply infrastructure8.
Gas production rose strongly in Australia and the Middle East and levelled off in North America
In 2016, Australian gas production rose by 19% driven by LNG project completions. Production also rose in the Middle East (2.2%), driven by Iran and Saudi Arabia, and in Africa, driven by Algerian export growth. Meanwhile, marketed production marginally declined in North America, due to a fall in associated gas production given the market response to oil prices. Dry shale production growth continued in both the US and Canada (10%), below the average growth rate since 2010 (26%). However, this was the first aggregate annual gas production decline in the US since 2006, indicating the limits to sustained growth in North America.
Key highlights from 2016
2 IGU3 IGU4 Cedigaz5 Bloomberg6 Argus7 Cedigaz8 Cedigaz
1/+6%UP STRONGLY IN 2016 FROM <1% ANNUAL GROWTH OVER THE PRIOR FIVE YEARS
Global LNG Trade
-34%IN ASIA AND IN EUROPE, IN 2016 VS 2015
LNG prices
+6%CONSUMPTION GROWTH LED BY THE POWER SECTOR
Europe

Global gas report 2017 7
Gas consumption
Gas consumption growth has averaged 1.5% per year globally from 2010-20169. This has been in line with the growth in energy consumption worldwide. As a result the position of natural gas in the global energy mix has remained unchanged at 22.3%.While gas consumption has grown steadily, there have been significant variations across years, between regions, and among individual countries. In particular, global gas growth was nearly 2% per year from 2010-13, then slowed to near zero in 2014 before rebounding in 2015 (1.6%) and 2016 (1.6%). This is the result of multiple offsetting trends at a regional and country level, such as the US shale boom coinciding with the European economic slowdown10. The following section assesses how those regional and country trends have shaped the global gas landscape.
• North America: Gas consumption in 2016 is estimated to have grown by 1.1%, driven by strong growth in Canada (8.9%) and Mexico (1.6%), offset by a significant slowing of
US growth rates (0.3%)11. In the US, while consumption in the power and industrial sectors grew by 3.2% and 2.5% respectively in 2016, residential and commercial sector consumption fell by 4% given it was a particularly warm winter 12.
Excluding the weather impact, the US consumption growth story remains consistent: since 2010 the region has grown in absolute terms more than any other region worldwide, adding in excess of 135bcm of consumption between 2010 and 2016 (2.5% annual growth rate). Demand has been buoyed by the development of US shale gas supply, which has caused natural gas prices to decline and stay low (generally under $4/MMBtu). These lower prices have also driven significant consumption growth in neighboring Canada and Mexico. Across North America this growth has been led by the power and industrial sectors, which have undertaken fuel switching as gas has become more competitive.
• Europe13: In 2016, consumption rose more than 6% (adding 30bcm), driven by
Relative gas consumption growth by region
2010
N. America
Lat. America
Europe
CIS
Africa
Middle East
Asia
Global
140
120
100
80
60
2011 2012 2013 2014 2015 2016
Consumption growth (2010 = 100)
9 IEA 10 Note that gas demand has a high degree of
year to year variability driven by changes in weather, so any specific year to year comparion will be affected by this dynamic.
11 Cedigaz12 US EIA13 Cedigaz for the Europe data
+1.6% IN 2016 BROADLY IN LINE WITH THE PREVIOUS FIVE YEARS
Global Consumption
2/
Gas consumption growth has been highly divergent across regions since 2010.
Source: IEA, Cedigaz, BCG analysis.
Recent trends in global gas

Global gas report 2017 8
stronger economic growth overall and better competitiveness of gas in the power sector.
Leading this growth was the UK, where gas consumption increased by 12.6%. Critical to that growth was the increase in the carbon price floor to £18 t/CO2, which resulted in fuel switching in power generation from coal to gas. Gas consumption in France also grew rapidly by more than 9%, driven by a rise in gas-fired power generation due to nuclear outages.
• Asia: Consumption in Asia is estimated to have grown 2.6% in 2016, slower than the prior five year average of 3.6% growth. Driving this is a highly divergent set of national trends.
ǃ China consumption is estimated to have shown among the greatest growth in absolute terms (estimated 15bcm) with a growth rate of 8% in 2016.The trend is generally in line with that of the previous five-year period which showed average growth of 12% per year since 2010, though the percentage growth rate has slowed as the scale of the market has increased and overall 2016 economic growth slowed 14. Chinese gas consumption growth is still among the most rapid worldwide - driven by concerted government policies to expand import infrastructure, develop domestic production, and incentivize gas consumption across sectors to reduce pollution. The country’s latest five-year plan for the power sector confirmed an additional 44 gigawatts of gas capacity and set new targets to convert coal-fired boilers to gas, providing a basis for further gas growth.
ǃ Consumption in India rebounded with 9% growth in 2016, following the contraction of 4.9% per year from 2010-1515. This was largely due a combination of lower LNG prices and regulated price reforms for the consumption of gas in the industrial sector (further assessed in section 5).
ǃ Slow growth in the region was partly driven by a decline in Japan, which had previously seen significant consumption growth following the decision to mothball its nuclear reactors after the 2011 Fukushima disaster. Following the nuclear shutdown consumption grew from 103bcm in 2009 to a peak in 2014 at 130bcm. Since then consumption has
declined 10bcm per year given the gradual restart of nuclear power.
ǃ Another driver of slow growth in the region was countries experiencing domestic production declines, such as Indonesia, Thailand, and Bangladesh. In all three markets consumption declines mirrored gas production declines in 2016.
• Latin America: In 2016 consumption is estimated to have declined by 1.3%, largely due to the sharp fall in Brazil (down 14%) given both the economic slowdown and higher hydroelectric capacity production. This is a significant change from prior years, where regional consumption has grown by 4.4% per year since 2010. Over that period growth was led by gas consumption in Brazil, which averaged 10.4% per year, supported by a significant expansion in domestic production and the addition of LNG imports. As domestic prices fell, gas became more competitive as a means of power generation, resulting in a doubling of gas-fired power capacity between 2010 and 2015. Elsewhere in Latin America, Peru has led the way from 2010 through 2016 with >8% growth, driven by the development of its own upstream production. Argentina also continued to grow in the 2016 (5.8%) on the back of both stronger domestic production and imports from neighboring markets and LNG.
• Middle East: In 2016 consumption growth slowed to an estimated 3%, down from an average of 5.1% per year since 2010. This amounted to absolute consumption growth of 25bcm, similar to the annual average of the prior five years. Across the 10 largest countries in the region, consumption growth was stable through 2016. Iran consumption growth stood out, with 4% growth, driven largely by greater investment and economic growth following the easing of sanctions.
The sustained growth of gas consumption in the Middle East from 2010 has been driven most significantly by Qatar, at an average of 13.6% per year through 2016. This was due in large part to a substantial increase in the use of gas in the power and petrochemicals sectors. A single project - the Pearl gas-to-liquids plant – drove material consumption growth given it can process more than 15bcm per year.
14 Cedigaz15 EIA, Cedigaz
+2.6%CONSUMPTION IN 2016 DRIVEN BY CHINA (+8%) AND THE REBOUND IN INDIA (+9%)
Asia
-1.3%CONSUMPTION IN 2016 MAINLY DUE TO SHARP FALL IN BRAZILIAN DEMAND (-14%)
Latin America
+3% IN 2016 CONSUMPTION SLOWED FROM AN AVERAGE OF 5.1% PER YEAR SINCE 2010
Middle East

Global gas report 2017 9
16 Cedigaz17 Bloomberg18 IGU
• Africa: Consumption growth in 2016 slowed to 1.9% from the trend of 4.2% over the previous five years. The slowdown was largely driven by Nigeria, which in 2016 saw consumption decline by 8.7% because of domestic supply disruptions. This compares to an annual growth rate of 11.3% in the previous five-year period, during which growth was driven by the opening of the Escravos gas-to-liquids plant, the addition of gas-fired power generation capacity, and increased consumption by industrial users 16.
ǃ Excluding Nigeria, African countries are continuing the trend of increasing gas penetration mainly driven by Algeria and Egypt. In Algeria, the government has focused on developing gas-fired power generation capacity to shift away from oil. In Egypt, despite declining production, consumption has continued to rise due to a shift from producing LNG to importing it.
Gas prices
Through 2016 gas prices declined in Europe (-$1.7/MMBtu) and Asia (-$0.9/MMBtu) while remaining relatively low in North America. In addition to a global convergence in natural gas prices, this also reflects a continued narrowing of gas and coal prices. In the US the average premium of gas to coal has remained around
40% (or $1/MMBtu) over the past five years, though monthly variability has resulted in gas pricing at discount to coal on an energy basis at times and even being double the price of coal at other times. In Europe and Asia though, the premium of gas to coal has fallen from $7/MMBtu and $12/MMBtu to $2.4/MMBtu and $2.7/MMBtu, respectively 17. The decline in gas prices towards convergence globally and with coal is driven primarily by market dynamics, namely sustained growth in global supply availability along with weaker demand growth. Meanwhile, the low oil prices also drove down the cost of indexed gas, further contributing to the global downward trend through the first half of 2016 in particular.
Historically, natural gas was a substitute for oil in heating and industrial processes, resulting in the rise in oil index pricing which priced gas against a major benchmark price for oil. As a global market for LNG has developed, and natural gas has become more widely used, oil indexing has been replaced by the practice of pricing gas against a leading benchmark gas price. In Europe, over 60% of gas sold is priced on this basis, compared with less than 10% in 2005, while globally the share sold on a gas-on-gas is now 45% vs. 31% in 200518. This enables gas price linkages across regions and greater pricing liquidity for gas.
22
20
18
16
14
12
10
8
6
4
2
2011 2012 2013 2014 2015 2016 20170
North America$/MMBtu
Europe Asia
2011 2012 2013 2014 2015 2016 2017 2011 2012 2013 2014 2015 2016 2017
WTI HH US Coal Brent NBP Eur. Coal Dubai Asia CoalNEA Spot
Oil, Gas and Coal prices in major reference markets 2011-2016Gas prices have declined and increasingly convergedacross regions.
Note: US coal price is Central Appalachia price. European coal proxy price is ICE front month contracts for Europe (Rotterdam settled against API2). Asia coal proxy price is Newcastle coal price for Japan, Korea and China.WTI = West Texas Intermediate.HH = Henry Hub.NBP = National Balancing Point.NEA = Northeast Asian.
Source: World Bank, Bloomberg, and EIA.
1.9% IN 2016 SLOWED TO 1.9% FROM THE TREND OF 4.2% OVER THE PREVIOUS FIVE YEARS
Africa
In Europe and Asia, the premium of gas to coal has fallen from $7/MMBtu and $12/MMBtu to $2.4/MMBtu and 2.7$/MMBtu respectively
Global gas report 2017 10
Gas reserves and production
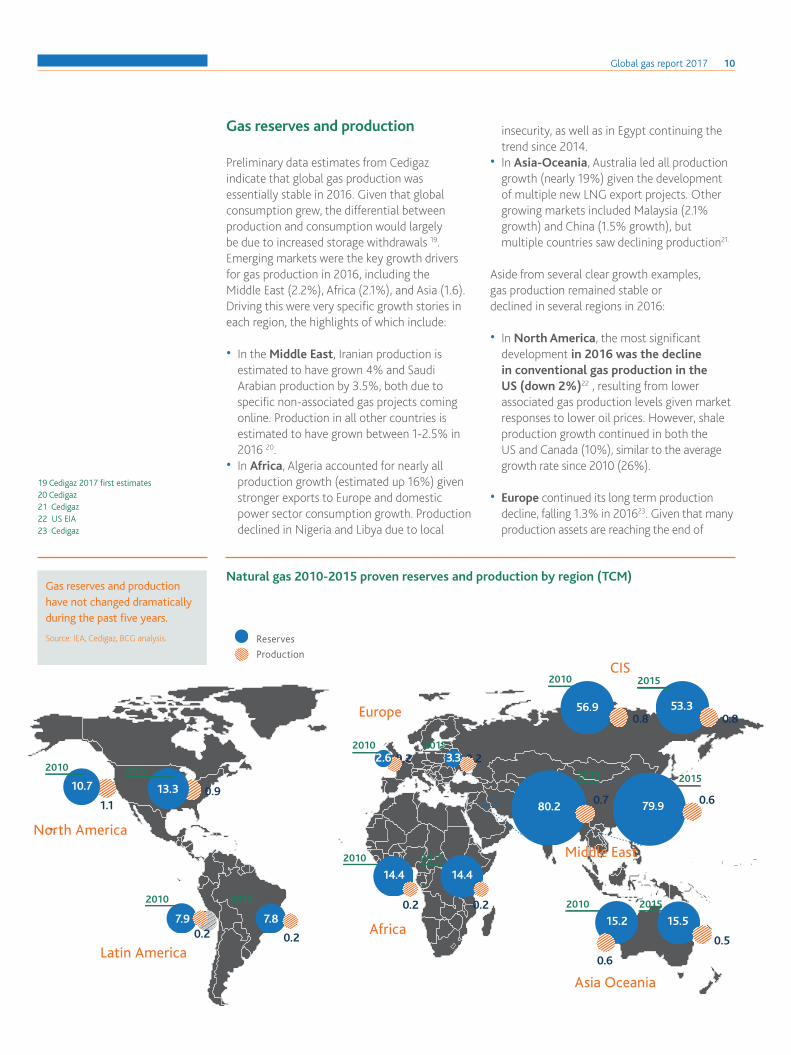
Preliminary data estimates from Cedigaz indicate that global gas production was essentially stable in 2016. Given that global consumption grew, the differential between production and consumption would largely be due to increased storage withdrawals 19. Emerging markets were the key growth drivers for gas production in 2016, including the Middle East (2.2%), Africa (2.1%), and Asia (1.6). Driving this were very specific growth stories in each region, the highlights of which include:
• In the Middle East, Iranian production is estimated to have grown 4% and Saudi Arabian production by 3.5%, both due to specific non-associated gas projects coming online. Production in all other countries is estimated to have grown between 1-2.5% in 2016 20.
• In Africa, Algeria accounted for nearly all production growth (estimated up 16%) given stronger exports to Europe and domestic power sector consumption growth. Production declined in Nigeria and Libya due to local
insecurity, as well as in Egypt continuing the trend since 2014.
• In Asia-Oceania, Australia led all production growth (nearly 19%) given the development of multiple new LNG export projects. Other growing markets included Malaysia (2.1% growth) and China (1.5% growth), but multiple countries saw declining production21.
Aside from several clear growth examples, gas production remained stable or declined in several regions in 2016:
• In North America, the most significant development in 2016 was the decline in conventional gas production in the US (down 2%)22 , resulting from lower associated gas production levels given market responses to lower oil prices. However, shale production growth continued in both the US and Canada (10%), similar to the average growth rate since 2010 (26%).
• Europe continued its long term production decline, falling 1.3% in 201623. Given that many production assets are reaching the end of
19 Cedigaz 2017 first estimates20 Cedigaz21 Cedigaz22 US EIA23 Cedigaz
Natural gas 2010-2015 proven reserves and production by region (TCM) Gas reserves and production have not changed dramatically during the past five years.
Source: IEA, Cedigaz, BCG analysis.
Europe
CIS
Middle East
Africa
Asia Oceania
2010
7.9
2010 2015
14.4 14.4
2015
13.3
2010
0.9
0.2
2015 0.2
0.2
0.2 2010 2015
15.2 15.5
0.6
North America
Latin America
7.8
20150.23.3
0.8
2010
56.90.8
2015
53.3
0.5
1.1
10.7
2010
0.2
Reserves
Production
2.6
0.7
2010
80.2 0.6
2015
79.9
Middle East

Global gas report 2017 11
24 Cedigaz25 Cedigaz26 IEA World Energy Outlook 2011 and 2016
their lifecycle in the North Sea and onshore, production has declined by an average of 3.6% per year since 2010 24.
• In Latin America, 2016 production was estimated to have only increased by 0.3%. This low rate of growth was largely due to a 5bcm (or nearly 14%) production decline in Trinidad & Tobago, largely due to a fall in condensate production following the 2014 oil price decline.
Aside from the 2016 discrepancy between production and consumption, global gas production has generally grown marginally higher than consumption, at a 1.8% average from 2010-15 25. Overall the growth in global production has been led by the increased extraction of unconventional natural gas in the US, Canada, Australia, China, and Argentina. Unconventional production has accounted for an additional 332bcm production compared with net growth of 49bcm of conventional gas over that period. Of that production growth the US led with 250bcm of growth.
In broad terms, proved reserves – which exclude unconventional gas – have grown in line with global production, at 1.8% per year over the past decade, although the rate has slowed to 0.2% per year since 2010.
Considering conventional gas, the fastest-growing reserves are in countries that are already major producers: Turkmenistan,
Iran, and Russia. Of those countries, since 2010 Turkmenistan and Iran have grown production by the greatest amount next to the US (cumulative production growth of 42.2bcm and 38.7bcm, respectively). The most rapid relative growth over that period has been among several new, rapidly growing smaller producers. These include Brazil, which has added 7.8bcm to global production since 2010 (10% per year); Israel (7bcm or 40% per year): Peru (5.3bcm or 12% per year); and Mozambique (2.6bcm or 13% per year).
However, unproved reserves (which cannot be classified as proved reserves due to technical, contractual or regulatory uncertainties) have grown far more rapidly. According to the IEA, total gas reserves have increased by an average of 7.8% per year since 2011, which has exceeded the growth in both oil and coal total reserves (1.8% and 1.3% respectively) 26. This is driven by the growth in shale production. Because shale gas is extracted far more rapidly than conventional natural gas, by using different techniques, and given greater regulatory uncertainty, the bulk of global shale reserves are classified as unproved.
-1.3% PRODUCTION IN 2016 CONFIRMS THE LONG TERM DECLINING TREND IN THE REGION
Europe
In Asia-Oceania, Australia led all production growth (nearly 19%) given the development of multiple new LNG export projects

Global gas report 2017 12
Gas trade
In 2016, the global trade in natural gas grew significantly, and is estimated to have increased by 5.5% (or 57bcm) 27. This compares to stable but low growth in gas trade in 2010-15, which averaged 1.1% per year. Two factors explain this significant shift in 2016:
• First, LNG trade rebounded significantly (up 6%, 20bcm) given the expansion of Australia LNG exports and the opening of Sabine Pass 1&2 in the US. LNG supply growth in turn drove significant import growth in Asia (up 7.2% or 17 bcm), of which a majority was concentrated in China and India. Middle Eastern countries also continued to expand LNG imports as a means of diversifying access to gas, namely UAE, Kuwait, and Jordan (up 4bcm or 44%). Lastly, in 2016 Egypt continued its shift from LNG exports to imports – tripling imports from 3bcm to 9bcm.
• Second, pipeline trade grew significantly to Europe, within North America, and to China, resulting in an estimated 5% growth for the year globally (35.8bcm). The significant consumption growth in Europe was largely supplied via pipeline from Russia and Algeria, resulting in an 8% growth in trade which had
otherwise stagnated as European consumption declined in the previous years. In North America, further pipeline interconnections between the US and Canada/Mexico led to 15% growth in trade, reflecting an ongoing shift to what is in effect one common gas market. And in China the development of cross-border pipelines supported a 13% growth of pipeline imports in 2016.
Overall the balance between pipeline and LNG as a proportion of the global gas trade has remained stable since 2010, with LNG at about 30%. The growth of LNG has supported the development of new supply routes though, helping to diversify the global gas trade. This has been most significant in Asia, where LNG imports from the Middle East and Africa have increased by more than 40bcm since 2010. LNG is also providing supply security and flexibility for specific markets; for example both Poland and Lithuania recently opened LNG regasification capacity to diversify from Russian supply.
2,73
8
2,75
0
2,78
7
2,78
2
2,77
6
2,78
7
3,530
Unconventional
% Unconventional
+12.6%
Conventional
+0.4%
bcm
2013 2015
3,4453,384
2014
3,1483,3623,255
2010 2011 2012
13% 16% 17% 19% 21%18%
Othercountries
US
Argentina
bcm
Canada
Australia
China
1
250
6
50
10
15
betw
een
2010
-201
5
411 505 575 602 669 743
411 2010
2015743
Growth in unconventional gas production
27 Cedigaz 2017 first estimate
Recent gas production growth was mainly driven by unconventionals.which was largely due to increases in the US and Canada.
Source: Rystad data (Gas production), BCG analysis.
+7.8% p.a. AVERAGE INCREASE SINCE 2011
Total gas reserves

Global gas report 2017 13
Natural gas infrastructure
LNG
Low LNG trade growth (~2%) has resulted in declining utilization rates over the last five years, with levels similar to a decade ago. Global LNG capacities are growing both for liquefaction and re-gasification at ~5-6% per year, in line with forecasts.
In terms of LNG liquefaction capacity, the greatest recent growth in capacity has come in Australia which has grown capacity from 27bcma in 2010 to 90bcma in 2016. Prior to Australia’s rapid growth, Qatar increased liquefaction capacity from 42bcma in 2008 to 106bcma in 2011. Otherwise the most significant recent capacity additions have been in the US in 2016 (25bcma capacity) and Papua New Guinea in 2014 (10bcma). For LNG regasification capacity, Asian markets have led global capacity additions. Since 2010 capacity additions have included: 25bcma in China, 10bcma in India, 10bcma in Japan, 9bcma in South Korea, and 9bcma in Indonesia. In other regions Brazil has added 8bcma capacity and a wide range of countries have added 5bcma or less capacity. Globally, planned additional liquefaction capacity is substantial. Currently, 156bcma of LNG capacity is under construction, of which 48bcma are expected to come online in 2017. By comparison, there is about 466bcma of LNG liquefaction capacity today. The increased capacity is the result of large scale, megaprojects in Australia, and the development of existing LNG facilities in the US.
Despite LNG liquefaction capacity growth, LNG capacity utilization has failed to keep pace. Utilization levels for liquefaction facilities worldwide declined from 81% to 75% between 2010-15. This has been in part due to the decline in Egyptian gas production, shifting it from an LNG exporter to importer (shift from 10bcma exports to imports), plus a decline in supply from Indonesia (-10bcma), Yemen (-5bcma), and Trinidad & Tobago (-4bcma). Meanwhile, utilization of re-gasification plants in countries that import LNG fell from 33% to 29% between 2010-15, driven by a European consumption decline and the US shift from import to export.
LNG cost structure
Capital costs for LNG liquefaction plants are now falling by $1,000 per tonne of capacity due in large part to the development of US brownfield projects, converting existing re-gas capacity to liquifaction. Meanwhile, at large, new plants, such as Australia’s Gorgon and Ichthys projects, liquefaction costs are between $1,000 and $2,000 per tonne, and are continuing to rise. This is due to a combination of factors, including project complexity, remote locations, additional infrastructure requirements and specific design parameters.
bcm
+5.9%
bcm
2013
2014
2015
2012
2011
2010
2009
2008
2007
200
6
2005
1,12
6
1,07
9
1,02
8
971
950
90
0
866
783
686
682
634
30% 31% 33% 29% 28% 33% 34% 33% 31% 30% 29%
Regasification utilization 2
2007
200
6
2005
438
2014
2015
2010
2011
2013
2012
2008
2009
413
397
383
377
366
349
273
273
262
257
74% 81% 83% 83% 70% 81% 86% 83% 80% 78% 75%
Liquefaction utilization 1
+5.5%
bcm
+5.9%
bcm
2013
2014
2015
2012
2011
2010
2009
2008
2007
200
6
2005
1,12
6
1,07
9
1,02
8
971
950
90
0
866
783
686
682
634
30% 31% 33% 29% 28% 33% 34% 33% 31% 30% 29%
Regasification utilization 2
2007
200
6
2005
438
2014
2015
2010
2011
2013
2012
2008
2009
413
397
383
377
366
349
273
273
262
257
74% 81% 83% 83% 70% 81% 86% 83% 80% 78% 75%
Liquefaction utilization 1
+5.5%
Liquefaction capacity
Regasification capacity
Low LNG trade growth (~2%) resulted in decline in utilization rates in last five years, still similar level from a decade ago. Global LNG capacities are growing both for liquefaction and re-gasification ~5-6% per year, in line with forecasts.
1. Liquefaction utilization = LNG Exports / Liquefaction capacity * 100. 2. Regasification utilization = LNG Imports / Regasification capacity * 100. Source: CEDIGAZ data (Trade, Plants, Terminals), IEA WEO 2016, IEA Golden Age of Gas Report, BCG analysis.

Global gas report 2017 14
Shipping costs for LNG are declining due to greater efficiencies in tanker design and operations: the average cost of a new vessel fell from $1,770 per cubic meter in 2014 to $1,420 per cubic meter in 2015. Meanwhile, substantial additions of LNG shipping capacity has resulted in spot charter rates falling to $40,000 per day from $130,000 per day in 2012.
International pipelines
Cross-border pipeline capacity grew by 10% between 2010 and 2014, though has not grown significantly since. In that period capacity additions totaled 190bcma of gas transmission capacity. The largest recent project was Europe’s Nordstream pipeline, which added
Development of Regasification Utilization by Region
2005 2010 2015
Africa 0% 0% 26% Egypt shifting from export to import
Asia / Oceania 28% 36% 39% Japan driving growth with 43% utilization in 2015
Europe 40% 47% 26% Declining demand and ongoing regasification capacity completion
Latin America 0% 39% 42% Brazil (58%) and Argentina (51%) driving growth
Middle East 0% 0% 34% New LNG countries such as Kuwait, Jordan and Israel drive growth
North America 28% 10% 5% Shale gas has shifted the market and made regas an idle capacity
Total 30% 33% 29%
Taiw
an10
4%1
62%
58%
53%
52%
51%
50%
43%
40%
38%
37%
37%
37%
36%
35%
33%
29%
29%
28%
28%
28%
27%
27%
26%
22%
19%
15%
11%
10%
5% 3% 1%
Turk
ey
Braz
il
Dom
inic
an R
epub
lic
Kuw
ait
Arg
entin
a
Thai
land
Japa
n
Chi
le
Belg
ium
Chi
na
Puer
to R
ico
Indi
a
Ital
y
Sing
apor
e
Mal
aysi
a
Sout
h Ko
rea
Jord
an
Paki
stan
Fran
ceM
exic
o
Uni
ted
King
dom
Swed
en
Egyp
t
Port
ugal
Spai
n
Net
herla
nds
Gre
ece
Lith
uani
a
Can
ada
Isra
el
median = 34%
Uni
ted
Stat
es
Countries with limitedor no pipeline capacities
Countries with pipelineand LNG
Countries with inlandproduction and LNG
Decline in regasification utilization since 2010 driven by Europe & US.
Note: Regasification utilization = LNG Imports / Regasification capacity * 100.
1 Taiwan is running over capacity, forcing LNG plants to run above theoretical capacities. Two actions in progress; expansion of one of LNG plants, and building of 3rd terminal.
Source: CEDIGAZ data (CEDIGAZ trade, Plants, Terminals, Pipeline capacities) BCG analysis.
Regasification utilization in 2015
percentage increase
percentage decrease

Global gas report 2017 15
55bcma of transmission capacity to Germany, and a further 55bcma of capacity from Germany to the Netherlands and the Czech Republic, when it was completed in 2012. Asian pipeline capacity has also been expanded recently, with connections between China, Myanmar and Central Asia, especially Turkmenistan. This has added a further 40bcma to transmission capacity, and further pipeline connections are under construction. Other significant capacity additions since 2011 have included West Africa, with 5bcma, and 10bcma of extra capacity between Bolivia and Argentina.
Looking forward, two major multinational pipeline projects under development include the TAPI pipeline, which would link Turkmenistan, Afghanistan, Pakistan, and India with a capacity of over 30bcma; and the Trans-Anatolian pipeline (TANAP), with up to 30bcma of capacity through Turkey to Europe. While the TAPI pipeline has entered the engineering design phase, further political agreements are required before full construction begins. Meanwhile, TANAP is already under construction and is expected to be completed by 2020, along with the Trans-Adriatic pipeline connecting supply through Greece to Italy. Further pipeline capacity of up to 40bcma is under development between China and Russia. However, the timeline for such projects can be long and relatively unclear given the geopolitics involved.
Policy initiatives
Government policy initiatives aimed at encouraging greater adoption of gas as an energy tend to be slow to take shape and implement, limiting significant year to year developments. In the past year though two significant policy developments took shape concerning gas consumption growth.
In China, the release of the 13th five-year plan signaled ongoing support to the development of the domestic natural gas industry. The plan itself and subsequent releases confirmed continued support for natural as growth targets across sectors, in addition to signaling potential liberalization of elements of the gas sector28. The plan also identified a new target of 44GW of gas-fired power capacity additions.
Across multiple governments worldwide, further policy initiatives have moved to set a price for carbon. The number of national or sub-national carbon-pricing initiatives has doubled to 40 since 2011. Around 13% of global emissions are now covered by a carbon price, and this will increase to 23% when China implements its national emissions trading scheme in 201729. The UK increase in the carbon price floor was significant for shifting power production towards gas.
28 US CRS – "China's Natural Gas: Uncertainty for markets"
29 World Bank
Asian pipeline capacity has also been expanded recently, with connections between China, Myanmar and Central Asia, especially Turkmenistan.
+190bcm FROM 2010 TO 2014
Pipeline capacity
Global gas report 2017 16
New technologies are being deployed for LNG
Floating liquefied natural gas (FLNG) and floating storage regasification units (FSRU) provide for more flexible, modular solutions to LNG liquefaction and regasification requirements. Both FLNG and FSRUs can access more remote locations, are more scalable, and can require less initial capital commitment due to leasing structures. FSRU capacity has nearly doubled since 2013, growing from 44 Million tons per annum (MTPA) to 83MTPA. Much of this capacity has been added to small, developing countries that cannot necessarily support a full scale LNG regas facility. These include Jordan, Pakistan,
and Lithuania. Other larger scale markets have seen FSRU capacity added to diversify supply or provide for more flexible, peak supply (such as Argentina and UAE). In 2017 the first FLNG developments are expected to reach production. Prelude, a pioneer project in FLNG, is due to come online in 2017 with 4.7bcma capacity. A further 8.7MTPA of FLNG capacity is under construction while 157MTPA of capacity is planned, out of 879MTPA of new liquefaction capacity that is being built or is due to be built.
The rationale for using natural gas in transport instead of oil is two-fold: First, it has a lower commodity cost than oil products, in most markets. Second, it produces less greenhouse gas emissions and localized pollution than oil products, diesel in particular. However, only 4% of energy usage in the global transport sector comes from natural gas. This reflects the fact that the process of new technologies challenging incumbent technologies takes time and investment. Furthermore, the use of gas for transport faces competition from multiple other new technologies, including electric vehicles for ground transport.
Ground transport
In ground transport applications, the capital cost requirements of converting engines and developing refueling infrastructure varies significantly in different regions. For example, in the US, due to typical engine size and limited market scale for the manufacture of gas engine technologies, the cost of a compressed natural gas (CNG) vehicle can be $8k higher vs. a gasoline alternative. In Italy, however, where vehicles are smaller and CNG is more common, capital costs may be less than $2k. Despite fuel savings from natural gas, it can take an average vehicle owner in the US 13 years to
payback that premium, vs. 1 year in Italy. Given the need to recover upfront capital costs for gas, vehicles which consume a very high quantity of fuel, such as heavy duty trucks and buses, tend to adopt natural gas more frequently. Furthermore, with limited segments of vehicles adopting natural gas, refueling infrastructure may be restricted to the main refueling points for these types of vehicles.
Maritime vessels
A critical factor driving greater LNG usage by maritime vessels is the International Maritime Organization (IMO) MARPOL convention limiting sulphur emissions, which in turn is driving national governments to adopt maritime sulphur regulations. Because of the relative low sulphur emissions from gas vs. conventional bunker fuel, LNG enables ships and ship-owners to meet these rules. However, LNG engines are more expensive than conventional fuel oil options ($3-5m incremental cost) and it is costly for ships to convert from existing technologies 30. As the IMO extends its authority to new geographies from 2020 onwards, the use of LNG may grow more significantly, though it will ultimately depend on the total cost of ownership relative to other technologies such as low sulphur oil-based fuels and scrubbers.
CASE STUDY: GAS IN TRANSPORTATION
30 IHS

Global gas report 2017 17
The role of policy
Despite these challenges facing gas technologies for both ground and marine uses, natural gas consumption in the global transport sector has been growing by 4.4% per year since 2010. This growth has been led by China due to a set of policy initiatives focused on increasing gas consumption in the sector. This policy support includes a regulated price structure, which has kept natural gas prices at a discount of between 60% and 70% to alternative oil-based fuels.
China has also provided state funding for developing LNG engines and building refueling stations to bring down capital costs, both for road and marine transport. In Europe, the use of gas in transportation has been a source of growth in an otherwise declining market. The role of gas has been supported, in part, through the European Union’s Trans-European Transport Network project, which has encouraged the development of a refueling network for LNG and CNG. Italy is Europe’s largest CNG market, with 1m vehicles in operation.
1,805 1,7501,053 914
2,360
3,416
7,950
2,014
1,104
13.3
Number of CNG Stations
ORDEM E P ROGRESSO
Natural gas for transport has reached critical mass in many countries. China leads the market due to a set of policy initiatives.
Italy is Europe's leader.
Note: 2016 Data.
Source: NGV Global; BCG Analysis.
Top 10 countries with the largest number of CNG stations
On July 3rd, 1994, the EB110 GT ECOGAS broke the world speed record at Nardò with a speed of 344.7 km/h.

Global gas report 2017 18
A wide range of industry organizations are predicting that global demand for natural gas will grow faster than for any other fossil fuel from now through 2030. Compared with other energy sources where expectations can diverge significantly, there is remarkably strong consensus among forecasters about the trajectory of gas demand growth: major forecasts all expect growth between 1.6% and 2.2% per year.
Among the most bullish forecasters are the US Energy Information Administration and a number of industry participants, which are projecting that gas consumption will grow by more than 2% per year through 2035. Other recent forecasts include the International Energy Agency’s New Policies Scenario, predicting growth of 1.6% per year, and BP’s Statistical Review of World Energy, with 1.8% growth per year. These projected growth rates are aligned with policies governments have indicated they intend to adopt, specifically as part of the Paris Agreement process through their Nationally Defined Contributions (NDCs) 31.
Gas forecast to 2030-2040
These forecasts also project that gas will overtake coal as the second “core pillar” of the global energy mix by 2035. The majority of forecasters expect gas to grow from 22% to over 24% of global energy consumption by 2035, while coal consumption is projected to decline from 29% to between 22% and 25%. Underpinning these projections are a number of the specific attributes of gas, including environmental benefits that gas can play, its diverse uses, and its supply availability and diversity.
However, while gas can significantly contribute to decarbonization by displacing other, more polluting, fuels, it should be noted that none of the forecasts above result in containing climate change below 2°C without an important contribution from carbon sinks, such as carbon capture and storage, which makes the economic development of such technologies crucial for the industry and for the wider social context. The IEA has also developed a “450 scenario”, which describes an evolution of the energy mix in line with the 2°C objective, a scenario which envisages a decline in gas consumption after
EIA Intl Energy Outlook 2016 (2.2%)
Projections and growth CAGRs
Shell LNG Outlook 2017 (2.0%) BP Statistical Reivew 2016 (1.8%)
IEA Golden Age of Gas scenario – 2011 (1.8%)1 IEA - NPS 2016 (1.6%)2
3,000
2,000
2020 2025 2030 2035
4,000
5,000
6,000
Vs. ~3,500 bcm consumption today
World Gas Demand (bcm)
Gas is expected to be the fastest growing fossil fuel, surpassing coal by 2035. Coal demand growth is forecast to be between negative and 0.5% per year3.
Note: 1. 2008-2035 period. 2. 2014-2035 period. 3. Includes forecasts of EIA, IEA, BP.
NPS: New Policies Scenario, which is the base scenario used in annual World Energy Outlook Reports.
Source: IEA Reports, EIA 2016 Report, BP Statistical Review 2016, BCG Analysis.
31 IEA New Policies Scenario from the 2016 World Energy Outlook is aligned with NDCs submitted as part of the Paris Agreement process
3/
Key global gas consumption growth forecasts
Through 2030 global gas demand is expected to grow faster than for any other fossil fuel

Global gas report 2017 19
Middle East
Other Asia
China India Africa BunkersLatin America
Other Asia
CISJapanUnited States
EuropeOther Americas
Middle EastAsia AfricaGlobal total Americas Europe/CIS Bunkers
Non-OECD Asia: 739bcm or 43% of total growth
OECD Non-OECD
3,502 5,219
2014 2040
90 50 23 18136318513841668 105-34 4983
Annual gas consumption (bcm)
2030 unless gas is substantially decarbonized. The 450 scenario is not aligned with Nationally Defined Contributions under the Paris agreement and is therefore top-down, and requires overcoming significant challenges from a technology and infrastructure perspective. Growth expected to be driven by non-OECD countries
Non-OECD countries, especially in Asia, are expected to account for the greatest share of the growth. The International Energy Agency (IEA) predicts the demand for gas will grow by 2.6% per year among these countries, compared with 0.9% for OECD countries. As a result, non-OECD markets would account for over 62% of global gas consumption by 2040, as against 53% today32.
Given the small proportion of gas used in domestic Asian energy consumption so far (8% versus 25% for OECD markets), the region is set to be an important driver of demand growth. Over the next twenty-five years, the IEA is forecasting that consumption in non-OECD Asia will increase by 739bcm, from a base of 493bcm today, out of which 416bcm is expected to come from China. Other anticipated high-growth regions comprise Africa, where demand is projected to increase by 3.4% a year, or 181bcm, over the next 25 years; and the Middle East, where growth of 2.3% a year, or 363bcm, is expected over the same period. The IEA and other forecasters are basing
their projections of gas growth on a number of factors, including:
ǃ Firstly, the significant supply growth that is expected in the near term. Substantial new LNG capacity is due to come on line over the next five years from the US, which is adding over 50bcma; from Russia’s Yamal project, which will add over 23bcma; and from Australia, where over 20bcma of capacity is expected on top of the Gorgon project. Projected growth in central Asian pipeline capacity, will boost supply, as will new or emerging export markets such as Mozambique and the East Mediterranean region. Meanwhile, gas production and reserves are expected to diversify into non-OECD markets, with greater development of shale resources outside the US.
ǃ Secondly, additional supply will only translate into consumption if it is competitive with other fuels whether through market forces or policy initiatives. And natural gas is expected to price competitively with coal in the power sector, as the price of coal increases to $100 per tonne, according to energy data provider Cedigaz.
ǃ Thirdly, the global trade in gas is expected to expand, buoyed by significant growth in LNG demand. By 2035, gas traded between one region and another is projected to account for between 20% and 30% of global gas consumption (against 13% as of 2015), while LNG traded volumes will match those of pipeline gas, according to the IEA. 32 IEA 2016 New Policies Scenario
Non-OECD Asia is a criticaldriver of global gas growth.
Source: 2016 IEA, BCG analysis.
Non-OECD countries, especially in Asia, are expected to account for the greatest share of the demand growth
Projected gas consumption growth to 2040
62% CONSUMPTION BY 2040 GROWING 9 PERCENTAGE POINTS
Non-OECD Markets

Global gas report 2017 20
Annual vs forecast gas consumption growth rate (%)
Share of global energy mix by fuel (%)
2.6
2.2
0.7
0.9
1.8
1.5
Global consumption
OECD consumption
Non-OECD consumption2
IEA "Golden age of gas" scenario (2011)1
Actual growth rate (2010-15)
Gas
2010 2014 2016 2010 2014 2016
29.2
21.9
29.5
21.9
27.7
22.3
Coal
2.6
2.2
0.7
0.9
1.8
1.5
Global consumption
OECD consumption
Non-OECD consumption2
IEA "Golden age of gas" scenario (2011)1
Actual growth rate (2010-15)
Gas
2010 2014 2016 2010 2014 2016
29.2
21.9
29.5
21.9
27.7
22.3
Coal
Natural gas consumption growth has been slower than forecast.
1. 2008-2035 Period. 2. Non-OECD 2015 demand calculated using 2014 IEA demand data and 2014-2015 CEDIGAZ growth rate.
Source: IEA data (Natural gas balance, Consumption by fuel), IEA WEO 2016, IEA Golden Age of Gas Report, BCG analysis.

Global gas report 2017 21
Mtoe
2008 demand 2008 demand
North America
Latam
Europe
ME/Africa
CIS
APAC
Mtoe
2015 demand 2015 demand
2,593
2,950
159144
103
6
30
2
2,911
35
127
30
124
-7
-72
2,593
WEO 2010 view expected growth by region Real demand growth by regionRegional growth has diverged from expectations.Greater growth than expected in domestic North America and Mexico consumption.Asia growth driven in large part by Japan.
Will the growth forecasts outlined in the previous section be realized? That is a pertinent question because gas consumption has underperformed against expectations to date, growing by 1.5% a year between 2010 and 2015, relative to widespread expectations of over 2% per year. Meanwhile, the share of gas in the energy mix has risen from 21.9% to 22.3%, but is still far off from overtaking coal, which stands at over 27.7% 33.
The global picture is the result of gas consumption exceeding expectations in North America and the Middle East while, growth has lagged expectations in Europe and non-OECD Asia. When excluding the dramatic growth from Japan post-Fukushima, growth in Asia missed IEA targets by nearly 10bcm in aggregate through 2015. In the context of slower-than-expected overall growth and significantly divergent regional trends, the following section of the report aims to:
• Identify a framework and key drivers across markets that can broadly explain recent trends, and assess how these have played out at a regional level since 2010.
Meeting gas demand forecasts4/• Describe progress against these drivers and
the barriers that remain to achieving gas growth forecasts, and finally
• Describe a number of initiatives which would contribute to overcoming remaining barriers (“enablers”) and support the achievement of gas consumption forecasts at a national and regional level.
To identify the key drivers of gas consumption growth at a national level and what is required for gas to achieve growth forecasts, a systematic qualitative and quantitative assessment was conducted of gas market growth over the past five years. While at a country level there are a number of variables affecting consumption dynamics, ultimately three fundamental drivers can broadly explain gas consumption growth at a market level:
1. Cost competitiveness2. Supply security3. Perceived sustainability of gas.
33 IEA data

Global gas report 2017 22
1. Cost competitiveness
Cost is a clear and consistent driver of government energy policies as well as personal and business decisions on sources of energy supply. In practice this can play out differently in the short run vs. the longer run when decisions are made on fuel choices.In the short run, fuel switching will occur when there is a choice between two fuels and the variable cost structure differentiates the choice. This is the case for the power sector where the lowest marginal cost source of supply is dispatched.
In the longer run, the cost competitiveness of gas affects capital investment decisions for specific technologies. In the case of the power sector, this would entail a choice
between investing in gas-fired capacity vs. alternative fuels, or in the transport sector between a diesel engine vs. CNG/LNG. For such capital decisions, both the difference in upfront capital costs between technologies along with the expectation of future variable costs are important factors. Once capital investments have been made, that in turn promotes "lock in" for the use of a fuel going forward; in the power sector for example, the lifespan for a coal fired power station is typically 40 years.
In the power sector, price disparity between gas and coal is central for driving decisions on capital investment. While the capital cost of a gas-fired power station is less than for a coal-fired one, the additional cost of fuel can result in electricity from a gas-fired plant being more costly, depending on the region.
0,1
O&M
Carbon5
Fuel4
Investment
Refurb. & decom.
Carbon5
O&M
Fuel4
Investment
65,9Total
77,7Total
0,1
93,8Total
O&M
Carbon5
Fuel4
Investment
Refurb. & decom.
Gas2 Average LCOE ($/MWh)1 Coal3 Average LCOE ($/MWh)1 Gas2 Average LCOE ($/MWh)1 Coal3 Average LCOE ($/MWh)1
92,8
Total
Carbon5
O&M
Investment
Fuel4
11,1
4,7
36,9
13,2
28,4
25,2
11,1
28,9
7,0
71,5
11,0
3,3
35,7
28,9
9,1
4,1
Fuel cost the most significant driver of differences in gas vs. coal power generation costs.
Note:1. Average of IEA LCOE scenarios, reflecting 7% cost of capital.2. CCGT technology assumed for both US and China. 3. Supercritical pulverized coal technology assumed for US, ultra-supercritical coal technology assumed for China. 4. Fuel costs per IEA assumption are $5.5/MMBtu gas in US, $101/t coal in US, $11.5/MMBtu gas in China, and $112/t coal in China. 5. Price of carbon assumed to be $30/t CO2 in all geographies.
Source: IEA Projected Costs of Electricity Generation (2015), BCG analysis.
In the power sector, price disparity between gas and coal is central for driving decisions on capital investment
US and China levelized cost of electricity

Global gas report 2017 23
-10%
-5%
0%
5%
10%
15%
-10% -5% 0% 5% 10% 15%
Ita
QatEgy
Kor
Aut
Cze
IraqNor Tun
Ido
Isr
HunPer
Col Sin
Rom
Vie
AzeBah
Pol
BelgTai
Mex
Bel
Tri Kuw
Oma
Ban
Ven
Spa
KazTkmPak
NetUkr
Alg
Aus
Mal
Fra
Uzb BraUAE
Tur
2010-2014 Chg. in gas share
2010-2014 Chg. in Coal share
Arg
Ind
US
RusNig
Chi
Iran
Jap
Ger
Sau
UK
CanTha
Americas CIS Asia-Oceania Middle East Europe Africa
Coal gains share over Gas
Gas gains share over Coal
In the US the cost of gas is nearly equivalent to that of coal, the difference in fuel costs in China can be double or more (see exhibit). As the cost competitiveness of gas versus coal has improved in North America given the significant growth in supply, it has become a lower cost fuel source and thus has displaced coal. This shift to gas in North America has added to the regional coal supply surplus and in turn resulted in a decline in coal prices.The knock-on effect of has been that coal has become more cost competitive in import markets and has therefore gained share compared to gas in Europe as well as several Asian markets (see chart above).
In Europe there is limited growth of new thermal power generation capacity overall, thus fuel switching from gas to coal at existing power plants accounts for much of this shift in the power sector. In Asia though, given the rapid growth of power generation capacity the shift in share from gas to coal is due in large part to more rapid expansion of new coal-fired power generation capacity relative to gas owing to competitive dynamics and supply security concerns.
2. Gas supply security
While gas reserves and production may be widely available on a global basis, supply and trade discontinuities combined with geopolitical concerns can limit access to gas in specific markets. In Europe for example, the reliance on Russia gas imports has prompted the European Commission and national governments to seek to diversify sources of supply through LNG and pipeline imports from other regions. Meanwhile, in Asia geopolitical constraints have delayed the proposed TAPI (Turkmenistan-Afghanistan-Pakistan-India) and the Iran-Pakistan-India pipelines for decades, preventing the region from accessing substantial gas reserves in Turkmenistan.
In practice, two factors have been shown to consistently help overcome supply availability and security challenges for specific countries:First, domestic production of gas can directly achieve localized supply availability and provides domestic political control over gas supply. Local gas production tends to support more competitive pricing, unlock investment in gas infrastructure, and generally alleviate supply security concerns. When assessing variables that drive consumption growth, the most significant
Change in share Gas vs Coal
Coal has beaten gas in Europe and some Asian countries, driven by high price differentials vs. coal and low price of carbon.
Note: Countries with over 5bcm gas demand in 2015 included in analysis.
Source: Demand = IEA consumption data (Natural gas balance), Production = CEDIGAZ (CEDIGAZ-Prod.-Cons.-Infra.), Fuel shares = IEA (Consumption by Fuel), BCG analysis.
Domestic production, diversified gas infrastructures, and access to gas trade: security supply challenges

Global gas report 2017 24
driver consistently is domestic gas production growth (as demonstrated in the chart above). Achieving domestic supply growth requires a policy and fiscal environment at a national level that promotes upstream investment.
Second, growing and diversifying natural gas infrastructure and access to gas trade promotes flexible and abundant gas supply, in turn improving supply security. The development and diversification of global LNG trade has helped to advance availability and security, particularly due to more flexible contracting and availability of spot markets. Meanwhile, the increasing availability of small-scale flexible infrastructure such as FSRUs is also facilitating more modular and rapid deployment of infrastructure.
3. Sustainability
The environmental attributes of natural gas contribute to consumption growth and policies that support gas in two ways. First, fewer localized emissions than coal, in particular, supports adoption of gas as a means of reducing air pollution, which has been particularly
relevant in Asia. Second, its lower greenhouse gas emissions than other fossil fuels has supported the adoption of gas as a means of meeting climate change emissions goals.
Nonetheless, gas is a fossil fuel that directly contributes to climate change both through the release of CO2 when burned and when methane is leaked . This presents specific sustainability challenges for gas both in the near-term and long-term.
In the near term, concerns over methane fugitive emissions (the unconstrained release of natural gas without combustion) can constrain gas exploration and production. This concern has begun to contribute to opposition to gas sector development (particularly shale development), and has emerged as a basis for specific government regulations across the gas supply chain. In the longer term, investment in the gas industry may be hampered by concerns about the long-term viability of gas as the world moves towards a zero-emission energy environment and policy makers begin to adopt measures that drive deep decarbonization pathways.
0
40-40
40
-40
120
80
-20 0 180
Qatar
India
Indonesia
Netherlands
UAEAlgeria
Nigeria
Saudi Arabia
Argentina
Brazil
Norway
Canada
Trinidad and Tobago
Iran
Turkmenistan
United States
Mexico
Production growth 2010-15 (bcm)
Consumption growth 2010-15 (bcm)
Germany
Australia
United Kingdom
Egypt
Russia
China
Italy
Ukraine
Pakistan
AfricaLatin America Asia-OceaniaCISNorth America Europe Middle East
Gas production vs. consumption growth 2010-15
Gas production growth is the greatest driver of consumption growth within a country.
Note: Countries with >5bcm of production and consumption. Correlation coefficient of absolute production growth and consumption growth is .82 R2 is .68
Source: IEA, BCG analysis
Two main sustainability challenges for gas in the short- and long-term towards a zero-emissions environment: CO2 release and methane leakage

Global gas report 2017 25
efficiency improvements of horizontal drilling and hydraulic fracturing technologies, shale gas production became cost competitive and production dramatically accelerated. From 2005 to 2015 US shale gas production increased from 20bcm to over 350bcm per year, resulting in a total increase in US gas production of more than 50% over that period 34.
The dramatic supply growth experienced in the US in turn resulted in a significant decline in gas prices. Prior to the shale boom wholesale gas prices frequently exceeded $8/MMBtu in North America, whereas in the last two years they have regularly dropped below $2/MMBtu. Such a dramatic improvement in cost competitiveness quickly led to gas becoming competitive with other fuels, thus natural gas has gained share across all sectors of energy use in the US. The power generation sector was the first to capitalize on this price shift, with gas consumption growing by nearly 40bcma between 2005 and 2010. By 2009/10, on a levelized cost of electricity basis the cost of natural gas fell below that of coal in parts of the country and has remained competitive since 35 (gaining
34 US EIA35 Bloomberg New Energy Finance
North America: Assessment of key drivers
North America Drivers Comments
• Henry Hub the lowest major gas index price globally (<$3.5/MMBtu)
Cost competitiveness • Gas now competitive with coal for power generation
• Stable production growth at an average of 3.2%
• Significant pipeline capacity connecting the region
• Substantial LNG import capacity – recent growth in Mexico
Availability and supply security
• From net importer of gas to net exporter; • High degree of internal interconnections
• Increasing concern and regulatory action on methane fugitive emissions
Sustainability • The industry is being challenged to realize even greater GHG reduction potential through control of fugitive emissions
2010-2015: regional analysis5/
+50%2005-2015, DRIVEN BY AN INCREASE IN SHALE GAS PRODUCTION FROM 20 BCM TO OVER 350 BCM PER YEAR
US production
To assess how the three drivers have evolved in practice over the past five years, this report assesses them at a regional scale focusing on North America, Europe, Asia, and the Middle East. These are the four largest regions for gas consumption today and predicted to be the most significant drivers of growth going forward.
North America
Over the past decade the North American shale gas boom has affected all aspects of the natural gas industry, resulting in greater supply availability and security and in turn making gas increasingly cost competitive both within the region and globally. Given the dramatic shift in trajectory from the US being a net importer to a net exporter of gas, it is a unique and unprecedented example of how growth in domestic production can transform markets across a region.The US is truly experiencing a “golden age” of gas.Prior to 2006 natural gas production in the US declined and the country imported a growing share of its gas consumption. However, through the development and

Global gas report 2017 26
3.5% of the power energy mix since 2010). Fuel switching due to attractive relative economics explains some of this growth, but sustained low cost of gas along with supply security has also altered long term capital decisions. For example, in the power sector installed gas capacity has increased from less than 320GW in 2005 to more than 450GW in 2016, which now for the first time exceeds the capacity of coal 36.
Looking forward across the region, gas does face some headwinds relating to perceptions of sustainability. Recent technical findings have suggested that methane fugitive emissions are more significant than was previously assumed. This, combined with other more general concerns about the long term emissions implications of further gas infrastructure investments, have prompted new regulation. Opposition to upstream and midstream gas sector development has also focused on these sustainability concerns, contributing for example to the ban on hydraulic fracturing in New York State and the rejection of multiple gas pipeline permits.
Canada
In Canada, the development of the US industry led in turn an acceleration of its own domestic
shale gas development. Canadian shale production grew from less than 10bcm in 2010 to over 70bcm by 2015. While US pipeline exports to Canada increased initially to 2012, since then they have decreased as Canada has experienced its own shale supply boom.
Mexico
In Mexico, the US shale boom has largely affected the domestic gas market through the availability of low cost supply. Since 2010 pipeline imports from the US have increased 3x (from ~10bcm to ~30bcm), helping to offset declining domestic production. This has led to a reduction in wholesale prices from more than $8/MMBtu to under $5/MMBtu and in turn has enabled an increase in gas consumption of 10bcm over that period.
However, gas consumption in Mexico has only grown materially in the power generation sector as midstream infrastructure constraints have limited availability of low cost gas to other sectors37. Looking forward, the ongoing energy sector liberalization will be critical for determining whether the inexpensive US imports can spur growth in other sectors and if domestic shale production materializes.
36 IEA37 Columbia Center for Energy Policy
+60bcmFROM 2010 TO 2015
Canada shale production
-38%SINCE 2010
Mexico prices
Global gas report 2017 27
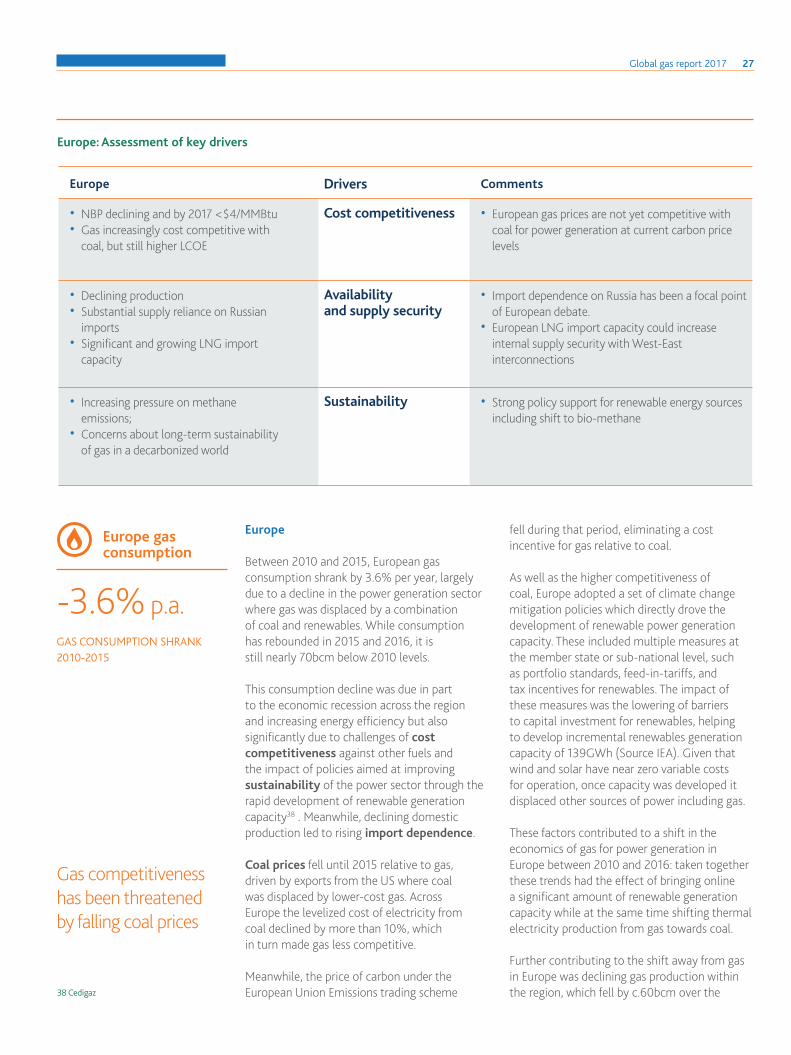
Europe: Assessment of key drivers
Europe
Between 2010 and 2015, European gas consumption shrank by 3.6% per year, largely due to a decline in the power generation sector where gas was displaced by a combination of coal and renewables. While consumption has rebounded in 2015 and 2016, it is still nearly 70bcm below 2010 levels.
This consumption decline was due in part to the economic recession across the region and increasing energy efficiency but also significantly due to challenges of cost competitiveness against other fuels and the impact of policies aimed at improving sustainability of the power sector through the rapid development of renewable generation capacity38 . Meanwhile, declining domestic production led to rising import dependence.
Coal prices fell until 2015 relative to gas, driven by exports from the US where coal was displaced by lower-cost gas. Across Europe the levelized cost of electricity from coal declined by more than 10%, which in turn made gas less competitive.
Meanwhile, the price of carbon under the European Union Emissions trading scheme
fell during that period, eliminating a cost incentive for gas relative to coal.
As well as the higher competitiveness of coal, Europe adopted a set of climate change mitigation policies which directly drove the development of renewable power generation capacity. These included multiple measures at the member state or sub-national level, such as portfolio standards, feed-in-tariffs, and tax incentives for renewables. The impact of these measures was the lowering of barriers to capital investment for renewables, helping to develop incremental renewables generation capacity of 139GWh (Source IEA). Given that wind and solar have near zero variable costs for operation, once capacity was developed it displaced other sources of power including gas.
These factors contributed to a shift in the economics of gas for power generation in Europe between 2010 and 2016: taken together these trends had the effect of bringing online a significant amount of renewable generation capacity while at the same time shifting thermal electricity production from gas towards coal.
Further contributing to the shift away from gas in Europe was declining gas production within the region, which fell by c.60bcm over the 38 Cedigaz
Gas competitiveness has been threatened by falling coal prices
-3.6% p.a. GAS CONSUMPTION SHRANK 2010-2015
Europe gas consumption
Europe Drivers Comments
• NBP declining and by 2017 <$4/MMBtu • Gas increasingly cost competitive with
coal, but still higher LCOE
Cost competitiveness • European gas prices are not yet competitive with coal for power generation at current carbon price levels
• Declining production • Substantial supply reliance on Russian
imports • Significant and growing LNG import
capacity
Availability and supply security
• Import dependence on Russia has been a focal point of European debate.
• European LNG import capacity could increase internal supply security with West-East interconnections
• Increasing pressure on methane emissions;
• Concerns about long-term sustainability of gas in a decarbonized world
Sustainability • Strong policy support for renewable energy sources including shift to bio-methane

Global gas report 2017 28
Coal levelized cost of electricity ($/MWh)
-7.1%-12.3%
-13.1%
NetherlandsGermanyBelgium
20152010
13.6 14.313.0
7.4
4.56.0
7.75.4
0
5
10
15
2009 2010 2011 2012 2013 2014 2015 2016
EU CO2 price1
Coal prices halved
+6%
+3%
0%
-3%
-6%
-9%
+8%
+4%
0%
-4%
-8%
-9% -6% -3% 0% +3% +6%
Gas vs coal change in share Gas vs RES change in share
Coal gains share over GasRES gains share over Gas
+8%+4%0%-4%-8%
Nor
Cze
AutHun
Rom
Blg PolSpaNet
Fra
Ita
Ger
Tur
UK
Renewables supported by multiple policy incentives2
Gas gains share over Coal
Nor
CzeAutHun
RomBlg
Pol
SpaNet
Fra
Ita Ger
TurUK
Gas gains share over RES
Change in coal share Change in RES share
Change in gas share (2010-2014)Change in gas share (2010-2014)
€/t
period. This contributed to a growing reliance on imports, introducing challenges to future security of supply. In response, the European Union and member countries have moved to expand LNG regasification capacity, pipeline interconnections and storage to reduce vulnerability to potential supply shocks. An example of this is the nearly €6bn facility established by the European Commission to
fund energy security projects39. While security of supply concerns are not directly limiting further gas consumption per se, they are resulting in substantially greater costs by EU states in an attempt to maintain security. To better illustrate how these issues play out in practice, the following are two examples of Germany and the UK, each of which has taken a very divergent trajectory for gas consumption.
Impact of coal levelized cost of electricity and CO2 price on gas share
Note:1. ICE DAILY EUA. 2 Including renewable portfolio standards, tax incentives, and feed-in-tariffs.
Source: Bloomberg, analyst reports, BCG analysis.
39 European Commission – "Connecting Europe Facility"40 IEA
-3% REDUCTION OF CO
2 EMISSIONS
IN POWER SECTOR IN 2010-2016
Germany
Germany
Germany is in the midst of a substantial energy transition (the "energiewende"), with the overall intent of both moving away from nuclear power generation and reducing emissions from the power sector. In part this has resulted in power generation from wind and solar increasing nearly
threefold from 45 terawatt-hours [TWh] in 2008 to 126TWh in 2015. Meanwhile though, the use of coal has remained stable while that of gas in power generation has declined from 90TWh in 2008 to 60TWh in 2015. This shift occurred despite the stated announcement in the period of the nuclear power shut down, resulting a decline of 8.2GW of capacity 40.

Global gas report 2017 29
The driver of such an unexpected shift from gas to coal was a decline in coal LCOE relative to gas given lower coal commodity and carbon costs. In essence, renewables were incentivized through policy, but coal was not dis-incentivized. The result of such an unexpected shift forward both renewables and coal was that greenhouse gas emissions from the power sector in Germany did not materially decline, only falling from 315Mt/CO2 in 2010 to 306Mt/CO2 in 2016 in the context of effectively stable overall power consumption41.
41 Agora Energiewende42 A contributing factor to this shift is that many UK coal plants
are older and less efficient that those in Germany
9
19
36
9
31
1
2015
18
43
8
46
2025
12
2010
33
36
11
9
14
12
11
38
9
42
2020
1
Coal
Oil
Other
Complete coal phase out expected around 2025
Announcement of carbon price floor in 2011, set at £18/t from 2016
All renewables
Nuclear
Gas
0
100
200
300
400
2010 2011 2012 201620152013 2014
Hydro
Wind
PV
Other Renewable
Nuclear
Gas
Coal
Oil
Other
Gas-fired generation increased by 40% in 2016, replacing coal shut downs
9
19
36
9
31
1
2015
18
43
8
46
2025
12
2010
33
36
11
9
14
12
11
38
9
42
2020
1
Coal
Oil
Other
Complete coal phase out expected around 2025
Announcement of carbon price floor in 2011, set at £18/t from 2016
All renewables
Nuclear
Gas
0
100
200
300
400
2010 2011 2012 201620152013 2014
Hydro
Wind
PV
Other Renewable
Nuclear
Gas
Coal
Oil
Other
Gas-fired generation increased by 40% in 2016, replacing coal shut downs
UK power generation capacity – historic and projected (GW) UK power production by source (TWh)
UK: Share of gas in power is growing following the increase in carbon price floor. Source: IEA, Ofgem, BCG analysis.
United Kingdom
Relative to Germany, the UK has taken a very different policy trajectory. Starting in 2011 and reaffirmed in 2015, the UK government established a carbon price floor of $20 per tonne of carbon dioxide. Once implemented fully from 2016, this resulted in gas becoming more competitive relative to coal when considering the total levelized cost of electricity. In response, the operators of multiple coal-fired plants have announced plans to close these facilities or shift to gas power42. Ultimately this specific policy initiative resulted significant gas demand and consumption growth of 12.6% for 2016, with further growth projected in coming years as additional coal capacity shuts down.

Global gas report 2017 30
Asia
Gas consumption has grown significantly in Asia, averaging 3.2% per year from 2010 through 2015. However, much of that growth has been driven by China specifically, which will be analyzed later in this segment.
Excluding China the consumption growth rate across Asia has been a much more modest 1.2% p.a. The critical driver in limiting growth within the region has been the cost competitiveness of gas vs. coal. Asia as a region is highly reliant on LNG relative to others (34% of supply) and has the highest price for LNG globally. Within the power sector specifically, gas is challenged due to a 40%+ cost premium to coal and by the fact that many countries in the region do not yet have a price on carbon, a trend that’s partially driven by the perceived supply security of domestically produced coal.
That said, gas security of supply in Asia has improved significantly over the past five years given substantial expansion in gas production up 500bcm, development of LNG import capacity up c.330bcm and new
43 While gas is not explicitly included in many NDCs, a shift to greater adoption is implicit through the policy measures recommended such as carbon pricing or power generation portfolio standards
pipeline connections. However, a challenge for many countries is a constraint on domestic production capacity. In particular, Japan and South Korea are almost entirely dependent on LNG imports, which has exposed their economies to significant price fluctuations particularly following the supply imbalances in 2010-13. In other emerging markets like Vietnam and the Philippines, LNG regas capacity has not yet been developed, limiting consumption to available domestic production.
The sustainability of gas is a key benefit recognized within the region. Given the widespread challenge of urban air pollution, gas is seen as a solution to balance lower emissions with economic development. For example, both India and China have articulated their policies promoting gas on the premise of improving urban air quality. Furthermore, as part of the Paris COP21 process many countries have included gas in their Nationally Defined Contributions as a means of reducing GHG emissions43. The following case studies from the region demonstrate how countries in the region are diverging in their approaches to gas, in particular comparing what has driven substantial growth in the gas sector in China while India has lagged.
+100bcmaOF IMPORT CAPACITY SINCE 2016
China
Asia: Assessment of key drivers
Asia Drivers Comments
• Though costs are declining, it is still the highest index price globally
Cost competitiveness • Gas is not competitive with coal in the region
• Limited domestic gas availability in many countries;
• Increasing LNG regas capacity contributes to improving supply security
Availability and supply security
• Gas is perceived as less secure than domestically produced coal (where available);
• Infrastructure, while growing, does not allow for market liquidity
• Gas is perceived as a solution to strong regional concerns on emissions and air quality;
• Gas consumption growth underpins many countries’ NDCs under the Paris agreements
Sustainability• Sustainability drives policy support for gas

Global gas report 2017 31
China
A decade ago natural gas played a minimal role in the Chinese national energy mix, contributing only 2% of total energy consumption. At the time gas consumption was almost entirely supplied by domestic production and there was minimal national transmission infrastructure to connect different regions. A decade on, gas has grown to more than 5% of the domestic energy mix and consumption growth has been sustained at an average of 12% per year. In that time China has added over 100bcma of import capacity and has sustained domestic gas production growth of more than 7% per year. In the past decade China has added over 130bcma of gas consumption, second only to the US in that period. Such substantial growth was the deliberate result of multiple policy measures within China aimed at expanding the use of natural gas. Specifically, the Chinese government has set the goal that gas should be 10% of the domestic energy mix by 2020.
To spur growth, the Chinese government first focused on establishing supply availability and security, through both domestic production and imports. To achieve domestic production growth, the Chinese government has prioritized specific regions and utilized its state-owned oil and gas companies to develop the sector, while also more recently opening the sector to investment from independent oil companies.
In order to expand imports, China has recently struck supply deals and developed pipelines with Myanmar, Russia, and Turkmenistan, which have added over 40bcma of supply/capacity to date with a further 40bcma planned. China has also increased LNG import capacity by about 60bcma since 2010, with a further 50bcma planned through 2020.The development of the LNG import capacity has coincided with significant greater supply availability as Qatar and Australia quickly have become China's largest suppliers 44. Meanwhile, the Chinese government has adopted a broad set of policies designed to improve the cost competitiveness of gas and otherwise to spur consumption growth. The government provides preferred access for natural gas on a cost-plus pricing basis to urban gas networks, which in turn supply residential and commercial customers as well and the transport sector. For gas-powered vehicles, the price of natural gas is set relative to diesel specifically in order to incentivize adoption 45. Complementary policies have also been adopted to target the penetration of gas in sub-sectors of the economy, including targets to increase residential connections to gas and convert commercial coal boilers to gas 46. In the power sector, successive five year plans have promoted the expansion of gas-fired capacity including the latest targeting an incremental 44GW of capacity.
Underpinning the Chinese government support for gas sector development has been a general emphasis on the role of gas for improving sustainability. Given that coal
44 Cedigaz 45 University of Texas Energy Institute46 JP Morgan analyst report
64
2012
15
4945
15
2011
60
86
2013
63
23
2014
70
99
29
108
38
2015
70
41
98
2016
139
+18%
LNG regassification
Pipeline import
Diversified pipeline supply from Russia, Turkmenistan, and Myanmar
107
132
148
169
184190
20122011 2013 2014 2015 20162010
+12.1%
Import capacity (bcma)
Gas consumption (bcm)
Source: CEDIGAZ data (Terminals and Plants), IEA data (Consumption by Fuel), analyst reports, expert interviews, BCG analysis

Global gas report 2017 32
+7bcm
+10bcm
+7bcm
+13bcm
+16bcm
+37bcm23 (22%)
29 (27%)
13 (13%)
18 (17%)
8 (8%)
14 (13%)
2010
107
Other
Transport
Power Production
Energy use
Comm & Res
Industry50 (27%)
45 (25%)
26 (14%)
25 (14%)
18 (10%)
21 (11%)
2014
184
constitutes more than two thirds of total energy consumption and China's major coastal cities have chronically high urban air pollution, gas has been positioned as a means for reducing localized air pollution. This provides the rationale for promoting gas for cities within domestic policy, in particular. Given that gas prices in China are carefully regulated, it is a fine balancing act between setting a price that is low enough to encourage consumption growth while also high enough to incentivize domestic production. To do that the Chinese government has opted to price gas partially on the basis of oil substitutes, which has resulted in the domestic price being slow to respond to global or regional shifts in gas-on-gas pricing. This indicates that even when a government supports growing the share of gas, there can be challenges involved.
India
Unlike China, in India gas consumption has steadily declined since 2010 falling from 65bcm to under 52bcm in 2014. A core driver of this has been a regulated price structure that has limited domestic supply availability and subsequently reduced the cost competitiveness.
Under state price controls domestic gas producers are paid based on a basket of global gas price indices, including Henry Hub, NBP, and the Alberta and Russian indices. As the price derived from this basket has declined from $4.2/MMBtu in 2010 to $3.1/MMBtu in 2016, it led Indian producers to cut back their production levels from 52bcm in 2010 to 30 bcm in 2016, even though gas reserves grew over the same period47.
As the availability of low cost domestic gas production declined, consumption in India became more reliant on costly LNG imports over that period. This led to a substantial domestic price divergence depending on supply source: whereas consumers of domestically produced gas paid $4/MMBtu or less, consumers of LNG paid more than $10/MMBtu in the 2012-14 period48. This discrepancy was sustained because of the regulated pricing structure which provided preferential access to domestically
Multiple policies supporting gas consumption are in place
Coal boiler conversion to gas• Target conversion of 200k coal boiler units to natural gas
New residential connections• Target to increase penetration from 35% to 85%, adding >120m new
connections
Incentives for CNG/LNG for transport• Discounts provided on prices in gas price formula• Gas consumption of cars targeted to more than double • from 2014 to 2020
New 5 year plan prioritizing gas power• Targeting 44GW of new gas-fired capacity...• ... Though also targeting 200GW of new coal capacity
Source: CEDIGAZ data (Terminals and Plants), IEA data (Natural gas balance), analyst reports, BCG analysis.
Gas consumption
(%)
47 CERC48 Indian Government report – "Pricing
of Natural Gas"

Global gas report 2017 33
produced gas to "city gas distribution" users (residential, commercial, and transport sectors) as well as certain industries, whereas power generation and other sectors were exposed to the LNG-based price for gas.
In 2016 a combination of lower LNG import prices and pricing reforms helped to reverse the trend of declining consumption for the first time in five years. Central to this reform was a restructuring in the basket price for natural gas use in the industrial sector. Specifically, the government moved toward a pooled price of domestic and LNG import prices, reducing the price of gas for industry from $9/MMBtu to $6.2/MMBtu. However, counterbalancing the price decline in the industrial sector was an increase in the price of gas for the power sector. This further reduced consumption in the sector, which had already fallen by half from 2010 to 2015. Looking forward, the government aspires to double the share of natural gas for the purpose of improving sustainability. City gas distribution in particular has been promoted by the Modi government as a means of reducing urban air pollution and expanding access to energy. However, it remains to be seen if the necessary regulatory structures will be put in place to achieve that objective.
0
100
200
Gas production
2010/2011 2011/2012 2012/2013 2013/2014 2014/2015 2015/2016
2010/2011 2011/2012 2012/2013 2013/2014 2014/2015 2015/2016
-11%
1,81,82,3
2,3
2,3 2,3
4,2
4,2 4,2 4,2 4,4 4,7
3,12,52,5 2,5
2,5
2,53,7
14,6 14,2
0
5
10
15
2004 2006 2008 2010 2012 2014 2016
6.8
$/ MMBtu
5.1
9.1
7.7
6.5
Domestic gas LNG 0
100
200
Gas consumption
-6%
MSm3/d
MSm3/d
Regulated pricing structure for domestic gas production
Middle East
As the largest exporting region for natural gas, the Middle East has substantial supply availability and highly cost competitive gas supplies. Relative to other fuels, gas provides a high degree of supply security vs. coal given there is practically no production in the region. Compared with oil, gas is significantly lower cost on an energy basis.
This combination of supply availability and competitive prices has resulted in high levels of gas penetration in the region. Qatar leads the way in this regard given it has a gas production cost of ~$1/MMBtu, among the lowest costs globally. Even in other countries where gas production is more expensive though, consumption is high. Across the Persian Gulf for example, gas typically contributes more than 70% of domestic energy needs. The region is also promoting an ongoing switch from the use of oil to gas across power and industry sectors. In the last five years only in the UAE has oil grown in share given the ongoing development of the aviation and marine sectors (which rely heavily on oil products).
Beyond market-led fuel switching, government policies in the region are driving greater gas
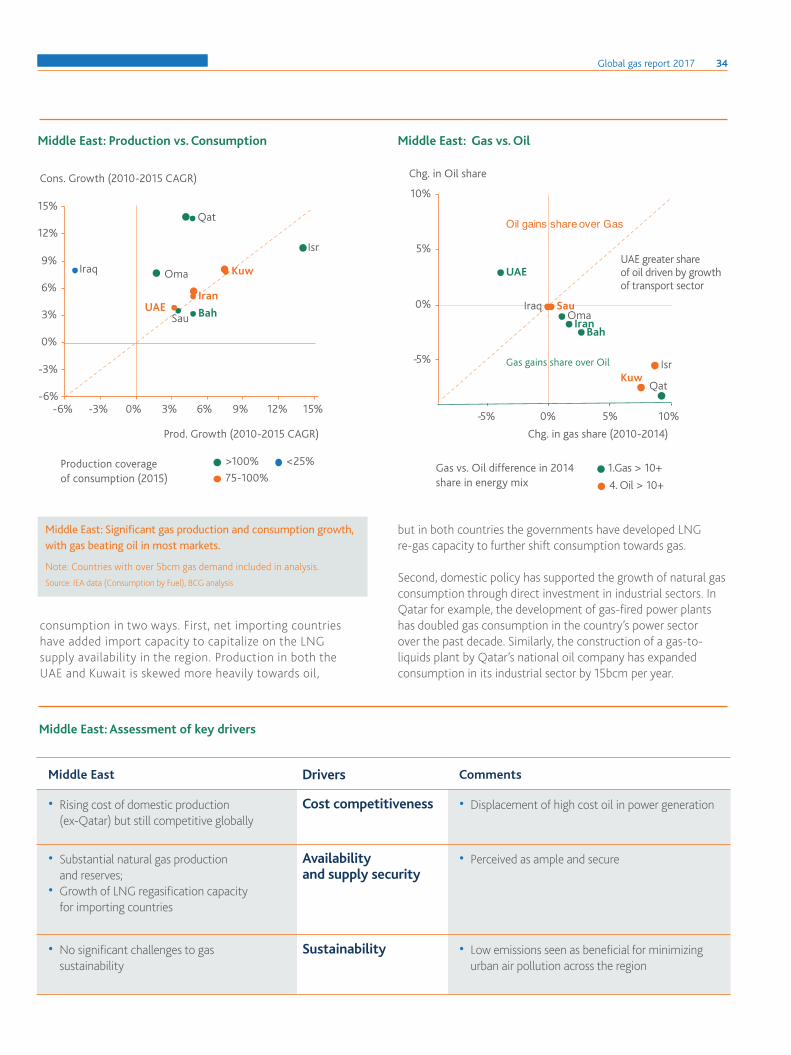
Global gas report 2017 34
5%
10%
-5%
-5% 10%5%0%
0%
Chg. in gas share (2010-2014)
Iran
Sau
UAE
Chg. in Oil share
Oma
Kuw
Bah
Isr
Iraq
4. Oil > 10+
1.Gas > 10+
Oil gains share over Gas
Gas vs. Oil difference in 2014share in energy mix
Gas gains share over Oil
-6%
-3%
0%
3%
6%
9%
12%
15%
-6% -3% 0% 3% 6% 9% 12% 15%
Qat
Kuw
Cons. Growth (2010-2015 CAGR)
Prod. Growth (2010-2015 CAGR)
Bah
Oma
Sau
IranUAE
Iraq
<25%>100%
75-100%Production coverageof consumption (2015)
Qat
Isr
UAE greater share of oil driven by growth of transport sector
Middle East: Production vs. Consumption Middle East: Gas vs. Oil
Middle East: Significant gas production and consumption growth, with gas beating oil in most markets.
Note: Countries with over 5bcm gas demand included in analysis.Source: IEA data (Consumption by Fuel), BCG analysis
Middle East: Assessment of key drivers
Middle East Drivers Comments
• Rising cost of domestic production (ex-Qatar) but still competitive globally
Cost competitiveness • Displacement of high cost oil in power generation
• Substantial natural gas production and reserves;
• Growth of LNG regasification capacity for importing countries
Availability and supply security
• Perceived as ample and secure
• No significant challenges to gas sustainability
Sustainability • Low emissions seen as beneficial for minimizing urban air pollution across the region
but in both countries the governments have developed LNG re-gas capacity to further shift consumption towards gas.
Second, domestic policy has supported the growth of natural gas consumption through direct investment in industrial sectors. In Qatar for example, the development of gas-fired power plants has doubled gas consumption in the country’s power sector over the past decade. Similarly, the construction of a gas-to-liquids plant by Qatar’s national oil company has expanded consumption in its industrial sector by 15bcm per year.
consumption in two ways. First, net importing countries have added import capacity to capitalize on the LNG supply availability in the region. Production in both the UAE and Kuwait is skewed more heavily towards oil,

Global gas report 2017 35
The following segment looks at the key drivers of gas consumption growth in the light of 2016 data, indentifies continuing barriers and describes some initiatives that the industry and policymakers can adopt to overcome them.
1. Cost competitiveness vs. other fuels
Recent evolution and 2016 trends: • Reduction in global LNG prices
Ongoing challenges: • Cost competitiveness vs. coal in Asia
and Europe
Key enablers: • Innovation and technology investment
to reduce costs through the LNG supply chain
• Carbon pricing• Scale and cost reduction for new gas
use technologies (e.g. shipping)
• Policy support for gas consumption
The Cost competitiveness of gas in relation to coal is improving generally due to wider availability and lower cost of LNG spot cargos. However, a gap remains, of $2/MMBtu in Europe and Asia. The evolution of gas prices relative to coal will be particularly important in Asia where LNG is the most expensive globally and where more than 40% of additional gas demand to 2030 is forecast to come from.
To be competitive with coal, a simple levelized cost of electricity analysis suggests gas would need to land consistently in Asia at around $4 to $8 per MMBtu depending on the season – potentially at the lower end of the scale for some countries. With new brownfield capacity additions in the US plus some other markets, spot volumes of LNG are now starting to price in this range. However, this is potentially below capital cost recovery for some of the new major projects, especially in Australia. The sustainability of these prices therefore depends on the evolution of the costs of the LNG supply chain, and in particular liquefaction
The expansion of LNG infrastructure and trade has improved supply security and availability
49 Costs vs. average delivered LNG cargos in 2016, reflecting a blend of different liquefaction economics (i.e. including both US and Australia)
costs, which have seen the greatest inflation. Further efficiencies are therefore needed to continue to reduce LNG costs through the value chain, so that it becomes more competitive and accessible in rapidly developing countries, particularly in Asia. This is critical if LNG is to be price competitive with other fuels. A reduction of between 20% and 30% vs. 2016 prices in the supplied cost of LNG to Asia would make gas competitive with coal on a levelized cost of electricity basis. But to achieve this through LNG cost efficiencies alone would require costs through the LNG value chain to fall by between $1.80 and $2.70 per MMBtu, a substantial and challenging reduction of between 30% and 50% from today’s level49.
The price of carbon will also be a critical factor for determining the competitiveness of gas with relation to coal for power generation and oil in the transport sector or more specifically the policy initiatives which will be adopted to reflect the cost of this externality. This is a strongly debated issue in Europe at the moment. Analysis widely suggests a global carbon price of at least $20/t will be essential to at least enable competition for gas vs. coal.
2. Availability and supply security
Recent evolution and 2016 trends: • Growth in LNG infrastructure and
trade
Ongoing challenges: • Rigidity in LNG contracting• Domestic supply constrains in some
markets
Key enablers: • New technologies for more flexible
LNG supply and re-gasification• Investment in gas supply infrastructure
and gas storage infrastructure• Greater liquidity in LNG trade• Clear government regulation for
upstream gas development • Domestic gas transmission and
distribution investment
The future path of natural gas6/
-3.6% p.a. 30-50% REDUCTION IN CAPITAL COSTS TO COMPETE WITH ASIAN COAL
LNG efficiency
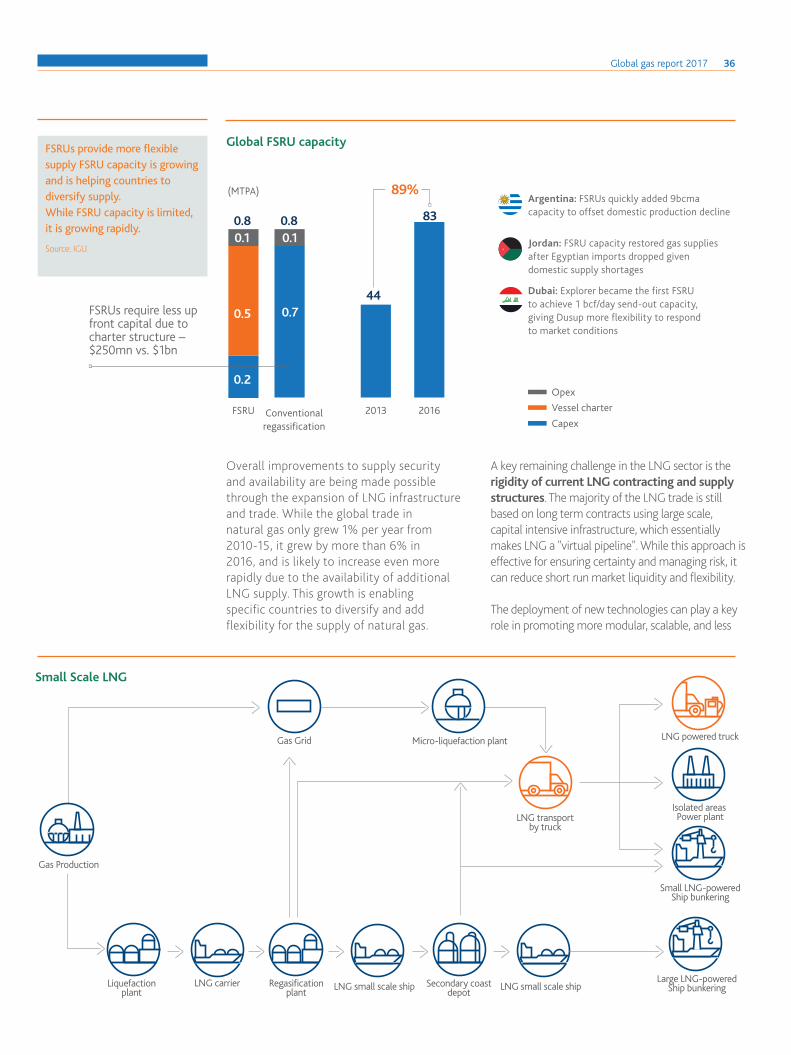
Global gas report 2017 36
Overall improvements to supply security and availability are being made possible through the expansion of LNG infrastructure and trade. While the global trade in natural gas only grew 1% per year from 2010-15, it grew by more than 6% in 2016, and is likely to increase even more rapidly due to the availability of additional LNG supply. This growth is enabling specific countries to diversify and add flexibility for the supply of natural gas.
A key remaining challenge in the LNG sector is the rigidity of current LNG contracting and supply structures. The majority of the LNG trade is still based on long term contracts using large scale, capital intensive infrastructure, which essentially makes LNG a "virtual pipeline". While this approach is effective for ensuring certainty and managing risk, it can reduce short run market liquidity and flexibility.
The deployment of new technologies can play a key role in promoting more modular, scalable, and less
Global FSRU capacity
89%
2013 2016
0.80.1 0.1
0.70.5
0.2
0.8
44
83
FSRU Conventionalregassification
Argentina: FSRUs quickly added 9bcma capacity to offset domestic production decline
Jordan: FSRU capacity restored gas supplies after Egyptian imports dropped given domestic supply shortages
Dubai: Explorer became the first FSRU to achieve 1 bcf/day send-out capacity, giving Dusup more flexibility to respond to market conditions
Capex
Opex
Vessel charter
FSRUs require less up front capital due to charter structure – $250mn vs. $1bn
(MTPA)
FSRUs provide more flexible supply FSRU capacity is growing and is helping countries to diversify supply.While FSRU capacity is limited, it is growing rapidly.
Source: IGU.
Micro-liquefaction plant
Gas Production
LNG carrier
Gas Grid
LNG transportby truck
Isolated areas Power plant
Secondary coastdepot
Regasificationplant
Liquefactionplant
Small LNG-poweredShip bunkering
Large LNG-poweredShip bunkering
LNG powered truck
LNG small scale shipLNG small scale ship
Small Scale LNG

Global gas report 2017 37
capital intensive means of supplying gas. For LNG regas capacity, the use of FSRU capacity is growing rapidly, nearly doubling from 2013-16. In Argentina for example, FSRU capacity was deployed to supply small pockets of demand in a more modular way: while domestic production declined, FSRU capacity has added over 9bcm of gas supply per year. Globally FSRU capacity remains limited.
For LNG supply, floating liquefaction is emerging as a means of accessing remote and stranded assets. The first major FLNG projects are coming online in 2017, including Satu in Malaysia, Prelude in Australia. However, both have been high cost (>$10bn each and >$8/MMBtu)50 and large scale, thus applications for smaller projects have yet to be demonstrated. For in-land production, small Scale LNG (SSLNG), both as secondary cost depot and micro-liquefaction plants, have also been developed to support off-grid uses, such as for small power generators and LNG for transport. SSLNG development has been limited in scale to date though. Sustainable domestic upstream development will also be crucial to increase consumption. Given that 70% of the total gas consumed worldwide is still produced within the country where it is consumed, local production is critical. Across the IEA and other forecasts a central assumption is that new and more widely distributed supply sources will emerge, particularly through the global expansion of unconventional gas.To enable localized domestic production growth, clear government regulatory structures are essential. New markets for natural gas production – such as in Africa – frequently lack clear fiscal regimes and clear regulations for upstream gas development. Furthermore, many countries have regulated
price structures which can limit incentives for gas production. Lastly, sustained investment in domestic gas networks is essential for continuing to expand access to gas in cities and across different economic sectors. This will be essential to sustain growth in Asia and Latin America, where domestic gas infrastructure is not as extensively developed as in Europe and North America. In India for example, it is projected that domestic transmission capacity will need to increase by over 60% (from 16k km to over 26k km) by 2020 to make gas available to additional cities51.
3. Sustainability
Recent evolution: • Development of new technology pathways to reduce
greenhouse gas emissions from gas
Ongoing challenges: • Methane fugitive emissions
Key enablers: • Investment to reduce methane losses through the supply chain• Technology development for long term de-carbonization of gas.
In both the near term and long term, the challenge of climate change necessitates that greenhouse gas emissions are reduced throughout the gas value chain. In the near term as gas scales up, a major challenge is limiting fugitive emissions of methane. In the longer term though, the imperative will be to transition the full gas value chain towards near zero emissions.
US: Federal and state governments have issued new regulations requiring specific interventions to reduce methane emissions from the gas sector
Canada: Alberta to implement a methane emissions target and regulation in 2017; national and other Provincial governments also considering targets
EU: European Commission reviewing targets and approaches for regulating methane emissions Concern over fugitive emissions have contributed to rejection of shale gas development
7.3
2.2
1.21.9
4.2
9.3
1.30.9
0.50.9
+18%
16.1
2013 estimatedemissions
2015 estimated emissions
(revised methodology)
13.6
Processing (-2%)Distribution (-47%)
Production & gathering (+125%)
Transmission & storage (-65%)
Natural gas & petroleum systems (+27%)
Updated based on more current studies of actual emissions
EPA estimated methane emissions from natural gas systems (MMT CH4)Fugitive methane emissions are a growing concern.Methane is 28x more potent of a greenhouse gas then CO
2.
US EPA updated methodology increased its fugitive emissions estimate.Regulatory and political pressures are growing: the natural gas industry must address fugitive emissions to maintain the environmental credentials of gas.
Source: US EPA, press searches, BCG analysis
50 MIT study – "An economic analysis of Floating LNG"; figures specific to Prelude LNG
51 GAIL
Global gas report 2017 38
Methane leakage
The potential leakage of methane from the production and supply of natural gas is a growing concern in North America and Europe. Following new studies in North America that indicated so called "fugitive emissions" were greater than previously expected, multiple governments have moved to regulate them more directly. This is due to the fact that methane, when released without combustion, is 28 times 52 more potent of a greenhouse gas than carbon dioxide. To fully realize the environmental benefits of natural gas, the industry must take clear and consistent action to limit fugitive emissions in the near term. This will matter in part for regulatory compliance, but also for securing the perception of gas and its role in a national energy mix.
Deep decarbonization of natural gas
To improve the long term sustainability of gas in the energy mix, progress has been made in new technologies to develop a CO2 neutral (or even negative) renewable gas (biomethane), to explore the use of synthetic natural gas as storage for other intermittent renewables (power-to-gas)
and to reduce the emissions of conventional gas further (CCS). This is contributing to the modification of the role of gas - from being a "transition" or "bridge" fuel until an alternative is developed, to a sustainable part of the energy mix, coherently with deep decarbonisation objectives (see appendix for further details).
While these technologies have been demonstrated, there is not a clear track record of scaling them up or deploying them on a widespread basis. The most significant challenge to all of them is cost, namely making them cost competitive with conventional technologies. As carbon pricing is instituted more widely and the cost of these new technologies likely declines going forward, they may emerge as more viable commercial pathways to the decarbonization of the gas industry.
The role of gas is changing, from being a "transition" fuel to a sustainable part of the energy mix
52 IPCC characterization factors from 5th Assessment Report

Global gas report 2017 39
Over the next five years, rapid growth in LNG exports from the US combined with the completion of several gas ‘mega’ projects in the Asian region will result in a significant increase in the global supply of LNG. With greater flexibility of supply sources and the likelihood of sustained low gas prices, the industry has an opportunity, during this period, to implement actions which will support the growth potential of natural gas.
As this report demonstrates, a sustained focus is required on three fronts for gas growth to fulfill expectations:
• First, through technology improvements and policies to improve the cost competitiveness of gas
• second, through infrastructure and market improvements to expand gas accessibility and security of supply; and
• third, through investment in technology to improve the sustainability of gas in the near term and to de-carbonize the sector in the long term.
Conclusion

Global gas report 2017 40
Global gas fact base Appendix/Natural gas: a market in transition
Over the past four decades the role of natural gas in the global energy mix has been transformed.
Until the 1990s, gas supplied a marginal share of global energy requirements because it was a local market (84% of gas was consumed in the same country where it was produced), concentrated in just a few regions (80% of consumption was in North America, Europe, and CIS countries) and where applications were largely limited to the residential and commercial sectors53. Elsewhere in the world gas was often seen as a byproduct from upstream oil production, available and used where oil projects were developed.
The development of new technologies and applications for natural gas changed the role
of gas from the 1990s on. Rapid growth of Liquefied Natural Gas (LNG) – which allows gas to be liquefied, transported on ships and regasified where it is needed - opened new trade routes and diversified supply sources. For power generation, the development of combined cycle gas turbine (CCGT) plants significantly improved fuel efficiency and lowered costs for operators. In that period gas also increasingly became recognized as a means to diversify energy supplies and reduce pollution, leading to more widespread use in developing countries.
Availability and supply of natural gas
• Global technically recoverable reserves would provide more than 200 years of supply at current production rates, while proved gas reserves would last for 53 years54.
North America
Latin America Africa Middle East Asia Oceania
Europe CIS
13.3
3.30.90.2
53.3
0.6
7.80.2
14.40.2
79.9
15.50.6
0.5
ReservesProduction
Natural gas 2015 proven reserves and production by region (TCM)
53 IEA 54 "Proved" reserves defined as commercially
recoverable with current economics; IEA data
At current production rates, global recoverable reserves would provide more than 200 years of supply
Gas reserves are concentrated in Middle East and CIS, while production is widely distributed globally.
Note: Data current for 2015.
Source: IEA, Cedigaz, BCG analysis.

Global gas report 2017 41
North America
Latin America Africa Middle East Asia Oceania
Europe CIS
13.3
3.30.90.2
53.3
0.6
7.80.2
14.40.2
79.9
15.50.6
0.5
ReservesProduction
• Global gas reserves are concentrated with two regions accounting for more than 70% (the Middle East – particularly Iran and Qatar – and CIS – Russia; these regions tend to produce significantly more gas than they consume, resulting in substantial export supply 55).
• Nonetheless production of natural gas is widespread. More than 70 countries produce at least 1 billion cubic meters of natural gas year per year. While the two largest producing countries (US and Russia) account for 39% of global gas production, no other country individually produces more than 6% of global gas supply56 .
• The US is by far the leader in unconventional gas reserves and production. Over two thirds of proved reserves (6.5tcm) in the US are from unconventional sources, while 75% of US gas production is from unconventional sources. Of that shale gas is the leading source, comprising 55% of total US gas production (>420bcma)57. Shale gas is
natural gas that is found trapped within shale formations and its commercial development is relatively recent: in 2000 shale gas provided only 1% of U.S. natural gas production, and the US government's Energy Information Administration predicts that by 2035, 46% of the United States' natural gas supply will come from shale gas.
• Outside of the US, Canada has the largest proved unconventional gas reserves (1.5tcm) and produces 96bcma, of which 70bcma is from shale sources. Australia leads in the production of coalbed methane, a form of unconventional gas trapped in coal seams (27bcma). In non-OECD countries China is the leader in unconventional resources with 0.7tcm of reserves and 40bcma production, while Argentina follows producing 28bcma58.
Natural gas infrastructure and trade
• Around the world the trade in natural gas is still predominately local in nature. Approximately
North America
Pipeline LNG
Pipeline LNG Pipeline LNG Pipeline LNG Pipeline LNG
Pipeline LNG Pipeline LNG
Latin America Africa Middle East Asia Oceania
Europe CIS
23127
297297
1,342
1,677
6235
13110
416
0
38273838 141045312829
1384343
6331839043
ExportImport
Natural gas import & export capacity by region 2016 (bcma)
55 Cedigaz56 IEA57 Rystad – refers to gross production58 Rystad
PRODUCE 39% OF GLOBAL GAS PRODUCTION
US and Russia
Natural gas infrastructure ishighly concentrated in Europe,North America, and Asia.
Note: Data current for 2015.
Source: IEA, Cedigaz, BCG analysis.

Global gas report 2017 42
70% of all natural gas consumed globally is produced in the same country as where it is consumed, while 30% is traded.
• Of the gas that is traded internationally, 69% is transported via pipeline, while 31% is transported via LNG.
• Existing pipeline capacity and trade is largely concentrated in the established gas markets of Europe and North America. More than two-thirds of global cross-border pipeline capacity is concentrated in Europe, both providing imports from CIS countries and North Africa and providing intra-regional connections. A further 12% of capacity connects the North American markets of Canada, Mexico, and the US.
• Global liquefaction capacity is 466bcma. Qatar has the greatest liquefaction capacity, at 107 billion cubic meters per annum; followed by Australia, with 90bcma. A further 10 countries each have between 10 and 40bcma of capacity59.
• Global regasification capacity is greater than 1,100bcma. There are over 30 countries with LNG re-gasification capacity, spread across Europe, Asia, Latin America, and the
Middle East. Japan (262bcma) and South Korea (155bcma) are global leaders for LNG regasification given they have limited domestic resources and no pipeline connections60.
• US regasification capacity is the second largest globally, at 194bcma. However, due to the increase in gas production since 2009 this re-gasification capacity is not being used, and a material portion of it is due to be re-developed into liquefaction facilities to support LNG exports.
• Natural gas logistics infrastructure economics vary according to capacity and distance. Pipeline transport is lowest cost for short distances given that capex is driven predominately by the distance traveled. For LNG, given the high upfront capex for liquefaction it is only cost effective over longer distances of travel. The breakeven between pipeline and LNG projects tends to be around 4,000 miles.
• Natural gas storage infrastructure is largely located in Europe, CIS, and North America (94% of all capacity). In these markets storage amounts to between 16-23% of total consumption and plays a critical role in balancing seasonal variability. Meanwhile,
3,000 to5,000 miles
Liqu
efac
tion
cost
s
Distance (miles)
Landed gas cost ($/MMBtu)
Accumulated cost capex
Accumulated cost capex and opex
Onshore HighPressure Pipeline
LNG
59 Cedigaz60 Cedigaz
4,000 miles is the average breakeven distance between choosing pipeline and LNG transportOptimal breakeven range is determined by a mix of:• Natural gas price• Volume of gas being transported• Distance• Carbon pricing• Material and construction costs• Geography• Political Risk
Pipeline is most efficient way to transport gas:• Large volumes over shorter distances LNG transport is best for:• Small to medium volumes over longer distances• Moving stranded gas to distant markets
Pipeline vs. LNG: Pipelines are lower initial cost, but beyond 3,000-5,000 miles LNG is more efficient for transport.
Note: Illustrative, not to scale.
Natural gas infrastructure costs

Global gas report 2017 43
the share of underground storage in Asian and Latin American emerging markets is less than 2% of consumption. This discrepancy between regions is a result of several factors including greater seasonality of consumption in the Northern Hemisphere, a longer track record for the industry, and a larger scale of depleted gas reservoirs available for storage.
Natural gas prices
• Through 2016 natural gas prices were between 20% and 66% lower than oil on a per energy unit basis, depending on the region. Compared with coal, gas prices ranged from a premium of 50% (US) to more than 90% in Europe and Asia61. Average 2016 gas prices were:
• $2.6/MMBtu in the US (Henry Hub) • $5.0/MMBtu Europe (NBP)• $5.6/MMBtu Asia (NEA spot)
• Although LNG only accounts for about one-tenth of global gas supply, it plays a fundamental role in determining the gas price that end users pay in markets where it is the marginal source of supply such as Asia.
6.0
4.5
3.0
1.5
0.0
US($)/MMBtu
Yamal LNG
US LNGNigeria LNG
N. Africa/Caspian pipeline
Qatar LNG
Yamal pipeline
Norwegian pipeline
Current NBP
2017 NBP futures
0
4
5
8
1211
16
US($)/MMBtu
Spiking
ShippingLiquefaction
LNG Shipping(Incl.Panama Toll)
$13–14/mcf
$11–13/mcf$11–13/mcf
$11–12/mcf$10–12/mcf
$5–6/mcf
Liquefaction�Capital Cost�
Range
Gathering &�Pipeline
Upstream �supply�cost
East Africa (Mozambique (Conventional)
Greenfield)
West Coast Canada
(Montney) (Greenfield)
Western Australia
(Conventional) (Off-shore) (Greenfield
UB Gulf coast
(Haynesvile) (Brownfield)
QatarEastern Australia
(Coal seam gas)
Marginal cost of gas supply to Europe
61 Bloomberg
Key storage characteristics
Factor Salt cavity Depleted field Aquifer LNG
Main usage • Multi cycle • Limited multi cycle• Seasonal• Strategic
• Seasonal• Strategic
• Peak shaving• System support
Advantage • High injection and withdrawal rates
• Low cushion gas• Phased development
• Existing and understood• Relatively low cost• Large capacity
• Large capacity • Very high rates of deliverability
Disadvantages • Small volume in individual cavern
• Brine disposal• Subject to convergence• Higher operating cost
• High Cushion gas requirement
• Slow injection and withdrawal rates
• High cost• Extended
development time• Potential environmental
objections
• High cost• Low capacity• Greater safety exposure
Working capacity mcm • 500 • 500 • 500 • 32
Deliverability mcm/d • 23.8 • 7.2 • 5.4 • 5.0
Cushion gas requirements • 20% of total capacity • 45% of total capacity • 55% of total capacity • “Heel” of around
5–10%
Cycle rates • 6.9 • 2.1 • 1.6 • n/a
Source: Oxford Institute for Energy Studies

Global gas report 2017 44
Applications for the use of natural gas
Power generation accounts for 37% of global gas consumption. However, the use of gas to produce power varies by market, from 98% in UAE to over 30% in OECD Asia (Japan and South Korea), 23% in the US, and 16% in OECD Europe. 8% in non-OECD Asia, India (4%) and China (2%)62.
Commercial and residential uses account for 21% of global gas consumption. Demand in this segment is driven mainly by customers in OECD markets which have well developed grid infrastructure for distributing gas to meet the high demand swing required to cover cold peaks (60% above average demand).
Industrial uses comprise the third largest source of consumption, at 20% globally. This is the fastest growing segment, with demand increasing by an average of 2.5% a year over the past five years up to 2015. Consumption is greatest in non-OECD markets, particularly countries which rely on gas to power manufacturing processes, due to limited electrification, or use natural gas as a feedstock in fertilizer and petrochemicals production.
World gas demand growth by sector
Energy industry own use: Around 10% of global natural gas is consumed within the energy sector. This includes the operation of oil and gas assets, refining, and mining activities.
Transportation accounts for just 3% of global consumption. Oil products are the largest source of supply in this sector (95%) given their highly energy dense nature and longstanding use. Specific trends in gas for transport are assessed in the following section.
Gas penetration remains highly divergent
Gas accounts for 21% of global energy requirements, the third most widely used fuel after oil and coal. The highest rates of gas penetration occur in traditional gas-producing regions, namely the Middle East and CIS countries, followed by OECD countries. The share of gas in the energy mix remains low in Asia ex-Japan, especially in China and India (5%), where coal is the most used fuel.
Power generation and industry hold the key to global gas demand growth.
Note:1. Other includes agriculture and any other non-energy use 2. Industry includes gas used as petrochemical feedstocks, and energy consumption in coke ovens and blast furnaces.
Source: IEA.
20402014
TCM
Industry2Buildings PowerTransportOther1
World gas demand growth by sector
1.4 2.4
1.5
0.3
1.0
0.5
0.8
0.80.10.4
0.6
0.6
0.30.2 0.1
Gas accounts for 21% of global energy requirements, the third most widely used fuel after oil and coal
62 IEA

Global gas report 2017 45
Environmental characteristics of natural gas
• Utilizing natural gas generates less than half the greenhouse gas (GHG) emissions on a per energy unit basis than coal and one-third fewer emissions than crude oil 63.
• Natural gas produces virtually no sulphur dioxide and very low nitrogen dioxide emissions, which are contributors to acid rain. Furthermore, it
emits almost zero airborne fine particulate matter (PM 2.5), which contributes to soot pollution and is linked to a range of human respiratory health problems.
• Natural gas is complementary to renewables in the power generation sector, considering that gas-fired power plants can be quickly brought online, helping to balance intermittency of some renewables. For example, new CCGT plants can be brought online in under 30 minutes.
World 21%
25%
28%
22%
22%
19%
14%
5%
5%
8%
22%
51%
49%
OECD Total
US
OECD Europe
OECD Asia
Non-OECD Total
Africa
Latin America
Middle East
Eastern Europe / Eurasia
ChinaChina, India and non-OECD Asiawith the lowest penetration to dateIndia
Non-OECD Asia
Significant divergence in OECD/non-OECD markets for gas consumption as the share of energy mix.
Source: IEA 2016 World Energy Outlook Data, BCG analysis.
Share of gas in the energy mix (%) – 2014
63 Includes all greenhouse gasses during combustion not just CO
2, e.g. NOx
223 163 117
lb Co2 / MMBTU
Coal Oil Natural Gas
Coal Oil Natural Gas
lb Co2 / MMBTU
Burning 1 unit of
lb Co2 / MMBTU
223 163 117
lb Co2 / MMBtu
Coal Oil Natural Gas
Coal Oil Natural Gas
lb Co2 / MMBtu
Burning 1 unit of
lb Co2 / MMBtu
Carbon content for different fossil fuelsNatural gas with the lowest carbon per energy content of all fossil fuels.Of the three fossil fuels (coal, oil, and naturals gas)• Coal has the highest carbon
intensity.• Natural gas has the lowest
carbon intensity. Note: Carbon intensity of fuel is the amount of carbon dioxide (CO2) emitted for each unit of energy produced.Coal's CO2 emissions figure is an average of Anthracite, Bituminous, Subbituminous, Lignite, and Coke. OIl CO2 emissions figure is an average of Propane, Butane, Home Heating and Diesel Fuel, Kerosene, Gasoline, Residual Heating Fuel, Jet Fuel, Aviation Gas, and Petroleum coke.
Source: EIA.

Global gas report 2017 46
Biogas Plant
Electrolysis Methanation
Dung High Quality Manure
Crops CHP
H2
H2 CH4
Natural gas grid
Industrial use Mobility Electricitygeneration
Heat supply
Gas storage
H2
Upgrading
BiomethaneElectricityHeating
Fluctuating electricity generationfrom renewable energy sources
GasNetwork Fuel
District Electric Network
Biogas
New technologies for improving the sustainability of gas
Biogas and Biomethane
Biomethane is a potentially efficient path to decarbonising the power sector as it is programmable and storable, and can exploit existing transport, storage and power generation infrastructure.
Biomethane reduces CO2 emissions to neutrality or potentially even reaches negative emissions because it utilizes feedstock that would have otherwise released methane into the atmosphere, and its use is compatible with CCS (see below). The V UNFCCC Report on ClimateChange has emphasized the potential role that the capture of biogenic CO2 could have in the long run as a carbon negative measure (BECCS - Bioenergy with carbon capture and storage).
Biogas is produced via the biological breakdown of organic material (including urban and agricultural waste and animal biomass). This can then be upgraded to biomethane by removing CO2 through a number of methods. The resulting fuel is almost identical to fossil-derived natural gas and can be used interchangeably.
Biomethane is still at an early stage of development, although biogas plants have seen strong growth in Europe, driven by favourable policy environments in Italy, Sweden and Germany. Early estimates for its potential availability, using assumptions coherent with the protection of the food supply chain range, suggest the technology could have a material impact on supply dynamics. For example, in Italy the potential production of biomethane is up to 8bcma by 2030.
The cost structure of biomethane is currently not competitive with fossil-derived natural gas, but may be competitive with solar and wind renewables when considering the cost of intermittency/storage64. Potential avenues for cost reduction of biomethane production include the introduction of substainable cover crops feedstock, the increasing production from by-products and sewage, the standardization of anaerobic digestion plants and the development of new technologies for small size upgrading plants65.
The cost structure of biomethane may be competitive with solar and wind renewables when considering the cost of intermittency
64 http://www.neon-energie.de/Hirth-Ueckerdt-Edenhofer-2015-Integration-Costs-Revisited-Framework-Wind-Solar-Variability.pdf
65 https://www.consorziobiogas.it/wp-content/uploads/2017/05/LA-BIOGAS-REFINERY-ENG-2017-FINAL.pdf
Biogas and biomethane

Global gas report 2017 47
Biogas Plant
Electrolysis Methanation
Dung High Quality Manure
Crops CHP
H2
H2 CH4
Natural gas grid
Industrial use Mobility Electricitygeneration
Heat supply
Gas storage
H2
Upgrading
BiomethaneElectricityHeating
Fluctuating electricity generationfrom renewable energy sources
GasNetwork Fuel
District Electric Network
Biogas
Power to gas
This technology envisages using synthetic gas to store excess electricity production from intermittent renewable sources such as wind and solar.
The process involves the use of electricity surpluses to split water into hydrogen and oxygen. Hydrogen can then be combined with carbon dioxide to convert the two gases to methane. The methane may then be fed into the natural gas grid and storage facilities.
Power-to-gas may be integrated in the process to upgrade biogas into biomethane, which results in surplus CO2 which can be mixed with the hydrogen produced through electrolysis.
Carbon Capture and Storage
Carbon capture and storage (CCS) has long been considered a potential solution to emissions from all fossil fuels. The technology is relatively simple in concept, entailing the capture of greenhouse gas emissions from a point source and long term storage in underground reservoirs
However, the applied demonstration of the technology has been slow and difficult to achieve on a material scale. Currently there are 15 operational projects globally processing 30MnT/CO2 per year, but this is a small portion of the potential that would be required for material mitigation impact.
Ultimately cost would need to come down by about half to make this technology competitive; whereas costs are presently $60-70/t of CO2 for CCS, they would need to be in the order of $20-30/t to be competitive with other abatement approaches66.
There are also some constraints with the availability of storage structures and the fact that offshore locations are more socially acceptable.
Power-To-Gas
66 CCS Institute

Snam, a European leader in the construction and integrated management of natural gas infrastructure, operates and develops Europe’s largest, most accessible pipeline network (more than 40,000 km), the largest storage infrastructure (19bcm capacity) and one of the first LNG terminals built in Europe. Its investments aim to facilitate the European Energy Union network integration and to promote natural gas as a key pillar of a sustainable energy mix. With its 3,000 people, Snam is active in natural gas transportation, storage and regasification. It also operates, through associated companies, in Austria (TAG, GCA), France (TIGF), United Kingdom (Interconnector UK) and is shareholder of the TAP pipeline.
Press OfficeT. +39 02 [email protected]
Investor RelationsT. +39 02 [email protected]
@Snam
www.snam.it
Design: Inarea

