global fixed income focus november 2015 - cdn.ihs.com · 1 global fixed income focus – november...
TRANSCRIPT
1
Global fixed income focus – November 2015 Leveraged loans • Credit default swaps • Global corporate bonds • Sovereigns • Municipal bonds • Securitised products
The very strong US employment report released in early November set the tone globally, with the markets beginning to reposition ahead of the highly anticipated Fed rate increase at the December 16
th meeting. The US dollar was
strengthening throughout the month and US treasury bonds continued to sell-off for most of the month. European markets continued to be largely driven by hopes of additional ECB stimulus in the wake of inconsistent European economic reports for most of November. However, the reality of their decision to add only minor stimulus measures after their early-December meeting led to significant volatility in the rates markets and was a reminder that the market does not like surprises from its monetary policy authorities. Equity market volatility returned to China, as there were multiple days with large price movements in the Shanghai Composite that were reminiscent of this summer. Economic data from China continues to disappoint, as their trade balance report released in early-November indicated declines in both domestic and foreign consumption.
This month’s feature report discusses how combining equity short interest and leveraged loan pricing data can be an effective tool in assessing both markets. We compared short interest data on 71 global loan issuers with public traded equity to over 80 of their outstanding leveraged loans.
The leveraged loan market continued its slide in November, despite a solid performance in the equity market. The Markit iBoxx USD Leveraged Loan index (MiLLi) declined 1.01% during the month, dragging loan performance down 0.02% year-to-date.
European and Japanese CDS sector curves were modestly tighter from the AAA down to the B rated cohort, while North American CDS were slightly wider across all, but the B rated cohort. CCC cohorts were sharply wider across the globe, with only European CDS managing to avoid new one year wides for the rating category.
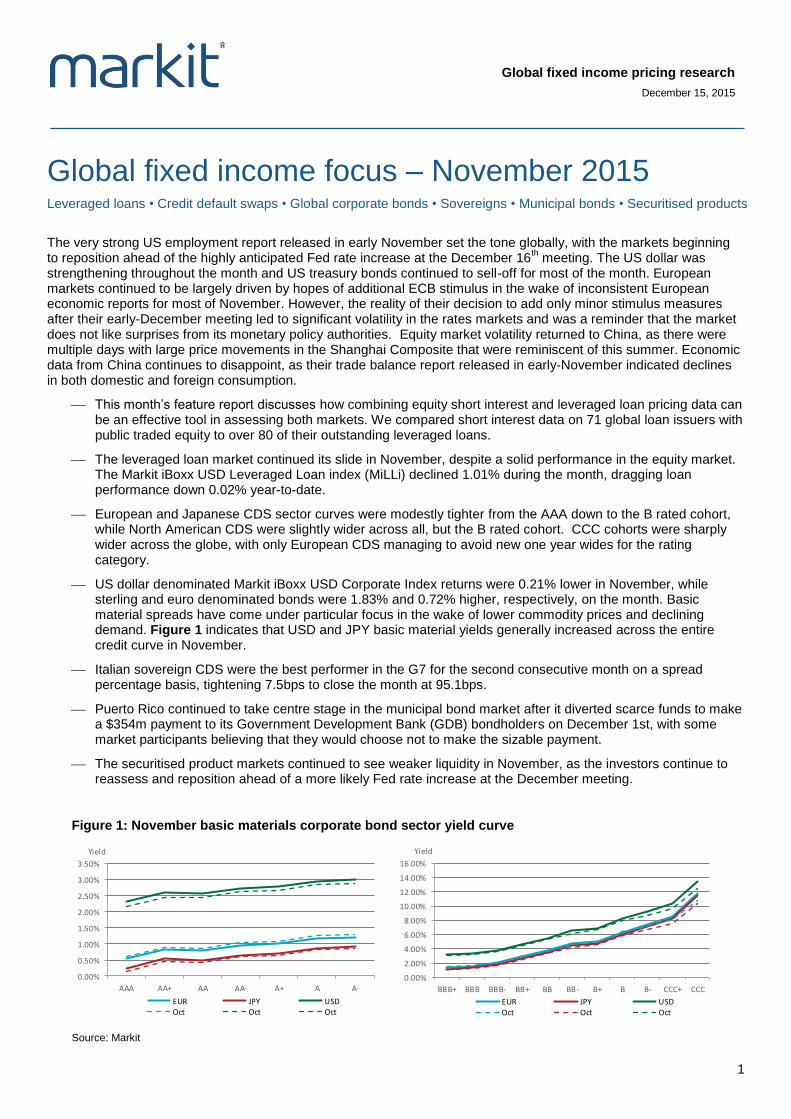
US dollar denominated Markit iBoxx USD Corporate Index returns were 0.21% lower in November, while sterling and euro denominated bonds were 1.83% and 0.72% higher, respectively, on the month. Basic material spreads have come under particular focus in the wake of lower commodity prices and declining demand. Figure 1 indicates that USD and JPY basic material yields generally increased across the entire credit curve in November.
Italian sovereign CDS were the best performer in the G7 for the second consecutive month on a spread percentage basis, tightening 7.5bps to close the month at 95.1bps.
Puerto Rico continued to take centre stage in the municipal bond market after it diverted scarce funds to make a $354m payment to its Government Development Bank (GDB) bondholders on December 1st, with some market participants believing that they would choose not to make the sizable payment.
The securitised product markets continued to see weaker liquidity in November, as the investors continue to reassess and reposition ahead of a more likely Fed rate increase at the December meeting.
Figure 1: November basic materials corporate bond sector yield curve
0.00%
0.50%
1.00%
1.50%
2.00%
2.50%
3.00%
3.50%
AAA AA+ AA AA- A+ A A-
Yield
EUR JPY USDOct Oct Oct
0.00%
2.00%
4.00%
6.00%
8.00%
10.00%
12.00%
14.00%
16.00%
BBB+ BBB BBB- BB+ BB BB- B+ B B- CCC+ CCC
Yield
EUR JPY USDOct Oct Oct
Source: Markit
Global fixed income pricing research
December 15, 2015
Global fixed income pricing research
2
Equity short interest data can be a useful tool for identifying leveraged loan issuer distress
The equity and loan markets trade and are valued very differently, but an effective portfolio or risk manager looks across both markets to identify either relative value opportunities or risks to their current investments. Loan investors tend to spend more time on the intricate details of a company’s balance sheet and leverage, while equity investors are focused mainly on factors that drive growth. Short interest data can be a useful tool when evaluating loan markets, as the herding nature of equity short markets may provide early warning of potential credit deterioration.
Over 20% of leveraged loan issuers have also issued equity, with more than half of those equity issues having at least 1% of their total available shares being lent out to short the equity. Conceptually, increases in short interest could foreshadow a slowdown in the market’s expectations for their growth prospects, leading to deterioration in the issuer’s ability to make leveraged loan debt payments. On the other side of the coin, sharp declines in loan prices would indicate the
market’s perception of deteriorating credit. Further clouding the cause and effect assessment is that leveraged loans are at the very top of the credit spectrum and typically maintain claims above outstanding corporate bonds, so the loan holders can potentially be paid in full despite the equity values going to zero. Leveraged loans are mostly floating rate, so their prices generally are more stable than corporate bonds’ and are not directly impacted by volatility in the treasury or swap markets.
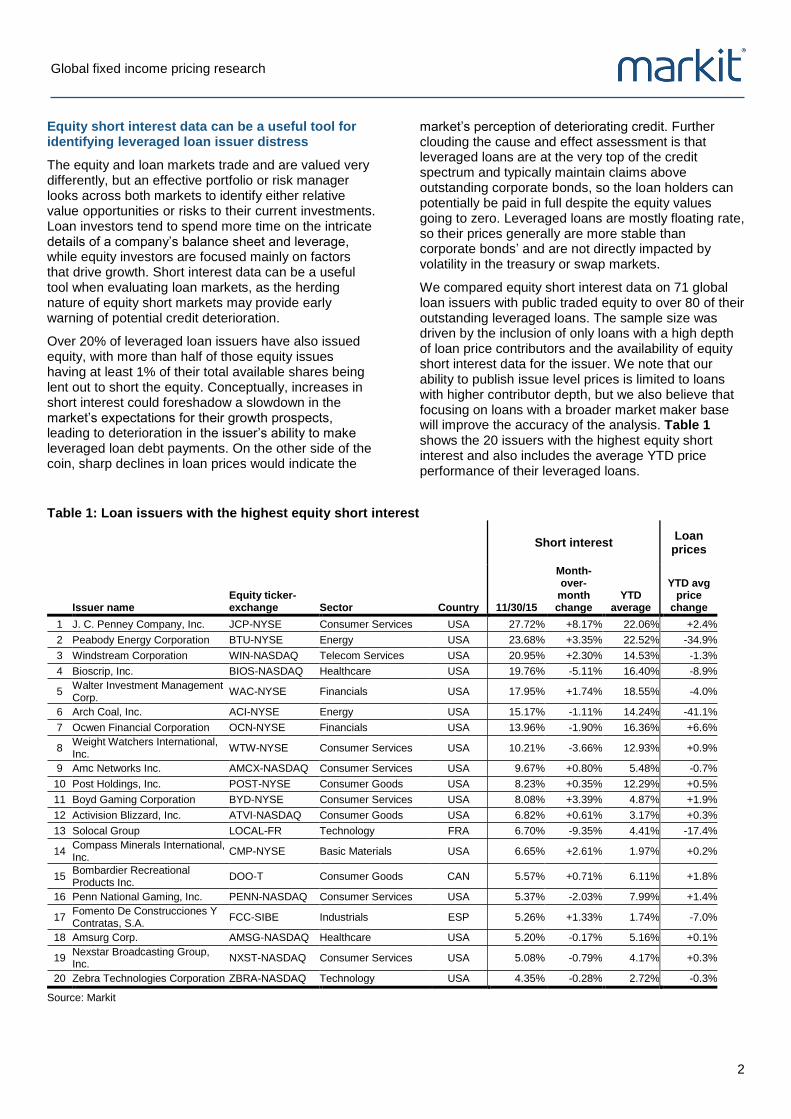
We compared equity short interest data on 71 global loan issuers with public traded equity to over 80 of their outstanding leveraged loans. The sample size was driven by the inclusion of only loans with a high depth of loan price contributors and the availability of equity short interest data for the issuer. We note that our ability to publish issue level prices is limited to loans with higher contributor depth, but we also believe that focusing on loans with a broader market maker base will improve the accuracy of the analysis. Table 1 shows the 20 issuers with the highest equity short interest and also includes the average YTD price performance of their leveraged loans.
Table 1: Loan issuers with the highest equity short interest
Short interest Loan
prices
Issuer name
Equity ticker-exchange Sector Country 11/30/15
Month-over-
month change
YTD average
YTD avg price
change
1 J. C. Penney Company, Inc. JCP-NYSE Consumer Services USA 27.72% +8.17% 22.06% +2.4%
2 Peabody Energy Corporation BTU-NYSE Energy USA 23.68% +3.35% 22.52% -34.9%
3 Windstream Corporation WIN-NASDAQ Telecom Services USA 20.95% +2.30% 14.53% -1.3%
4 Bioscrip, Inc. BIOS-NASDAQ Healthcare USA 19.76% -5.11% 16.40% -8.9%
5 Walter Investment Management Corp.
WAC-NYSE Financials USA 17.95% +1.74% 18.55% -4.0%
6 Arch Coal, Inc. ACI-NYSE Energy USA 15.17% -1.11% 14.24% -41.1%
7 Ocwen Financial Corporation OCN-NYSE Financials USA 13.96% -1.90% 16.36% +6.6%
8 Weight Watchers International, Inc.
WTW-NYSE Consumer Services USA 10.21% -3.66% 12.93% +0.9%
9 Amc Networks Inc. AMCX-NASDAQ Consumer Services USA 9.67% +0.80% 5.48% -0.7%
10 Post Holdings, Inc. POST-NYSE Consumer Goods USA 8.23% +0.35% 12.29% +0.5%
11 Boyd Gaming Corporation BYD-NYSE Consumer Services USA 8.08% +3.39% 4.87% +1.9%
12 Activision Blizzard, Inc. ATVI-NASDAQ Consumer Goods USA 6.82% +0.61% 3.17% +0.3%
13 Solocal Group LOCAL-FR Technology FRA 6.70% -9.35% 4.41% -17.4%
14 Compass Minerals International, Inc.
CMP-NYSE Basic Materials USA 6.65% +2.61% 1.97% +0.2%
15 Bombardier Recreational Products Inc.
DOO-T Consumer Goods CAN 5.57% +0.71% 6.11% +1.8%
16 Penn National Gaming, Inc. PENN-NASDAQ Consumer Services USA 5.37% -2.03% 7.99% +1.4%
17 Fomento De Construcciones Y Contratas, S.A.
FCC-SIBE Industrials ESP 5.26% +1.33% 1.74% -7.0%
18 Amsurg Corp. AMSG-NASDAQ Healthcare USA 5.20% -0.17% 5.16% +0.1%
19 Nexstar Broadcasting Group, Inc.
NXST-NASDAQ Consumer Services USA 5.08% -0.79% 4.17% +0.3%
20 Zebra Technologies Corporation ZBRA-NASDAQ Technology USA 4.35% -0.28% 2.72% -0.3%
Source: Markit
Global fixed income pricing research
3
J. C. Penney was the most shorted and energy issues made up two of the top 10 most shorted
Many of the companies on the list have been in the news multiple times over the past year, but it is particularly surprising that there are only two energy issuers, Peabody Energy and Arch Coal, which is likely due to the analysis only including five energy issuers. J. C. Penney Company tops the list of current outstanding short interest as a result of weaker retail sales impacting their business more than peers, although the issuer’s loans are 2.4% higher on the year. On average, the issuers at the top 20 list saw their loans decline 5% in price over the past year, with a large portion of that price decline driven by the two aforementioned energy issuers. Excluding energy, the decline was a more modest 1.29% year to date.
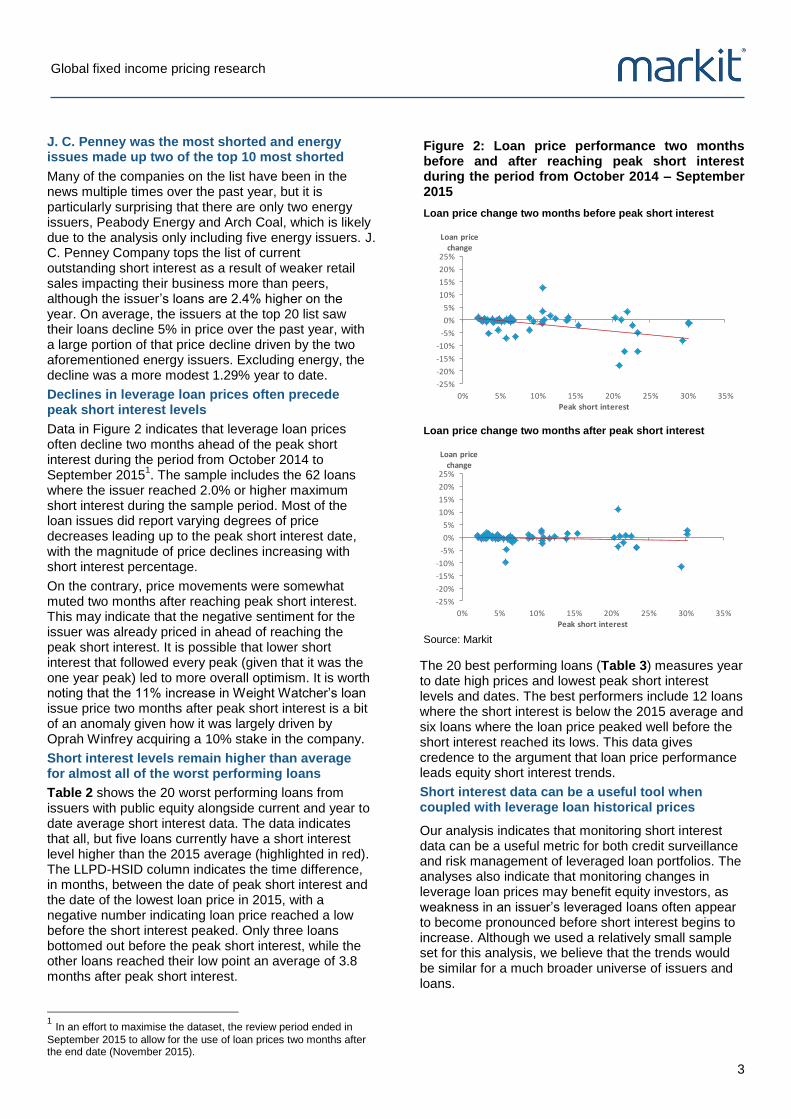
Declines in leverage loan prices often precede peak short interest levels
Data in Figure 2 indicates that leverage loan prices often decline two months ahead of the peak short interest during the period from October 2014 to September 2015
1. The sample includes the 62 loans
where the issuer reached 2.0% or higher maximum short interest during the sample period. Most of the loan issues did report varying degrees of price decreases leading up to the peak short interest date, with the magnitude of price declines increasing with short interest percentage.
On the contrary, price movements were somewhat muted two months after reaching peak short interest. This may indicate that the negative sentiment for the issuer was already priced in ahead of reaching the peak short interest. It is possible that lower short interest that followed every peak (given that it was the one year peak) led to more overall optimism. It is worth noting that the 11% increase in Weight Watcher’s loan issue price two months after peak short interest is a bit of an anomaly given how it was largely driven by Oprah Winfrey acquiring a 10% stake in the company.
Short interest levels remain higher than average for almost all of the worst performing loans
Table 2 shows the 20 worst performing loans from issuers with public equity alongside current and year to date average short interest data. The data indicates that all, but five loans currently have a short interest level higher than the 2015 average (highlighted in red). The LLPD-HSID column indicates the time difference, in months, between the date of peak short interest and the date of the lowest loan price in 2015, with a negative number indicating loan price reached a low before the short interest peaked. Only three loans bottomed out before the peak short interest, while the other loans reached their low point an average of 3.8 months after peak short interest.
1 In an effort to maximise the dataset, the review period ended in
September 2015 to allow for the use of loan prices two months after the end date (November 2015).
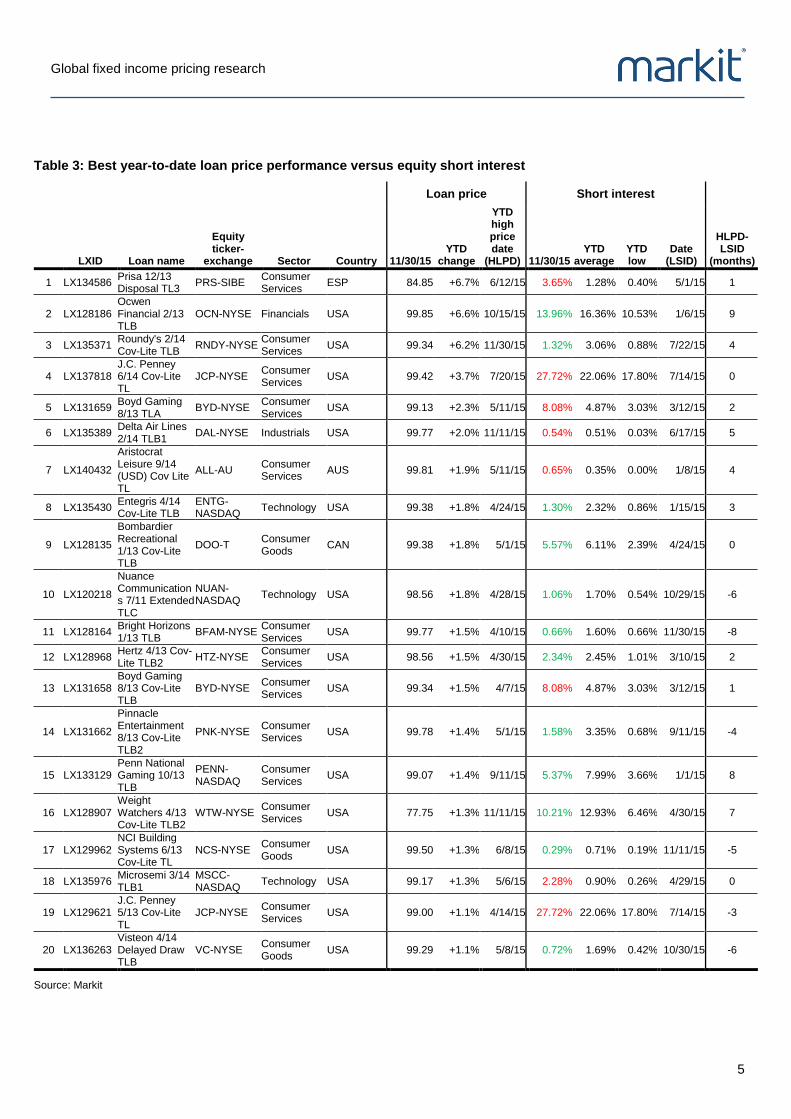
The 20 best performing loans (Table 3) measures year to date high prices and lowest peak short interest levels and dates. The best performers include 12 loans where the short interest is below the 2015 average and six loans where the loan price peaked well before the short interest reached its lows. This data gives credence to the argument that loan price performance leads equity short interest trends.
Short interest data can be a useful tool when coupled with leverage loan historical prices
Our analysis indicates that monitoring short interest data can be a useful metric for both credit surveillance and risk management of leveraged loan portfolios. The analyses also indicate that monitoring changes in leverage loan prices may benefit equity investors, as weakness in an issuer’s leveraged loans often appear to become pronounced before short interest begins to increase. Although we used a relatively small sample set for this analysis, we believe that the trends would be similar for a much broader universe of issuers and loans.
Figure 2: Loan price performance two months before and after reaching peak short interest during the period from October 2014 – September 2015
Loan price change two months before peak short interest
-25%
-20%
-15%
-10%
-5%
0%
5%
10%
15%
20%
25%
0% 5% 10% 15% 20% 25% 30% 35%
Loan price change
Peak short interest
Loan price change two months after peak short interest
-25%
-20%
-15%
-10%
-5%
0%
5%
10%
15%
20%
25%
0% 5% 10% 15% 20% 25% 30% 35%
Loan price change
Peak short interest
Source: Markit

Global fixed income pricing research
4
Table 2: Worst year-to-date loan price performance versus equity short interest
Loan price Short interest
LXID Loan name
Equity ticker-
exchange Sector Country 11/30/15 YTD
change
YTD low price date
(LLPD) 11/30/15 YTD
average YTD high
Date (HSID)
LLPD-HSID
(months)
1 LX124057 Arch Coal (5/12) TLb
ACI-NYSE Energy USA 48.63 -41.1% 11/6/15 15.17% 14.24% 21.08% 3/2/15 8
2 LX132557 Peabody Energy 9/13 Cov-Lite TL
BTU-NYSE Energy USA 58.63 -34.9% 11/30/15 23.68% 22.52% 67.24% 10/1/15 2
3 LX137914 PagesJaunes 6/14 (EUR) A7 TL
LOCAL-FR Technology FRA 66.63 -17.4% 10/6/15 6.70% 4.41% 37.56% 10/28/15 -1
4 LX136189 Federal Mogul 4/14 TLC
FDML-NASDAQ
Consumer Goods
USA 89.04 -10.1% 11/25/15 1.15% 0.87% 1.22% 6/24/15 5
5 LX130184 Bioscrip 7/13 Cov-Lite TLB
BIOS-NASDAQ
Healthcare USA 90.50 -8.9% 11/30/15 19.76% 16.40% 25.12% 10/27/15 1
6 LX131438 Eastman Kodak 7/13 Exit TL
KODK-NYSE Consumer Goods
USA 91.60 -8.3% 11/27/15 2.36% 1.85% 3.69% 10/14/15 1
7 LX136188 Federal Mogul 4/14 TLB
FDML-NASDAQ
Consumer Goods
USA 90.59 -7.8% 10/23/15 1.15% 0.87% 1.22% 6/24/15 4
8 LX138624 FCC 6/14 (EUR) TLA1
FCC-SIBE Industrials ESP 83.67 -7.0% 11/9/15 5.26% 1.74% 5.48% 11/25/15 -1
9 LX134917 YRC 2/14 TL YRCW-NASDAQ
Industrials USA 92.44 -6.6% 11/24/15 1.44% 1.00% 4.20% 1/5/15 11
10 LX137333 Deoleo 6/14 TL OLE-SIBE Consumer Goods
ESP 87.47 -5.7% 9/4/15 0.09% 0.10% 0.25% 1/6/15 8
11 LX130609 Valeant 6/13 TLE
VRX-T Healthcare USA 94.02 -5.0% 11/16/15 2.64% 1.27% 2.92% 10/21/15 1
12 LX134289
Walter Investment 12/13 Cov-Lite TL
WAC-NYSE Financials USA 86.44 -4.0% 11/20/15 17.95% 18.55% 21.99% 5/28/15 6
13 LX134585 Prisa 12/13 Performing Debt TL2
PRS-SIBE Consumer Services
ESP 86.00 -2.0% 1/28/15 3.65% 1.28% 10.75% 5/22/15 -4
14 LX133675 Energy Transfer Equity 12/13 TLB
ETE-NYSE Energy USA 94.64 -1.6% 11/20/15 0.86% 0.24% 1.34% 10/13/15 1
15 LX128471 MEG Energy 2/13 Cov-Lite TL
MEG-T Energy CAN 93.81 -1.5% 8/27/15 4.17% 5.13% 8.55% 1/14/15 8
16 LX125163 Windstream 8/12 B5 TLB
WIN-NASDAQ
Telecom Services
USA 97.38 -1.3% 10/5/15 20.95% 14.53% 22.66% 8/28/15 1
17 LX128154 Valeant 1/13 TLA1
VRX-T Healthcare USA 98.00 -0.8% 11/9/15 2.64% 1.27% 2.92% 10/21/15 1
18 LX120013 AMC Networks 6/11 TLA
AMCX-NASDAQ
Consumer Services
USA 98.13 -0.7% 11/30/15 9.67% 5.48% 9.85% 11/24/15 0
19 LX129275 CDW 4/13 Cov-Lite TL
CDW-NASDAQ
Technology USA 96.27 -0.5% 11/13/15 0.25% 0.49% 2.12% 5/22/15 6
20 LX130181 NRG Energy 5/13 TLB
NRG-NYSE Utilities USA 97.47 -0.4% 10/28/15 3.46% 3.66% 8.47% 11/2/15 0
Source: Markit
Global fixed income pricing research
5
Table 3: Best year-to-date loan price performance versus equity short interest
Loan price Short interest
LXID Loan name
Equity ticker-
exchange Sector Country 11/30/15 YTD
change
YTD high price date
(HLPD) 11/30/15 YTD
average YTD low
Date (LSID)
HLPD-LSID
(months)
1 LX134586 Prisa 12/13 Disposal TL3
PRS-SIBE Consumer Services
ESP 84.85 +6.7% 6/12/15 3.65% 1.28% 0.40% 5/1/15 1
2 LX128186 Ocwen Financial 2/13 TLB
OCN-NYSE Financials USA 99.85 +6.6% 10/15/15 13.96% 16.36% 10.53% 1/6/15 9
3 LX135371 Roundy's 2/14 Cov-Lite TLB
RNDY-NYSE Consumer Services
USA 99.34 +6.2% 11/30/15 1.32% 3.06% 0.88% 7/22/15 4
4 LX137818 J.C. Penney 6/14 Cov-Lite TL
JCP-NYSE Consumer Services
USA 99.42 +3.7% 7/20/15 27.72% 22.06% 17.80% 7/14/15 0
5 LX131659 Boyd Gaming 8/13 TLA
BYD-NYSE Consumer Services
USA 99.13 +2.3% 5/11/15 8.08% 4.87% 3.03% 3/12/15 2
6 LX135389 Delta Air Lines 2/14 TLB1
DAL-NYSE Industrials USA 99.77 +2.0% 11/11/15 0.54% 0.51% 0.03% 6/17/15 5
7 LX140432
Aristocrat Leisure 9/14 (USD) Cov Lite TL
ALL-AU Consumer Services
AUS 99.81 +1.9% 5/11/15 0.65% 0.35% 0.00% 1/8/15 4
8 LX135430 Entegris 4/14 Cov-Lite TLB
ENTG-NASDAQ
Technology USA 99.38 +1.8% 4/24/15 1.30% 2.32% 0.86% 1/15/15 3
9 LX128135
Bombardier Recreational 1/13 Cov-Lite TLB
DOO-T Consumer Goods
CAN 99.38 +1.8% 5/1/15 5.57% 6.11% 2.39% 4/24/15 0
10 LX120218
Nuance Communications 7/11 Extended TLC
NUAN-NASDAQ
Technology USA 98.56 +1.8% 4/28/15 1.06% 1.70% 0.54% 10/29/15 -6
11 LX128164 Bright Horizons 1/13 TLB
BFAM-NYSE Consumer Services
USA 99.77 +1.5% 4/10/15 0.66% 1.60% 0.66% 11/30/15 -8
12 LX128968 Hertz 4/13 Cov-Lite TLB2
HTZ-NYSE Consumer Services
USA 98.56 +1.5% 4/30/15 2.34% 2.45% 1.01% 3/10/15 2
13 LX131658 Boyd Gaming 8/13 Cov-Lite TLB
BYD-NYSE Consumer Services
USA 99.34 +1.5% 4/7/15 8.08% 4.87% 3.03% 3/12/15 1
14 LX131662
Pinnacle Entertainment 8/13 Cov-Lite TLB2
PNK-NYSE Consumer Services
USA 99.78 +1.4% 5/1/15 1.58% 3.35% 0.68% 9/11/15 -4
15 LX133129 Penn National Gaming 10/13 TLB
PENN-NASDAQ
Consumer Services
USA 99.07 +1.4% 9/11/15 5.37% 7.99% 3.66% 1/1/15 8
16 LX128907 Weight Watchers 4/13 Cov-Lite TLB2
WTW-NYSE Consumer Services
USA 77.75 +1.3% 11/11/15 10.21% 12.93% 6.46% 4/30/15 7
17 LX129962 NCI Building Systems 6/13 Cov-Lite TL
NCS-NYSE Consumer Goods
USA 99.50 +1.3% 6/8/15 0.29% 0.71% 0.19% 11/11/15 -5
18 LX135976 Microsemi 3/14 TLB1
MSCC-NASDAQ
Technology USA 99.17 +1.3% 5/6/15 2.28% 0.90% 0.26% 4/29/15 0
19 LX129621 J.C. Penney 5/13 Cov-Lite TL
JCP-NYSE Consumer Services
USA 99.00 +1.1% 4/14/15 27.72% 22.06% 17.80% 7/14/15 -3
20 LX136263 Visteon 4/14 Delayed Draw TLB
VC-NYSE Consumer Goods
USA 99.29 +1.1% 5/8/15 0.72% 1.69% 0.42% 10/30/15 -6
Source: Markit
Global fixed income pricing research
6
Leveraged loans The leveraged loan market continued its slide in November, despite a solid performance in the equity market. The Markit iBoxx USD Leveraged Loan index (MiLLi) declined 1.01% during the month, bringing loan performance to -0.02% year-to-date. Investors continue to focus more on earnings releases than in the past, with even the slightest bit of negative news potentially making an issuer’s loans quickly fall out of favour. Traders and investors have recently been quick to try to sell out of positions that show any signs of weakness, as agility may be one of the best defences in the wake of noticeably less liquidity for issues or sectors that have fallen out of favour with the market.
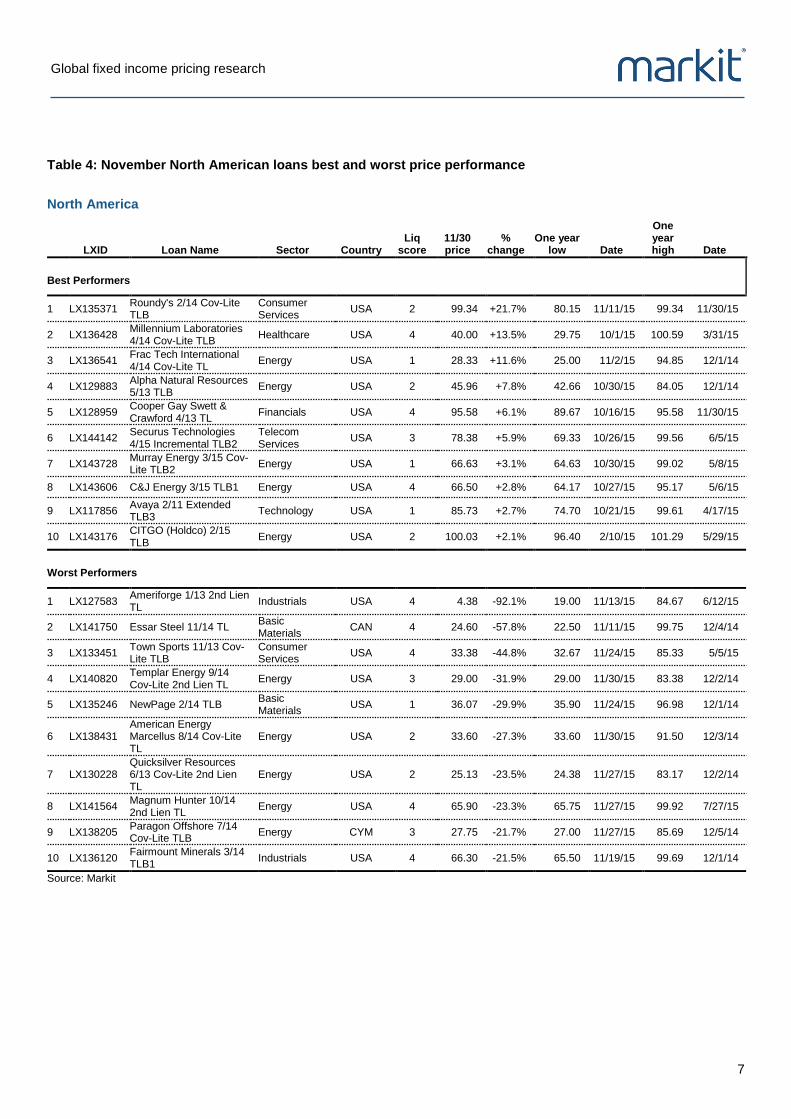
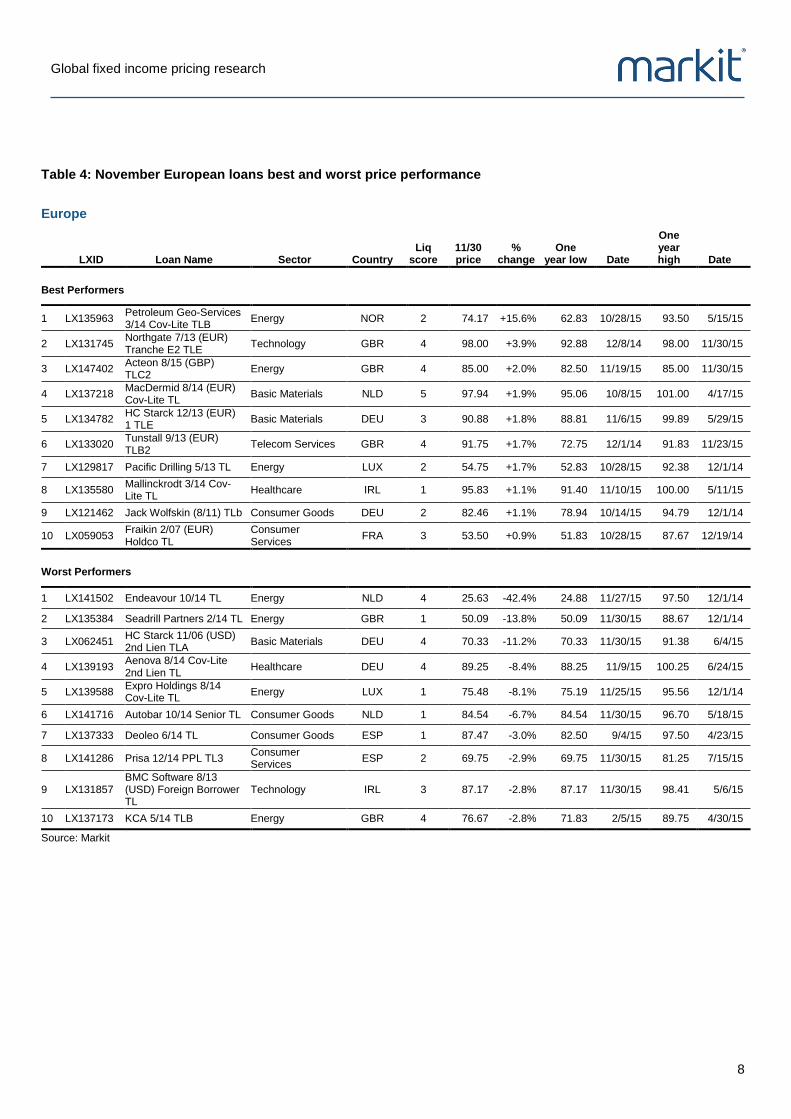
Energy issues dominate both the best and worst performers’ lists
Eight out of the 20 best performing loans this month were issued by energy companies, as small increases in price are magnified by the already deep discounted prices (Table 4). Almost all energy companies on the best performers’ list reported a one year low within the past month. The Petroleum Geo-Services 3/14 Cov-Lite TLB energy issue was actually the best performer in Europe, increasing 15.6% on the month after raising NOK 919.6 million (equivalent of $105 million) through a private placement. Roundy's 2/14 Cov-Lite TLB issue was the best performer globally, increasing 21.7% in price after the announcement that the grocery store chain will be acquired by Kroger for $178 million. Millennium Laboratories 4/14 Cov-Lite TLB was the second best performer in North America after filing for Chapter 11 bankruptcy and plans to cut over $1 billion in debt through a lender backed pre-packaged plan, increasing 13.5% to 40.00 after reaching a one year low of 29.75 in October. Industrial manufacturer Ameriforge 1/13 2nd Lien TL was the worst performing loan globally, decreasing 92.1%, likely due to continued weakness in the oil and gas sector. The worst performer in Europe was Endeavour Energy 10/14 TL, which declined 42.4% on the month.
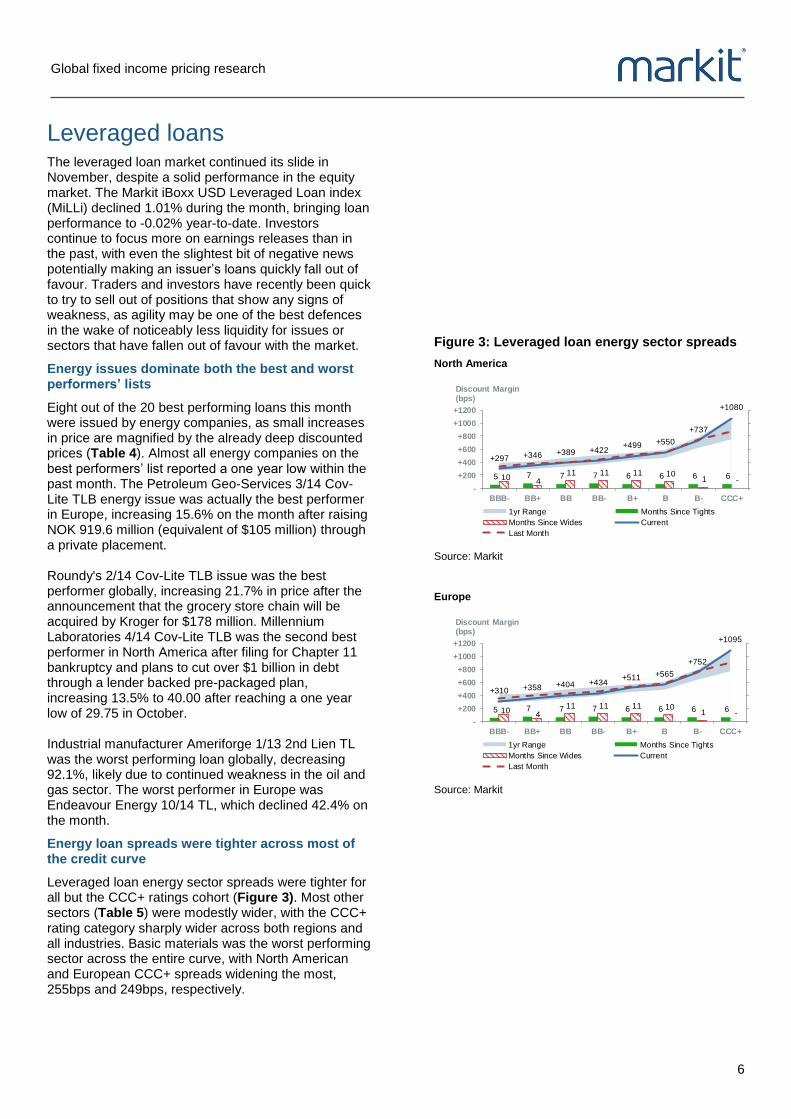
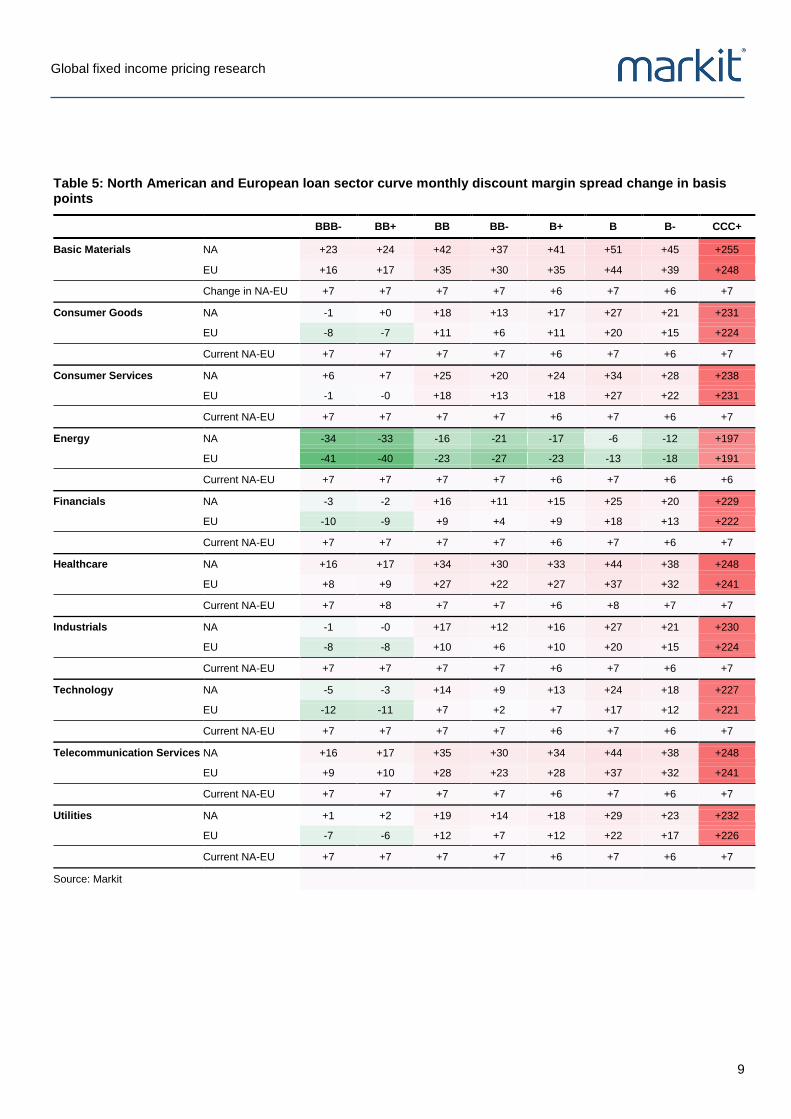
Energy loan spreads were tighter across most of the credit curve
Leveraged loan energy sector spreads were tighter for all but the CCC+ ratings cohort (Figure 3). Most other sectors (Table 5) were modestly wider, with the CCC+ rating category sharply wider across both regions and all industries. Basic materials was the worst performing sector across the entire curve, with North American and European CCC+ spreads widening the most, 255bps and 249bps, respectively.
Figure 3: Leveraged loan energy sector spreads
North America
5 7 7 7 6 6 6 6 10 4
11 11 11 10 1 -
+297 +346 +389 +422+499 +550
+737
+1080
-
+200
+400
+600
+800
+1000
+1200
BBB- BB+ BB BB- B+ B B- CCC+
Discount Margin (bps)
1yr Range Months Since Tights
Months Since Wides Current
Last Month
Source: Markit
Europe
5 7 7 7 6 6 6 6 10 4
11 11 11 10 1 -
+310 +358 +404 +434+511 +565
+752
+1095
-
+200
+400
+600
+800
+1000
+1200
BBB- BB+ BB BB- B+ B B- CCC+
Discount Margin (bps)
1yr Range Months Since Tights
Months Since Wides Current
Last Month
Source: Markit
Global fixed income pricing research
7
Table 4: November North American loans best and worst price performance
North America
LXID Loan Name Sector Country
Liq score
11/30 price
% change
One year low Date
One year high Date
Best Performers
1 LX135371 Roundy's 2/14 Cov-Lite TLB
Consumer Services
USA 2 99.34 +21.7% 80.15 11/11/15 99.34 11/30/15
2 LX136428 Millennium Laboratories 4/14 Cov-Lite TLB
Healthcare USA 4 40.00 +13.5% 29.75 10/1/15 100.59 3/31/15
3 LX136541 Frac Tech International 4/14 Cov-Lite TL
Energy USA 1 28.33 +11.6% 25.00 11/2/15 94.85 12/1/14
4 LX129883 Alpha Natural Resources 5/13 TLB
Energy USA 2 45.96 +7.8% 42.66 10/30/15 84.05 12/1/14
5 LX128959 Cooper Gay Swett & Crawford 4/13 TL
Financials USA 4 95.58 +6.1% 89.67 10/16/15 95.58 11/30/15
6 LX144142 Securus Technologies 4/15 Incremental TLB2
Telecom Services
USA 3 78.38 +5.9% 69.33 10/26/15 99.56 6/5/15
7 LX143728 Murray Energy 3/15 Cov-Lite TLB2
Energy USA 1 66.63 +3.1% 64.63 10/30/15 99.02 5/8/15
8 LX143606 C&J Energy 3/15 TLB1 Energy USA 4 66.50 +2.8% 64.17 10/27/15 95.17 5/6/15
9 LX117856 Avaya 2/11 Extended TLB3
Technology USA 1 85.73 +2.7% 74.70 10/21/15 99.61 4/17/15
10 LX143176 CITGO (Holdco) 2/15 TLB
Energy USA 2 100.03 +2.1% 96.40 2/10/15 101.29 5/29/15
Worst Performers
1 LX127583 Ameriforge 1/13 2nd Lien TL
Industrials USA 4 4.38 -92.1% 19.00 11/13/15 84.67 6/12/15
2 LX141750 Essar Steel 11/14 TL Basic Materials
CAN 4 24.60 -57.8% 22.50 11/11/15 99.75 12/4/14
3 LX133451 Town Sports 11/13 Cov-Lite TLB
Consumer Services
USA 4 33.38 -44.8% 32.67 11/24/15 85.33 5/5/15
4 LX140820 Templar Energy 9/14 Cov-Lite 2nd Lien TL
Energy USA 3 29.00 -31.9% 29.00 11/30/15 83.38 12/2/14
5 LX135246 NewPage 2/14 TLB Basic Materials
USA 1 36.07 -29.9% 35.90 11/24/15 96.98 12/1/14
6 LX138431 American Energy Marcellus 8/14 Cov-Lite TL
Energy USA 2 33.60 -27.3% 33.60 11/30/15 91.50 12/3/14
7 LX130228 Quicksilver Resources 6/13 Cov-Lite 2nd Lien TL
Energy USA 2 25.13 -23.5% 24.38 11/27/15 83.17 12/2/14
8 LX141564 Magnum Hunter 10/14 2nd Lien TL
Energy USA 4 65.90 -23.3% 65.75 11/27/15 99.92 7/27/15
9 LX138205 Paragon Offshore 7/14 Cov-Lite TLB
Energy CYM 3 27.75 -21.7% 27.00 11/27/15 85.69 12/5/14
10 LX136120 Fairmount Minerals 3/14 TLB1
Industrials USA 4 66.30 -21.5% 65.50 11/19/15 99.69 12/1/14
Source: Markit
Global fixed income pricing research
8
Table 4: November European loans best and worst price performance
Europe
LXID Loan Name Sector Country
Liq score
11/30 price
% change
One year low Date
One year high Date
Best Performers
1 LX135963 Petroleum Geo-Services 3/14 Cov-Lite TLB
Energy NOR 2 74.17 +15.6% 62.83 10/28/15 93.50 5/15/15
2 LX131745 Northgate 7/13 (EUR) Tranche E2 TLE
Technology GBR 4 98.00 +3.9% 92.88 12/8/14 98.00 11/30/15
3 LX147402 Acteon 8/15 (GBP) TLC2
Energy GBR 4 85.00 +2.0% 82.50 11/19/15 85.00 11/30/15
4 LX137218 MacDermid 8/14 (EUR) Cov-Lite TL
Basic Materials NLD 5 97.94 +1.9% 95.06 10/8/15 101.00 4/17/15
5 LX134782 HC Starck 12/13 (EUR) 1 TLE
Basic Materials DEU 3 90.88 +1.8% 88.81 11/6/15 99.89 5/29/15
6 LX133020 Tunstall 9/13 (EUR) TLB2
Telecom Services GBR 4 91.75 +1.7% 72.75 12/1/14 91.83 11/23/15
7 LX129817 Pacific Drilling 5/13 TL Energy LUX 2 54.75 +1.7% 52.83 10/28/15 92.38 12/1/14
8 LX135580 Mallinckrodt 3/14 Cov-Lite TL
Healthcare IRL 1 95.83 +1.1% 91.40 11/10/15 100.00 5/11/15
9 LX121462 Jack Wolfskin (8/11) TLb Consumer Goods DEU 2 82.46 +1.1% 78.94 10/14/15 94.79 12/1/14
10 LX059053 Fraikin 2/07 (EUR) Holdco TL
Consumer Services
FRA 3 53.50 +0.9% 51.83 10/28/15 87.67 12/19/14
Worst Performers
1 LX141502 Endeavour 10/14 TL Energy NLD 4 25.63 -42.4% 24.88 11/27/15 97.50 12/1/14
2 LX135384 Seadrill Partners 2/14 TL Energy GBR 1 50.09 -13.8% 50.09 11/30/15 88.67 12/1/14
3 LX062451 HC Starck 11/06 (USD) 2nd Lien TLA
Basic Materials DEU 4 70.33 -11.2% 70.33 11/30/15 91.38 6/4/15
4 LX139193 Aenova 8/14 Cov-Lite 2nd Lien TL
Healthcare DEU 4 89.25 -8.4% 88.25 11/9/15 100.25 6/24/15
5 LX139588 Expro Holdings 8/14 Cov-Lite TL
Energy LUX 1 75.48 -8.1% 75.19 11/25/15 95.56 12/1/14
6 LX141716 Autobar 10/14 Senior TL Consumer Goods NLD 1 84.54 -6.7% 84.54 11/30/15 96.70 5/18/15
7 LX137333 Deoleo 6/14 TL Consumer Goods ESP 1 87.47 -3.0% 82.50 9/4/15 97.50 4/23/15
8 LX141286 Prisa 12/14 PPL TL3 Consumer Services
ESP 2 69.75 -2.9% 69.75 11/30/15 81.25 7/15/15
9 LX131857 BMC Software 8/13 (USD) Foreign Borrower TL
Technology IRL 3 87.17 -2.8% 87.17 11/30/15 98.41 5/6/15
10 LX137173 KCA 5/14 TLB Energy GBR 4 76.67 -2.8% 71.83 2/5/15 89.75 4/30/15
Source: Markit
Global fixed income pricing research
9
Table 5: North American and European loan sector curve monthly discount margin spread change in basis points
BBB- BB+ BB BB- B+ B B- CCC+
Basic Materials NA +23 +24 +42 +37 +41 +51 +45 +255
EU +16 +17 +35 +30 +35 +44 +39 +248
Change in NA-EU +7 +7 +7 +7 +6 +7 +6 +7
Consumer Goods NA -1 +0 +18 +13 +17 +27 +21 +231
EU -8 -7 +11 +6 +11 +20 +15 +224
Current NA-EU +7 +7 +7 +7 +6 +7 +6 +7
Consumer Services NA +6 +7 +25 +20 +24 +34 +28 +238
EU -1 -0 +18 +13 +18 +27 +22 +231
Current NA-EU +7 +7 +7 +7 +6 +7 +6 +7
Energy NA -34 -33 -16 -21 -17 -6 -12 +197
EU -41 -40 -23 -27 -23 -13 -18 +191
Current NA-EU +7 +7 +7 +7 +6 +7 +6 +6
Financials NA -3 -2 +16 +11 +15 +25 +20 +229
EU -10 -9 +9 +4 +9 +18 +13 +222
Current NA-EU +7 +7 +7 +7 +6 +7 +6 +7
Healthcare NA +16 +17 +34 +30 +33 +44 +38 +248
EU +8 +9 +27 +22 +27 +37 +32 +241
Current NA-EU +7 +8 +7 +7 +6 +8 +7 +7
Industrials NA -1 -0 +17 +12 +16 +27 +21 +230
EU -8 -8 +10 +6 +10 +20 +15 +224
Current NA-EU +7 +7 +7 +7 +6 +7 +6 +7
Technology NA -5 -3 +14 +9 +13 +24 +18 +227
EU -12 -11 +7 +2 +7 +17 +12 +221
Current NA-EU +7 +7 +7 +7 +6 +7 +6 +7
Telecommunication Services NA +16 +17 +35 +30 +34 +44 +38 +248
EU +9 +10 +28 +23 +28 +37 +32 +241
Current NA-EU +7 +7 +7 +7 +6 +7 +6 +7
Utilities NA +1 +2 +19 +14 +18 +29 +23 +232
EU -7 -6 +12 +7 +12 +22 +17 +226
Current NA-EU +7 +7 +7 +7 +6 +7 +6 +7
Source: Markit
Global fixed income pricing research
10
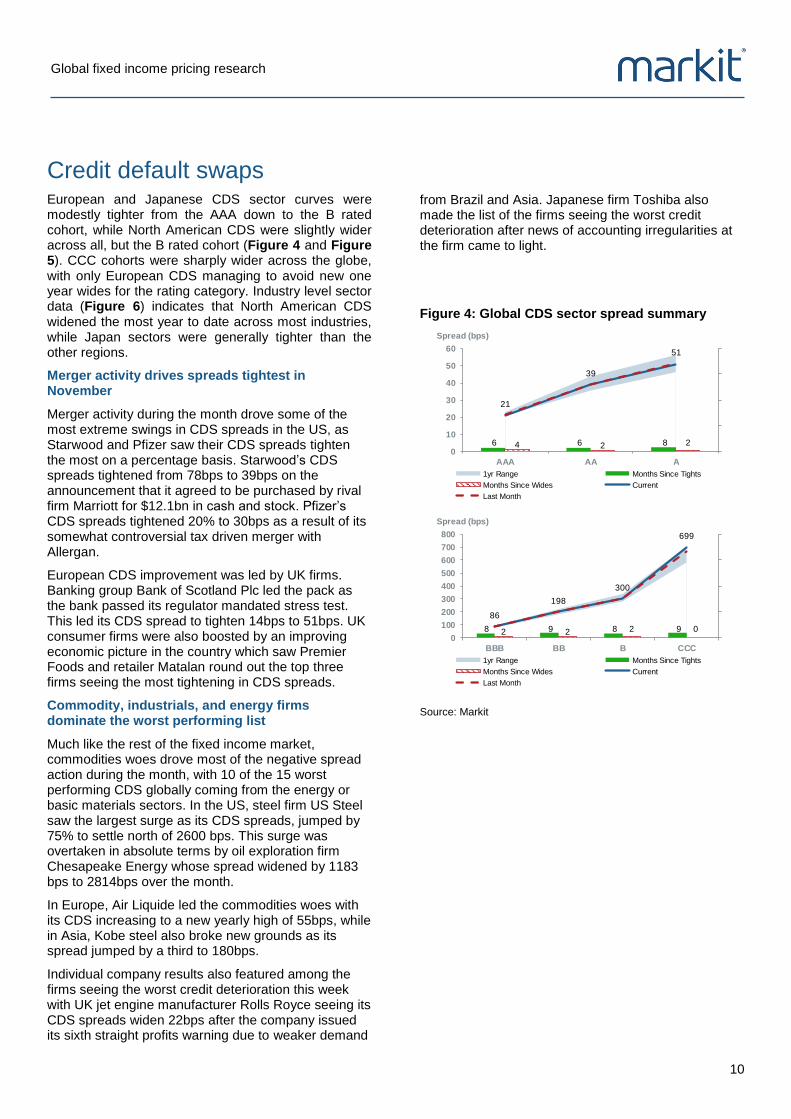
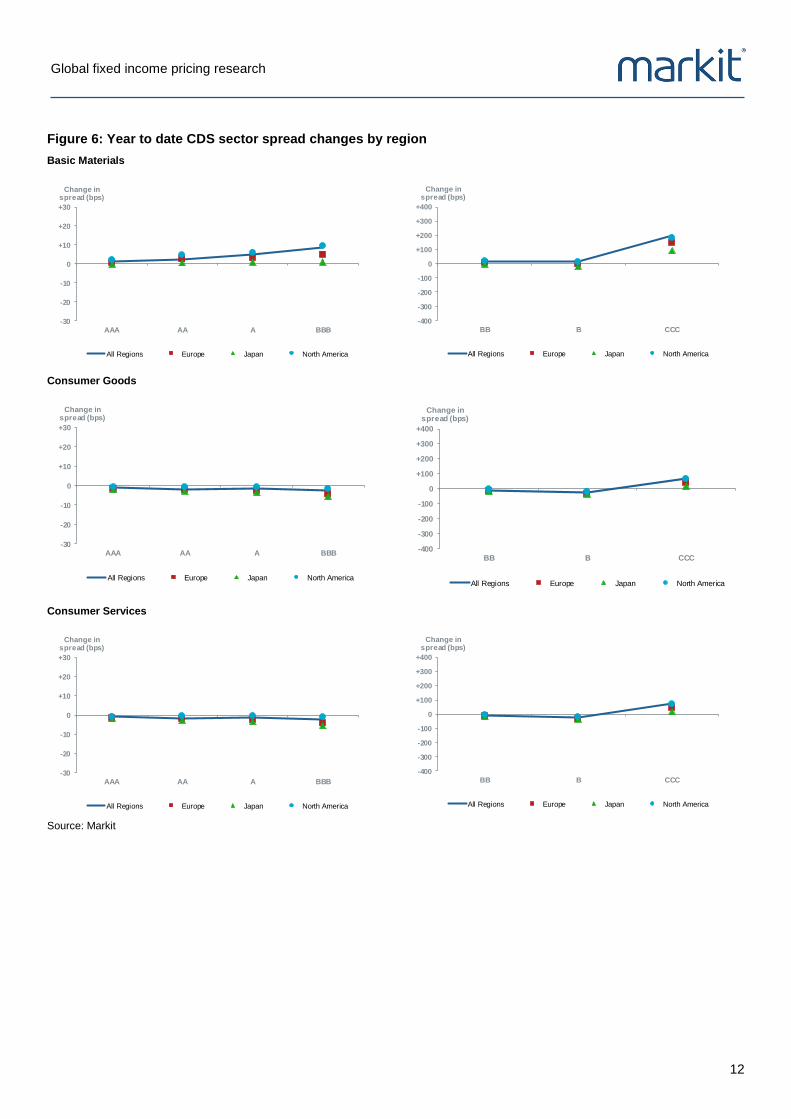
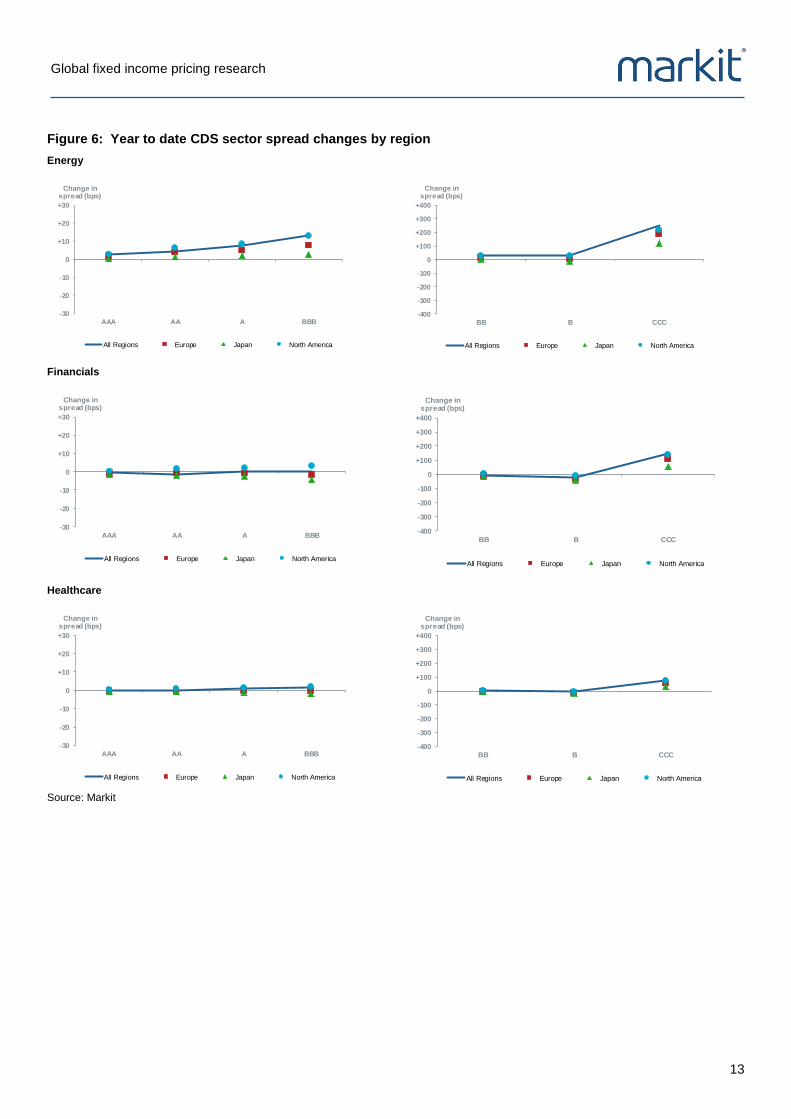
Credit default swaps European and Japanese CDS sector curves were modestly tighter from the AAA down to the B rated cohort, while North American CDS were slightly wider across all, but the B rated cohort (Figure 4 and Figure 5). CCC cohorts were sharply wider across the globe, with only European CDS managing to avoid new one year wides for the rating category. Industry level sector data (Figure 6) indicates that North American CDS widened the most year to date across most industries, while Japan sectors were generally tighter than the other regions.
Merger activity drives spreads tightest in November
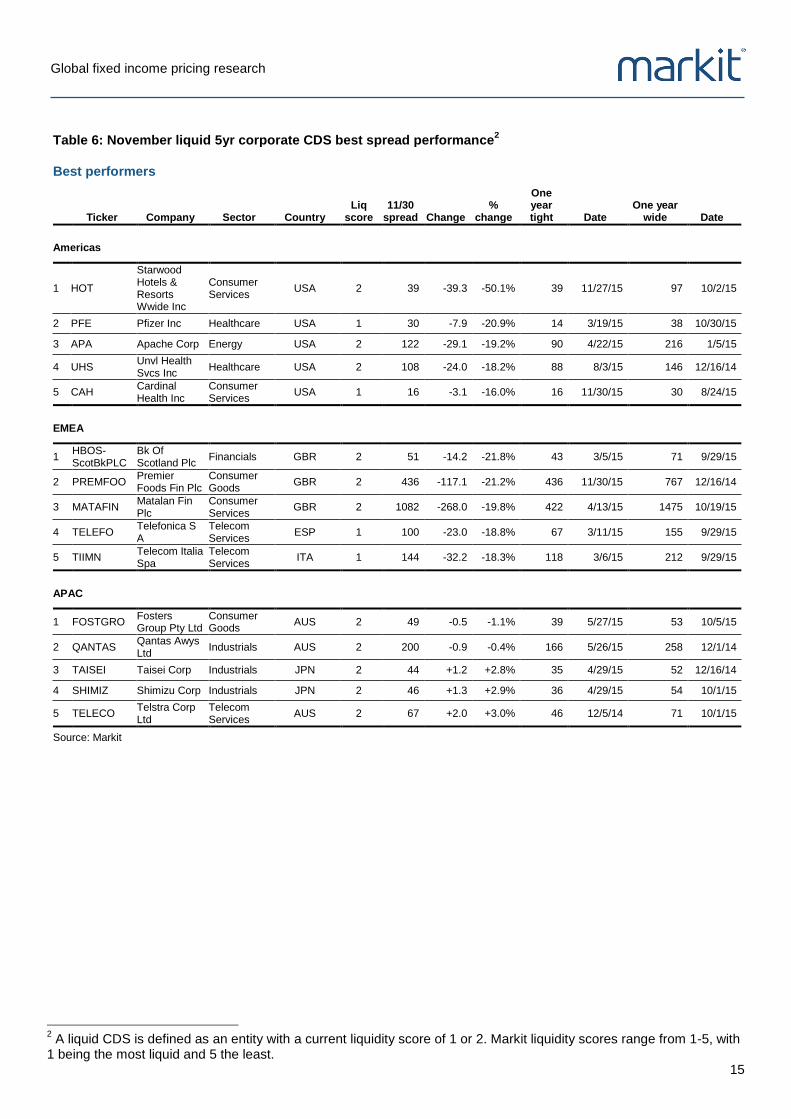
Merger activity during the month drove some of the most extreme swings in CDS spreads in the US, as Starwood and Pfizer saw their CDS spreads tighten the most on a percentage basis. Starwood’s CDS spreads tightened from 78bps to 39bps on the announcement that it agreed to be purchased by rival firm Marriott for $12.1bn in cash and stock. Pfizer’s CDS spreads tightened 20% to 30bps as a result of its somewhat controversial tax driven merger with Allergan.
European CDS improvement was led by UK firms. Banking group Bank of Scotland Plc led the pack as the bank passed its regulator mandated stress test. This led its CDS spread to tighten 14bps to 51bps. UK consumer firms were also boosted by an improving economic picture in the country which saw Premier Foods and retailer Matalan round out the top three firms seeing the most tightening in CDS spreads.
Commodity, industrials, and energy firms dominate the worst performing list
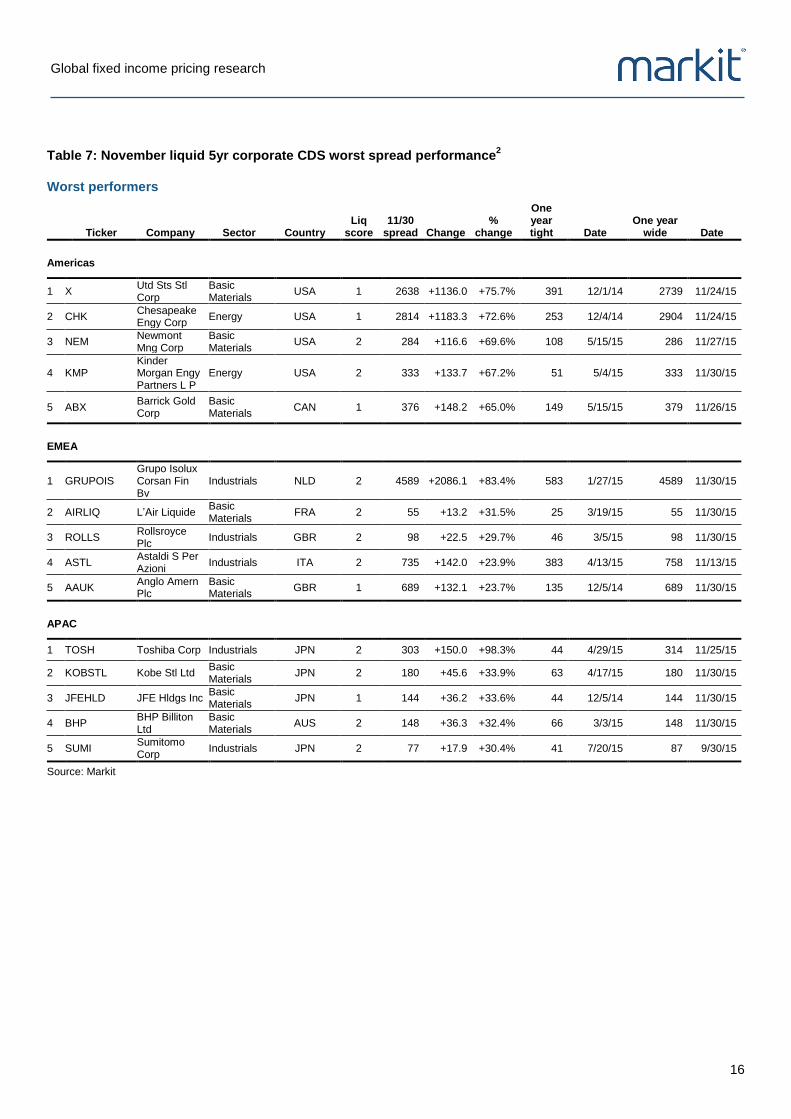
Much like the rest of the fixed income market, commodities woes drove most of the negative spread action during the month, with 10 of the 15 worst performing CDS globally coming from the energy or basic materials sectors. In the US, steel firm US Steel saw the largest surge as its CDS spreads, jumped by 75% to settle north of 2600 bps. This surge was overtaken in absolute terms by oil exploration firm Chesapeake Energy whose spread widened by 1183 bps to 2814bps over the month.
In Europe, Air Liquide led the commodities woes with its CDS increasing to a new yearly high of 55bps, while in Asia, Kobe steel also broke new grounds as its spread jumped by a third to 180bps.
Individual company results also featured among the firms seeing the worst credit deterioration this week with UK jet engine manufacturer Rolls Royce seeing its CDS spreads widen 22bps after the company issued its sixth straight profits warning due to weaker demand
from Brazil and Asia. Japanese firm Toshiba also made the list of the firms seeing the worst credit deterioration after news of accounting irregularities at the firm came to light.
Figure 4: Global CDS sector spread summary
6 6 8 4 2 2
21
39
51
0
10
20
30
40
50
60
AAA AA A
Spread (bps)
1yr Range Months Since Tights
Months Since Wides Current
Last Month
8 9 8 9 2 2 2 0
86
198
300
699
0
100
200
300
400
500
600
700
800
BBB BB B CCC
Spread (bps)
1yr Range Months Since Tights
Months Since Wides Current
Last Month
Source: Markit

Global fixed income pricing research
11
Figure 5: November regional CDS sector spread summary
North America
6 9 8 4 2 2
21
37
48
0
10
20
30
40
50
60
AAA AA A
Spread (bps)
1yr Range Months Since Tights
Months Since Wides Current
Last Month
8 9 8 12 2 2 2 0
78
182
279
637
0
200
400
600
800
1000
BBB BB B CCC
Spread (bps)
1yr Range Months Since Tights
Months Since Wides Current
Last Month
Europe
9 9 9 3 2 2
20
36
46
0
10
20
30
40
50
60
AAA AA A
Spread (bps)
1yr Range Months Since Tights
Months Since Wides Current
Last Month
9 9 8 9 2 2 2 2
75
175269
625
0
200
400
600
800
1000
BBB BB B CCC
Spread (bps)
1yr Range Months Since Tights
Months Since Wides Current
Last Month
Japan
2 7 7 10 11 11
15
28
36
0
10
20
30
40
50
60
AAA AA A
Spread (bps)
1yr Range Months Since Tights
Months Since Wides Current
Last Month
7 7 6 7 11 11 12 057
135208
483
0
200
400
600
800
1000
BBB BB B CCC
Spread (bps)
1yr Range Months Since Tights
Months Since Wides Current
Last Month
Source: Markit
Global fixed income pricing research
12
Figure 6: Year to date CDS sector spread changes by region
Basic Materials
-30
-20
-10
0
+10
+20
+30
AAA AA A BBB
Change in spread (bps)
All Regions Europe Japan North America
-400
-300
-200
-100
0
+100
+200
+300
+400
BB B CCC
Change in spread (bps)
All Regions Europe Japan North America
Consumer Goods
-30
-20
-10
0
+10
+20
+30
AAA AA A BBB
Change in spread (bps)
All Regions Europe Japan North America
-400
-300
-200
-100
0
+100
+200
+300
+400
BB B CCC
Change in spread (bps)
All Regions Europe Japan North America
Consumer Services
-30
-20
-10
0
+10
+20
+30
AAA AA A BBB
Change in spread (bps)
All Regions Europe Japan North America
-400
-300
-200
-100
0
+100
+200
+300
+400
BB B CCC
Change in spread (bps)
All Regions Europe Japan North America
Source: Markit
Global fixed income pricing research
13
Figure 6: Year to date CDS sector spread changes by region
Energy
-30
-20
-10
0
+10
+20
+30
AAA AA A BBB
Change in spread (bps)
All Regions Europe Japan North America
-400
-300
-200
-100
0
+100
+200
+300
+400
BB B CCC
Change in spread (bps)
All Regions Europe Japan North America
Financials
-30
-20
-10
0
+10
+20
+30
AAA AA A BBB
Change in spread (bps)
All Regions Europe Japan North America
-400
-300
-200
-100
0
+100
+200
+300
+400
BB B CCC
Change in spread (bps)
All Regions Europe Japan North America
Healthcare
-30
-20
-10
0
+10
+20
+30
AAA AA A BBB
Change in spread (bps)
All Regions Europe Japan North America
-400
-300
-200
-100
0
+100
+200
+300
+400
BB B CCC
Change in spread (bps)
All Regions Europe Japan North America
Source: Markit

Global fixed income pricing research
14
Figure 6: Year to date CDS sector spread changes by region
Industrials
-30
-20
-10
0
+10
+20
+30
AAA AA A BBB
Change in spread (bps)
All Regions Europe Japan North America
-400
-300
-200
-100
0
+100
+200
+300
+400
BB B CCC
Change in spread (bps)
All Regions Europe Japan North America
Technology
-30
-20
-10
0
+10
+20
+30
AAA AA A BBB
Change in spread (bps)
All Regions Europe Japan North America
-400
-300
-200
-100
0
+100
+200
+300
+400
BB B CCC
Change in spread (bps)
All Regions Europe Japan North America
Telecom Services
-30
-20
-10
0
+10
+20
+30
AAA AA A BBB
Change in spread (bps)
All Regions Europe Japan North America
-400
-300
-200
-100
0
+100
+200
+300
+400
BB B CCC
Change in spread (bps)
All Regions Europe Japan North America
Source: Markit
Global fixed income pricing research
15
Table 6: November liquid 5yr corporate CDS best spread performance2
Best performers
Ticker Company Sector Country
Liq score
11/30 spread Change
% change
One year tight Date
One year wide Date
Americas
1 HOT
Starwood Hotels & Resorts Wwide Inc
Consumer Services
USA 2 39 -39.3 -50.1% 39 11/27/15 97 10/2/15
2 PFE Pfizer Inc Healthcare USA 1 30 -7.9 -20.9% 14 3/19/15 38 10/30/15
3 APA Apache Corp Energy USA 2 122 -29.1 -19.2% 90 4/22/15 216 1/5/15
4 UHS Unvl Health Svcs Inc
Healthcare USA 2 108 -24.0 -18.2% 88 8/3/15 146 12/16/14
5 CAH Cardinal Health Inc
Consumer Services
USA 1 16 -3.1 -16.0% 16 11/30/15 30 8/24/15
EMEA
1 HBOS-ScotBkPLC
Bk Of Scotland Plc
Financials GBR 2 51 -14.2 -21.8% 43 3/5/15 71 9/29/15
2 PREMFOO Premier Foods Fin Plc
Consumer Goods
GBR 2 436 -117.1 -21.2% 436 11/30/15 767 12/16/14
3 MATAFIN Matalan Fin Plc
Consumer Services
GBR 2 1082 -268.0 -19.8% 422 4/13/15 1475 10/19/15
4 TELEFO Telefonica S A
Telecom Services
ESP 1 100 -23.0 -18.8% 67 3/11/15 155 9/29/15
5 TIIMN Telecom Italia Spa
Telecom Services
ITA 1 144 -32.2 -18.3% 118 3/6/15 212 9/29/15
APAC
1 FOSTGRO Fosters Group Pty Ltd
Consumer Goods
AUS 2 49 -0.5 -1.1% 39 5/27/15 53 10/5/15
2 QANTAS Qantas Awys Ltd
Industrials AUS 2 200 -0.9 -0.4% 166 5/26/15 258 12/1/14
3 TAISEI Taisei Corp Industrials JPN 2 44 +1.2 +2.8% 35 4/29/15 52 12/16/14
4 SHIMIZ Shimizu Corp Industrials JPN 2 46 +1.3 +2.9% 36 4/29/15 54 10/1/15
5 TELECO Telstra Corp Ltd
Telecom Services
AUS 2 67 +2.0 +3.0% 46 12/5/14 71 10/1/15
Source: Markit
2 A liquid CDS is defined as an entity with a current liquidity score of 1 or 2. Markit liquidity scores range from 1-5, with
1 being the most liquid and 5 the least.
Global fixed income pricing research
16
Table 7: November liquid 5yr corporate CDS worst spread performance
2
Worst performers
Ticker Company Sector Country
Liq score
11/30 spread Change
% change
One year tight Date
One year wide Date
Americas
1 X Utd Sts Stl Corp
Basic Materials
USA 1 2638 +1136.0 +75.7% 391 12/1/14 2739 11/24/15
2 CHK Chesapeake Engy Corp
Energy USA 1 2814 +1183.3 +72.6% 253 12/4/14 2904 11/24/15
3 NEM Newmont Mng Corp
Basic Materials
USA 2 284 +116.6 +69.6% 108 5/15/15 286 11/27/15
4 KMP Kinder Morgan Engy Partners L P
Energy USA 2 333 +133.7 +67.2% 51 5/4/15 333 11/30/15
5 ABX Barrick Gold Corp
Basic Materials
CAN 1 376 +148.2 +65.0% 149 5/15/15 379 11/26/15
EMEA
1 GRUPOIS Grupo Isolux Corsan Fin Bv
Industrials NLD 2 4589 +2086.1 +83.4% 583 1/27/15 4589 11/30/15
2 AIRLIQ L’Air Liquide Basic Materials
FRA 2 55 +13.2 +31.5% 25 3/19/15 55 11/30/15
3 ROLLS Rollsroyce Plc
Industrials GBR 2 98 +22.5 +29.7% 46 3/5/15 98 11/30/15
4 ASTL Astaldi S Per Azioni
Industrials ITA 2 735 +142.0 +23.9% 383 4/13/15 758 11/13/15
5 AAUK Anglo Amern Plc
Basic Materials
GBR 1 689 +132.1 +23.7% 135 12/5/14 689 11/30/15
APAC
1 TOSH Toshiba Corp Industrials JPN 2 303 +150.0 +98.3% 44 4/29/15 314 11/25/15
2 KOBSTL Kobe Stl Ltd Basic Materials
JPN 2 180 +45.6 +33.9% 63 4/17/15 180 11/30/15
3 JFEHLD JFE Hldgs Inc Basic Materials
JPN 1 144 +36.2 +33.6% 44 12/5/14 144 11/30/15
4 BHP BHP Billiton Ltd
Basic Materials
AUS 2 148 +36.3 +32.4% 66 3/3/15 148 11/30/15
5 SUMI Sumitomo Corp
Industrials JPN 2 77 +17.9 +30.4% 41 7/20/15 87 9/30/15
Source: Markit
Global fixed income pricing research
17
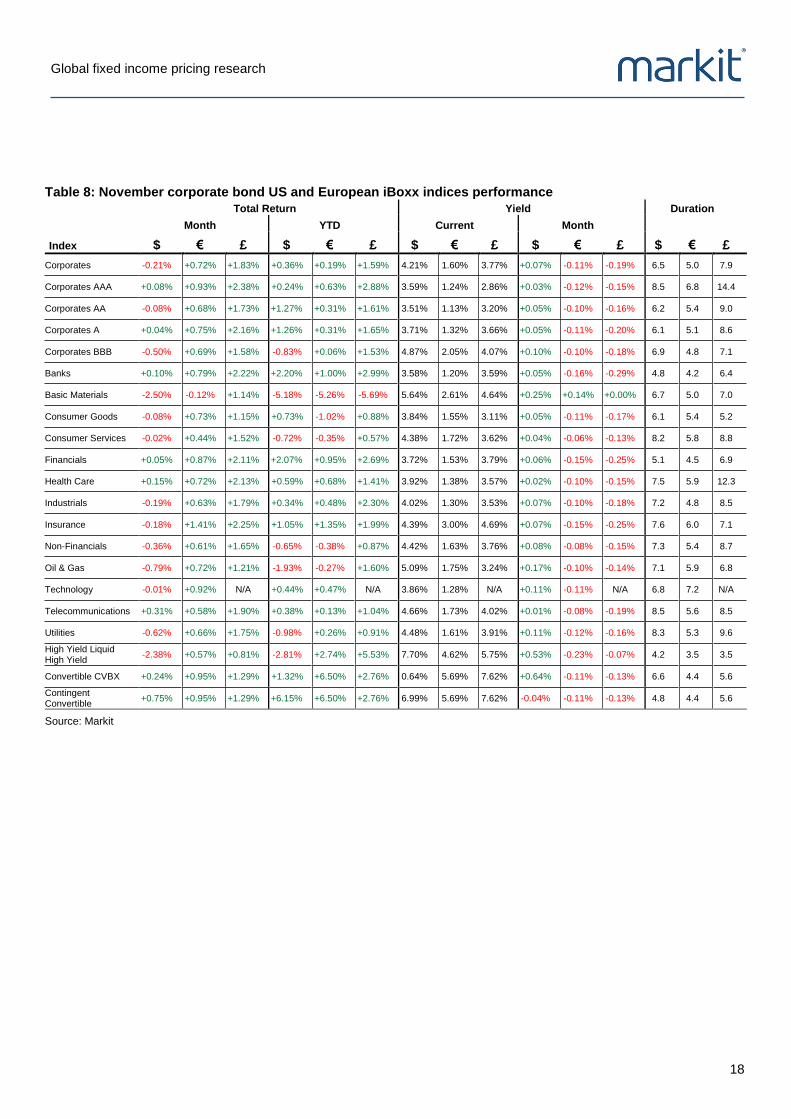
Global corporate bonds Markit iBoxx USD Corporate Index returns were 0.21% lower in November, while sterling and euro denominated bonds were 1.83% and 0.72% higher, respectively, on the month (Table 8). Investment grade outperformed high yield across all three currencies, as investors were still defensive in the wake of this fall’s spread volatility. The current cautious sentiment is partly driven by lingering idiosyncratic risks and continued interest rate volatility due to the impending Fed policy decision in December.
Dollar basic materials sector declined sharply
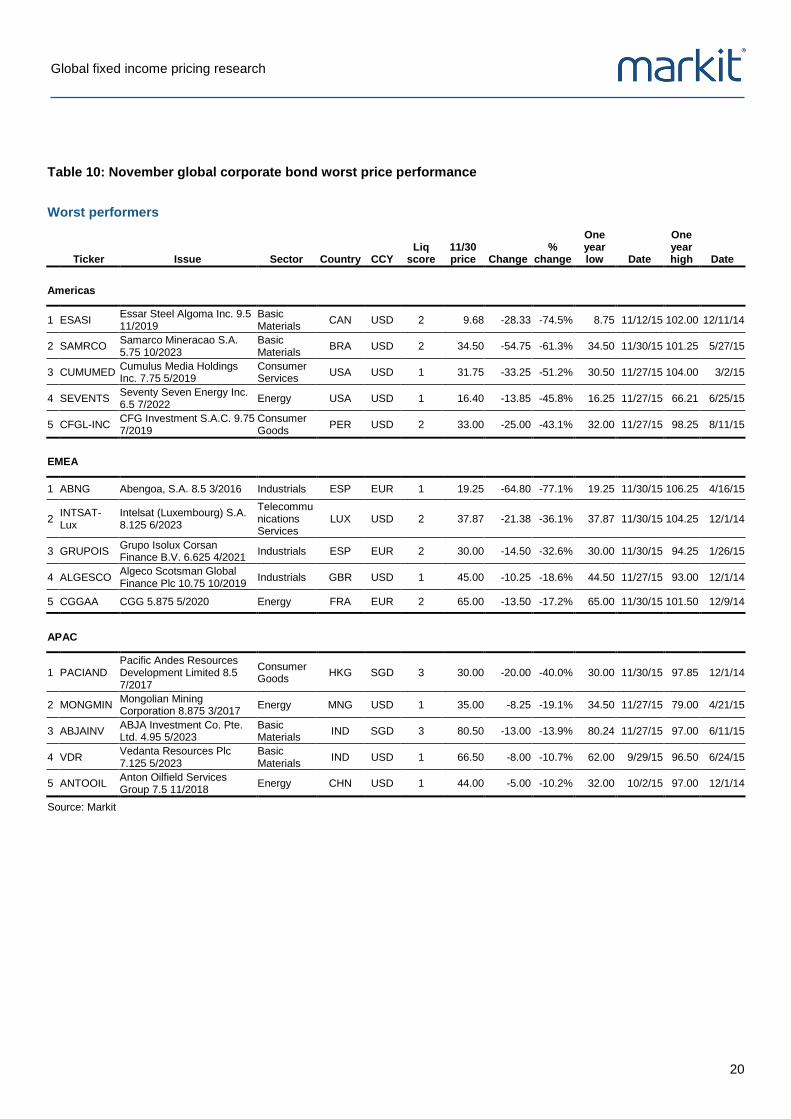
The broad decline in commodity prices weighed heavily on the market, with Markit iBoxx $HY bearing much of the pain. This was most evident in the commodity heavy $CCC sector, whose spreads widened to new post-financial crisis wides. However $IG was not spared from the commodities rout, as the basic materials sector saw yields widen 25bps to 5.64%, resulting in a -2.50% return on the month. Oil and gas was the next worst performing sector at -0.79%, followed by utilities at -0.62%. Bonds from these sectors dominated the worst performing bonds in the Americas and APAC in November (Table 10), with Essar Steel Agoma’s 9.5% 2019 maturity issue declining 74.5% during the month.
The best performing $IG sector in November was telecommunications, returning 0.31% on the month. Banks and broader financials continued to prove fruitful for investors, ending the month positive across all three currencies, with sterling and dollar bonds returning over 2% for 2015. Financials have proved to be resilient throughout the year amidst a strong regulatory backdrop, as we recently saw banks benefit from lower than expected TLAC and minimum debt requirements.
Elsewhere among corporate bonds, £HY is now 5.53% higher on the year after returning 0.81% in November. £HY bonds have remained popular throughout the year given the limited supply, positive economic backdrop and attractive coupons. Even £Basic Materials managed to avert investor losses among the weak commodity backdrop, although losses for the year remain the worst for that sector, among the three currencies, at -5.69% year-to-date.
Banks and financials stronger on expectations for more ECB stimulus
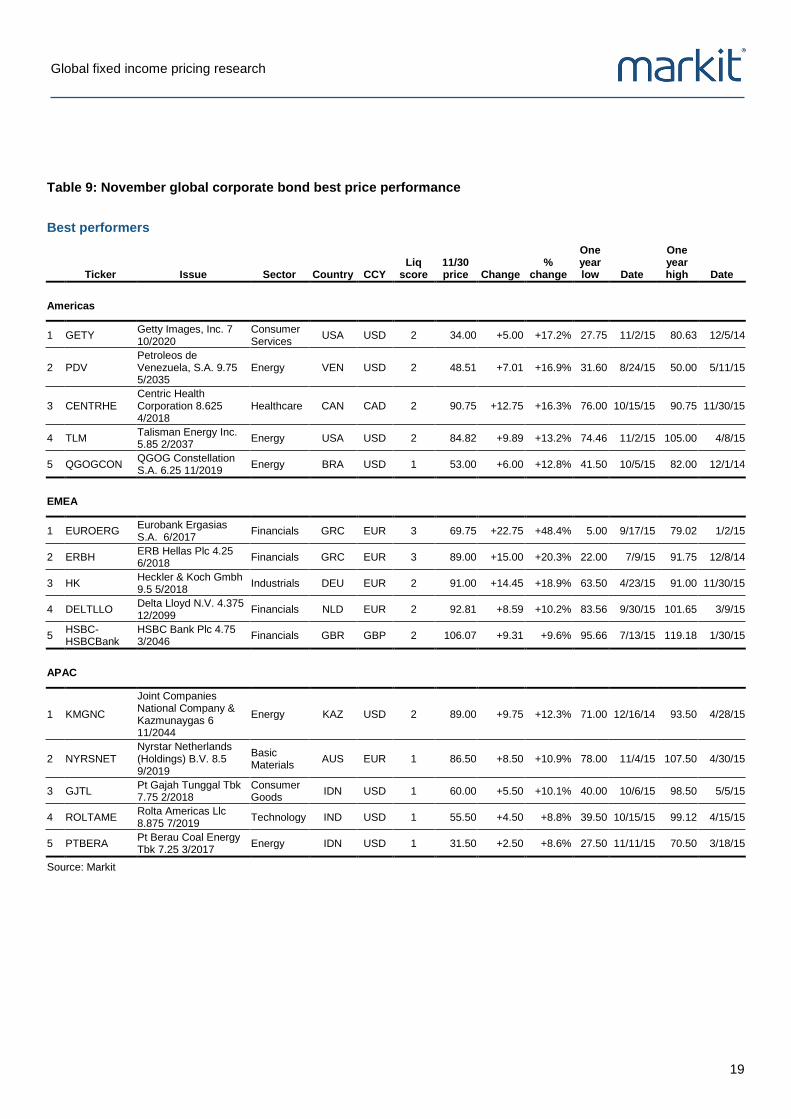
Strengthened rhetoric from ECB council members around extending monetary stimulus measures in December (which fell short of expectations) decreased benchmark yields and increased overall risk appetite. € corporate bonds were tighter across the board, providing a positive 0.57% monthly returns in €HY Similar to $IG, €Banks and €Financials continued to outperform the other European sectors, with financial bonds such as the Eurobank 2017, ERB Hellas 4.25% 2018 and the £HSBC 4.75% bond maturing in 2046 leading the price charge in November (Table 9).
Global fixed income pricing research
18
Table 8: November corporate bond US and European iBoxx indices performance Total Return Yield Duration
Month YTD Current Month
Index $ € £ $ € £ $ € £ $ € £ $ € £
Corporates -0.21% +0.72% +1.83% +0.36% +0.19% +1.59% 4.21% 1.60% 3.77% +0.07% -0.11% -0.19% 6.5 5.0 7.9
Corporates AAA +0.08% +0.93% +2.38% +0.24% +0.63% +2.88% 3.59% 1.24% 2.86% +0.03% -0.12% -0.15% 8.5 6.8 14.4
Corporates AA -0.08% +0.68% +1.73% +1.27% +0.31% +1.61% 3.51% 1.13% 3.20% +0.05% -0.10% -0.16% 6.2 5.4 9.0
Corporates A +0.04% +0.75% +2.16% +1.26% +0.31% +1.65% 3.71% 1.32% 3.66% +0.05% -0.11% -0.20% 6.1 5.1 8.6
Corporates BBB -0.50% +0.69% +1.58% -0.83% +0.06% +1.53% 4.87% 2.05% 4.07% +0.10% -0.10% -0.18% 6.9 4.8 7.1
Banks +0.10% +0.79% +2.22% +2.20% +1.00% +2.99% 3.58% 1.20% 3.59% +0.05% -0.16% -0.29% 4.8 4.2 6.4
Basic Materials -2.50% -0.12% +1.14% -5.18% -5.26% -5.69% 5.64% 2.61% 4.64% +0.25% +0.14% +0.00% 6.7 5.0 7.0
Consumer Goods -0.08% +0.73% +1.15% +0.73% -1.02% +0.88% 3.84% 1.55% 3.11% +0.05% -0.11% -0.17% 6.1 5.4 5.2
Consumer Services -0.02% +0.44% +1.52% -0.72% -0.35% +0.57% 4.38% 1.72% 3.62% +0.04% -0.06% -0.13% 8.2 5.8 8.8
Financials +0.05% +0.87% +2.11% +2.07% +0.95% +2.69% 3.72% 1.53% 3.79% +0.06% -0.15% -0.25% 5.1 4.5 6.9
Health Care +0.15% +0.72% +2.13% +0.59% +0.68% +1.41% 3.92% 1.38% 3.57% +0.02% -0.10% -0.15% 7.5 5.9 12.3
Industrials -0.19% +0.63% +1.79% +0.34% +0.48% +2.30% 4.02% 1.30% 3.53% +0.07% -0.10% -0.18% 7.2 4.8 8.5
Insurance -0.18% +1.41% +2.25% +1.05% +1.35% +1.99% 4.39% 3.00% 4.69% +0.07% -0.15% -0.25% 7.6 6.0 7.1
Non-Financials -0.36% +0.61% +1.65% -0.65% -0.38% +0.87% 4.42% 1.63% 3.76% +0.08% -0.08% -0.15% 7.3 5.4 8.7
Oil & Gas -0.79% +0.72% +1.21% -1.93% -0.27% +1.60% 5.09% 1.75% 3.24% +0.17% -0.10% -0.14% 7.1 5.9 6.8
Technology -0.01% +0.92% N/A +0.44% +0.47% N/A 3.86% 1.28% N/A +0.11% -0.11% N/A 6.8 7.2 N/A
Telecommunications +0.31% +0.58% +1.90% +0.38% +0.13% +1.04% 4.66% 1.73% 4.02% +0.01% -0.08% -0.19% 8.5 5.6 8.5
Utilities -0.62% +0.66% +1.75% -0.98% +0.26% +0.91% 4.48% 1.61% 3.91% +0.11% -0.12% -0.16% 8.3 5.3 9.6
High Yield Liquid High Yield
-2.38% +0.57% +0.81% -2.81% +2.74% +5.53% 7.70% 4.62% 5.75% +0.53% -0.23% -0.07% 4.2 3.5 3.5
Convertible CVBX +0.24% +0.95% +1.29% +1.32% +6.50% +2.76% 0.64% 5.69% 7.62% +0.64% -0.11% -0.13% 6.6 4.4 5.6
Contingent Convertible
+0.75% +0.95% +1.29% +6.15% +6.50% +2.76% 6.99% 5.69% 7.62% -0.04% -0.11% -0.13% 4.8 4.4 5.6
Source: Markit
Global fixed income pricing research
19
Table 9: November global corporate bond best price performance
Best performers
Ticker Issue Sector Country CCY
Liq score
11/30 price Change
% change
One year low Date
One year high Date
Americas
1 GETY Getty Images, Inc. 7 10/2020
Consumer Services
USA USD 2 34.00 +5.00 +17.2% 27.75 11/2/15 80.63 12/5/14
2 PDV Petroleos de Venezuela, S.A. 9.75 5/2035
Energy VEN USD 2 48.51 +7.01 +16.9% 31.60 8/24/15 50.00 5/11/15
3 CENTRHE Centric Health Corporation 8.625 4/2018
Healthcare CAN CAD 2 90.75 +12.75 +16.3% 76.00 10/15/15 90.75 11/30/15
4 TLM Talisman Energy Inc. 5.85 2/2037
Energy USA USD 2 84.82 +9.89 +13.2% 74.46 11/2/15 105.00 4/8/15
5 QGOGCON QGOG Constellation S.A. 6.25 11/2019
Energy BRA USD 1 53.00 +6.00 +12.8% 41.50 10/5/15 82.00 12/1/14
EMEA
1 EUROERG Eurobank Ergasias S.A. 6/2017
Financials GRC EUR 3 69.75 +22.75 +48.4% 5.00 9/17/15 79.02 1/2/15
2 ERBH ERB Hellas Plc 4.25 6/2018
Financials GRC EUR 3 89.00 +15.00 +20.3% 22.00 7/9/15 91.75 12/8/14
3 HK Heckler & Koch Gmbh 9.5 5/2018
Industrials DEU EUR 2 91.00 +14.45 +18.9% 63.50 4/23/15 91.00 11/30/15
4 DELTLLO Delta Lloyd N.V. 4.375 12/2099
Financials NLD EUR 2 92.81 +8.59 +10.2% 83.56 9/30/15 101.65 3/9/15
5 HSBC-HSBCBank
HSBC Bank Plc 4.75 3/2046
Financials GBR GBP 2 106.07 +9.31 +9.6% 95.66 7/13/15 119.18 1/30/15
APAC
1 KMGNC
Joint Companies National Company & Kazmunaygas 6 11/2044
Energy KAZ USD 2 89.00 +9.75 +12.3% 71.00 12/16/14 93.50 4/28/15
2 NYRSNET Nyrstar Netherlands (Holdings) B.V. 8.5 9/2019
Basic Materials
AUS EUR 1 86.50 +8.50 +10.9% 78.00 11/4/15 107.50 4/30/15
3 GJTL Pt Gajah Tunggal Tbk 7.75 2/2018
Consumer Goods
IDN USD 1 60.00 +5.50 +10.1% 40.00 10/6/15 98.50 5/5/15
4 ROLTAME Rolta Americas Llc 8.875 7/2019
Technology IND USD 1 55.50 +4.50 +8.8% 39.50 10/15/15 99.12 4/15/15
5 PTBERA Pt Berau Coal Energy Tbk 7.25 3/2017
Energy IDN USD 1 31.50 +2.50 +8.6% 27.50 11/11/15 70.50 3/18/15
Source: Markit
Global fixed income pricing research
20
Table 10: November global corporate bond worst price performance
Worst performers
Ticker Issue Sector Country CCY
Liq score
11/30 price Change
% change
One year low Date
One year high Date
Americas
1 ESASI Essar Steel Algoma Inc. 9.5 11/2019
Basic Materials
CAN USD 2 9.68 -28.33 -74.5% 8.75 11/12/15 102.00 12/11/14
2 SAMRCO Samarco Mineracao S.A. 5.75 10/2023
Basic Materials
BRA USD 2 34.50 -54.75 -61.3% 34.50 11/30/15 101.25 5/27/15
3 CUMUMED Cumulus Media Holdings Inc. 7.75 5/2019
Consumer Services
USA USD 1 31.75 -33.25 -51.2% 30.50 11/27/15 104.00 3/2/15
4 SEVENTS Seventy Seven Energy Inc. 6.5 7/2022
Energy USA USD 1 16.40 -13.85 -45.8% 16.25 11/27/15 66.21 6/25/15
5 CFGL-INC CFG Investment S.A.C. 9.75 7/2019
Consumer Goods
PER USD 2 33.00 -25.00 -43.1% 32.00 11/27/15 98.25 8/11/15
EMEA
1 ABNG Abengoa, S.A. 8.5 3/2016 Industrials ESP EUR 1 19.25 -64.80 -77.1% 19.25 11/30/15 106.25 4/16/15
2 INTSAT-Lux
Intelsat (Luxembourg) S.A. 8.125 6/2023
Telecommunications Services
LUX USD 2 37.87 -21.38 -36.1% 37.87 11/30/15 104.25 12/1/14
3 GRUPOIS Grupo Isolux Corsan Finance B.V. 6.625 4/2021
Industrials ESP EUR 2 30.00 -14.50 -32.6% 30.00 11/30/15 94.25 1/26/15
4 ALGESCO Algeco Scotsman Global Finance Plc 10.75 10/2019
Industrials GBR USD 1 45.00 -10.25 -18.6% 44.50 11/27/15 93.00 12/1/14
5 CGGAA CGG 5.875 5/2020 Energy FRA EUR 2 65.00 -13.50 -17.2% 65.00 11/30/15 101.50 12/9/14
APAC
1 PACIAND Pacific Andes Resources Development Limited 8.5 7/2017
Consumer Goods
HKG SGD 3 30.00 -20.00 -40.0% 30.00 11/30/15 97.85 12/1/14
2 MONGMIN Mongolian Mining Corporation 8.875 3/2017
Energy MNG USD 1 35.00 -8.25 -19.1% 34.50 11/27/15 79.00 4/21/15
3 ABJAINV ABJA Investment Co. Pte. Ltd. 4.95 5/2023
Basic Materials
IND SGD 3 80.50 -13.00 -13.9% 80.24 11/27/15 97.00 6/11/15
4 VDR Vedanta Resources Plc 7.125 5/2023
Basic Materials
IND USD 1 66.50 -8.00 -10.7% 62.00 9/29/15 96.50 6/24/15
5 ANTOOIL Anton Oilfield Services Group 7.5 11/2018
Energy CHN USD 1 44.00 -5.00 -10.2% 32.00 10/2/15 97.00 12/1/14
Source: Markit
Global fixed income pricing research
21
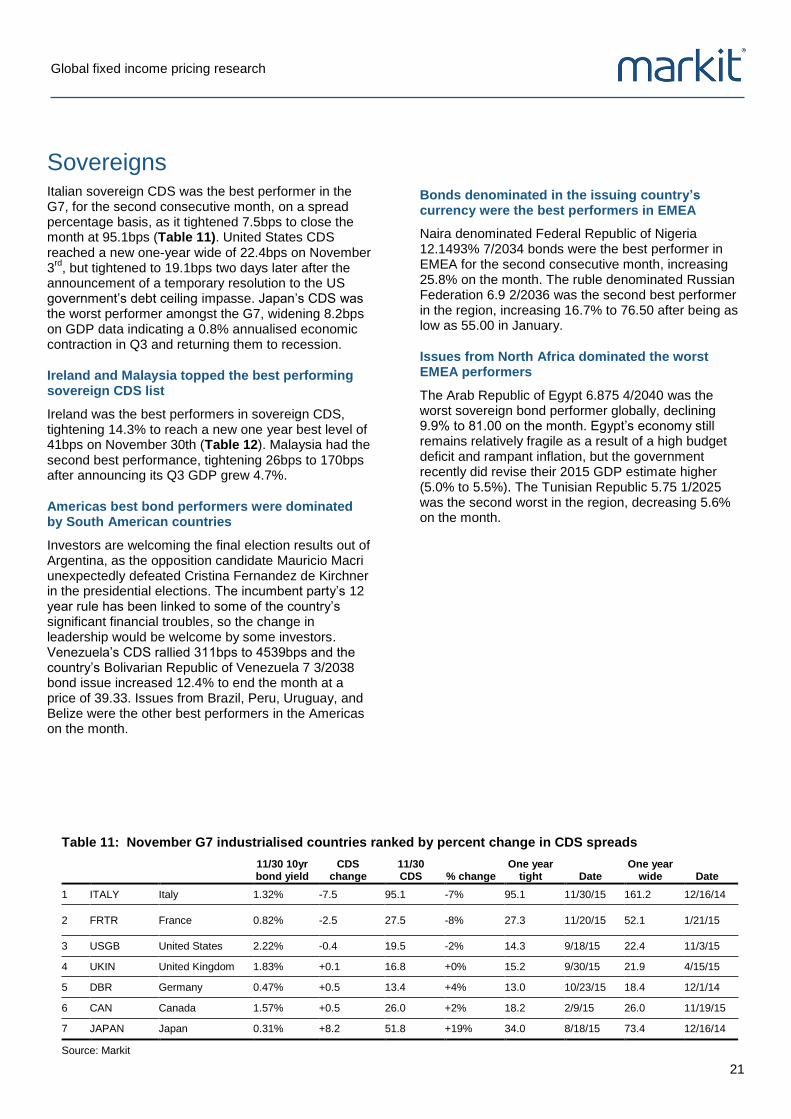
Sovereigns Italian sovereign CDS was the best performer in the G7, for the second consecutive month, on a spread percentage basis, as it tightened 7.5bps to close the month at 95.1bps (Table 11). United States CDS reached a new one-year wide of 22.4bps on November 3
rd, but tightened to 19.1bps two days later after the
announcement of a temporary resolution to the US government’s debt ceiling impasse. Japan’s CDS was the worst performer amongst the G7, widening 8.2bps on GDP data indicating a 0.8% annualised economic contraction in Q3 and returning them to recession.
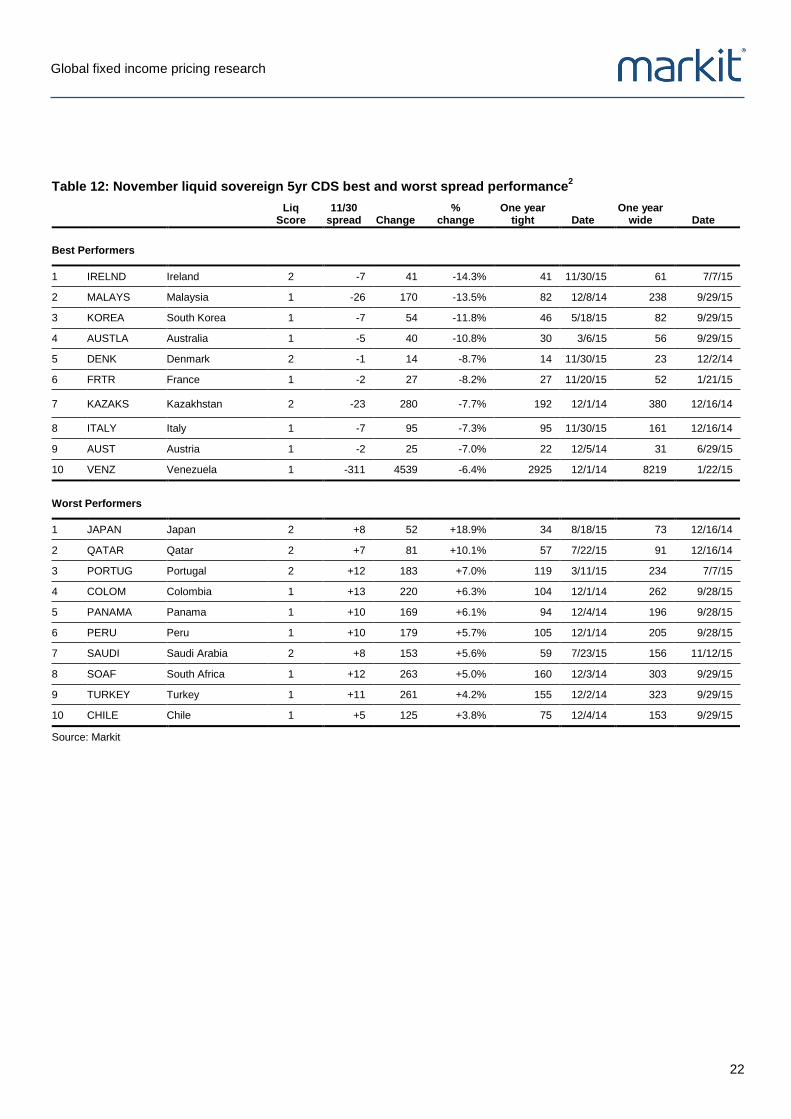
Ireland and Malaysia topped the best performing sovereign CDS list
Ireland was the best performers in sovereign CDS, tightening 14.3% to reach a new one year best level of 41bps on November 30th (Table 12). Malaysia had the second best performance, tightening 26bps to 170bps after announcing its Q3 GDP grew 4.7%.
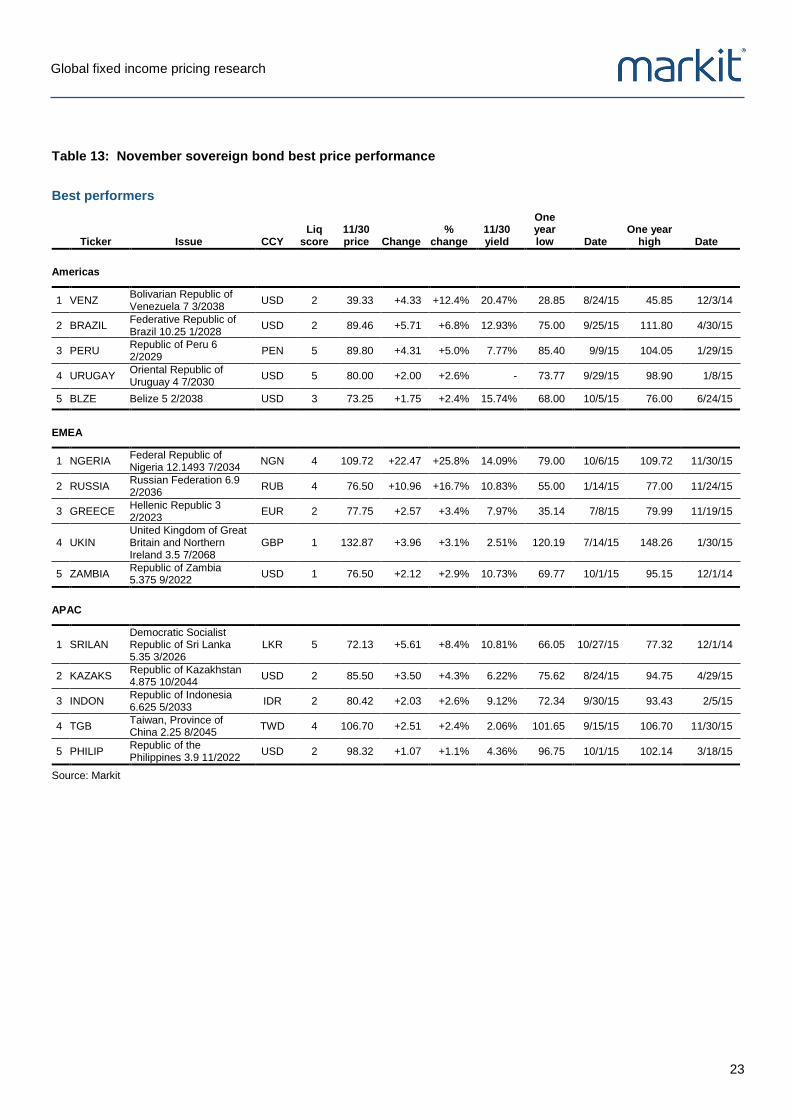
Americas best bond performers were dominated by South American countries
Investors are welcoming the final election results out of Argentina, as the opposition candidate Mauricio Macri unexpectedly defeated Cristina Fernandez de Kirchner in the presidential elections. The incumbent party’s 12 year rule has been linked to some of the country’s significant financial troubles, so the change in leadership would be welcome by some investors. Venezuela’s CDS rallied 311bps to 4539bps and the country’s Bolivarian Republic of Venezuela 7 3/2038 bond issue increased 12.4% to end the month at a price of 39.33. Issues from Brazil, Peru, Uruguay, and Belize were the other best performers in the Americas on the month.
Bonds denominated in the issuing country’s currency were the best performers in EMEA
Naira denominated Federal Republic of Nigeria 12.1493% 7/2034 bonds were the best performer in EMEA for the second consecutive month, increasing 25.8% on the month. The ruble denominated Russian Federation 6.9 2/2036 was the second best performer in the region, increasing 16.7% to 76.50 after being as low as 55.00 in January.
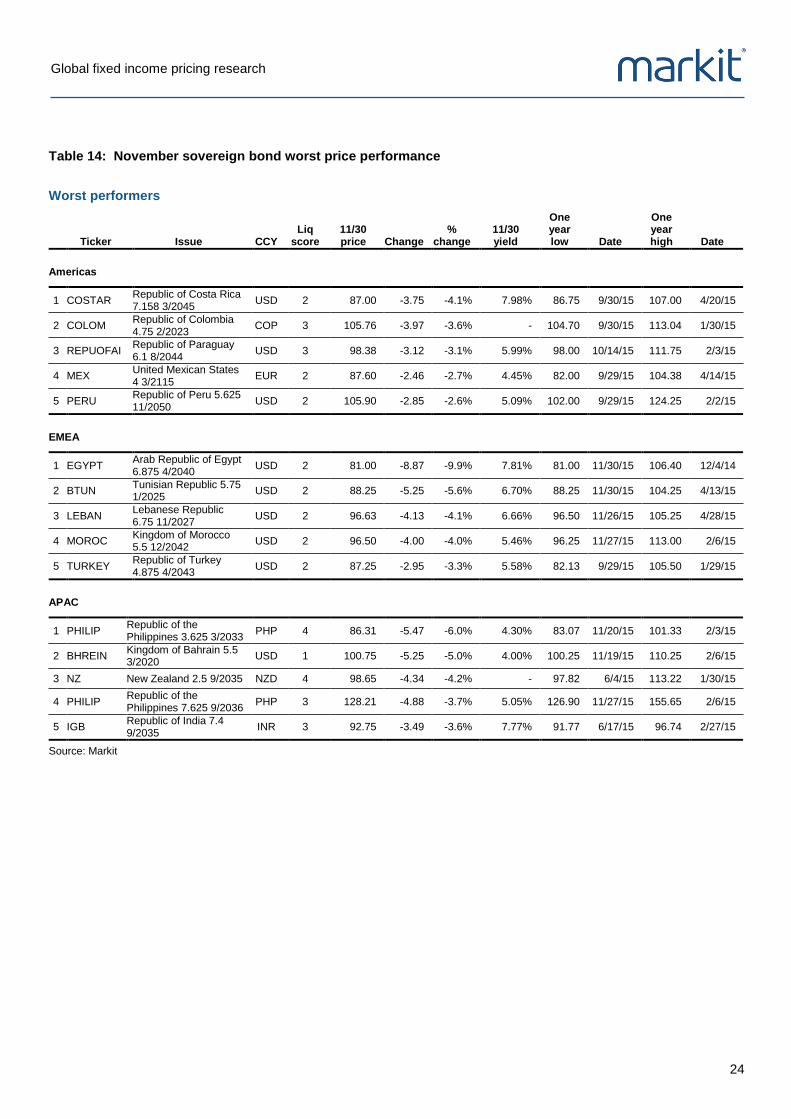
Issues from North Africa dominated the worst EMEA performers
The Arab Republic of Egypt 6.875 4/2040 was the worst sovereign bond performer globally, declining 9.9% to 81.00 on the month. Egypt’s economy still remains relatively fragile as a result of a high budget deficit and rampant inflation, but the government recently did revise their 2015 GDP estimate higher (5.0% to 5.5%). The Tunisian Republic 5.75 1/2025 was the second worst in the region, decreasing 5.6% on the month.
Table 11: November G7 industrialised countries ranked by percent change in CDS spreads
11/30 10yr bond yield
CDS change
11/30 CDS % change
One year tight Date
One year wide Date
1 ITALY Italy 1.32% -7.5 95.1 -7% 95.1 11/30/15 161.2 12/16/14
2 FRTR France 0.82% -2.5 27.5 -8% 27.3 11/20/15 52.1 1/21/15
3 USGB United States 2.22% -0.4 19.5 -2% 14.3 9/18/15 22.4 11/3/15
4 UKIN United Kingdom 1.83% +0.1 16.8 +0% 15.2 9/30/15 21.9 4/15/15
5 DBR Germany 0.47% +0.5 13.4 +4% 13.0 10/23/15 18.4 12/1/14
6 CAN Canada 1.57% +0.5 26.0 +2% 18.2 2/9/15 26.0 11/19/15
7 JAPAN Japan 0.31% +8.2 51.8 +19% 34.0 8/18/15 73.4 12/16/14
Source: Markit
Global fixed income pricing research
22
Table 12: November liquid sovereign 5yr CDS best and worst spread performance
2
Liq Score
11/30 spread Change
% change
One year tight Date
One year wide Date
Best Performers
1 IRELND Ireland 2 -7 41 -14.3% 41 11/30/15 61 7/7/15
2 MALAYS Malaysia 1 -26 170 -13.5% 82 12/8/14 238 9/29/15
3 KOREA South Korea 1 -7 54 -11.8% 46 5/18/15 82 9/29/15
4 AUSTLA Australia 1 -5 40 -10.8% 30 3/6/15 56 9/29/15
5 DENK Denmark 2 -1 14 -8.7% 14 11/30/15 23 12/2/14
6 FRTR France 1 -2 27 -8.2% 27 11/20/15 52 1/21/15
7 KAZAKS Kazakhstan 2 -23 280 -7.7% 192 12/1/14 380 12/16/14
8 ITALY Italy 1 -7 95 -7.3% 95 11/30/15 161 12/16/14
9 AUST Austria 1 -2 25 -7.0% 22 12/5/14 31 6/29/15
10 VENZ Venezuela 1 -311 4539 -6.4% 2925 12/1/14 8219 1/22/15
Worst Performers
1 JAPAN Japan 2 +8 52 +18.9% 34 8/18/15 73 12/16/14
2 QATAR Qatar 2 +7 81 +10.1% 57 7/22/15 91 12/16/14
3 PORTUG Portugal 2 +12 183 +7.0% 119 3/11/15 234 7/7/15
4 COLOM Colombia 1 +13 220 +6.3% 104 12/1/14 262 9/28/15
5 PANAMA Panama 1 +10 169 +6.1% 94 12/4/14 196 9/28/15
6 PERU Peru 1 +10 179 +5.7% 105 12/1/14 205 9/28/15
7 SAUDI Saudi Arabia 2 +8 153 +5.6% 59 7/23/15 156 11/12/15
8 SOAF South Africa 1 +12 263 +5.0% 160 12/3/14 303 9/29/15
9 TURKEY Turkey 1 +11 261 +4.2% 155 12/2/14 323 9/29/15
10 CHILE Chile 1 +5 125 +3.8% 75 12/4/14 153 9/29/15
Source: Markit
Global fixed income pricing research
23
Table 13: November sovereign bond best price performance
Best performers
Ticker Issue CCY
Liq score
11/30 price Change
% change
11/30 yield
One year low Date
One year high Date
Americas
1 VENZ Bolivarian Republic of Venezuela 7 3/2038
USD 2 39.33 +4.33 +12.4% 20.47% 28.85 8/24/15 45.85 12/3/14
2 BRAZIL Federative Republic of Brazil 10.25 1/2028
USD 2 89.46 +5.71 +6.8% 12.93% 75.00 9/25/15 111.80 4/30/15
3 PERU Republic of Peru 6 2/2029
PEN 5 89.80 +4.31 +5.0% 7.77% 85.40 9/9/15 104.05 1/29/15
4 URUGAY Oriental Republic of Uruguay 4 7/2030
USD 5 80.00 +2.00 +2.6% - 73.77 9/29/15 98.90 1/8/15
5 BLZE Belize 5 2/2038 USD 3 73.25 +1.75 +2.4% 15.74% 68.00 10/5/15 76.00 6/24/15
EMEA
1 NGERIA Federal Republic of Nigeria 12.1493 7/2034
NGN 4 109.72 +22.47 +25.8% 14.09% 79.00 10/6/15 109.72 11/30/15
2 RUSSIA Russian Federation 6.9 2/2036
RUB 4 76.50 +10.96 +16.7% 10.83% 55.00 1/14/15 77.00 11/24/15
3 GREECE Hellenic Republic 3 2/2023
EUR 2 77.75 +2.57 +3.4% 7.97% 35.14 7/8/15 79.99 11/19/15
4 UKIN United Kingdom of Great Britain and Northern Ireland 3.5 7/2068
GBP 1 132.87 +3.96 +3.1% 2.51% 120.19 7/14/15 148.26 1/30/15
5 ZAMBIA Republic of Zambia 5.375 9/2022
USD 1 76.50 +2.12 +2.9% 10.73% 69.77 10/1/15 95.15 12/1/14
APAC
1 SRILAN Democratic Socialist Republic of Sri Lanka 5.35 3/2026
LKR 5 72.13 +5.61 +8.4% 10.81% 66.05 10/27/15 77.32 12/1/14
2 KAZAKS Republic of Kazakhstan 4.875 10/2044
USD 2 85.50 +3.50 +4.3% 6.22% 75.62 8/24/15 94.75 4/29/15
3 INDON Republic of Indonesia 6.625 5/2033
IDR 2 80.42 +2.03 +2.6% 9.12% 72.34 9/30/15 93.43 2/5/15
4 TGB Taiwan, Province of China 2.25 8/2045
TWD 4 106.70 +2.51 +2.4% 2.06% 101.65 9/15/15 106.70 11/30/15
5 PHILIP Republic of the Philippines 3.9 11/2022
USD 2 98.32 +1.07 +1.1% 4.36% 96.75 10/1/15 102.14 3/18/15
Source: Markit
Global fixed income pricing research
24
Table 14: November sovereign bond worst price performance
Worst performers
Ticker Issue CCY
Liq score
11/30 price Change
% change
11/30 yield
One year low Date
One year high Date
Americas
1 COSTAR Republic of Costa Rica 7.158 3/2045
USD 2 87.00 -3.75 -4.1% 7.98% 86.75 9/30/15 107.00 4/20/15
2 COLOM Republic of Colombia 4.75 2/2023
COP 3 105.76 -3.97 -3.6% - 104.70 9/30/15 113.04 1/30/15
3 REPUOFAI Republic of Paraguay 6.1 8/2044
USD 3 98.38 -3.12 -3.1% 5.99% 98.00 10/14/15 111.75 2/3/15
4 MEX United Mexican States 4 3/2115
EUR 2 87.60 -2.46 -2.7% 4.45% 82.00 9/29/15 104.38 4/14/15
5 PERU Republic of Peru 5.625 11/2050
USD 2 105.90 -2.85 -2.6% 5.09% 102.00 9/29/15 124.25 2/2/15
EMEA
1 EGYPT Arab Republic of Egypt 6.875 4/2040
USD 2 81.00 -8.87 -9.9% 7.81% 81.00 11/30/15 106.40 12/4/14
2 BTUN Tunisian Republic 5.75 1/2025
USD 2 88.25 -5.25 -5.6% 6.70% 88.25 11/30/15 104.25 4/13/15
3 LEBAN Lebanese Republic 6.75 11/2027
USD 2 96.63 -4.13 -4.1% 6.66% 96.50 11/26/15 105.25 4/28/15
4 MOROC Kingdom of Morocco 5.5 12/2042
USD 2 96.50 -4.00 -4.0% 5.46% 96.25 11/27/15 113.00 2/6/15
5 TURKEY Republic of Turkey 4.875 4/2043
USD 2 87.25 -2.95 -3.3% 5.58% 82.13 9/29/15 105.50 1/29/15
APAC
1 PHILIP Republic of the Philippines 3.625 3/2033
PHP 4 86.31 -5.47 -6.0% 4.30% 83.07 11/20/15 101.33 2/3/15
2 BHREIN Kingdom of Bahrain 5.5 3/2020
USD 1 100.75 -5.25 -5.0% 4.00% 100.25 11/19/15 110.25 2/6/15
3 NZ New Zealand 2.5 9/2035 NZD 4 98.65 -4.34 -4.2% - 97.82 6/4/15 113.22 1/30/15
4 PHILIP Republic of the Philippines 7.625 9/2036
PHP 3 128.21 -4.88 -3.7% 5.05% 126.90 11/27/15 155.65 2/6/15
5 IGB Republic of India 7.4 9/2035
INR 3 92.75 -3.49 -3.6% 7.77% 91.77 6/17/15 96.74 2/27/15
Source: Markit

Global fixed income pricing research
25
Municipal bonds November was a relatively uneventful month in the broader municipal bond market, as the sector outperformed a large segment of the global fixed income markets this year. The Fed continues to be a primary focus across the sector in the short term, while tax reform proposals alongside next year’s elections will likely drive price volatility in 2016, although few will likely come to fruition before 2017. Distress in Illinois’ and Chicago general obligation bonds put the spot light on state and city pension shortfalls, with some additional tiering in higher shortfall states, like Kentucky and Connecticut, potentially materialising next year in the absence of any major fiscal reforms in those states.
Puerto Rico avoids debt default, for now
Puerto Rico continued to take centre stage after it diverted scarce funds to make a $354m payment to its Government Development Bank (GDB) bondholders on December 1
st, with some market participants
believing that they would choose not to make the sizable payment.
PR’s troubles remain far from over as it had already defaulted on its Public Finance Corporation (PFC) bonds in August. With $72bn of debt outstanding and an economy in a prolonged recession, PR also potentially faces a humanitarian crisis from the deterioration in infrastructure, pensions and utilities if its people continue to bear the debt burden. PR has already stated several times it does not have sufficient funds to continue payments.
The problem lies in the commonwealth’s lack of access to the same bankruptcy laws as states, the Obama administration has proposed an amendment to enable all US commonwealths to obtain similar protections, but so far the US congress has been shy to act ahead of the 2016 election year. Puerto Rico previously enacted its own bankruptcy measure the Recovery Act, in 2014, but that measure was overruled in July by a US appeals court stating that it conflicted with existing federal bankruptcy codes. The US Supreme Court is considering hearing Puerto Rico’s appeal and could potentially reinstate the law.
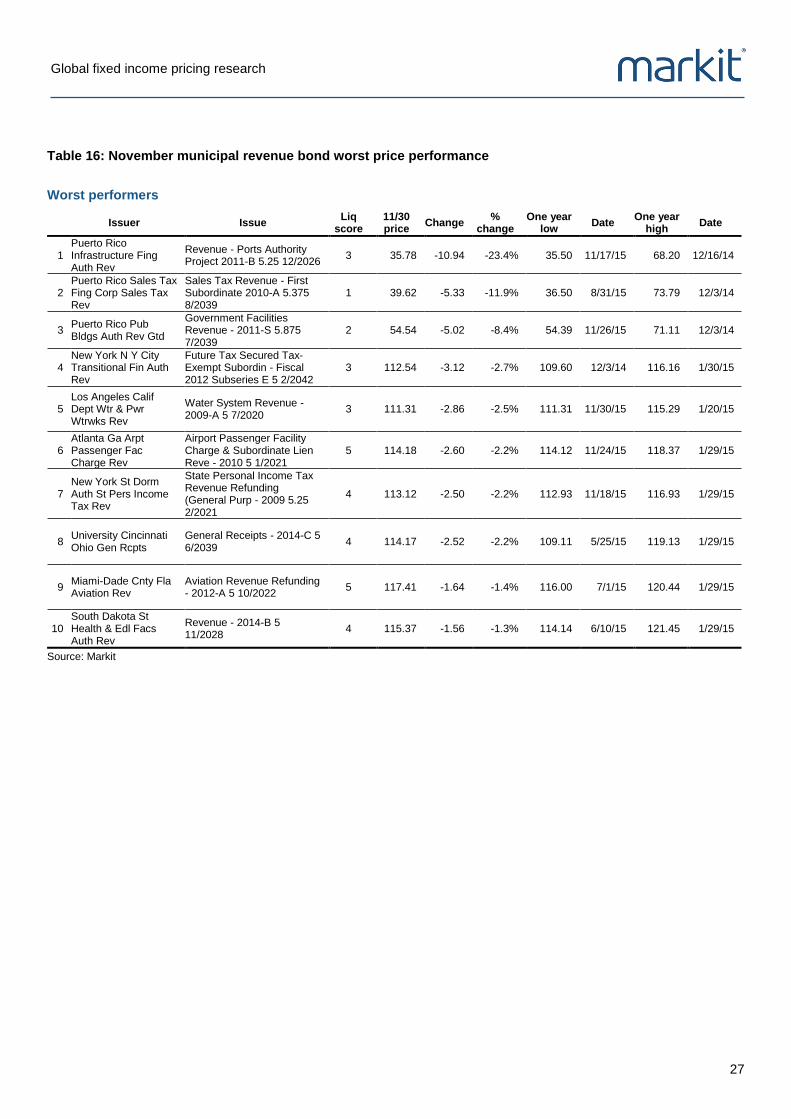
Puerto Rico revenue bonds were amongst the worst performers in November
Issues from Puerto Rico’s Infrastructure Financing Authority, Sales Tax Financing Corporation, and Public Buildings Authority were amongst the worst performers on the month. Puerto Rico’s Infrastructure Financing Authority Revenue - Ports Authority Project 2011-B 5.25 12/2026 was the worst performer on the month, decreasing almost 11% to end the month at a 35.78 dollar price. The bond’s price has decreased almost 50% since last December. Puerto Rico Sales Tax
Financing Corporation Sales Tax Revenue Sales Tax Revenue - First Subordinate 2010-A 5.375 8/2039 ended the month 11% lower to close at a 39.62 dollar price, which is more than 3pts higher than its one year low reached on August 31
st.

Global fixed income pricing research
26
Table 15: November municipal revenue bond best price performance
Best performers
Issuer Issue
Liq score
11/30 price Change % change
One year low Date
One year high Date
1 Columbia S C Wtrwks & Swr Sys Rev
Waterworks And Sewer System Revenue - 2011-A 5 2/2031
5 115.25 +4.10 +3.7% 109.77 6/10/15 118.01 1/30/15
2 New York St Dorm Auth Revs Non St Supported Debt
New York University Revenue - 2015-A 5 7/2031
5 119.30 +3.84 +3.3% 112.99 6/10/15 119.30 11/30/15
3 Lower Colo Riv Auth Tex Rev
Refunding Revenue - 2015-B 5 5/2030
4 116.25 +3.17 +2.8% 109.88 6/3/15 116.25 11/30/15
4 New York N Y City Transitional Fin Auth Rev
Future Tax Secured Tax-Exempt Subordin - Fiscal 2013 Subseries F 5 2/2031
3 116.59 +3.15 +2.8% 111.96 6/10/15 119.42 1/30/15
5 Oxnard Calif Fing Auth Lease Rev
Lease Revenue Refunding - 2011 5.75 6/2036
5 114.65 +3.09 +2.8% 106.64 5/25/15 114.65 11/30/15
6 Midland Cnty Tex Fresh Wtr Supply Dist No 1 Rev
Revenue Refunding - City Of Midland Project 2012 5 9/2031
5 115.24 +3.00 +2.7% 110.26 6/3/15 119.17 1/30/15
7 Long Beach Calif Hbr Rev
Harbor Revenue Refunding - 2010-B 5 5/2025
3 118.23 +2.92 +2.5% 111.50 5/25/15 118.23 11/30/15
8 University Utah Univ Revs
General Revenue And Refunding - 2015 A-1 5 8/2030
5 118.56 +2.81 +2.4% 113.43 6/10/15 122.71 1/30/15
9 Metropolitan Transn Auth N Y Rev
Transportation Revenue - 2013-A 5 11/2032
4 116.46 +2.75 +2.4% 110.79 6/10/15 117.75 1/30/15
10 Regional Transn Dist Colo Sales Tax Rev
Sales Tax Revenue Refunding - Fastracks Project 2013-A 5 11/2029
4 123.90 +2.84 +2.3% 116.31 6/3/15 131.25 1/29/15
Source: Markit
Global fixed income pricing research
27
Table 16: November municipal revenue bond worst price performance
Worst performers
Issuer Issue
Liq score
11/30 price
Change %
change One year
low Date
One year high
Date
1 Puerto Rico Infrastructure Fing Auth Rev
Revenue - Ports Authority Project 2011-B 5.25 12/2026
3 35.78 -10.94 -23.4% 35.50 11/17/15 68.20 12/16/14
2 Puerto Rico Sales Tax Fing Corp Sales Tax Rev
Sales Tax Revenue - First Subordinate 2010-A 5.375 8/2039
1 39.62 -5.33 -11.9% 36.50 8/31/15 73.79 12/3/14
3 Puerto Rico Pub Bldgs Auth Rev Gtd
Government Facilities Revenue - 2011-S 5.875 7/2039
2 54.54 -5.02 -8.4% 54.39 11/26/15 71.11 12/3/14
4 New York N Y City Transitional Fin Auth Rev
Future Tax Secured Tax-Exempt Subordin - Fiscal 2012 Subseries E 5 2/2042
3 112.54 -3.12 -2.7% 109.60 12/3/14 116.16 1/30/15
5 Los Angeles Calif Dept Wtr & Pwr Wtrwks Rev
Water System Revenue - 2009-A 5 7/2020
3 111.31 -2.86 -2.5% 111.31 11/30/15 115.29 1/20/15
6 Atlanta Ga Arpt Passenger Fac Charge Rev
Airport Passenger Facility Charge & Subordinate Lien Reve - 2010 5 1/2021
5 114.18 -2.60 -2.2% 114.12 11/24/15 118.37 1/29/15
7 New York St Dorm Auth St Pers Income Tax Rev
State Personal Income Tax Revenue Refunding (General Purp - 2009 5.25 2/2021
4 113.12 -2.50 -2.2% 112.93 11/18/15 116.93 1/29/15
8 University Cincinnati Ohio Gen Rcpts
General Receipts - 2014-C 5 6/2039
4 114.17 -2.52 -2.2% 109.11 5/25/15 119.13 1/29/15
9 Miami-Dade Cnty Fla Aviation Rev
Aviation Revenue Refunding - 2012-A 5 10/2022
5 117.41 -1.64 -1.4% 116.00 7/1/15 120.44 1/29/15
10 South Dakota St Health & Edl Facs Auth Rev
Revenue - 2014-B 5 11/2028
4 115.37 -1.56 -1.3% 114.14 6/10/15 121.45 1/29/15
Source: Markit
Global fixed income pricing research
28
Securitised products The securitised product markets continued to see weaker liquidity in November, as investors continue to reassess and reposition ahead of an anticipated Fed rate increase at the December meeting. The market’s challenge is trying to determine whether the current liquidity doldrums is the typical year-end securitisation market slowdown in trading activity, or the progression of a downward credit cycle that will see increased corporate defaults in 2016.
Unusually low swap spreads is spurring some discussions to revisit its use as a benchmark
Unusually low (negative) swap spreads to Treasuries is causing the market to revisit the use of swaps as the benchmark, since switching from US Treasuries in 2000 for a large portion of the fixed-rated securitisation market. The anomalies in the interest rate swaps market are likely driven by changes in structural and technical factors like the move to centralised swap clearing, declines in dealer balance sheets, and record high corporate issuance.
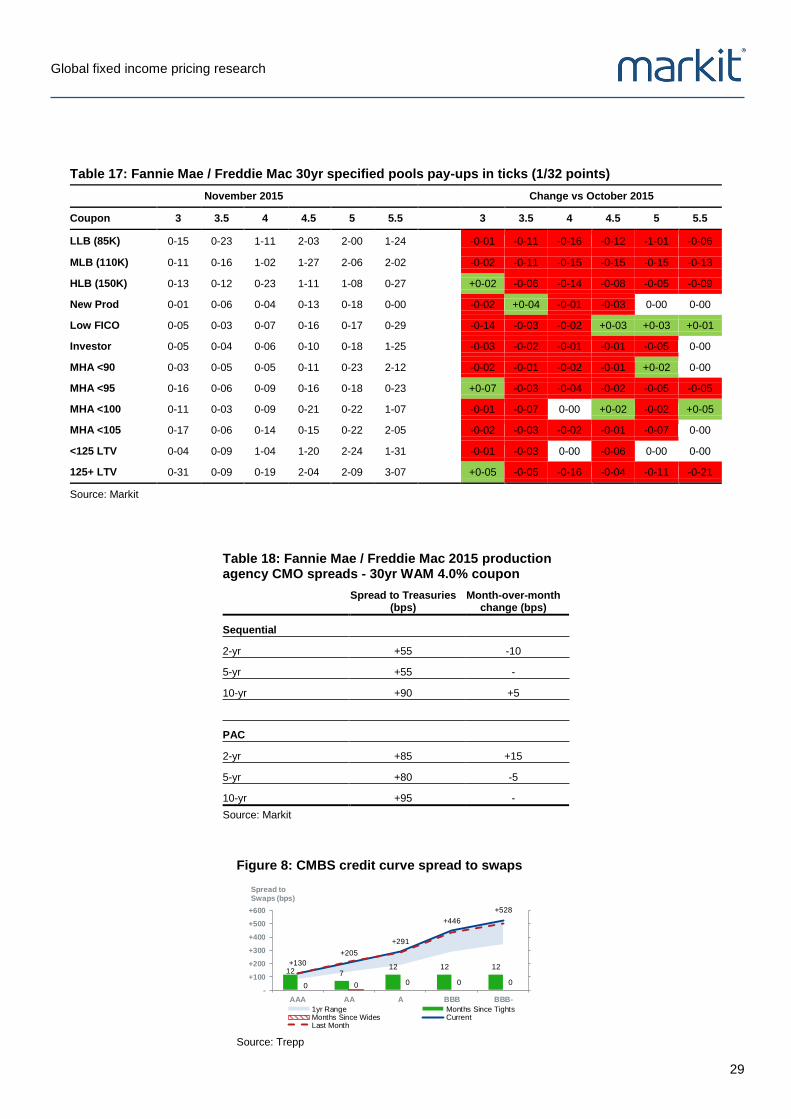
Agency MBS market generally optimistic, but most pay-ups are lower in November
The market appears to remain most optimistic about the agency MBS market, as a gradual Fed increase will likely benefit the sector through decreases in prepayments, increased bank purchases and lower interest rate volatility. However, the increase in rates has driven specified pool pay-ups lower across most story types in November (Table 17), as the impact of those collateral features will be tempered by the decreases in rate refinance incentives.
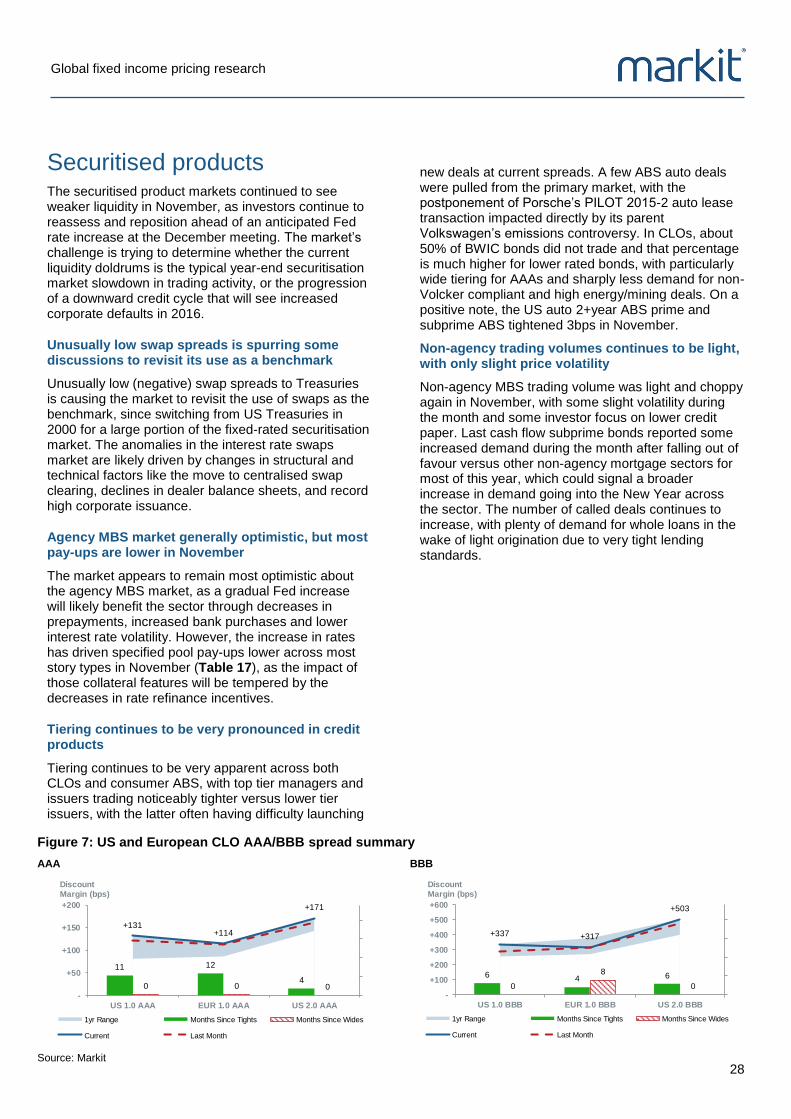
Tiering continues to be very pronounced in credit products
Tiering continues to be very apparent across both CLOs and consumer ABS, with top tier managers and issuers trading noticeably tighter versus lower tier issuers, with the latter often having difficulty launching
new deals at current spreads. A few ABS auto deals were pulled from the primary market, with the postponement of Porsche’s PILOT 2015-2 auto lease transaction impacted directly by its parent Volkswagen’s emissions controversy. In CLOs, about 50% of BWIC bonds did not trade and that percentage is much higher for lower rated bonds, with particularly wide tiering for AAAs and sharply less demand for non-Volcker compliant and high energy/mining deals. On a positive note, the US auto 2+year ABS prime and subprime ABS tightened 3bps in November.
Non-agency trading volumes continues to be light, with only slight price volatility
Non-agency MBS trading volume was light and choppy again in November, with some slight volatility during the month and some investor focus on lower credit paper. Last cash flow subprime bonds reported some increased demand during the month after falling out of favour versus other non-agency mortgage sectors for most of this year, which could signal a broader increase in demand going into the New Year across the sector. The number of called deals continues to increase, with plenty of demand for whole loans in the wake of light origination due to very tight lending standards.
Figure 7: US and European CLO AAA/BBB spread summary
AAA BBB
11 12
40 0 0
+131+114
+171
-
+50
+100
+150
+200
US 1.0 AAA EUR 1.0 AAA US 2.0 AAA
Discount Margin (bps)
1yr Range Months Since Tights Months Since Wides
Current Last Month
6 4 6
0
8
0
+337 +317
+503
-
+100
+200
+300
+400
+500
+600
US 1.0 BBB EUR 1.0 BBB US 2.0 BBB
Discount Margin (bps)
1yr Range Months Since Tights Months Since Wides
Current Last Month
Source: Markit
Global fixed income pricing research
29
Table 17: Fannie Mae / Freddie Mac 30yr specified pools pay-ups in ticks (1/32 points)
November 2015 Change vs October 2015
Coupon 3 3.5 4 4.5 5 5.5
3 3.5 4 4.5 5 5.5
LLB (85K) 0-15 0-23 1-11 2-03 2-00 1-24
-0-01 -0-11 -0-16 -0-12 -1-01 -0-06
MLB (110K) 0-11 0-16 1-02 1-27 2-06 2-02
-0-02 -0-11 -0-15 -0-15 -0-15 -0-13
HLB (150K) 0-13 0-12 0-23 1-11 1-08 0-27
+0-02 -0-06 -0-14 -0-08 -0-05 -0-09
New Prod 0-01 0-06 0-04 0-13 0-18 0-00
-0-02 +0-04 -0-01 -0-03 0-00 0-00
Low FICO 0-05 0-03 0-07 0-16 0-17 0-29
-0-14 -0-03 -0-02 +0-03 +0-03 +0-01
Investor 0-05 0-04 0-06 0-10 0-18 1-25
-0-03 -0-02 -0-01 -0-01 -0-05 0-00
MHA <90 0-03 0-05 0-05 0-11 0-23 2-12
-0-02 -0-01 -0-02 -0-01 +0-02 0-00
MHA <95 0-16 0-06 0-09 0-16 0-18 0-23
+0-07 -0-03 -0-04 -0-02 -0-05 -0-05
MHA <100 0-11 0-03 0-09 0-21 0-22 1-07
-0-01 -0-07 0-00 +0-02 -0-02 +0-05
MHA <105 0-17 0-06 0-14 0-15 0-22 2-05
-0-02 -0-03 -0-02 -0-01 -0-07 0-00
<125 LTV 0-04 0-09 1-04 1-20 2-24 1-31
-0-01 -0-03 0-00 -0-06 0-00 0-00
125+ LTV 0-31 0-09 0-19 2-04 2-09 3-07
+0-05 -0-05 -0-16 -0-04 -0-11 -0-21
Source: Markit
Table 18: Fannie Mae / Freddie Mac 2015 production agency CMO spreads - 30yr WAM 4.0% coupon
Spread to Treasuries (bps)
Month-over-month change (bps)
Sequential
2-yr +55 -10
5-yr +55 -
10-yr +90 +5
PAC
2-yr +85 +15
5-yr +80 -5
10-yr +95 -
Source: Markit
Figure 8: CMBS credit curve spread to swaps
12 712 12 12
0 0 0 0 0
+130
+205
+291
+446
+528
-
+100
+200
+300
+400
+500
+600
AAA AA A BBB BBB-
Spread to Swaps (bps)
1yr Range Months Since TightsMonths Since Wides CurrentLast Month
Source: Trepp
Global fixed income pricing research
30
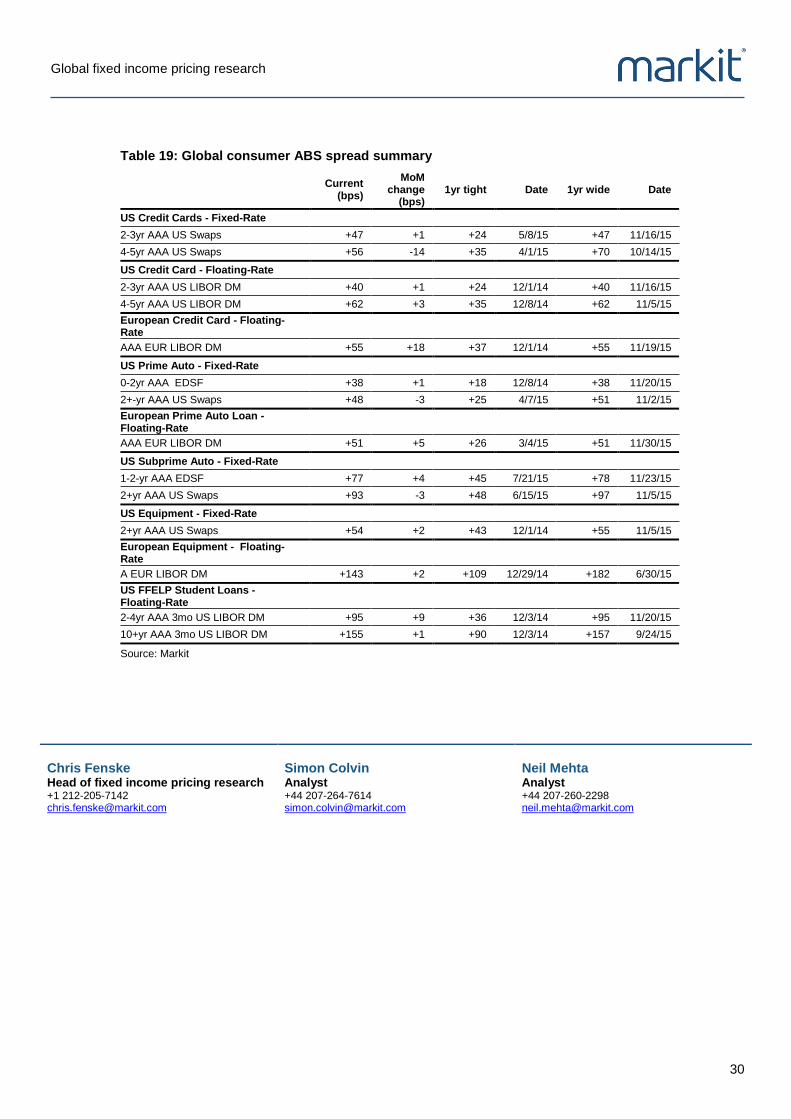
Table 19: Global consumer ABS spread summary
Current
(bps)
MoM change
(bps) 1yr tight Date 1yr wide Date
US Credit Cards - Fixed-Rate
2-3yr AAA US Swaps +47 +1 +24 5/8/15 +47 11/16/15
4-5yr AAA US Swaps +56 -14 +35 4/1/15 +70 10/14/15
US Credit Card - Floating-Rate
2-3yr AAA US LIBOR DM +40 +1 +24 12/1/14 +40 11/16/15
4-5yr AAA US LIBOR DM +62 +3 +35 12/8/14 +62 11/5/15
European Credit Card - Floating-Rate AAA EUR LIBOR DM +55 +18 +37 12/1/14 +55 11/19/15
US Prime Auto - Fixed-Rate
0-2yr AAA EDSF +38 +1 +18 12/8/14 +38 11/20/15
2+-yr AAA US Swaps +48 -3 +25 4/7/15 +51 11/2/15
European Prime Auto Loan - Floating-Rate AAA EUR LIBOR DM +51 +5 +26 3/4/15 +51 11/30/15
US Subprime Auto - Fixed-Rate
1-2-yr AAA EDSF +77 +4 +45 7/21/15 +78 11/23/15
2+yr AAA US Swaps +93 -3 +48 6/15/15 +97 11/5/15
US Equipment - Fixed-Rate
2+yr AAA US Swaps +54 +2 +43 12/1/14 +55 11/5/15
European Equipment - Floating-Rate A EUR LIBOR DM +143 +2 +109 12/29/14 +182 6/30/15
US FFELP Student Loans - Floating-Rate 2-4yr AAA 3mo US LIBOR DM +95 +9 +36 12/3/14 +95 11/20/15
10+yr AAA 3mo US LIBOR DM +155 +1 +90 12/3/14 +157 9/24/15
Source: Markit
Chris Fenske Head of fixed income pricing research +1 212-205-7142 [email protected]
Simon Colvin Analyst +44 207-264-7614 [email protected]
Neil Mehta Analyst +44 207-260-2298 [email protected]
Global fixed income pricing research
31
The intellectual property rights to this report provided herein are owned by Markit Group limited. Any unauthorised use, including but not limited to copying, distributing, transmitting or otherwise of any data appearing is not permitted without Markit’s prior consent. Markit shall not have any liability, duty or obligation for or relating to the content or information (“data”) contained herein, any errors, inaccuracies, omission or delays in the data, or for any actions taken in reliance thereon. In no event shall Markit be liable for any special, incidental, consequential damages, arising out of the use of the data. Markit is a trademark owned by the Markit group. This report does not constitute nor shall it be construed as an offer by Markit to buy or sell any particular security, financial instrument or financial service. Markit provides a variety of services and products to various clients, including the issuers of securities that Markit may refer to in this report. Markit receives compensation and fees in connection with these services and products. The analysis provided in this report is of a general and impersonal nature. Such analysis is based on data derived from Markit’s proprietary products that are offered for sale by Markit. Data from third party sources may yield different results. This report shall not be construed as investment advice and the data contained herein has not been adapted to, and is not intended for use in, any particular investment strategy or portfolio. Markit makes no representations that the data contained herein is appropriate for any investor or investment strategy. This report does not establish a fiduciary relationship between Markit and any recipient of this report, and Markit disclaims any fiduciary duties in that regard. This report does not and shall not be construed as providing any recommendations as to whether it is appropriate for any person or entity to “buy”, “sell” or “hold” a particular investment.