global equity insights survey 2019— looking back to the future€¦ · dr. jan dörrwächter,...
TRANSCRIPT

Dr. Jan Dörrwächter, Senior Partner, hkp/// groupSheila Frierson, President US Plan Managers, Computershare
Fiona Montgomery, Solutions Architect, FidelityMarc Muntermann, Head of Top Management Compensation & Equity, Siemens AG
Sandra Sussman, Global Equity Design & Strategy, SAP SEDavid Voggeser, Senior Manager, hkp/// group
Global Equity Insights Survey 2019—Looking Back to the Future
©2019 Global Equity Organization Page 1
Survey Information
©2019 Global Equity Organization Page 2

Global Equity Insights Survey –a success story for market intelligence since 2013 The Global Equity Insights Survey is the seventh edition in a row:
Global Equity InsightsYear 2013 2014 2015 2016 2017 2018 2019
Topics
Questions 204 117 34 50 71 67 82
Participants 133 169 144 148 163 154 148
LTIP
ESPP
SOG
Equity Admin
LTIP
ESPP
SOG
Equity Admin
LTIP
Broad-based LTIP
LTIP
Equity Admin
LTIP
SPP
Admin & Communi-
cation
LTIP
SPP
Administration
Communication
Regulation
LTIP
SPP
Individualiza-tion & flexibility
Communication
©2019 Global Equity Organization Page 3
Long-Term Incentives (LTI)
©2019 Global Equity Organization Page 4

LTI spreads further In middle management, over 80% (compared to 70% in 2018) are now eligible for
LTIs. We also observe a further increase in the key functions, with over 65% in 2019
compared to 55% in 2018:
89%78%
62%45%
96%84%
48%35%
98%89%
61%
40%
98% 92%
55%
34%
97% 92%
70%55%
98% 95%82%
66%
Executives Senior Management Middle Management Other Key Employees
LTI eligibility(in % of companies)
2014 2015 2016 2017 2018 2019
©2019 Global Equity Organization Page 5

Which cultural changes and positive effects from higher LTIP do you expect??
LTIP portion (pay mix)
©2019 Global Equity Organization Page 6

SOGs mandatory for Management Board
Almost all companies have implemented SOGs for their Management Board (over 90%), and a majority also for executives (65%).
At the senior management level, 16% of companies have implemented SOGs:
91%
65%
16%4% 4%
97%
53%
18%3% 3%
85%70%
10% 3% 5%
94%76%
29%12% 6%
Management board Executives Senior management Middle management Other (key) employees
Prevalence of Share Ownership Guidelines(in % of companies)
Total Europe North America Rest of World
©2019 Global Equity Organization Page 7

The majority tracks the SOG's through employee responsibility or software
SOG fulfillments are usually checked by self-reporting / in-house software or by the external banking provider.
37%31%
23%9%
42%
22% 22%14%
24%
50%
26%
0%
59%
6%18% 18%
Yes, by self-reporting Yes, by in-house software Yes, by accounts maintained atdesignated bank / broker
No tracking
Tracking of Share Ownership Guidelines (SOGs)(in % of companies)
Total Europe North America Rest of World
©2019 Global Equity Organization Page 8

Compliance with SOGs is not quite at target
While 63% of companies reported a fulfillment rate of over 80%, 37% of companies reported an SOG fulfillment rate at significantly lower levels:
6% 9% 6%15%
63%
11% 11%4%
11%
63%
3% 5%11% 14%
68%
7%14%
0%
29%
50%
0%-20% 21%-40% 41%-60% 61%-80% 81%-100%
Fulfillment of Share Ownership Guidelines (SOGs)(in % of companies)
Total Europe North America Rest of World
©2019 Global Equity Organization Page 9

Why aren’t SOGs consistently defined for all LTI-eligible employees?
SOGs
Would you rather trust self-reporting or software to track SOG fulfillment??
©2019 Global Equity Organization Page 10

Offering LTIs in China is seen as important Only 12% of the active companies in China have decided not to proceed with offering
their LTI to employees in China. This increases to 21% for companies in other economic regions (ROW):
18%12%
70%
15%9%
76%
20%13%
67%
17% 21%
63%
No, we do not operate in China No, we operate in China but we do not offerplans for employees in China
Yes
LTIP in China(in % of companies)
Total Europe North America Rest of World
©2019 Global Equity Organization Page 11

Save with SAFE? Across all economic regions, roughly half of all companies reported having submitted a
SAFE Filing in China:
50%
19%
31%
49%
27%
24%
51%
14%
35%
50%
11%
39%
Yes
No
NA
SAFE Filing in China(in % of companies)
Total Europe North America Rest of World
©2019 Global Equity Organization Page 12

LTIPs in China
Why are LTIPs so important for Chinese employees??
All the hassle with SAFE – is it worth the effort??
What key considerations from your experience can you share for successfully implementing an LTIP in China??
How many issuers in the room are active in China? How many consider entering China with their plans?
©2019 Global Equity Organization Page 13

Share Purchase Plans (SPP)
©2019 Global Equity Organization Page 14

European companies seem to consider local requirements more often Over 60% of European companies adapt SPPs based on local requirements or tax
qualifications, whereas only about 30% of American companies do this:
52%
25%
8% 1%14%
38% 35%
11%3%
14%
71%
14%7%
0%7%
50%
21%
0% 0%
29%
No, we have one globalplan
Yes, for tax qualification Yes, for fulfilling legalrequirements
Yes, for countries whereminimum contributions
are prohibitory
Yes, for other reasons
Country-specific Share Purchase Plans(in % of companies)
Total Europe North America Rest of World
©2019 Global Equity Organization Page 15

“Make your employees entrepreneurs” is a main objective for companies worldwide SPPs are most often introduced in order to promote various forms of entrepreneurship
("Share ownership" / "Employee engagement", etc.):
58%
48%
46%
26%
25%
25%
18%
18%
15%
11%
30%
34%
42%
40%
35%
34%
38%
40%
39%
25%
7%
14%
8%
31%
30%
25%
27%
23%
31%
50%
1%
3%
2%
8%
8%
15%
12%
11%
11%
3%
3%
2%
2%
2%
9%
2%
7%
3%
4%
Share ownership
Identification with the company
Employee engagement
Motivation
Retention
Profit sharing / performance sharing
Stay competitive paywise
Talent acquisition & Employer Branding
Best market pay practice
Strategy
Objectives for implementing Share Purchase Plans(in % of total companies)
very high high moderate low very low
©2019 Global Equity Organization Page 16

Objectives for implementing SPPs
Can you see a difference in companies / BUs with and without SPPs??
Is adaptation to local requirements appreciated by local employees??
©2019 Global Equity Organization Page 17

North American employees invest the most At the median, employees in North American companies contribute on average 8% of
their base salary annually:
4%
5%
10%
2%
5%
10%
4%
8%
10%
0%
5%
6%
First Quartile
Median
Third Quartile
Average contribution rate(in % of employees' base salary)
Total Europe North America Rest of World
©2019 Global Equity Organization Page 18

Employees of North American companies hold more share capital of their company While 2% of the share capital is employee-owned from SPPs at the median, employees
of North American companies tend to hold even more share capital (3%):
1%
2%
3%
2%
2%
2%
1%
3%
4%
1%
1%
4%
First Quartile
Median
Third Quartile
Share capital held by employees under Share Purchase Plans(in % of total shares outstanding)
Total Europe North America Rest of World
©2019 Global Equity Organization Page 19
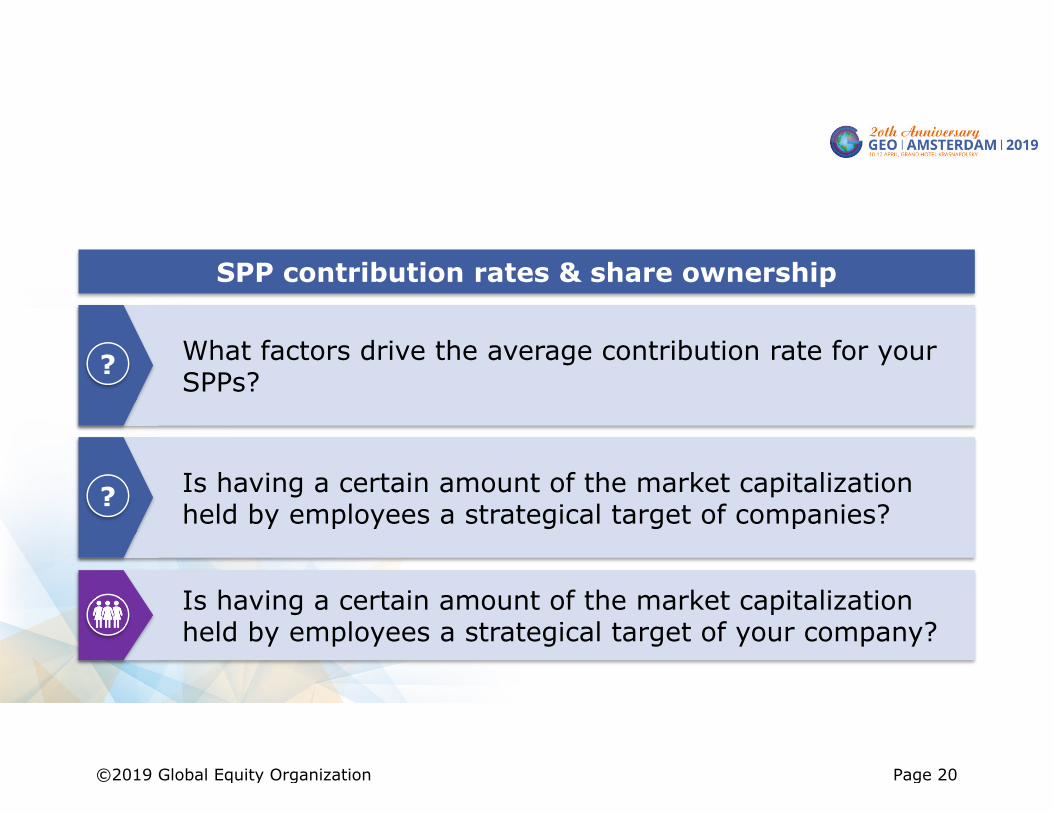
SPP contribution rates & share ownership
What factors drive the average contribution rate for your SPPs??
Is having a certain amount of the market capitalization held by employees a strategical target of companies??
Is having a certain amount of the market capitalization held by employees a strategical target of your company?
©2019 Global Equity Organization Page 20

Individualization & Flexibility
©2019 Global Equity Organization Page 21

LTI – Make it your choice? Of companies that operate more than one LTI Plan, 10% of companies reported
allowing their participants to choose their LTI plan:
10%
10%
11%
7%
Total
Europe
North America
Rest of World
Companies allowing participants to choose between different LTI plan types(in % of companies with more than one LTI plan type)
Total Europe North America Rest of World
©2019 Global Equity Organization Page 22

Pay mix is not a choice Less than 2% of all companies allow LTI participants to define for themselves the
amount of the LTI share in their Total Compensation package:
1,8%
2,0%
2,3%
0,0%
Total
Europe
North America
Rest of World
Companies allowing participant to define how much of their Total Compensation package should be defined by an LTI
(in % of companies)
Total Europe North America Rest of World
©2019 Global Equity Organization Page 23

If there is a choice: What are the results, what are the advantages??
LTIP choice
Who in the room would like to give employees a choice when it comes to LTI-plans?
©2019 Global Equity Organization Page 24

LTIPs are used as more than just another compensation element 65% of all companies apply LTI grants outside the normal annual compensation
package, and the vast majority of companies in North America does so:
65%
50%
84%
55%
Total
Europe
North America
Rest of World
Companies allowing LTI grants outside of annual compensation(in % of companies)
Total Europe North America Rest of World
©2019 Global Equity Organization Page 25

What are the most prevalent reasons for applying grants outside of the normal compensation cycle and have they been successful?
?
Extraordinary LTI grants
©2019 Global Equity Organization Page 26

More European companies plan to further standardize their Equity plans Nearly 40% of European companies plan to further standardize their equity plans,
while only 26% of North American companies plan to do so:
29%
38%
26%
11%
Total
Europe
North America
Rest of World
Planning of standardization of LTI plans(in % of companies)
Total Europe North America Rest of World
©2019 Global Equity Organization Page 27

More standardization or more individualization – what is the future??
LTIP Standardization
Is your company planning more standardization of equity plans (LTI and/or share purchase plan) due to digitalization?
©2019 Global Equity Organization Page 28

Most companies do not distinguish between industry and jurisdiction About 20% of the participants distinguish between different industries (and
jurisdictions) with regard to LTI plan design.
80%
7% 7%2% 2%
76%
8% 8%3% 5%
85%
6% 6% 3% 0%
83%
8% 8%
0% 0%
No Yes, we already havedifferentiated LTI plans for
specific industries
Yes, we already havedifferentiated LTI plans for
specific jurisdictions
Yes, we plan on introducingdifferentiated LTI plans for
specific industries
Yes, we plan on introducingdifferentiated LTI plans for
specific jurisdictions
Differentiation by industry / jurisdiction(in % of companies)
Total Europe North America Rest of World
©2019 Global Equity Organization Page 29

Different LTI plans across the world
14
31
72
15
78
24
9
28
1
1
Tax optimized
Change in plantype
Change insettlement type
Change in vesting
Other change
Country adaptation for equity plans (in number of responses)
LTI SPP
SPPs are adjusted much less frequently than LTI plans. LTI plans are often adjusted by changing the settlement type and by ‘other changes.’
SPPs are mostly adapted to achieve tax optimization. Companies reported making adjustments especially in France, Israel and the UK:
©2019 Global Equity Organization Page 30

Why do so many companies maintain a standardized approach to their LTIPs? ?
LTIP Differentiation
©2019 Global Equity Organization Page 31

Communication
©2019 Global Equity Organization Page 32

“You’ve got mail” is still the most used communications tool While e-mails are still the most important means of information, other digital means of
information are becoming increasingly important. This includes digital brochures or flyers as well as the intranet.
24%21%
17%
10%9% 9% 8%
1% 0%
23%22%
19%
11%8%
10%
6%
1% 1%
25%
21%
17%
9%11%
7%10%
1% 0%
23% 22%
12% 12%
7% 9% 10%
2% 1%
Emails Electronic: Letters /brochures / flyers
Intranet Printed: Letters /brochures / flyers
Image videos Mobile / web solutions Workshops / Roadshows Social media (such asFacebook)
Other
Communication tools(in % of companies)
Total Europe North America Rest of World
©2019 Global Equity Organization Page 33

How has the equity communications landscape changed over the past years and which generates the most added value today? ?
Communication tools
Who is using “social media” for communication purpose?
©2019 Global Equity Organization Page 34
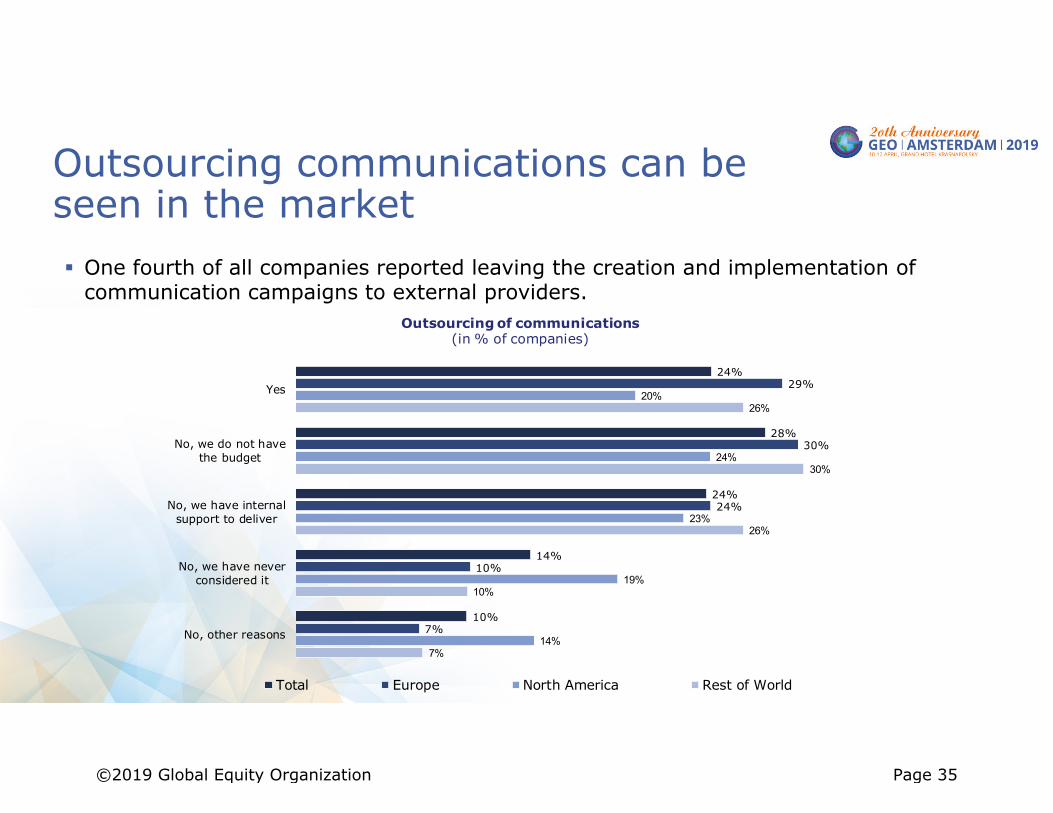
Outsourcing communications can be seen in the market One fourth of all companies reported leaving the creation and implementation of
communication campaigns to external providers.
24%
28%
24%
14%
10%
29%
30%
24%
10%
7%
20%
24%
23%
19%
14%
26%
30%
26%
10%
7%
Yes
No, we do not havethe budget
No, we have internalsupport to deliver
No, we have neverconsidered it
No, other reasons
Outsourcing of communications(in % of companies)
Total Europe North America Rest of World
©2019 Global Equity Organization Page 35

When would it make sense to at least partially outsource equity communications??
Outsourcing of Communication
©2019 Global Equity Organization Page 36

Financial education is an important topic in America In the context of communication, financial education continues to be much more
important in the North America than in Europe.
63%
4% 6% 4%
22%
47%
6% 6% 6%
34%
76%
4%9%
2%
9%
68%
0% 0%5%
26%
Yes No, executives do not need it No, we have no all-employeeshare plans
No, our all-employee plans arevery small
No, other reasons
Priority of financial education(in % of companies)
Total Europe North America Rest of World
©2019 Global Equity Organization Page 37

Why is financial education so important??
Priority of financial education
©2019 Global Equity Organization Page 38

Thank YouDr. Jan Dörrwächter
hkp/// [email protected]
Marc MuntermannSiemens AG
David Voggeserhkp/// group
Fiona MontgomeryFidelity
Sandra SussmanSAP SE
Sheila FriersonComputerShare
©2019 Global Equity Organization Page 39

Thank YouThank you for attending GEO’s 20th Annual Conference in Amsterdam, The Netherlands. We hope you enjoyed this session. • If you require CPE Credit, don’t forget to Sign Out• Two ways to give us your feedback on this session
o Mobile appo Paper surveys available at the door
©2019 Global Equity Organization Page 40