global epidemiology of non-typhoidal salmonella …orbit.dtu.dk/files/5208629/phd_thesis_rshe_281209...
TRANSCRIPT
General rights Copyright and moral rights for the publications made accessible in the public portal are retained by the authors and/or other copyright owners and it is a condition of accessing publications that users recognise and abide by the legal requirements associated with these rights.
• Users may download and print one copy of any publication from the public portal for the purpose of private study or research. • You may not further distribute the material or use it for any profit-making activity or commercial gain • You may freely distribute the URL identifying the publication in the public portal
If you believe that this document breaches copyright please contact us providing details, and we will remove access to the work immediately and investigate your claim.
Downloaded from orbit.dtu.dk on: Sep 16, 2018
Global epidemiology of non-typhoidal Salmonella infections in humans
Hendriksen, Rene S.; Aarestrup, Frank Møller; Wegener, Henrik Caspar
Publication date:2010
Document VersionPublisher's PDF, also known as Version of record
Link back to DTU Orbit
Citation (APA):Hendriksen, R. S., Aarestrup, F. M., & Wegener, H. C. (2010). Global epidemiology of non-typhoidal Salmonellainfections in humans. Kgs. Lyngby, Denmark: Technical University of Denmark (DTU).
René HendriksenPhD ThesisJanuary 2010
Global epidemiology of non-typhoidal Salmonella infections in humans

National Food Institute
Technical University of Denmark
Mørkhøj Bygade 19
DK-2860 Søborg
Tel +45 35 88 70 00
Fax +45 35 88 70 01
www.food.dtu.dk
ISBN: 978-87-92158-61-1
SUPERVISORS AND FUNDING The research has been conducted entirely at the National Food Institute, Technical University of
Denmark in collaboration with 29 co-authors from 15 research institutes in ten countries;
Denmark, the United States, Switzerland, Thailand, Austria, Ireland, the Netherlands, England,
France, and South Korea. The work was supported by a grant 274-05-0117 from the Danish
Research Agency and the World Health Organization Global Salm-Surv
(www.who.int/salmsurv).
Supervisors:
� Institute Director, PhD, Henrik Caspar Wegener, National Food Institute, -Technical
University of Denmark, Denmark.
� Professor, PhD, Frank Møller Aarestrup, Division of Microbiology and Risk Assessment,
National Food Institute, Technical University of Denmark, Denmark.
Assessment Committee:
� Professor, PhD, Jaap Wagenaar, Department of Infectious Diseases and Immunology,
Faculty of Veterinary Medicine, Utrecht University and Central Veterinary Institute of
Wageningen UR, The Netherlands.
� Head of Division, PhD, Bjarke Bak Christensen, Division of Microbiology and Risk
Assessment, National Food Institute, Technical University of Denmark, Denmark.
� Director, PhD, Jørgen Schlundt, Department of Food Safety and Zoonoses, World Health
Organization, Switzerland.
Front-page designed by Susanne Carlsson, National Food Institute, Technical University of
Denmark, Copenhagen, Denmark.
Printed by Schultz Grafisk, Albertslund, Denmark.
ISBN : 978-87-92158-61-1
i
LIST OF CONTENT SUPERVISORS AND FUNDING..................................................................................................i
ACKNOWLEDGEMENTS..........................................................................................................iv
LIST OF ORIGINAL ARTICLES ...............................................................................................v
RESUMÉ...................................................................................................................................... vii
SUMMARY.....................................................................................................................................x
BACKGROUND, PURPOSE AND RESEARCH APPROACH ........................................... xiii
INTRODUCTION ..........................................................................................................................1
GLOBAL DISTRIBUTION OF SEROVARS AND TRENDS IN HUMANS..........................2
HUMAN EPIDEMIOLOGY .........................................................................................................7
������������ ������������������������ ���� .....................................................................7
���� ������������������ ��� ..................................................................................................9
������������������������ ���......................................................................................................10
�� ������� ��� ��� ������� ����������� ���� ..............................................................11
MAIN RESERVOIRS..................................................................................................................13
��� ����� ������ ��� ���� �� �����������.................................................................................14
��� �������������������� .........................................................................................................15
TRANSMISSION – LOCAL AND GLOBAL ...........................................................................20
���������� ������ ��������� ..................................................................................................20
�������� ��� ��.......................................................................................................................22
� ���� ���� ���������������������� ....................................................................................23
� ���� ���� ���� ....................................................................................................................24
� ���� �������� ��� ..............................................................................................................25
SURVEILLANCE ........................................................................................................................27
��������� ................................................................................................................................27
������������ ����..................................................................................................................28
��������������������...........................................................................................................30
�������������� ��� ����� ���� �������� ����������������������������� ...............32
!� �������������������������� ...........................................................................................34
CONTROL, INTERVENTION, AND PREVENTION ............................................................35
���������������������� �......................................................................................................35
ii

��� ����������� ������������� ����� ����� ��� ................................................................36
������������������ ����������������� � ����� ��� ...........................................................38
������ ������������ �� ..........................................................................................................38
FUTURE PREDICTIONS AND PERSPECTIVES..................................................................39
CONCLUSIONS AND RECOMMENDATIONS .....................................................................41
REFERENCES .............................................................................................................................42
ARTICLES ...................................................................................................................................59
iii

ACKNOWLEDGEMENTS
It feels as if I have travelled and spend more time with my laptop than with my wife and son;
Birgitte Plesning and Malte Hendriksen for the last two years why I sincerely want to thank them
for accepting my “absence”. I would never have managed to pull this off without their support.
I also want to thank Frank M. Aarestrup with whom I have worked for the last 16 years. It has
been a long and interesting journey and Frank has always given me opportunities to have an
impact on my daily work and duties. I am also honoured that he and Henrik C. Wegener had faith
in me and offered me the chance to initiate the Ph.D. study which was accepted by DTU despite
my lack of an academic degree.
I would like to thank Susanne Karlsmose for assisting / taking over many of my daily duties
leaving me with more time to study – it has been a great help. Talking about help – I would also
like to thank all the technicians in our group and especially Christina Aaby Svendsen and Berith
Kummerfeldt for outstanding technical assistance. Furthermore, I really appreciated the
assistance from Matthew Mikoleit from CDC, US, for reviewing the manuscripts / correcting the
English language style, and Frederic J. Angulo from CDC, US, for his thoroughness as co-author.
I would also thank Hanne-Dorthe Emborg, Antonio Vieira, and Sara M. Pires for tutoring me in
the SAS software and for lending me office space once in a while. Henrik Hasman also tutored
me and assisted in characterisation of resistance genes for which I am grateful.
I will also thank Aroon Bangtrakulnonth, Chaiwat Pulsrikarn, and Srirat Pornreongwong�from the
WHO National ������� and ����� Center, Thailand, for an excellent collaboration in
multiple studies and for their wonderful hospitality during my visits to Bangkok. In addition, I
want to thank all the co-authors for their valuable contributions to the manuscripts and members
of the Global Foodborne Infection Network for sharing data. Finally, I want to thank Patrick
McDermott from the US-FDA for reviewing this thesis and correcting the English language style.
iv
LIST OF ORIGINAL ARTICLES The thesis is structured as a review of the global epidemiology of non-typhoidal �������
(NTS) infections in humans and six articles that are published or submitted for publication in
peer reviewed international journals. Articles are referred in the text by roman letters and marked
in bold typeface.
I. Hendriksen RS, Mikoleit M, Carlson VP, Karlsmose S, Vieira AR, Jensen AB, Seyfarth
AM, Delong SM, Weill FX, Lo Fo Wong DM, Angulo FJ, Wegener HC, Aarestrup FM.
WHO Global Salm-Surv External Quality Assurance System (EQAS) for serotyping of
������� isolates, 2000 - 2007. J Clin Microbiol. 2009 Sep; 47 (9): 2729-36.
II. Hendriksen RS, Vieira AR, Karlsmose S, Mikoleit M, Lo Fo Wong DMA, Jensen AB,
Delong SM, Wegener HC, Angulo FJ, Aarestrup FM.
Global monitoring of ������� serovar distribution based on quality assured data from
the WHO Global Salm-Surv Country Data Bank; 2001 – 2007. To be submitted to:
Foodborne Pathog Dis.
III. Hendriksen RS, Bangtrakulnonth A, Pulsrikarn C, Pornreongwong S, Hasman H, Song
SW, Aarestrup FM.
Antimicrobial resistance and molecular epidemiology of ������� Rissen from animals,
food products, and patients in Thailand and Denmark. Foodborne Pathog Dis. 2008 Oct; 5
(5): 605-19.
IV. Hendriksen RS, Mikoleit M, Kornschober C, Rickert RL, Van Duyne S, Kjelsø C,
Hasman H, Cormican M, Mevius D, Threlfall EJ, Angulo FJ, Aarestrup FM.
Emergence of Multidrug-Resistant ������� Concord Infections in Europe and the
United States in Children Adopted From Ethiopia, 2003–2007. Pediatr Infect Dis J. 2009
Sep; 28 (9): 814-818.
v
V. � Sirichote P, Hasman H, Pulsrikarn C, Schønheyder HC, Samulioniené J, Pornreongwong
S, Bangtrakulnonth A, Aarestrup FM, Hendriksen RS.
Molecular characterization of extended spectrum cephalosporinases (ESC) producing
�������� Choleraesuis from patients in Thailand and Denmark. ���� ��� �"�#�$� �
� %���bi���
VI. Hendriksen RS, Bangtrakulnonth A, Pulsrikarn C, Pornreongwong S, Noppornphan G,
Emborg HD, Aarestrup FM.
Risk Factors and Epidemiology of the Ten Most Common ������� Serovars from
Patients in Thailand: 2002–2007. Foodborne Pathog Dis. 2009 Oct; 6 (8): 1009-19.
vi
RESUMÉGlobalisering, internationale rejser og handel øger hastigt den globale udbredelse og overførsel af
levnedsmiddelbårne patogener imellem lande. Allerede i dag er mere end halvdelen af alle
humane ������� infektioner i Danmark forårsaget af internationale rejser og af importerede
fødevarer. I store dele af verden har ������� �� ���� serovar Enteritidis og �� Typhimurium
indtil nu tiltrukket sig mest opmærksomhed. Dog er andre ������� serotyper ofte mere
udbredt i enkelte lande og resultere i flere alvorlige infektioner og udbrud. Det er således vigtigt
at undersøge epidemiologien af ������� globalt.
Det er vigtigt, at data fra forskellige lande er sammenlignelige. Vi har vurderet kvaliteten af
��������overvågningsdata fra laboratorier i hele verden samt deres evne til at serotype baseret
på deltagelse i WHO's Globale Foodborne Infections Network (GFN) External Quality Assurance
System (EQAS). Syv EQAS-runder blev gennemført mellem 2000 og 2007. Deltagende
laboratorier indsendte serotypningsresultater for otte ������� isolater i hver runde. I alt deltog
249 laboratorier i 96 lande i mindst én EQAS runde. Totalt set indsendte 76% af de deltagende
laboratorier data for alle otte stammer og 82% af stammerne var korrekt serotypet.
Præstationsmæssigt blev der observeret regionale forskelle blandt laboratorier fra Centralasien og
Mellemøsten, som udførte testene mindre godt sammenlignet med de øvrige regioner. Fejl, som
resulterede i forkert identifikation af serotypen, var typisk forårsaget af vanskeligheder med at
detektere andenfasen af flagel antigenet eller differentiering indenfor antigen komplekser. Nogle
af disse fejl er sandsynligvis relateret til kvaliteten af den antisera, som har været til rådighed (I).
Baseret på data fra GFN Country Data Bank (CDB) i årene 2001 til 2007 sammenfattede vi den
globale fordeling af ������� serotyper i udvalgte lande for at afdække de regionale og globale
tendenser og mønstre i forekomsten af ������� serotyper. Sammendraget var baseret på
kvalitetssikrede data fra 37 lande, som alle har bestået kvalitetssikringskravet til GFN EQAS. Vi
har fundet betydelige forskelle imellem de mest almindeligt isolerede serotyper i forskellige
geografiske områder, hvorimod flere lignende serotyper blev rapporteret i lande fra det samme
område. Der blev også observeret en faldende tendens til at isolere og serotype i de lande som
indgår i denne undersøgelse. Et par serotyper dominerede i hele verden, men var til stede med
forskellig hyppighed i forskellige regioner. Vi bemærkede interessant nok, at globalt set er den
relative betydning af �. Enteritidis og �. Typhimurium faldende, mens andre serotyper såsom ��
Typhi, �� Infantis, �� Hadar, �� Newport, �� Virchow, �� Agona og andre serovars er stigende (II).
vii
En række ”case-studies” blev udført for at undersøge den globale spredning af �������. Den
genetiske diversitet og resistensprofilen blev undersøgt på 112 �� Rissen isolater fundet blandt
mennesker, fødevarer og dyr i Danmark og Thailand. Derudover blev risikofaktorer såsom ”at
rejse” og ”indtagelse af bestemte fødevarer” analyseret og evalueret. Der blev i alt observeret 63
unikke &��I pulsed field gel elektroforese (PFGE) mønstre, hvoraf det dominerende mønster blev
delt af 22 stammer. Der blev observeret et begrænset niveau af antibiotikaresistens i de danske
stammer, hvorimod der blev observeret en højere grad af resistens i stammer fra Thailand.
Statistiske analyser og molekylær subtypning identificerede kombinationen af ”rejse til Thailand”
og ”konsumering af importerede svin / svinekødsprodukter” samt ”konsumering af svin /
svinekød produceret i Danmark”, som risikofaktorer for �� Rissen-infektioner blandt danske
patienter (III).
Der er blevet rapporteret om multiresistente �� Concord infektioner blandt børn adopteret fra
Etiopien til Østrig, Danmark, England (og Wales), Irland, Holland og USA. Vi interviewede
patienter, karakteriserede isolater og indsamlede oplysninger om adoptioner fra Etiopien for at
vurdere konsekvenserne for folkesundheden. Isolaterne er blevet subtypet ved brug af PFGE og
resistensprofiler; specifikke resistens-gener er blevet karakteriseret. Adoptionsstatus var
tilgængelig for 44 patienter <3 år, hvoraf 98% var blevet adopteret fra Etiopien. De adopterede
børn kom fra forskellige børnehjem i Etiopien. På de besøgte børnehjem var der dårlig hygiejne
og sanitære forhold samt hyppig brug af antibiotika. Der var 53 PFGE mønstre blandt 64 ��
Concord isolater. Der blev udført resistensbestemmelser på 43 isolater, hvoraf 81% var
multiresistente (� 3 stoffer). De multi-resistente isolater var fra etiopiske adoptivbørn og var
resistente over for tredje og fjerde generations cephalosporiner. Herudover havde 14% nedsat
følsomhed over for ciprofloxacin (IV).
Vi har også karakteriseret 24 udvidet spektrum cefalosporinase-producerende isolater af ��
Choleraesuis fra thailandske og danske patienter. Treogtyve af isolaterne var fra thailandske
patienter fra år 2003, 2007 eller 2008. Yderligere var et af isolaterne fra en dansker, som havde
været rejsende i Thailand. De 13 af isolaterne var fra blodprøver. MIC-bestemmelse, micro-array,
PCR, plasmid-profilering og replikon-typning har afsløret forekomst af multiresistente isolater
med plasmider der varierer i størrelse fra 75 -200 kb indeholdende enten ��CMY-2 inklusiv inc
A/C eller ��CTX-M-14 inklusiv incFIIA / incFrepB. RFLP og replikon-typning fordelte isolaterne i
fire adskilte grupper. PFGE afslørede 16 unikke mønstre og fem grupper. Isolatet fra den danske
viii
patient var identisk med to kliniske isolater fra Thailand. Undersøgelsen viste fremkomsten af
��CTX-M-14 genet blandt adskillige kloner af ���Choleraesuis. Adskillige plasmider blev
identificeret indeholdende op til to forskellige udvidet spektrum cefalosporinase gener og fire
forskellige replikonner. En rejse-associeret spredning blev bekræftet (V).
De fleste undersøgelser af epidemiologien af ������� er fra lande, hvor �� Enteritidis og ��
Typhimurium var dominerende. Der ses dog et andet mønster i Thailand, hvor vi har foretaget et
retrospektivt observationsstudie fra 2002 til og med 2007 for at vurdere epidemiologiske
tendenser og risikofaktorer forbundet med de ti mest almindelige ������� serotyper isoleret
fra mennesker. Der blev inkluderet i alt 11.656 ������� isolater i undersøgelsen dækkende alle
seks år. De fleste af isolater var fra patienter <5 år (33%), isoleret i juni (13%), fra fæces (82%)
og fra Bangkok (27%). Statistiske analyser viste, at �. Enteritidis og �. Choleraesuis blev isoleret
fra blod med en højere frekvens end andre ikke-typhoide serotyper. Der var en tendens til at
begge serotyper blev isoleret fra patienter ældre end 5 år. �� Choleraesuis blev fundet med en
højere frekvens i patienter fra Bangkok og den centrale region, mens��� Enteritidis overvejende
blev fundet i patienter fra den sydlige region. Undersøgelsen viser også i forhold til tidligere
undersøgelser et skift i forekomsten af de mest almindelige ������� serotyper forbundet med
humane infektioner i Thailand. Der var blandt andet en stigning i humane infektioner med ��
Stanley, �� Corvallis, og �. Choleraesuis, som tidligere har været forbundet med svin. Yderligere
var der et fald i infektioner forårsaget af �� Weltevreden og �� Anatum (VI).
Samlet set har denne Ph.D. afhandling vurderet kvaliteten af ������� serotypning foretaget på
de nationale referencelaboratorier samt brugt disse data til at beskrive udviklingen i den globale
distribution af �������. Desuden har den vist forbindelser imellem forskellige reservoirer og
kilder til salmonellosis hos mennesker i forskellige områder af verden og anvendt thailandske
overvågningsdata til at opstille risikofaktorer for salmonellose hos mennesker i Thailand. Den er
kommet med flere anbefalinger til aktioner, hvad angår kontrol samt forebyggelse af infektioner i
mennesker.
ix
SUMMARYGlobalization, international travel, and trade among countries facilitate the rapid global spread
and transmission of food borne pathogens. Currently, more than half of all human �������
infections in Denmark result from international travel and consumption of imported food.
Worldwide,�������� �� ���� serovar Enteritidis and �� Typhimurium cause the majority of
human clinical cases. However, other ������� serovars are often more prevalent in specific
countries, and result in more sever infections and outcome. It is, thus, important to study
������� epidemiology globally.
It is essential that data from different countries are comparable. We assessed the quality of the
������� surveillance data worldwide, and the laboratories ability to accurately determine
serotype, based on participation in the WHO Global Foodborne Infections Network (GFN)
External Quality Assurance System (EQAS) for serotyping of �������� Seven EQAS
iterations were conducted between 2000 and 2007. In each iteration, participating laboratories
submitted serotyping results for eight ��������isolates. A total of 249 laboratories in 96
countries participated in at least one EQAS iteration. Cumulatively, 76% of participating
laboratories submitted data for all eight strains and 82% of strains were correctly serotyped.
Regional variations in performance were observed, with higher error rates in laboratories in
Central Asia and the Middle East compared with other regions. Errors that resulted in incorrect
serovar determinations were usually caused by difficulties either in the detection of the phase II
flagellar antigen or differentiation within antigen complexes. Some of these errors likely were
related to the quality of the antisera available (I).
We summarised the global distribution of ������� serovars of selected countries, based on
2001-2007 data from GFN Country Data Bank (CDB) to uncover regional and global trends in
the occurrence of ������� serovars. The summary was based on quality-assured data from 37
countries that passed the quality assurance threshold of the GFN EQAS. We found considerable
differences in the most commonly isolated serovars in various geographical regions, and more
similar serovars prevalences in countries from the same region. We observed a tendency among
countries included in this study to isolate and serotype less compared to previous years. A few
serovars predominated worldwide, but were present with different frequencies in different
regions. Interestingly, we observed that the relative importance of �� Enteritidis and ��
x
Typhimurium is decreasing globally, while other serovars such as �� Typhi, �� Infantis, �� Hadar,
�� Newport, �� Virchow, �� Agona and other serovars are increasing (II).
A number of case studies were conducted to investigate the global spread of �������. The
genetic diversity and antimicrobial resistance of 112 �� Rissen isolates recovered from humans,
food products and animals in Denmark and Thailand were examined. Additionally, risk factors
due to travel and consumption of specific food products were analyzed and evaluated. A total of
63 unique &��I pulsed field gel electrophoresis (PFGE) patterns were observed. The predominant
pattern was shared by 22 strains. Limited antimicrobial resistance was observed in the Danish
strains, whereas a higher degree of resistance was observed in strains originating from Thailand.
Statistical analysis and molecular subtyping identified the combination of “travel to Thailand”
and “consumption of imported pig / pork products” as well “consumption of as pig / pork
products produced in Denmark” as risk factors for ���Rissen infection among the Danish patients
(III).
Multidrug-resistant �� Concord infections have been reported from children adopted from
Ethiopia to Austria, Denmark, England (and Wales), Ireland, the Netherlands and the United
States. We interviewed patients, characterized the isolates, and gathered information about
adoptions from Ethiopia to assess public health implications. Isolates were subtyped by PFGE
and antimicrobial susceptibility; specific antimicrobial resistance genes were characterized.
Adoption status was known for 44 patients <3 years of age; 98% were adopted from Ethiopia.
The children adopted from Ethiopia were from several orphanages; visited orphanages had poor
hygiene and sanitation and frequent use of antimicrobial agents. Sixty-four ���Concord isolates
yielded 53 PFGE patterns. Antimicrobial susceptibility was performed on 43 isolates; 81% were
multidrug-resistant (�3 agents). Multidrug-resistant isolates were from Ethiopian adoptees and
were resistant to third and fourth generation cephalosporins, with 14% showing decreased
susceptibility to ciprofloxacin (IV).
We also characterized 24 extended spectrum cephalosporinases (ESC) producing isolates of ���
Choleraesuis recovered from patients in Thailand and Denmark. Twenty-three isolates were
recovered from Thai patients in 2003, 2007, or 2008 and one isolate was recovered from a Danish
traveler to Thailand, 13 of which were blood culture isolates. MIC determination, micro-array,
PCR, plasmid profiling and replicon typing revealed the presence of multi-drug resistant isolates
harboring either ��CMY-2 containing incA/C or ��CTX-M-14 containing incFIIA / incFrepB
xi
plasmids ranging in size from 75–200 kb. The RFLP and replicon typing clustered the isolates
into four distinct groups. PFGE revealed 16 unique patterns and five clusters. The isolate from
the Danish patient was indistinguishable from two Thai clinical isolates. This study revealed the
emergence of the ��CTX-M-14 gene among several clones of �� Choleraesuis. Numerous plasmids
were identified containing up to two different ESC genes and four distinct replicons. A “travel
associated” spread was confirmed (V).
Most studies of ������� epidemiology have been in countries were����Enteritidis and ���
Typhimurium predominated. In Thailand, a different pattern is observed. We conducted a
retrospective observational study to assess epidemiological trends and risk factors associated with
the ten most common ������� serovars isolated from humans in Thailand between 2002 and
2007. A total of 11,656 ������� isolates covering all six years were included in the study.
Most isolates were from patients <5 years (33%), isolated during June (13%), recovered from
stool (82%) and from Bangkok (27%). Statistical analysis revealed that ���Enteritidis and ��
Choleraesuis were recovered from blood with a higher frequency than other non-typhoidal
serovars. While both serovars tended to be isolated from patients older than 5 years; ���
Choleraesuis was recovered with a higher frequency from patients in Bangkok and the Central
Region, whereas ���Enteritidis was recovered predominantly from patients in the Southern
Region.�This study also indicates a shift in prevalence of the most common ������� serovars
responsible for human infections in Thailand compared to previous studies. Notably, there was an
increase in human infections with �� Stanley, �� Corvallis, and �� Choleraesuis - three serovars
which previously have been associated with swine - and a decrease in infections due to ���
Weltevreden and �� Anatum (VI).
Overall, this Ph.D. thesis has assessed the quality of ������� serotyping conducted in national
reference laboratories and used these data to describe trends in the global distribution of
�������. In addition, it has revealed links between different reservoirs and sources to human
salmonellosis in different areas of the world and used Thai surveillance data to set up risk factors
for human salmonellosis in Thailand. In several cases, this work has resulted in recommendations
to help control and prevent infections in humans.
xii

BACKGROUNDToday, we are all residents of a global village. The expanding trade of food and livestock, and
increased human travel and migration are means of spreading infectious disease irrespective of
national borders. This makes infectious disease control and food safety important for all
countries. In Denmark, it is expected that in a few years, around 2/3 of all food products will
originate from other countries. Already today, more than half of all human ������� infections
in Denmark are caused by international travel and consumption of imported food.
In addition, the majority of the ������� isolates causing human infections in Denmark by
consumption of imported food products are resistant to multiple antimicrobials, which has
increased in many countries that export foods to Denmark.
In Europe and North America,��� Enteritidis and �� Typhimurium have, up until now, drawn most
attention. However, other ������� serovars are often more prevalent in other parts of the
world and result in more sever infections with higher morbidity. Thus, there is an urgent need to
further investigate and elucidate the occurrence, international spread, and global epidemiology of
������� serovars and specific clones so that evidence-based interventions can be taken
worldwide.
PURPOSE The purpose of the PhD project was to study the global epidemiology of NTS infections in
humans. The term “epidemiology” is defined in the traditional way as the study of the occurrence
and distribution of a disease in a population and the factors which influence disease occurrence.
The PhD project integrated conventional and molecular microbiology used to characterise
isolates with epidemiological and statistical tools needed to estimate trends and risk factors.
RESEARCH APPROACH The projects were derived from the activities of the WHO Global Foodborne Infections Network
(GFN), a network of institutions building capacity for laboratory-based surveillance of foodborne
pathogens and disease (http://www.who.int/salmsurv/en/), to assess the global distribution of
xiii
xiv
������� serovars, investigate examples of international spread and identify regional and local
risk factors for infection.
The specific studies conducted during this PhD project focused on the following objectives:
1. To assess the quality of the ������� surveillance data worldwide and the laboratories
ability to serotype based on participation in the GFN EQAS.
2. To estimate the global distribution and trends of ������� serovars from the GFN
Country Data Bank (CDB). CDB data reliability was based on results from the GFN
EQAS.
3. To investigate the spread of �� Rissen caused by international travel to Thailand and
imported food from Spain and Germany.
4. To investigate the spread of �� Concord to Europe and United States through adopted
children from Ethiopia.
5. To characterise the extended spectrum cephalosporinases genes of the invasive serovar ��
Choleraesuis.
6. To identify risk factors in the epidemiology of ������� serovars in Thai patients and
to use these findings to recommend strategies for control and prevention.
INTRODUCTION������� is a genus of rod-shaped, Gram-negative, oxidase negative, non-spore forming,
predominantly motile (peritrichous) bacteria belonging to the family '� ������ �������.
������� are approximately 0.7 to 1.5 �m wide and 2.0 to 5.0 �m in length (Giannella � ��.,
1996). The bacterium ferments glucose and usually with production of gas. In addition, they are
able to grow in a minimal media containing glucose as the sole carbon energy source and
ammonium ion as a nitrogen source (prototrophic). Most serovars are phenotypically identified
by urea hydrolysis, the absence of tryptophan deaminase, non-lactose fermentation, the
production of hydrogen sulphide (H2S), decarboxylate lysine and ornithine and growth on
Simmons citrate agar (Grimont � ��., 2000).
The genus �������, first known as ������������������, was initially discovered in 1886
by Theobald Smith and Daniel Elmer Salmon. The discovery of the genus originated from the
work on swine fever (hog cholera) by Theobald Smith and he named the genus after his
supervisor at the U.S. Department of Agriculture (USDA), Daniel E. Salmon (Grimont � ��.,
2000).
In the late 19th century, serological tests utilizing agglutination with antiserum were developed,
and new serovars were discovered and named after either clinical conditions or hosts, e.g.
���������� �� ��,������������� �����,����������������,���������
�������������,�and��������� �������� (Grimont � ��., 2000).
In 1926, Bruce White developed the analysis of somatic and flagella antigens, which in 1961 was
expanded by Fritz Kauffman to distinguish more than 2000 serovars. In 1980, the �������
nomenclature of today (The Kauffman-White Scheme) was proposed, and is currently maintained
by the World Health Organization (WHO) Collaborating Centre for Reference and Research on
������� at the Pasteur Institute, Paris, France (Grimont � ��., 2000; Grimont � ��., 2007).
Currently, ������� consists of 2.579 different serovars divided into two species – ��������
�� ���� (n=2.557) replacing the old name ������������������ (Hohmann � ��., 2001) and
���������������(n=22) (Grimont � ��., 2007). The species, ������� �� ���� is further
divided into six subspecies -����������� �����subsp���� �����(I), ���������� �����subsp.
������ (II), ���������� �����subsp. ��(���� (IIIa), ���������� �����subsp. ���(����
(IIIb), ���������� �����subsp. ��� ���� (IV), and ���������� �����subsp. ���� (VI).
Serovars of ���������� �����subsp���� �����(I), are primarily named by the geographical
1
origin such as �� Amsterdam, �� Panama, and �� Derby whereas the serovars of the remaining five
subspecies all are named by antigenic formular (Grimont � ��., 2000; Grimont � ��., 2007).
GLOBAL DISTRIBUTION OF SEROVARS AND TRENDS IN
HUMANS������� serotyping still serves as the predominately used surveillance tool for detection of
outbreaks and corresponding sources, to monitor trends over time, and attribute different food
and animal reservoirs to human infections. Despite this, there is today only limited knowledge of
the global distribution of ������� serovars in humans. In the last decade, some countries have
collected annual prevalence data on serovar distribution among humans, but very few
publications have summarised the global distribution of the serovars responsible for human
infections and further analysed the data (Herikstad � ��., 2002; Galanis � ��., 2006; II). An
equally important feature for surveillance is quality assurance and quality control, which is
necessary to ensure reliable data. Only a small number of international quality assurance systems
exist to evaluate the quality of the serotyping conducted worldwide by national reference
laboratories (Petersen � ��., 2002; Anonymous, 2007b; I).
In January 2000, the WHO launched WHO Global Foodborne Infections Network (GFN)
(formerly known as Global Salm Surv (GSS)), a global effort to enhance laboratory-based
surveillance of ��������infections and other foodborne diseases, and to promote prevention
and control activities. Enhancing worldwide serotyping of ��������is a key objective of WHO
GFN and is facilitated by bench training at international capacity building courses.
To ascertain the performance of participating laboratories, and thereby promote enhanced
laboratory-based surveillance, an External Quality Assurance System (EQAS) was established as
a part of WHO GFN in 2000 (Petersen�� ��., 2002; I). Each year, EQAS distributes a set of
blinded bacterial cultures for identification, serotyping and antimicrobial susceptibility testing. A
key component of this program is the Internet based Country Data Bank (CDB), to which
member countries are encouraged to annually upload data on the 15 most common �������
serovars (http://www.antimicrobialresistance.dk).
The results of the WHO GFN EQAS data from 2000 to 2007 revealed that a total of
2
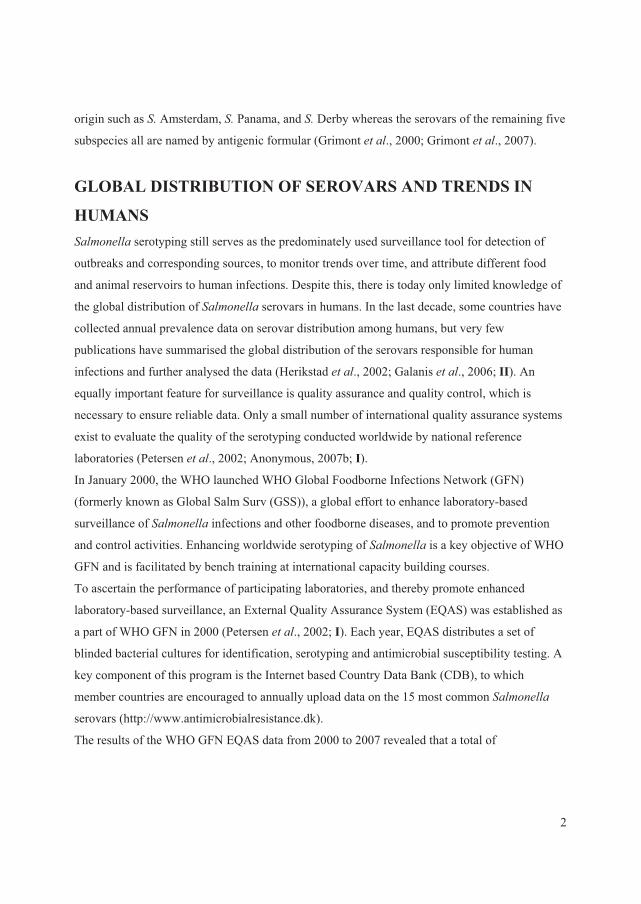
249 laboratories in 96 countries participated in annual EQAS testing at least once (Figure 1) (I).
)�����*��$��� �����������������+���������,��������-�+�� �����,��������� ��� ������ ���� �����'.��� ��� ����$��� ������������������� ���������� ���.�� ����������� ���'.����������� ����� �� �� ���$/0�������� -�������� �� �������������������� ��-����������� �������� �$/0�� �����$��� �������������������+����������,������ ���� ��� ����������� ��������������+I; II,��
During the seven EQAS iterations, a total of 756 reports were received from the participating
laboratories. Cumulatively, 76% of participating laboratories submitted data for all eight strains
and 82% of the strains were correctly serotyped. The goal of the EQAS program is for all
participating laboratories to perform ��������serotyping with a maximum of one error. The
percentage of laboratories reaching the threshold reporting one or zero errors increased
significantly (�=0.04), from 48% in 2000 to 68% in 2007. In each EQAS iteration, 84% to 96%
of the laboratories correctly serotyped the ���Enteritidis isolate that was included in the panel of
test strains as an internal quality control strain. Regional variations in performance were
observed, with laboratories in Central Asia and the Middle East performing less well overall than
other regions. Errors that resulted in incorrect serovar identification were usually caused by
difficulties in the detection of the phase II flagellar antigen, or differentiation within antigen
complexes. Some of these errors likely are related to the quality of the antisera available (I). The
same conclusion, that the main problem existed in detecting the H antigens, was reached by the
National Institute for Public Health and the Environment (RIVM) which served as the
3

4
community reference laboratory for ������� as designated by the European Commission.
They evaluated 26 European national reference laboratories in 2007 and found that 98% and 96%
of the laboratories correctly serotyped the isolates using O and H antigen, respectively
(Anonymous, 2007b).
In 2008, the global distribution of ������� serovars per country, based on data from the WHO
GFN CDB, were summarised and analysed in search for trends from 2001 to 2007. All data
included were based on reliable data from countries which managed the quality assurance
threshold of the WHO GFN EQAS (Figure 1) (V).
The data showed that, in all regions with exception of the Oceania and North American,���
Enteritidis and ���Typhimurium ranked as the first and second most common serovars,
respectively. In the North American and the Oceania regions these two serovars ranked in the
opposite order. Globally the
overall proportion for both
serovars decreased over time
with �� Enteritidis decreasing
from 44.2% to 41.5% and ��
Typhimurium decreasing from
18.9% to 15.0% (Figure 2) (V).
This was mainly due to a
significant decreasing trend )�����1��!����������� �����23����� ������� ��������� ���+V,
(p<0.01) in the proportion of ��
Enteritidis in developing
countries and a non-significant
decreasing trend (p=0.16) in
the proportion of ��
Typhimurium in developed
countries.
In addition to ���Enteritidis and
���Typhimurium, �� Infantis
was among the serovars )�����2��!����������� �����23����� ������� ��������� ���+V,
observed in all regions. Globally, the overall proportion of �. Infantis increased over the years,
from 1.5% to 2.2%. However, no statistically significant increasing trend was detected (p=0.76)
(Figure 3). �. Infantis ranked as the fifth most common serovar in the European region. �� Agona
was frequently observed in Asia and Latin America, ranking as the third most common serovar.
�� Agona also ranked as the top seven serovar in Europe and the top 13 in North America.
Overall, the proportion of this serovar increased from 0.8% to 1.5% between 2001 and 2007.
A slight decrease in the overall proportion over time was seen for �� Heidelberg, from 2.5% to
2.3% (Figure 3). This serovar was more common among developed countries. ���Heidelberg
ranked in top four in North America. However, lower frequencies were seen in Europe (top 9)
and Latin America (top 19).
�� Virchow was common only in Asia, Europe and the Oceania regions, but with a high
proportion. The overall proportion oscillated over the years (Figure 3) and, since 2005, an
increase was seen among developed countries while a similar proportionate decrease was
reported by developing countries.
High frequencies of �� Thompson were seen in Europe and North America. ���Newport also was
reported as a top serovar by these two regions, in addition to Latin America. Nevertheless, the
overall proportion over time of �� Newport, which was increasing in the initial years, decreased
from 5.0% in 2005 to only 1.2% in 2007 (Figure 3).
�� Oranienburg was observed only in North and Latin America, ranked 10th and 15th, respectively.
�� Hadar and �� Montevideo were reported by almost all regions, however, the frequencies varied
considerably. �� Hadar ranked 3rd in Europe, but lower in the other regions. In general, the overall
proportion remained at similar levels over the years, with the exception of a slight decrease in
2005 (Figure 3). Finally, �� Montevideo was more common in North and Latin America while ���
Saintpaul was more predominant in Oceania and North America. These two serovars exhibited
similar trends over time, increasing from 2003 to 2005, followed by a decline in 2007 (Figure 3).
The survey concluded large differences among the top 20 most commonly isolated serovars
between regions but lesser differences between the top 15 most commonly isolated serovars
between countries within the same region. Nevertheless, a few serovars are more frequent than
others in many of the regions and countries.
Several national surveillance reports and scientific articles support the observations described by
Hendriksen � ��. (II). In Europe, surveillance data from 23 countries between 2006 and 2007
5
among humans showed that �� Enteritidis was ranked first, but decreasing, and that ��
Typhimurium was fairly consistent over time and ranked second (Anonymous, 2009b). In
addition, �� Infantis was ranked third followed by �� Virchow (top 4), �� Newport (top5), and ��
Hadar (top 7). However, both �� Thompson and �� Heidelberg were not listed among top 10
among the 23 countries in Europe (Anonymous, 2009b). In the United Kingdom, data from 1983
to 2007 revealed the same ranking of �� Enteritidis and �� Typhimurium as for all Europe but
with a decreasing tendency for both serovars (Anonymous, 2007f). In contrast, the Danish data
from 2007 showed an opposite ranking of �� Enteritidis and �� Typhimurium (Anonymous,
2009a). In South America, �� Typhimurium�was ranked first and �� Enteritidis second in 2008
(Anonymous, 2008c). In addition, the data also showed that �� Isangi was highly frequent and
ranked third followed by ���Dublin and �� Virchow (Anonymous, 2008c).The same tendency of
ranking �� Enteritidis and �� Typhimurium was observed since 1997 in the United States (Olsen
� ��., 2001; Anonymous, 2008e), in China (Henan province) between 2006 and 2007 (Xia � ��.,
2009), and Taiwan between 1998 to 2002 (Lauderdale � ��., 2006). Also in India, ��
Typhimurium was ranked before��� Enteritidis between 2001 to 2005 (Kumar � ��., 2009) and in
New Zealand in 2005 to 2008 (Anonymous, 2008a).
In the United States, ���Newport was ranked third followed by ���Heidelberg (Anonymous,
2008e). The distribution of serovars in Southeast Asia is slightly different from the global trend
in general. In the Philippines, Hong Kong, and Sri Lanca, �� Typhimurium was ranked before���
Enteritidis whereas it was the opposite in Singapore, South Korea, and Thailand (Lee � ��., 2009;
VI). However, in most of these countries another non-typhoidal�������� (NTS) ranked either
as the top serovar or in between �� Enteritidis and �� Typhimurium in prevalence. In general, the
serovars following �� Typhimurium and��� Enteritidis were �� Weltevreden, ���Stanley, ��
Choleraesuis, �� London, �� Agona, �� Rissen, �� Anatum, �� Panama, and �� Virchow (Lee � ��.,
2009, VI). In Taiwan, the distribution of serovars revealed large similarities with Southeast Asia.
Here, ���Stanley was listed as the third most common serovar followed by �� Schwarzengrund, ��
Newport, ���Albany, ���Virchow, �� Weltevreden, and �� Agona (Lauderdale � ��., 2006). China
(Henan province) did not share the same serovars as Taiwan. In Henan province, ���Derby ranked
third followed by �� Indiana, �� Litchfield, �� Thompson, and �� Agona (Xia � ��., 2009).
The complexity of the global distribution of ������� serovars in humans is enormous as it is
influenced by multiple factors such as animal and environmental reservoirs and complex route of
6
transmission. It will be important for the future to extend the global understanding of the
epidemiology of ������� in not only humans but also in all animal reservoirs.
HUMAN EPIDEMIOLOGY ������������ ������������������������ �����
Food-borne diseases have been estimated to infect up to 76 million people in the United States
annually. This would equal one fourth of the people infected in the developed world per year if
these data were extrapolated. The burden of salmonellosis is expected to be much greater in the
developing parts of the world (Schlundt � ��., 2004). ������� is overall the most common
food-borne pathogen in the United States, however, in some states $�������� �� is more
prevalent than ������� (Anonymous, 2009c). In Europe, $�������� �� are more frequent
than ������� (Anonymous, 2008d)��According to the WHO, humans NTS infections
constitute a major public health burden on society and represent a huge cost for many countries
(www.who.int). In 2000, it was estimated that in the United States, NTS resulted in 1.4 million
infections annually in a population of about 293 million inhabitants with approximately 168.000
visits to the general practitioner (GP). A total of 16.430 people were hospitalized resulting in 582
deaths (Mead � ��., 1999; McDermott � ��., 2006). A similar study was conducted the same year
in the United Kingdom. This revealed that 41.616 NTS cases occurred each year with 15.036
laboratory confirmations among a population of 60 million people, resulting in 1.516
hospitalization and 119 deaths (Adak � ��., 2002; McDermott � ��.,2006). This was
approximately twice as many hospitalizations and deaths in the United States compared to the
United Kingdom.
Recently, the financial burden of NTS was estimated in the United States based on FoodNet data.
The data revealed that costs of medical care, lost productivity, and mortality exceeded more that
$ 3.6 billion annually (Voetsch � ��., 2004; McDermott � ��., 2006). In comparison, the annually
costs of NTS in Denmark are estimated to be $ 15.5 million which was approximately four time
less that in the United States (www.who.int).
A few countries around the world have an established laboratory-based surveillance of NTS, or
have recently improved the data quality and reporting to implement programmes measuring the
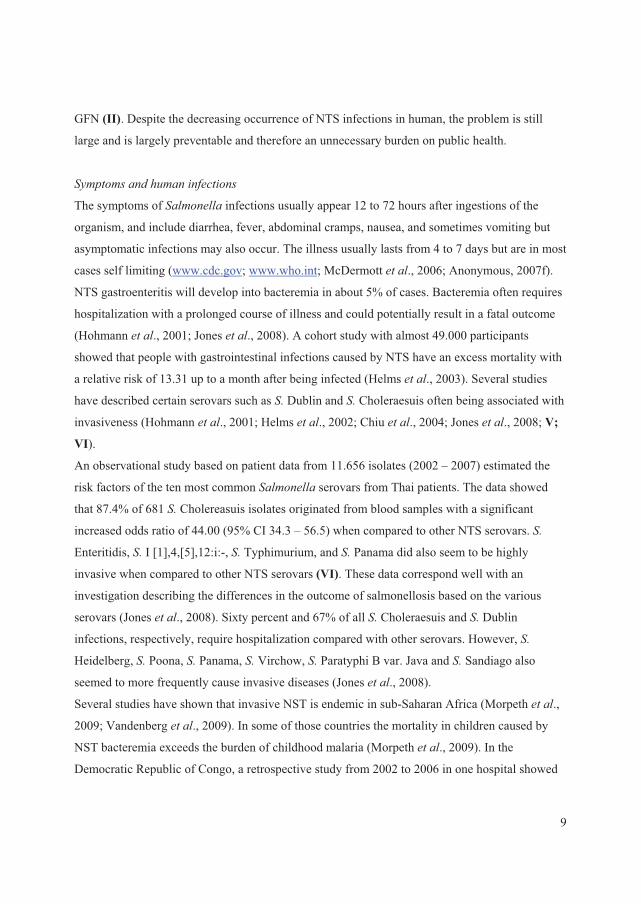
burden of salmonellosis. One of the measurements in the surveillance reports are the notification,
incidence, or isolation rate per 100.000 inhabitants all estimating the burden on the society
7
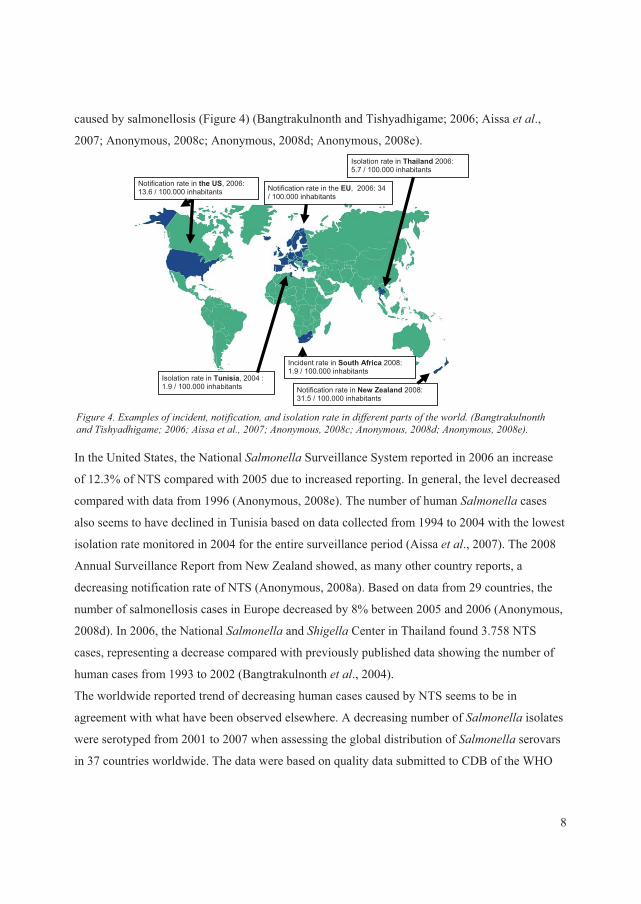
caused by salmonellosis (Figure 4) (Bangtrakulnonth and Tishyadhigame; 2006; Aissa � ��.,
2007; Anonymous, 2008c; Anonymous, 2008d; Anonymous, 2008e).
In the United States, the National ������� Surveillance System reported in 2006 an increase
of 12.3% of NTS compared with 2005 due to increased reporting. In general, the level decreased
compared with data from 1996 (Anonymous, 2008e). The number of human ������� cases
also seems to have declined in Tunisia based on data collected from 1994 to 2004 with the lowest
isolation rate monitored in 2004 for the entire surveillance period (Aissa � ��., 2007). The 2008
Annual Surveillance Report from New Zealand showed, as many other country reports, a
decreasing notification rate of NTS (Anonymous, 2008a). Based on data from 29 countries, the
number of salmonellosis cases in Europe decreased by 8% between 2005 and 2006 (Anonymous,
2008d). In 2006, the National ������� and ����� Center in Thailand found 3.758 NTS
cases, representing a decrease compared with previously published data showing the number of
human cases from 1993 to 2002 (Bangtrakulnonth � ��., 2004).
The worldwide reported trend of decreasing human cases caused by NTS seems to be in
agreement with what have been observed elsewhere. A decreasing number of ������� isolates
were serotyped from 2001 to 2007 when assessing the global distribution of ������� serovars
in 37 countries worldwide. The data were based on quality data submitted to CDB of the WHO
Notification rate in the US, 2006: 13.6 / 100.000 inhabitants Notification rate in the EU, 2006: 34
/ 100.000 inhabitants
Isolation rate in Tunisia, 2004 : 1.9 / 100.000 inhabitants
Incident rate in South Africa 2008: 1.9 / 100.000 inhabitants
Isolation rate in Thailand 006: 25.7 / 100.000 inhabitants
Notification rate in New Zealand 2008: 31.5 / 100.000 inhabitants
)�����4��'5�������������� ���� ��� ����������� ����� ����������� ���� ����� ���-�����+0��� ������� �����������������6�17786������� �����17736������������1779�6������������1779�6������������1779�,��
8
GFN (II). Despite the decreasing occurrence of NTS infections in human, the problem is still
large and is largely preventable and therefore an unnecessary burden on public health.
�
���� ������������������ ����
The symptoms of ������� infections usually appear 12 to 72 hours after ingestions of the
organism, and include diarrhea, fever, abdominal cramps, nausea, and sometimes vomiting but
asymptomatic infections may also occur. The illness usually lasts from 4 to 7 days but are in most
cases self limiting (www.cdc.gov; www.who.int; McDermott � ��., 2006; Anonymous, 2007f).
NTS gastroenteritis will develop into bacteremia in about 5% of cases. Bacteremia often requires
hospitalization with a prolonged course of illness and could potentially result in a fatal outcome
(Hohmann � ��., 2001; Jones � ��., 2008). A cohort study with almost 49.000 participants
showed that people with gastrointestinal infections caused by NTS have an excess mortality with
a relative risk of 13.31 up to a month after being infected (Helms � ��., 2003). Several studies
have described certain serovars such as �� Dublin and ���Choleraesuis often being associated with
invasiveness (Hohmann � ��., 2001; Helms � ��., 2002; Chiu � ��., 2004; Jones � ��., 2008; V;
VI).
An observational study based on patient data from 11.656 isolates (2002 – 2007) estimated the
risk factors of the ten most common ������� serovars from Thai patients. The data showed
that 87.4% of 681 �� Cholereasuis isolates originated from blood samples with a significant
increased odds ratio of 44.00 (95% CI 34.3 – 56.5) when compared to other NTS serovars. ��
Enteritidis, �� I [1],4,[5],12:i:-, ���Typhimurium, and �� Panama did also seem to be highly
invasive when compared to other NTS serovars (VI). These data correspond well with an
investigation describing the differences in the outcome of salmonellosis based on the various
serovars (Jones � ��., 2008). Sixty percent and 67% of all �� Choleraesuis and �� Dublin
infections, respectively, require hospitalization compared with other serovars. However, ���
Heidelberg, �� Poona, �� Panama, ���Virchow, �� Paratyphi B var. Java and �� Sandiago also
seemed to more frequently cause invasive diseases (Jones � ��., 2008).
Several studies have shown that invasive NST is endemic in sub-Saharan Africa (Morpeth � ��.,
2009; Vandenberg � ��., 2009). In some of those countries the mortality in children caused by
NST bacteremia exceeds the burden of childhood malaria (Morpeth � ��., 2009). In the
Democratic Republic of Congo, a retrospective study from 2002 to 2006 in one hospital showed
9
that 59% of all bloodstream infections in children were caused by NTS. The data revealed that ��
Enteritidis and �� Typhimurium were responsible for up to 82.8% of the cases (Vandenberg � ��.,
2009). The study highlighted that many NTS invasive infections were nosocomial and resulted in
prolonged hospitalization, posing a significant problem in developing countries. Little is known
about human NTS infections in Africa and many other developing countries, but the limited data
have shown that NTS infection often are associated with invasiveness and severe outcome. There
is an urgent need to address this problem in order to elucidate the mechanisms responsible for the
severe outcomes.
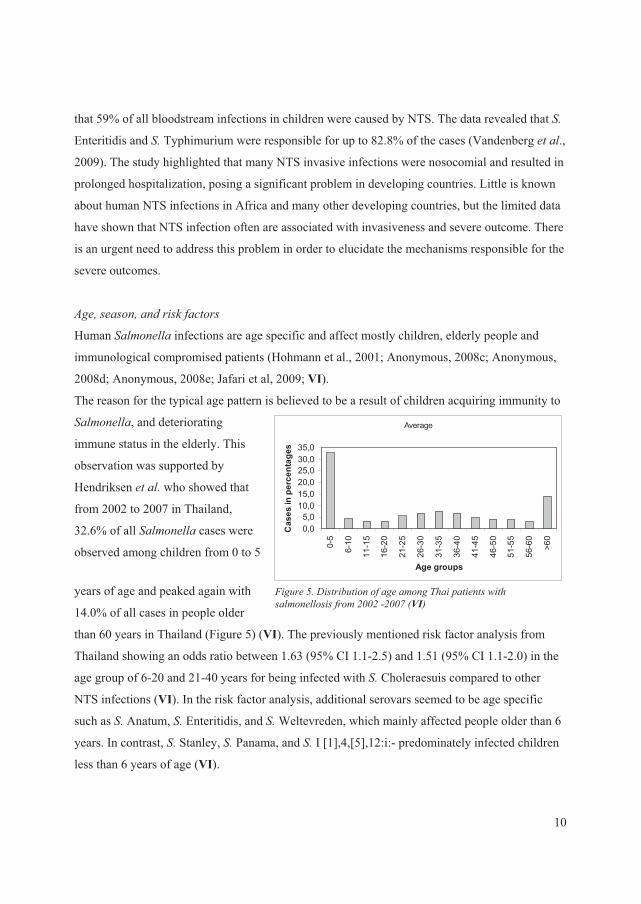
������������������������ ���
Human�������� infections are age specific and affect mostly children, elderly people and
immunological compromised patients (Hohmann et al., 2001; Anonymous, 2008c; Anonymous,
2008d; Anonymous, 2008e; Jafari et al, 2009; VI).
Average
0,05,0
10,015,020,025,030,035,0
0-5
6-10
11-1
5
16-2
0
21-2
5
26-3
0
31-3
5
36-4
0
41-4
5
46-5
0
51-5
5
56-6
0
>60
Age groups
Cas
es in
per
cent
ages
The reason for the typical age pattern is believed to be a result of children acquiring immunity to
�������, and deteriorating
immune status in the elderly. This
observation was supported by
Hendriksen � ��� who showed that
from 2002 to 2007 in Thailand,
32.6% of all ������� cases were
observed among children from 0 to 5
years of age and peaked again with
14.0% of all cases in people older
than 60 years in Thailand (Figure 5) (VI). The previously mentioned risk factor analysis from
Thailand showing an odds ratio between 1.63 (95% CI 1.1-2.5) and 1.51 (95% CI 1.1-2.0) in the
age group of 6-20 and 21-40 years for being infected with����Choleraesuis compared to other
NTS infections (VI). In the risk factor analysis, additional serovars seemed to be age specific
such as ���Anatum, �� Enteritidis, and ���Weltevreden, which mainly affected people older than 6
years. In contrast, ���Stanley, �� Panama, and �� I [1],4,[5],12:i:- predominately infected children
less than 6 years of age (VI).
)�����:��/� ��� ���������������������� �� ��- �����������������1771��1773�+VI,
10
0
200
400
600
800
1000
1200
1400
1600
Janu
ary
Februa
ryMarc
hApri
lMay
June Ju
ly
Augus
t
Septem
ber
Octobe
r
Novem
ber
Decem
ber
Months
no. o
f cas
es
S.Enteritidis
S.Stanley
S.Weltevreden
S.Rissen
S I.[1],4,[5],12:i:-
S.Choleraesuis
S.Anatum
S.Typhimurium
S.Corvallis
S.Panama
Others
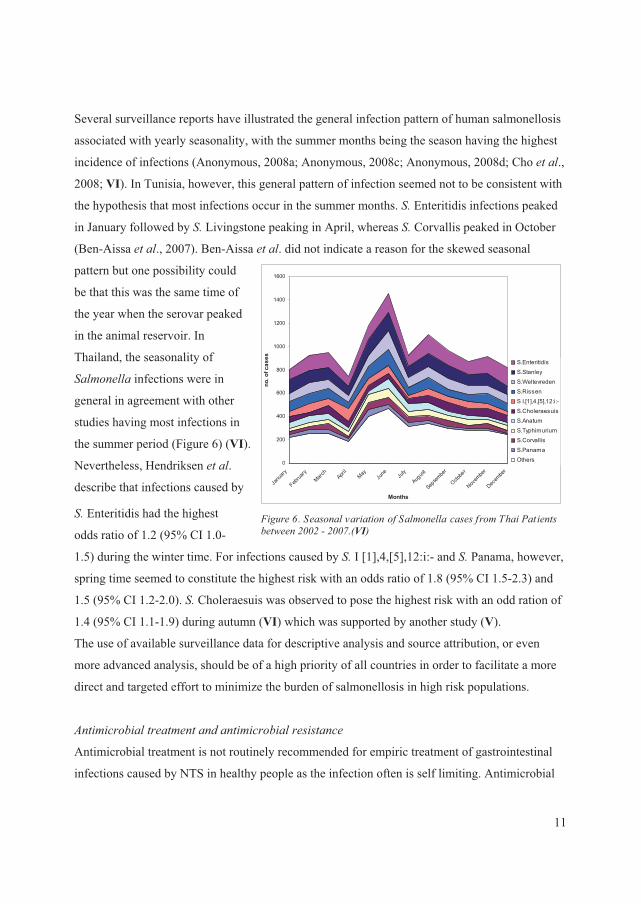
)�����8�������������� ������������������������������� �� ���� -����1771���1773�+VI,�
Several surveillance reports have illustrated the general infection pattern of human salmonellosis
associated with yearly seasonality, with the summer months being the season having the highest
incidence of infections (Anonymous, 2008a; Anonymous, 2008c; Anonymous, 2008d; Cho � ��.,
2008; VI). In Tunisia, however, this general pattern of infection seemed not to be consistent with
the hypothesis that most infections occur in the summer months. �� Enteritidis infections peaked
in January followed by��� Livingstone peaking in April, whereas �� Corvallis peaked in October
(Ben-Aissa � ��., 2007). Ben-Aissa � ��. did not indicate a reason for the skewed seasonal
pattern but one possibility could
be that this was the same time of
the year when the serovar peaked
in the animal reservoir. In
Thailand, the seasonality of
������� infections were in
general in agreement with other
studies having most infections in
the summer period (Figure 6) (VI).
Nevertheless, Hendriksen � ��.
describe that infections caused by
���Enteritidis had the highest
odds ratio of 1.2 (95% CI 1.0-
1.5) during the winter time. For infections caused by �� I [1],4,[5],12:i:- and��� Panama, however,
spring time seemed to constitute the highest risk with an odds ratio of 1.8 (95% CI 1.5-2.3) and
1.5 (95% CI 1.2-2.0). ���Choleraesuis was observed to pose the highest risk with an odd ration of
1.4 (95% CI 1.1-1.9) during autumn (VI) which was supported by another study (V).
The use of available surveillance data for descriptive analysis and source attribution, or even
more advanced analysis, should be of a high priority of all countries in order to facilitate a more
direct and targeted effort to minimize the burden of salmonellosis in high risk populations.
�� ������� ��� ��� ������� ����������� �����
Antimicrobial treatment is not routinely recommended for empiric treatment of gastrointestinal
infections caused by NTS in healthy people as the infection often is self limiting. Antimicrobial
11

treatment should be given to patients with severe illness, immunosuppression or patients
suffering from bacteraemia (Hohmann � ��., 2001). Treatment with first line antimicrobials
should include ampicillin, chloramphenicol or trimethoprim + sulfamethoxazole (Hohmann � ��.,
2001; McDermott � ��., 2006). The choice differs by region and chloramphenicol is not used in
most developed countries, but is common in developing countries. Ampicillin and trimethoprim +
sulfamethoxazole are good choices, but many do not even considering them and choose in stead
fluoroquinolone or 3rd generation cephalosporins.
Unfortunately, the recent increased development of resistance to many antimicrobials often
leaves the GP with no alternative than to treat the infection with either a fluoroquinolone or 3rd
generation cephalosporins. These antimicrobials are routinely used for empiric treatment if the
susceptibility of the isolates is unknown or if the patient suffers from bacteremia (Hohmann � �
�., 2001). For paediatric patients, treatment with a fluoroquinolone is contraindicated, and
practitioners will rely on ceftriaxone or another 3rd generation cephalosporin (Hohmann � ��.,
2001).
Several studies from the United States, Canada and Denmark have shown an increased risk of
hospitalization or even death associated with multi-drug resistant NTS compared with
pansusceptible NTS. (Holmberg � ��., 1987; Lee � ��., 1994; Mølbak � ��., 1999; Helms � ��.,
2002; Martin � ��., 2004; Helms � ��., 2004; Varma � ��., 2005a; Varma � ��., 2005b). In a
Danish study, an increased risk of invasive illness has been observed with 3.5% of the patients
investigated being hospitalized. An increased mortality was recorded in 1.2% of the patients in up
to two years after the infection. In both cases the infections were associated with quinolone or
multi-drug resistant �� Typhimurium (Helms � ��., 2002; Helms � ��., 2004).
Recently, multi-drug resistant NTS have increased and have reached an alarming level
worldwide. While the extent varies, the increased level of multi-drug resistant NTS has become a
problem in all countries. Data have revealed that countries in Southeast Asia and Africa tend to
have a high level of resistant NTS (Collard � ��., 2007; Lee � ��., 2009; Vanderberg � ��.,
2009). Several publications have described the increasing occurrence of multi-drug resistant NTS
and isolates resistant to both fluoroquinolone and 3rd generation cephalosporins in Southeast Asia
and Africa (Archambault � ��., 2006; Lauderdale � ��., 2006; Aarestrup et al., 2007; Collard � �
�., 2007; Vandenberg � ���, 2009; Lee � ��., 2009; III; IV; V). Lee � ��. recently described the
level of antimicrobial resistance from 2003 to 2005 in seven Southeast Asia countries. They
12
found that Taiwan and Thailand demonstrated an alarming high frequency of resistance to
fluoroquinolones and 3rd generation cephalosporins. These findings were also supported by
Sirichote � ��. who found cephalosporinases producing �� Choleraesuis from Thai patients and a
Danish traveler to Thailand harbouring both ��CTX-M-14 gene and ��CMY-2 gene (V). Hendriksen
� ��. showed that among 33 Thai patients infected with ���Rissen 36%, 27%, 33%, 30%, 27%,
and 88% of the isolates were resistant to ampicillin, chloramphenicol, spectinomycin,
streptomycin, sulfamethoxazole, trimethoprim, and tetracycline, respectively (III). Another study
highlights the same worrisome frequency of multi-drug resistance in children from Ethiopia (IV).
The investigation revealed that among 43 �� Concord isolates, all isolates were resistant to
ampicillin, chloramphenicol, streptomycin, sulfamethoxazole, and trimethoprim. In addition,
97%, 97%, 69%, and 14% of the isolates showed resistant or decreased susceptibility to
ceftriaxone, gentamicin, tetracycline, and ciprofloxacin, respectively. All of the isolates resistant
to ceftriaxone harboured the ��CTX-M-15 gene and 13 of the isolates also the ��SHV-12 gene (IV).
In response to worldwide increases in multi-drug resistance among human bacterial pathogens,
the WHO has developed a list ranking the critically important antimicrobials. This categorization
of antimicrobials is prioritized according to their importance in human medicine, and is intended
to help assess the risks associated with resistance (Anonymous, 2007e; Collignon � ��., 2009). In
addition, individual countries without a strict antimicrobial policy should consider lowering the
consumption of antimicrobials, ban antimicrobial growth promoters and enforce prescription-
only policies to accommodate the increasing frequency of multidrug resistant pathogens
worldwide.
�
MAIN RESERVOIRSAs a zoonotic foodborne bacterium, ������� has reservoirs in various animals. The most
common domesticated animal hosts are chickens, pigs, and cattle; but many other domestic
animals as well as a wide range of wild animals can also harbour this organism. Because of the
ability of ������� to contaminate meat during slaughter and to survive in fresh meats and
meat products that are not thoroughly heated, animal products constitute a main vehicle of
transmission. Another important vehicle of transmission is eggs that are contaminated on the
surface or in the interior of the egg. Finally, produce and other vegetables that are contaminated
13
with animal manure during growing or processing are increasingly recognized as an important
source of human ������� infections
��� ����� ������ ��� ���� �� ������������
NTS have a wide range of hosts and reservoirs which mostly have been associated with
agricultural product. Some of the NTS are host adapted or host restricted while others are non-
specific and cause infections in various hosts, leading to their division into two separate groups
(Uzzau � ��., 2000; Cray � ��., 2000).
The host restricted serovars cause disease in a limited number of animal species such as ��
Abortusequi (horses), �� Gallinarum (poultry), �� Pullorum (poultry), �� Typhisuis (swine), and ��
Abortusovis (sheep). The host adapted serovars are most prevalent in one animal species, but are
also able to cause severe illness in a limited number of other hosts. These serovars include ��
Choleraesuis (predominantly in swine and human) and �� Dublin (predominantly in cattle and
human) (Uzzau � ��., 2000; Chiu � ��., 2004). There are limited data describing the reasons
these serovars only affect a limited number of hosts compared to non-specific serovars which
colonize a broad range of animals and humans (Uzzau � ��., 2000).
Some decades ago, ���Choleraesuis was in many countries one of the most predominant serovars
isolated from swine (Cray � ��., 2000). Recently, the prevalence decreased in Europe and is not
presently listed among the top serovars isolated from swine (Uzzau � ��., 2000; Anonymous,
2007f; Anonymous, 2009a; Anonymous, 2009b). In many countries, �� Choleraesuis is now
believed to be eradicated. However, the incidence in the United States does not seem to have
followed the same path as in Europe and��� Choleraesuis have not decreased to a similar level.
Thus, �� Choleraesuis represent a major swine pathogen in the United States and costs the
producers an estimated $100 million annually (Gray � ��., 1996; Uzzau � ��., 2000). Despite the
high prevalence in animals, it rarely causes human illness in the United States, with
approximately 40 cases annually (Foley � ��., 2008). Today, �� Choleraesuis is mainly a problem
in Southeast Asia, especially in Taiwan and Thailand, with high frequencies of human illness.
This may be due to little effort to prevent and control this serovar, but also as a consequence of
local small scale farming where infection control is difficult (Chiu � ��., 2004; Foley � ��., 2008;
Lee � ��., 2009; V; VI).
14

In many European countries, surveillance shows that �� Dublin is the most commonly isolated
serovar from bovine meat, exceeding the level of �� Typhimurium (Anonymous, 2009b). In 2007,
it was the most common serovar in bovine meat from both Denmark and the Netherlands with
68.2% and 63.3% of isolates, respectively. In the same year, �� Dublin was also ranked as the
most common serovar isolated from cattle herds in Austria (33.3%), Belgium (66.3%), Denmark
(52.3%), Ireland (82.5%), the Netherlands (63.6%), Sweden (34.8%), and the United Kingdom
(65.1%) among 15 European countries including Norway (Anonymous, 2009b).
It is difficult to estimate the frequency of ���Dublin among cattle isolates from outside of Europe
due to limited data. �� Dublin is not listed among the most common serovars in cattle from either
the Unites States, Canada or New Zealand (Wray � ��., 2000; Anonymous, 2007c; Anonymous,
2007d; Anonymous, 2008b).
Because the reservoirs of the host adapted serovars are known, and limited in number, countries
with a high number of human infections caused by these serovars could implement control
strategies to eradicate the serovars among the reservoir in order to limit the transmission to man.
�
��� ���������������������
The non-specific serovars are not restricted to a single host but able to colonize, and on occasion,
cause severe illness or gastroenteritis in a wide range of animal species (Uzzau � ��., 2000).
Today, more than 2.579 different serovars are known to man (Grimont � ��., 2007) but only a
limited number of approximately 50 serovars are predominantly found in domestic animals. The
primary reservoirs for the majority of the remaining serovars remain obscure.
Several factors complicate a clear picture of the true link between the serovars and the animal
reservoir such as the production systems (intensive / free range), irrigation (manure) and
contamination of food sources (cross contamination). In addition, only a limited number of
countries have established a systematic integrated laboratory-based surveillance system, which
includes data from both food and animals. Despite these factors, some serovars appear to be more
frequently associated with certain animal species and / or production systems than others.
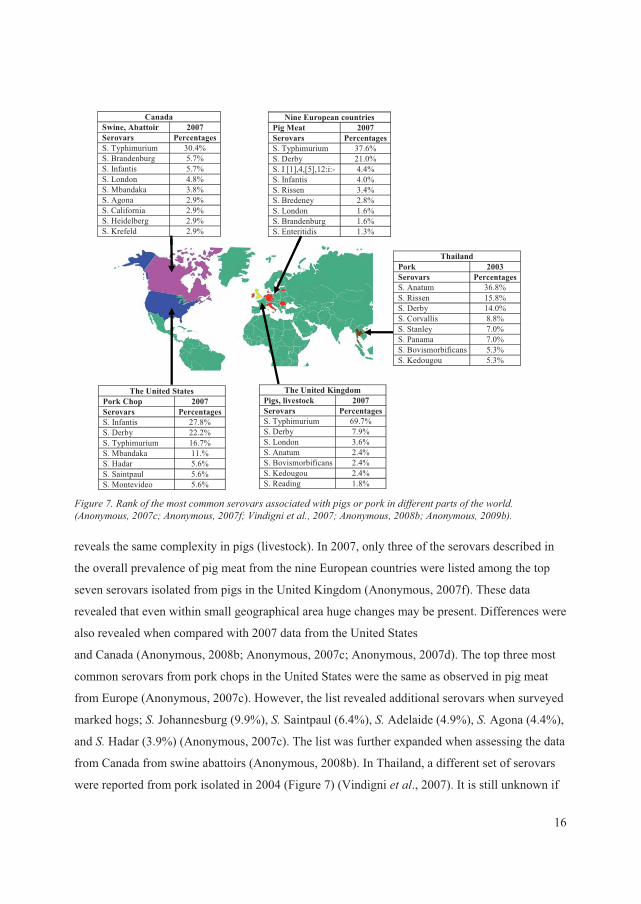
In Figure 7, the most commonly isolated serovars in 2007 from pig meat in eight European
countries are illustrated (Anonymous, 2009b). Only two serovars; ���Typhimurium and �� Derby
were common for all nine countries. The same distribution of serovars was observed for pig herds
for 17 European countries. A comparison with the incidents data from the United Kingdom
15
Canada Swine, Abattoir 2007 Serovars Percentages S. Typhimurium 30.4% S. Brandenburg 5.7% S. Infantis 5.7% S. London 4.8% S. Mbandaka 3.8% S. Agona 2.9% S. California 2.9% S. Heidelberg 2.9% S. Krefeld 2.9%
Nine European countries Pig Meat 2007 Serovars PercentagesS. Typhimurium 37.6% S. Derby 21.0% S. I [1],4,[5],12:i:- 4.4% S. Infantis 4.0% S. Rissen 3.4% S. Bredeney 2.8% S. London 1.6% S. Brandenburg 1.6% S. Enteritidis 1.3%
The United States Pork Chop 2007Serovars Percentages S. Infantis 27.8% S. Derby 22.2% S. Typhimurium 16.7% S. Mbandaka 11.% S. Hadar 5.6% S. Saintpaul 5.6% S. Montevideo 5.6%
The United Kingdom Pigs, livestock 2007 Serovars PercentagesS. Typhimurium 69.7% S. Derby 7.9% S. London 3.6% S. Anatum 2.4% S. Bovismorbificans 2.4% S. Kedougou 2.4% S. Reading 1.8%
Thailand Pork 2003 Serovars PercentagesS. Anatum 36.8% S. Rissen 15.8% S. Derby 14.0% S. Corvallis 8.8% S. Stanley 7.0% S. Panama 7.0% S. Bovismorbificans 5.3% S. Kedougou 5.3%
)�����3��;������� ������ ����������������������� ���- ����������������������� ���� ����� ���-�����+�����������1773�6������������1773�6�<������ �����17736������������1779�6������������177=�,��
reveals the same complexity in pigs (livestock). In 2007, only three of the serovars described i
the overall prevalence of pig meat from the nine European countries were listed among the top
seven serovars isolated from pigs in the United Kingdom (Anonymous, 2007f). These data
revealed that even within small geographical area huge changes may be present. Differences w
also revealed when compared with 2007 data from the United States
n
ere
and Canada (Anonymous, 2008b; Anonymous, 2007c; Anonymous, 2007d). The top three most
common serovars from pork chops in the United States were the same as observed in pig meat
from Europe (Anonymous, 2007c). However, the list revealed additional serovars when surveyed
marked hogs; �� Johannesburg (9.9%), �� Saintpaul (6.4%), �� Adelaide (4.9%), �� Agona (4.4%),
and �� Hadar (3.9%) (Anonymous, 2007c). The list was further expanded when assessing the data
from Canada from swine abattoirs (Anonymous, 2008b). In Thailand, a different set of serovars
were reported from pork isolated in 2004 (Figure 7) (Vindigni � ��., 2007). It is still unknown if
16
the huge number of serovars isolated from swine is a result of a better surveillance or if other
factors contribute to the increase of serovars (Lee � ��., 2009).
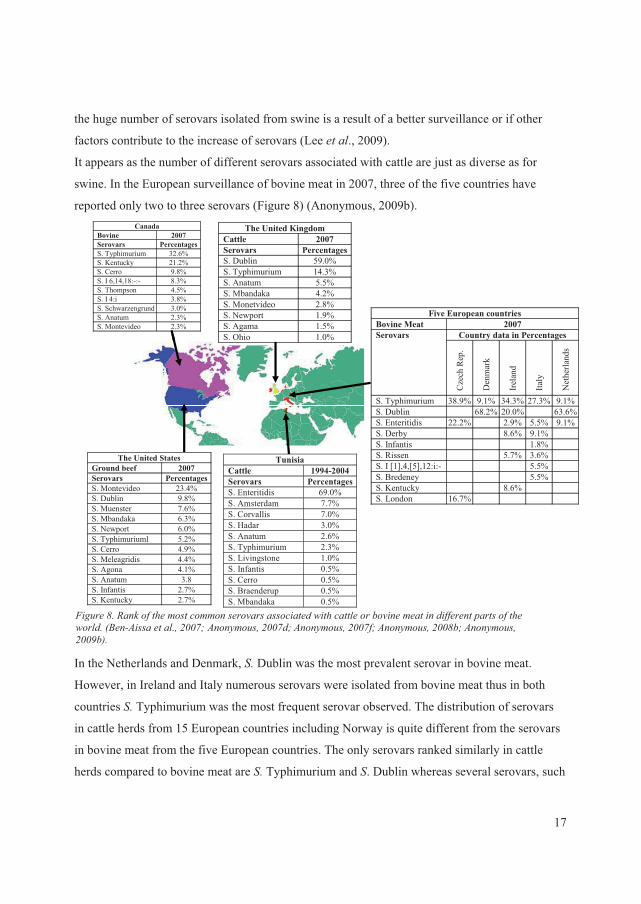
It appears as the number of different serovars associated with cattle are just as diverse as for
swine. In the European surveillance of bovine meat in 2007, three of the five countries have
reported only two to three serovars (Figure 8) (Anonymous, 2009b). Canada
In the Netherlands and Denmark, �� Dublin was the most prevalent serovar in bovine meat.
However, in Ireland and Italy numerous serovars were isolated from bovine meat thus in both
countries �� Typhimurium was the most frequent serovar observed. The distribution of serovars
in cattle herds from 15 European countries including Norway is quite different from the serovars
in bovine meat from the five European countries. The only serovars ranked similarly in cattle
herds compared to bovine meat are��� Typhimurium and �. Dublin whereas several serovars, such
)�����9��;������� ������ ����������������������� ���- ���� �������������� ���������� ���� ����� ���-�����+0��������� �����17736 �����������1773�6������������1773�6������������1779�6������������177=�,��
Bovine 2007 Serovars Percentages S. Typhimurium 32.6% S. Kentucky 21.2% S. Cerro 9.8% S. I 6,14,18:-:- 8.3% S. Thompson 4.5% S. I 4:i 3.8% S. Schwarzengrund 3.0% S. Anatum 2.3% S. Montevideo 2.3%
Five European countries Bovine Meat 2007
Country data in Percentages Serovars
Cze
ch R
ep.
Den
mar
k
Irel
and
Italy
Net
herla
nds
S. Typhimurium 38.9% 9.1% 34.3% 27.3% 9.1%S. Dublin 68.2% 20.0% 63.6%S. Enteritidis 22.2% 2.9% 5.5% 9.1%S. Derby 8.6% 9.1% S. Infantis 1.8% S. Rissen 5.7% 3.6% S. I [1],4,[5],12:i:- 5.5% S. Bredeney 5.5% S. Kentucky 8.6% S. London 16.7%
The United States Ground beef 2007 Serovars Percentages S. Montevideo 23.4% S. Dublin 9.8% S. Muenster 7.6% S. Mbandaka 6.3% S. Newport 6.0% S. Typhimuriuml 5.2% S. Cerro 4.9% S. Meleagridis 4.4% S. Agona 4.1% S. Anatum 3.8 S. Infantis 2.7% S. Kentucky 2.7%
The United Kingdom Cattle 2007 Serovars PercentagesS. Dublin 59.0% S. Typhimurium 14.3% S. Anatum 5.5% S. Mbandaka 4.2% S. Monetvideo 2.8% S. Newport 1.9% S. Agama 1.5% S. Ohio 1.0%
Tunisia Cattle 1994-2004 Serovars PercentagesS. Enteritidis 69.0% S. Amsterdam 7.7% S. Corvallis 7.0% S. Hadar 3.0% S. Anatum 2.6% S. Typhimurium 2.3% S. Livingstone 1.0% S. Infantis 0.5% S. Cerro 0.5% S. Braenderup 0.5% S. Mbandaka 0.5%
CanadaBovine 2007 Serovars Percentages S. Typhimurium 32.6% S. Kentucky 21.2% S. Cerro 9.8% S. I 6,14,18:-:- 8.3% S. Thompson 4.5% S. I 4:i 3.8% S. Schwarzengrund 3.0% S. Anatum 2.3% S. Montevideo 2.3%
Five European countries Bovine Meat 2007
Country data in Percentages Serovars
Cze
ch R
ep.
Den
mar
k
Irel
and
Italy
Net
herla
nds
S. Typhimurium 38.9% 9.1% 34.3% 27.3% 9.1%S. Dublin 68.2% 20.0% 63.6%S. Enteritidis 22.2% 2.9% 5.5% 9.1%S. Derby 8.6% 9.1% S. Infantis 1.8% S. Rissen 5.7% 3.6% S. I [1],4,[5],12:i:- 5.5% S. Bredeney 5.5% S. Kentucky 8.6% S. London 16.7%
The United States Ground beef 2007 Serovars Percentages S. Montevideo 23.4% S. Dublin 9.8% S. Muenster 7.6% S. Mbandaka 6.3% S. Newport 6.0% S. Typhimuriuml 5.2% S. Cerro 4.9% S. Meleagridis 4.4% S. Agona 4.1% S. Anatum 3.8 S. Infantis 2.7% S. Kentucky 2.7%
The United Kingdom Cattle 2007 Serovars PercentagesS. Dublin 59.0% S. Typhimurium 14.3% S. Anatum 5.5% S. Mbandaka 4.2% S. Monetvideo 2.8% S. Newport 1.9% S. Agama 1.5% S. Ohio 1.0%
Tunisia Cattle 1994-2004 Serovars PercentagesS. Enteritidis 69.0% S. Amsterdam 7.7% S. Corvallis 7.0% S. Hadar 3.0% S. Anatum 2.6% S. Typhimurium 2.3% S. Livingstone 1.0% S. Infantis 0.5% S. Cerro 0.5% S. Braenderup 0.5% S. Mbandaka 0.5%
17
as �. Anatum, �. Havana, �. Goldcoast, �. Give, �. Bovismorbificants, are not listed among the 10
most frequently isolated serovars in bovine meat (Anonymous, 2009b). The distribution of
serovars in cattle based on livestock incidents data was for the United Kingdom different from
the overall European data in 2007 (Anonymous, 2007f). In Tunisia, the prevalence of serovars in
cattle was quite different from Europe. Between 1994 to 2004, �� Enteritidis was ranked as the
most common followed by ���Amsterdam and ���Corvallis (Ben-Aissa � ��., 2007). In the United
States, �� Montevideo was the most common isolated serovar among ground beef followed by ��
Dublin (Anonymous, 2007d). �� Cerro seemed to be frequent in Canada where it was ranked as
the third most common serovar in cattle (Anonymous, 2008b).
�� Enteritidis is probably best known for its association with poultry (>��������) and egg.
Today, �� Enteritidis no longer ranks among the most common serovars in chickens in many
countries and the prevalence is decreasing in both egg and chicken. In 2007, �� Kentucky was
listed as the most common serovar in broiler meat from Europe. However, this included only four
(Austria, Czech Republic, Ireland, and Slovakia) out of 11 countries. All of the 11 countries in
the European survey have ranked����Enteritidis second (Figure 9) (Anonymous, 2009b). In 2007,
���Enteritidis is still ranked as the most common serovar isolated from flocks of >��������
among 14 European countries with exception of Germany where��� Livingstone is the most
predominant serovar. Interestingly, a comparison of predominant serovars between chicken meat
(>��������, and flocks of >�������� among European countries reveal some differences in
the ranking of serovars shared by both reservoirs. In addition, frequently isolated serovars present
in chicken meat such as �. Kentucky, �. Agona, �� Ohio, and �. Indiana are not ranked among the
10 most common serovars in flocks of >�������� whereas the opposite is the case with �.
Livingstone, �. Mbandaka, �. Seftenberg, and �. Bredeney (Anonymous, 2009b). In the United
Kingdom, additional serovars were observed being highly frequent mong chickens in 2007
(Anonymous, 2007f). The same tendency of �� Enteritidis decreasing was observed in 2007
among broilers in the United States (Anonymous, 2007d). The exact same pattern as observed in
the United States was seen in Canada where the same two serovars were listed first and second
with approximately the same percentages (Figure 9) (Anonymous, 2008b). There is a need to
regularly survey the primary animal reservoirs in order to detect the emergence of new and
emerging serovars or sub-types such as for instance �� Typhimurium DT 104, to elucidate their
epidemiology, and epidemic potential, and to conduct targeted interventions to avoid
18
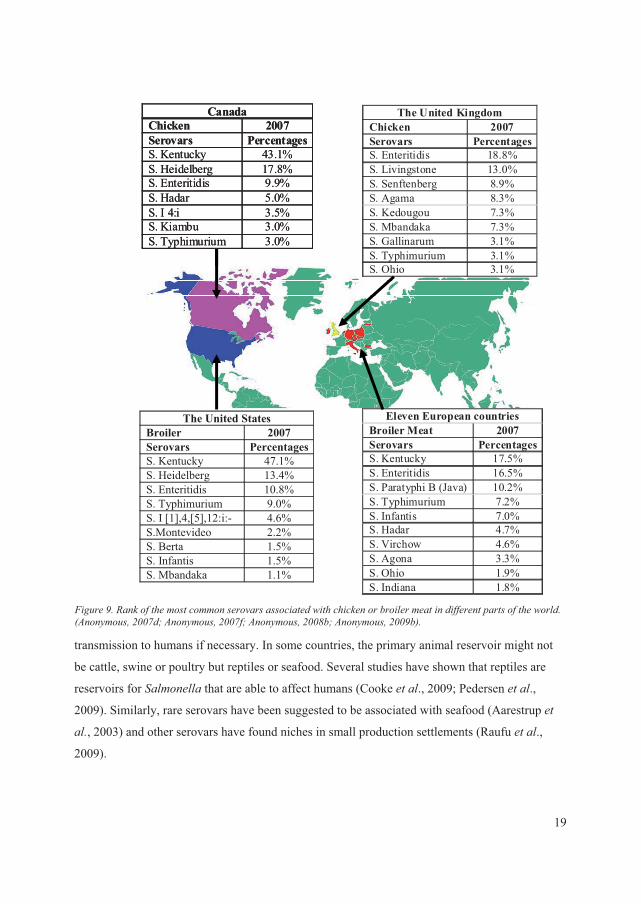
19
The United States Broiler 2007 Serovars PercentagesS. Kentucky 47.1% S. Heidelberg 13.4% S. Enteritidis 10.8% S. Typhimurium 9.0% S. I [1],4,[5],12:i:- 4.6% S.Montevideo 2.2% S. Berta 1.5% S. Infantis 1.5% S. Mbandaka 1.1%
Canada Chicken 2007 Serovars PercentagesS. Kentucky 43.1% S. Heidelberg 17.8% S. Enteritidis 9.9% S. Hadar 5.0% S. I 4:i 3.5% S. Kiambu 3.0% S. Typhimurium 3.0%
The United Kingdom Chicken 2007 Serovars PercentagesS. Enteritidis 18.8% S. Livingstone 13.0% S. Senftenberg 8.9% S. Agama 8.3% S. Kedougou 7.3% S. Mbandaka 7.3% S. Gallinarum 3.1% S. Typhimurium 3.1% S. Ohio 3.1%
Canada
Eleven European countries Broiler Meat 2007 Serovars PercentagesS. Kentucky 17.5% S. Enteritidis 16.5% S. Paratyphi B (Java) 10.2% S. Typhimurium 7.2% S. Infantis 7.0% S. Hadar 4.7% S. Virchow 4.6% S. Agona 3.3% S. Ohio 1.9% S. Indiana 1.8%
The United States Broiler 2007 Serovars PercentagesS. Kentucky 47.1% S. Heidelberg 13.4% S. Enteritidis 10.8% S. Typhimurium 9.0% S. I [1],4,[5],12:i:- 4.6% S.Montevideo 2.2% S. Berta 1.5% S. Infantis 1.5% S. Mbandaka 1.1%
Chicken 2007 Serovars PercentagesS. Kentucky 43.1% S. Heidelberg 17.8% S. Enteritidis 9.9% S. Hadar 5.0% S. I 4:i 3.5% S. Kiambu 3.0% S. Typhimurium 3.0%
The United Kingdom Chicken 2007 Serovars PercentagesS. Enteritidis 18.8% S. Livingstone 13.0% S. Senftenberg 8.9% S. Agama 8.3% S. Kedougou 7.3% S. Mbandaka 7.3% S. Gallinarum 3.1% S. Typhimurium 3.1% S. Ohio 3.1%
Eleven European countries Broiler Meat 2007 Serovars PercentagesS. Kentucky 17.5% S. Enteritidis 16.5% S. Paratyphi B (Java) 10.2% S. Typhimurium 7.2% S. Infantis 7.0% S. Hadar 4.7% S. Virchow 4.6% S. Agona 3.3% S. Ohio 1.9% S. Indiana 1.8%
transmission to humans if necessary. In some countries, the primary animal reservoir might not
be cattle, swine or poultry but reptiles or seafood. Several studies have shown that reptiles are
reservoirs for ������� that are able to affect humans (Cooke � ��., 2009; Pedersen � ��.,
2009). Similarly, rare serovars have been suggested to be associated with seafood (Aarestrup � �
��, 2003) and other serovars have found niches in small production settlements (Raufu � ��.,
2009).
)�����=��;������� ������ ����������������������� ���- ��������������������� ���������� ���� ����� ���-�����+�����������1773�6������������1773�6������������1779�6������������177=�,��
�
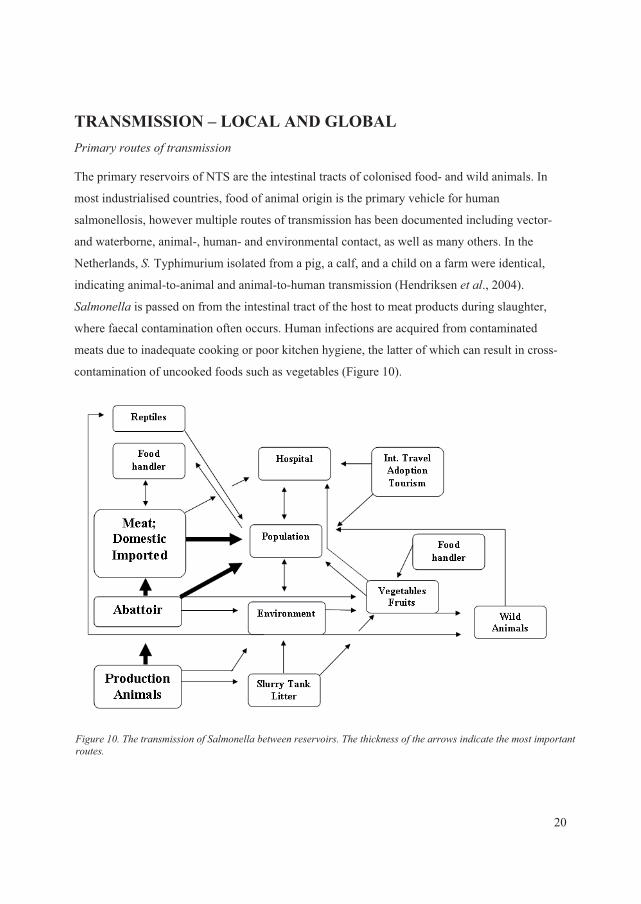
TRANSMISSION – LOCAL AND GLOBAL ���������� ������ ����������
The primary reservoirs of NTS are the intestinal tracts of colonised food- and wild animals. In
most industrialised countries, food of animal origin is the primary vehicle for human
salmonellosis, however multiple routes of transmission has been documented including vector-
and waterborne, animal-, human- and environmental contact, as well as many others. In the
Netherlands, �� Typhimurium isolated from a pig, a calf, and a child on a farm were identical,
indicating animal-to-animal and animal-to-human transmission (Hendriksen � ��., 2004).
������� is passed on from the intestinal tract of the host to meat products during slaughter,
where faecal contamination often occurs. Human infections are acquired from contaminated
meats due to inadequate cooking or poor kitchen hygiene, the latter of which can result in cross-
contamination of uncooked foods such as vegetables (Figure 10).
)�����*7������ ����������������������� -������������������� ����������� �������-������ �� ������ ����� �� ���� ����
20
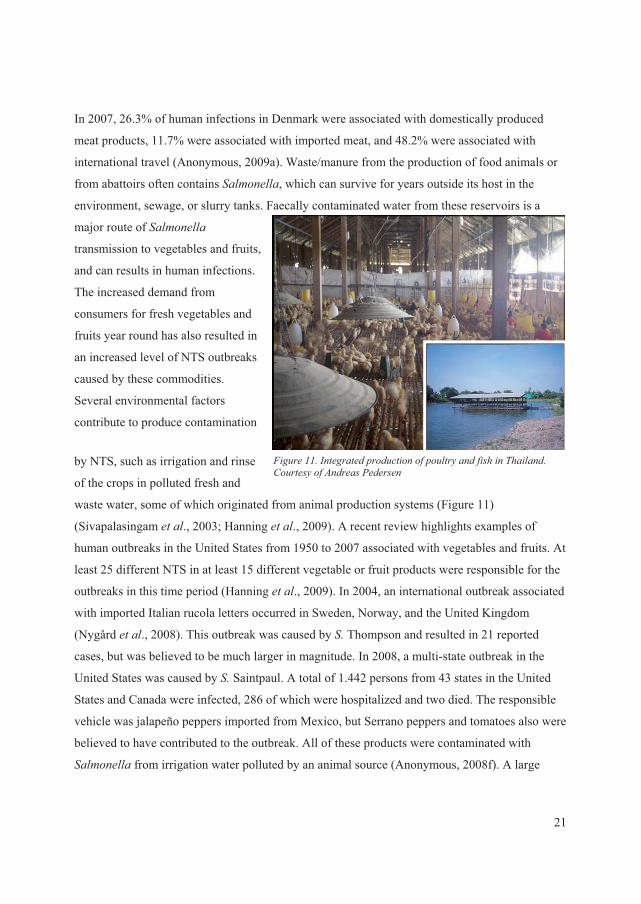
In 2007, 26.3% of human infections in Denmark were associated with domestically produced
meat products, 11.7% were associated with imported meat, and 48.2% were associated with
international travel (Anonymous, 2009a). Waste/manure from the production of food animals or
from abattoirs often contains �������, which can survive for years outside its host in the
environment, sewage, or slurry tanks. Faecally contaminated water from these reservoirs is a
major route of �������
transmission to vegetables and fruits,
and can results in human infections.
The increased demand from
consumers for fresh vegetables and
fruits year round has also resulted in
an increased level of NTS outbreaks
caused by these commodities.
Several environmental factors
contribute to produce contamination
by NTS, such as irrigation and rinse
of the crops in polluted fresh and
waste water, some of which originated from animal production systems (Figure 11)
(Sivapalasingam � ��., 2003; Hanning � ��., 2009). A recent review highlights examples of
human outbreaks in the United States from 1950 to 2007 associated with vegetables and fruits. At
least 25 different NTS in at least 15 different vegetable or fruit products were responsible for the
outbreaks in this time period (Hanning � ��., 2009). In 2004, an international outbreak associated
with imported Italian rucola letters occurred in Sweden, Norway, and the United Kingdom
(Nygård � ��., 2008). This outbreak was caused by �� Thompson and resulted in 21 reported
cases, but was believed to be much larger in magnitude. In 2008, a multi-state outbreak in the
United States was caused by �� Saintpaul. A total of 1.442 persons from 43 states in the United
States and Canada were infected, 286 of which were hospitalized and two died. The responsible
vehicle was jalapeño peppers imported from Mexico, but Serrano peppers and tomatoes also were
believed to have contributed to the outbreak. All of these products were contaminated with
������� from irrigation water polluted by an animal source (Anonymous, 2008f). A large
)�����**�� � ���� ��������� ��������� ���������������������$��� ������������������������
21
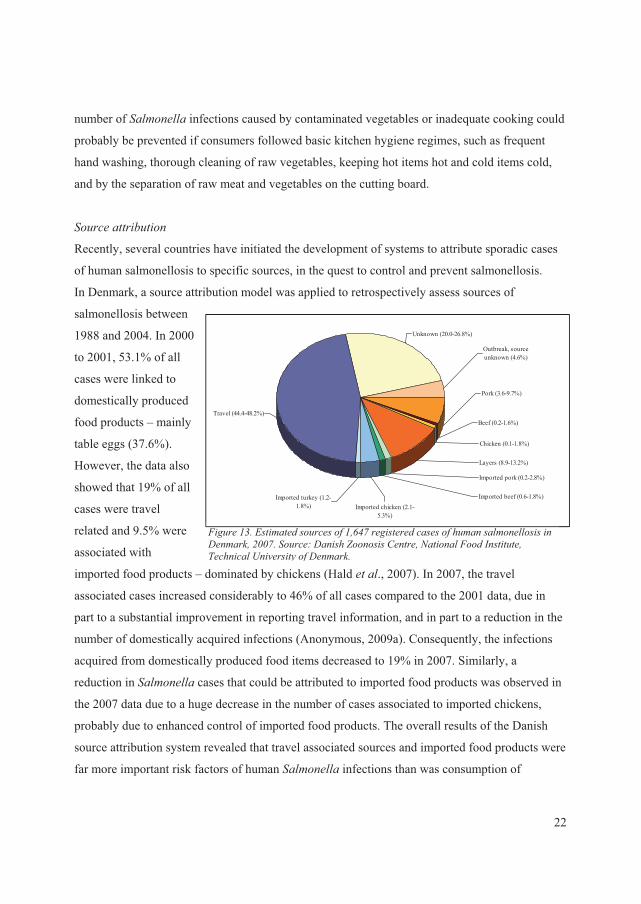
number of ������� infections caused by contaminated vegetables or inadequate cooking could
probably be prevented if consumers followed basic kitchen hygiene regimes, such as frequent
hand washing, thorough cleaning of raw vegetables, keeping hot items hot and cold items cold,
and by the separation of raw meat and vegetables on the cutting board.
�
�������� ��� ���
Recently, several countries have initiated the development of systems to attribute sporadic cases
of human salmonellosis to specific sources, in the quest to control and prevent salmonellosis.
In Denmark, a source attribution model was applied to retrospectively assess sources of
salmonellosis between
1988 and 2004. In 2000
to 2001, 53.1% of all
cases were linked to
domestically produced
food products – mainly
table eggs (37.6%).
However, the data also
showed that 19% of all
cases were travel
related and 9.5% were
associated with
imported food products – dominated by chickens (Hald � ��., 2007). In 2007, the travel
associated cases increased considerably to 46% of all cases compared to the 2001 data, due in
part to a substantial improvement in reporting travel information, and in part to a reduction in the
number of domestically acquired infections (Anonymous, 2009a). Consequently, the infections
acquired from domestically produced food items decreased to 19% in 2007. Similarly, a
reduction in ������� cases that could be attributed to imported food products was observed in
the 2007 data due to a huge decrease in the number of cases associated to imported chickens,
probably due to enhanced control of imported food products. The overall results of the Danish
source attribution system revealed that travel associated sources and imported food products were
far more important risk factors of human ������� infections than was consumption of
Travel (44.4-48.2%)
Unknown (20.0-26.8%)
Outbreak, source unknown (4.6%)
Pork (3.6-9.7%)
Chicken (0.1-1.8%)
Beef (0.2-1.6%)
Layers (8.9-13.2%)
Imported turkey (1.2-1.8%) Imported chicken (2.1-
5.3%)
Imported beef (0.6-1.8%)
Imported pork (0.2-2.8%)
)�����*2��'� �� ��������������*�843����� ��������������������������������/��������1773��������"�/�����?�������$�� ����@� ����)���� �� � �����������A����� �����/�������
22
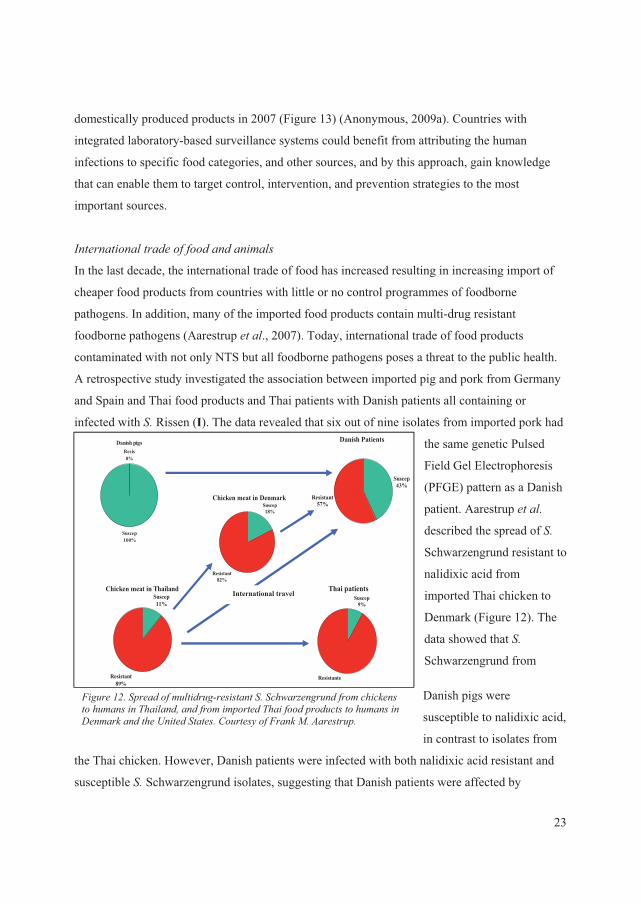
domestically produced products in 2007 (Figure 13) (Anonymous, 2009a). Countries with
integrated laboratory-based surveillance systems could benefit from attributing the human
infections to specific food categories, and other sources, and by this approach, gain knowledge
that can enable them to target control, intervention, and prevention strategies to the most
important sources.
� ���� ���� �����������������������
Danish pigs
Suscep100%
Resis0%
Danish Patients
Suscep43%
Resistant57%
Chicken meat in ThailandSuscep11%
Resistant89%
Thai patientsSuscep
9%
Resistante
Chicken meat in DenmarkSuscep18%
Resistant82%
In the last decade, the international trade of food has increased resulting in increasing import of
cheaper food products from countries with little or no control programmes of foodborne
pathogens. In addition, many of the imported food products contain multi-drug resistant
foodborne pathogens (Aarestrup � ��., 2007). Today, international trade of food products
contaminated with not only NTS but all foodborne pathogens poses a threat to the public health.
A retrospective study investigated the association between imported pig and pork from Germany
and Spain and Thai food products and Thai patients with Danish patients all containing or
infected with �� Rissen (I). The data revealed that six out of nine isolates from imported pork had
the same genetic Pulsed
Field Gel Electrophoresis
(PFGE) pattern as a Danish
patient. Aarestrup � ����
described the spread of ���
Schwarzengrund resistant to
nalidixic acid from
imported Thai chicken to
Denmark (Figure 12). The
data showed that ��
Schwarzengrund from
Danish pigs were
susceptible to nalidixic acid,
in contrast to isolates from
the Thai chicken. However, Danish patients were infected with both nalidixic acid resistant and
susceptible �� Schwarzengrund isolates, suggesting that Danish patients were affected by
International travel
)�����*1�������������� ��������� �� �������-��(��������������������� �������������������������������� ������������������ �� �����������/����������� ���A� ���� � ����$��� �������)�����%������� �����
23
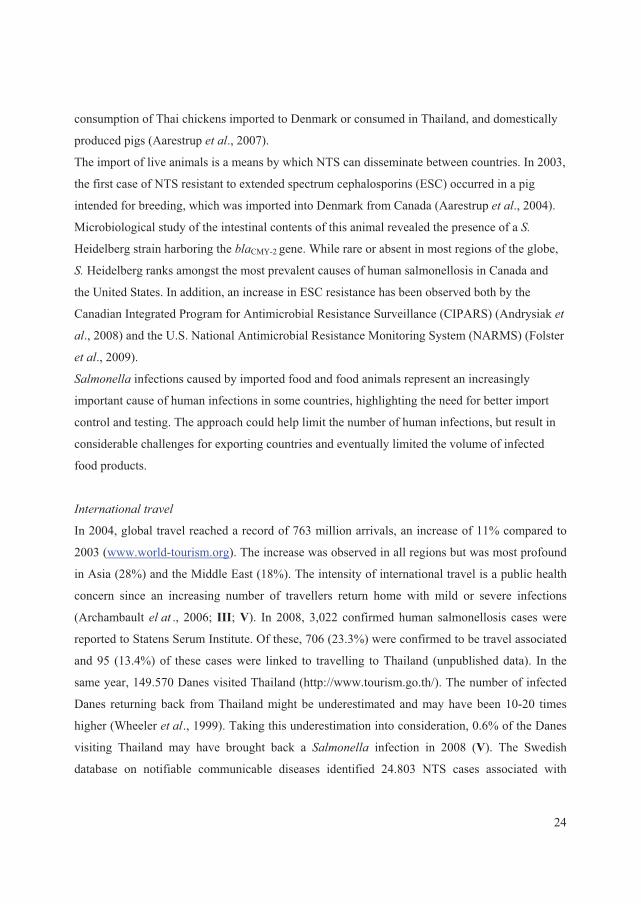
consumption of Thai chickens imported to Denmark or consumed in Thailand, and domestically
produced pigs (Aarestrup � ��., 2007).
The import of live animals is a means by which NTS can disseminate between countries. In 2003,
the first case of NTS resistant to extended spectrum cephalosporins (ESC) occurred in a pig
intended for breeding, which was imported into Denmark from Canada (Aarestrup � ��., 2004).
Microbiological study of the intestinal contents of this animal revealed the presence of a ��
Heidelberg strain harboring the ��CMY-2 gene. While rare or absent in most regions of the globe,
�� Heidelberg ranks amongst the most prevalent causes of human salmonellosis in Canada and
the United States. In addition, an increase in ESC resistance has been observed both by the
Canadian Integrated Program for Antimicrobial Resistance Surveillance (CIPARS) (Andrysiak � �
�., 2008) and the U.S. National Antimicrobial Resistance Monitoring System (NARMS) (Folster
� ��., 2009).
������� infections caused by imported food and food animals represent an increasingly
important cause of human infections in some countries, highlighting the need for better import
control and testing. The approach could help limit the number of human infections, but result in
considerable challenges for exporting countries and eventually limited the volume of infected
food products.
� ���� ���� �����
In 2004, global travel reached a record of 763 million arrivals, an increase of 11% compared to
2003 (www.world-tourism.org). The increase was observed in all regions but was most profound
in Asia (28%) and the Middle East (18%). The intensity of international travel is a public health
concern since an increasing number of travellers return home with mild or severe infections
(Archambault ��� ., 2006; III; V). In 2008, 3,022 confirmed human salmonellosis cases were
reported to Statens Serum Institute. Of these, 706 (23.3%) were confirmed to be travel associated
and 95 (13.4%) of these cases were linked to travelling to Thailand (unpublished data). In the
same year, 149.570 Danes visited Thailand (http://www.tourism.go.th/). The number of infected
Danes returning back from Thailand might be underestimated and may have been 10-20 times
higher (Wheeler � ��., 1999). Taking this underestimation into consideration, 0.6% of the Danes
visiting Thailand may have brought back a ������� infection in 2008 (V). The Swedish
database on notifiable communicable diseases identified 24.803 NTS cases associated with
24

international travel from 1997 to 2003. High risk of disease was seen in travellers returning from
Africa, India, and Southeast Asia (Ekdahl � ��., 2004).
Three recent studies have linked Danish patients, suffering from either gastrointestinal infections
or bacteremia, with travel to Thailand (Archambault � �� ., 2006; III; V). One investigation
linked six �� Rissen isolates recovered from Danish patients with travel to Thailand, where
genetically identical �� Rissen isolates were found. In addition, several of the isolates shared the
same phenotypic and genotypic antimicrobial susceptibility patterns (III). Similarly, sporadic
cases of travel associated salmonellosis have been frequently described (Collard � �� .; 2007;
Kasper � ��.; 2009). Recently, an outbreak of travel associated �� Enteritidis illness was detected
in Finland. Petrov � ��. linked Finnish outbreak strains with strains from Sunny Beach, Bulgaria
where employees at a hotel were also infected. The outbreak likely included tourists from the
United Kingdom, Norway, Sweden, and Germany (Petrov � ��., 2009).
Multiple studies have revealed that international travel to certain destinations is associated with a
relatively high risk of human salmonellosis. However, little has been done to avoid it. The best
way to prevent it is ensure an adequate level of food safety globally, and by educating the general
population about food borne disease prevention under different circumstances.
� ���� �������� ����
The international adoption of children carrying and transmitting infectious diseases is probably a
minor but clearly an overlooked problem. Since 1986, nearly 220.000 children have been adopted
by North American families (Miller � ��., 2005). In 2007, the most common countries of origin
for Danish adoptions were China, Vietnam, South Africa and Ethiopia. For U.S. adoptions, most
were from China, Guatemala, Russia and Ethiopia (IV). Today, international adoption medicine
is a relatively new specialization in paediatrics that has emerged to address the specific health
care needs of children and their adoptive families (Miller � ��., 2005). Common infectious
diseases in adopted children include tuberculosis, hepatitis B and C, HIV, syphilis, parasites and
enteric infectious diseases (Miller � ��., 2005). In 1997 and 1998, a study determined the
prevalence of infectious diseases among 504 adoptees. The data revealed that 90% of the stools
were abnormal and that two of the children carried a ������� species (Saiman � ��., 2001).
25
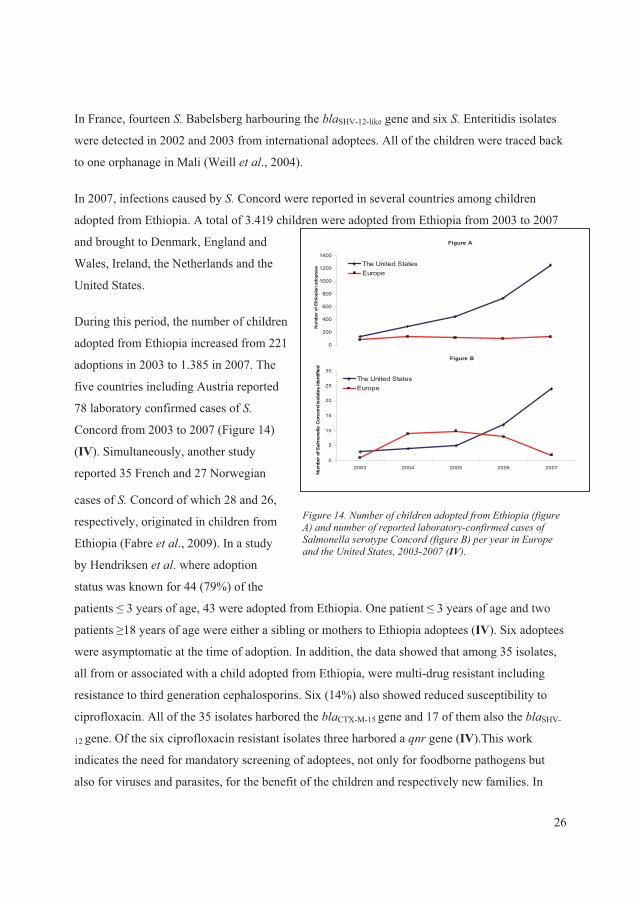
In France, fourteen �� Babelsberg harbouring the ��SHV-12-like gene and six �� Enteritidis isolates
were detected in 2002 and 2003 from international adoptees. All of the children were traced back
to one orphanage in Mali (Weill � ��., 2004).
Figure A
0
200
400
600
800
1000
1200
1400
1
Num
ber o
f Eth
iopi
an a
dopt
ees The United States
Europe
Figure B
0
5
10
15
20
25
30
2003 2004 2005 2006 2007
Num
ber o
f Salmonella
Con
cord
isol
ates
iden
tifie
d
The United StatesEurope
In 2007, infections caused by �� Concord were reported in several countries among children
adopted from Ethiopia. A total of 3.419 children were adopted from Ethiopia from 2003 to 2007
and brought to Denmark, England and
Wales, Ireland, the Netherlands and the
United States.
During this period, the number of children
adopted from Ethiopia increased from 221
adoptions in 2003 to 1.385 in 2007. The
five countries including Austria reported
78 laboratory confirmed cases of ��
Concord from 2003 to 2007 (Figure 14)
(IV). Simultaneously, another study
reported 35 French and 27 Norwegian
cases of �� Concord of which 28 and 26,
respectively, originated in children from
Ethiopia (Fabre � ��., 2009). In a study
by Hendriksen � ��. where adoption
status was known for 44 (79%) of the
patients � 3 years of age, 43 were adopted from Ethiopia. One patient � 3 years of age and two
patients �18 years of age were either a sibling or mothers to Ethiopia adoptees (IV). Six adoptees
were asymptomatic at the time of adoption. In addition, the data showed that among 35 isolates,
all from or associated with a child adopted from Ethiopia, were multi-drug resistant including
resistance to third generation cephalosporins. Six (14%) also showed reduced susceptibility to
ciprofloxacin. All of the 35 isolates harbored the ��CTX-M-15 gene and 17 of them also the ��SHV-
12 gene. Of the six ciprofloxacin resistant isolates three harbored a B�� gene (IV).This work
indicates the need for mandatory screening of adoptees, not only for foodborne pathogens but
also for viruses and parasites, for the benefit of the children and respectively new families. In
)�����*4��@�������������������� ��������' �����+�������,�������������������� �������� ���������������������������������� ����$�������+������0,������������'���������� ���A� ���� � ����1772�1773�+IV,���
26
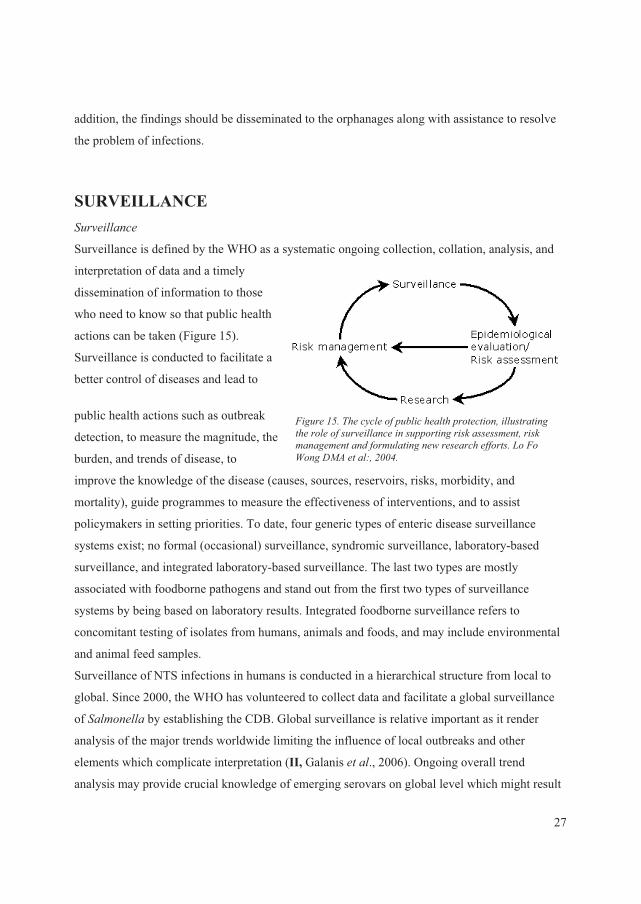
addition, the findings should be disseminated to the orphanages along with assistance to resolve
the problem of infections.
SURVEILLANCE�����������
Surveillance is defined by the WHO as a systematic ongoing collection, collation, analysis, and
interpretation of data and a timely
dissemination of information to those
who need to know so that public health
actions can be taken (Figure 15).
Surveillance is conducted to facilitate a
better control of diseases and lead to
public health actions such as outbreak
detection, to measure the magnitude, the
burden, and trends of disease, to
improve the knowledge of the disease (causes, sources, reservoirs, risks, morbidity, and
mortality), guide programmes to measure the effectiveness of interventions, and to assist
policymakers in setting priorities. To date, four generic types of enteric disease surveillance
systems exist; no formal (occasional) surveillance, syndromic surveillance, laboratory-based
surveillance, and integrated laboratory-based surveillance. The last two types are mostly
associated with foodborne pathogens and stand out from the first two types of surveillance
systems by being based on laboratory results. Integrated foodborne surveillance refers to
concomitant testing of isolates from humans, animals and foods, and may include environmental
and animal feed samples.
)�����*:���������������������� ����� �� ������ �� ��� ���������������������������� ���������������� ��������������� ����������� �����-��������������� ���C��)��D����/%��� ��"��1774��
Surveillance of NTS infections in humans is conducted in a hierarchical structure from local to
global. Since 2000, the WHO has volunteered to collect data and facilitate a global surveillance
of ������� by establishing the CDB. Global surveillance is relative important as it render
analysis of the major trends worldwide limiting the influence of local outbreaks and other
elements which complicate interpretation (II, Galanis � ��., 2006). Ongoing overall trend
analysis may provide crucial knowledge of emerging serovars on global level which might result
27
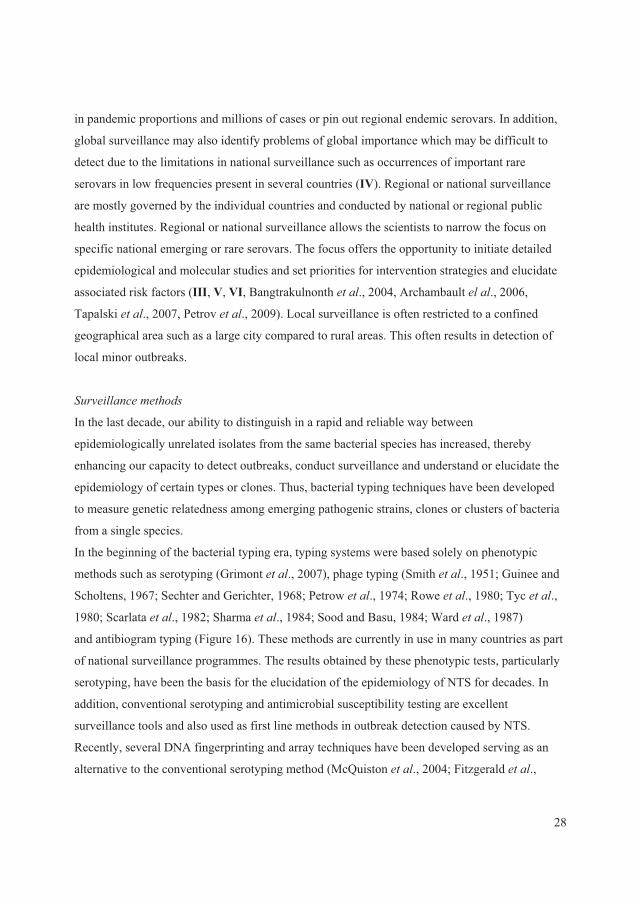
in pandemic proportions and millions of cases or pin out regional endemic serovars. In addition,
global surveillance may also identify problems of global importance which may be difficult to
detect due to the limitations in national surveillance such as occurrences of important rare
serovars in low frequencies present in several countries (IV). Regional or national surveillance
are mostly governed by the individual countries and conducted by national or regional public
health institutes. Regional or national surveillance allows the scientists to narrow the focus on
specific national emerging or rare serovars. The focus offers the opportunity to initiate detailed
epidemiological and molecular studies and set priorities for intervention strategies and elucidate
associated risk factors (III, V, VI, Bangtrakulnonth � ��., 2004, Archambault ���., 2006,
Tapalski � ��., 2007, Petrov � ��., 2009). Local surveillance is often restricted to a confined
geographical area such as a large city compared to rural areas. This often results in detection of
local minor outbreaks.
�
������������ �����
In the last decade, our ability to distinguish in a rapid and reliable way between
epidemiologically unrelated isolates from the same bacterial species has increased, thereby
enhancing our capacity to detect outbreaks, conduct surveillance and understand or elucidate the
epidemiology of certain types or clones. Thus, bacterial typing techniques have been developed
to measure genetic relatedness among emerging pathogenic strains, clones or clusters of bacteria
from a single species.
In the beginning of the bacterial typing era, typing systems were based solely on phenotypic
methods such as serotyping (Grimont � ��., 2007), phage typing (Smith � ��., 1951; Guinee and
Scholtens, 1967; Sechter and Gerichter, 1968; Petrow � ��., 1974; Rowe � ��., 1980; Tyc � ��.,
1980; Scarlata � ��., 1982; Sharma � ��., 1984; Sood and Basu, 1984; Ward � ��., 1987)
and antibiogram typing (Figure 16). These methods are currently in use in many countries as part
of national surveillance programmes. The results obtained by these phenotypic tests, particularly
serotyping, have been the basis for the elucidation of the epidemiology of NTS for decades. In
addition, conventional serotyping and antimicrobial susceptibility testing are excellent
surveillance tools and also used as first line methods in outbreak detection caused by NTS.
Recently, several DNA fingerprinting and array techniques have been developed serving as an
alternative to the conventional serotyping method (McQuiston � ��., 2004; Fitzgerald � ��.,
28
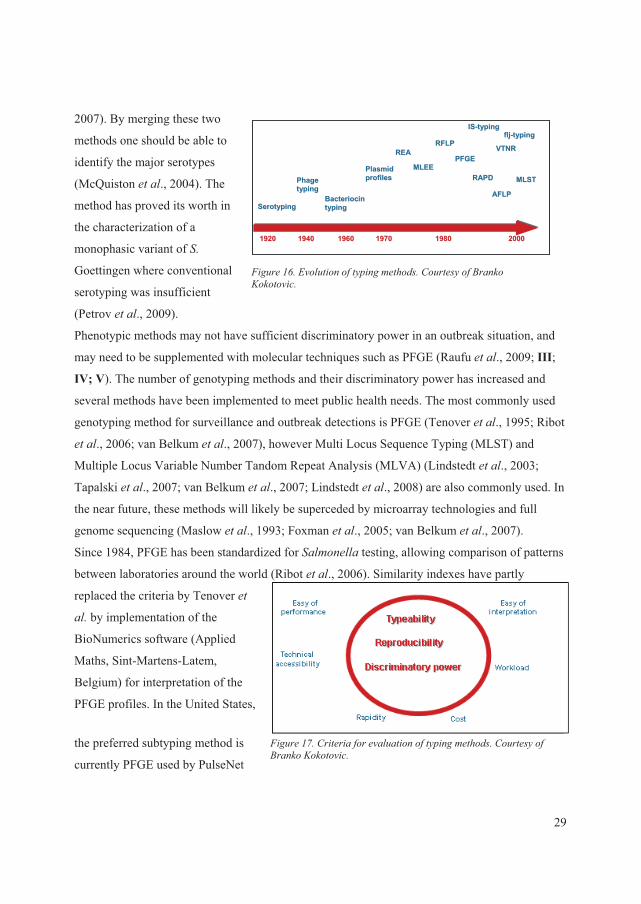
2007). By merging these two
methods one should be able to
identify the major serotypes
(McQuiston � ��., 2004). The
method has proved its worth in
the characterization of a
monophasic variant of ��
Goettingen where conventional
serotyping was insufficient
(Petrov � ��., 2009).
Phenotypic methods may not have sufficient discriminatory power in an outbreak situation, and
may need to be supplemented with molecular techniques such as PFGE (Raufu � ��., 2009; III;
IV; V). The number of genotyping methods and their discriminatory power has increased and
several methods have been implemented to meet public health needs. The most commonly used
genotyping method for surveillance and outbreak detections is PFGE (Tenover � ��., 1995; Ribot
� ��., 2006; van Belkum � ��., 2007), however Multi Locus Sequence Typing (MLST) and
Multiple Locus Variable Number Tandom Repeat Analysis (MLVA) (Lindstedt � ��., 2003;
Tapalski � ��., 2007; van Belkum � ��., 2007; Lindstedt � ��., 2008) are also commonly used. In
the near future, these methods will likely be superceded by microarray technologies and full
genome sequencing (Maslow � ��., 1993; Foxman � ��., 2005; van Belkum � ��., 2007).
Since 1984, PFGE has been standardized for ������� testing, allowing comparison of patterns
between laboratories around the world (Ribot � ��., 2006). Similarity indexes have partly
replaced the criteria by Tenover � �
�� by implementation of the
BioNumerics software (Applied
Maths, Sint-Martens-Latem,
Belgium) for interpretation of the
PFGE profiles. In the United States,
the preferred subtyping method is
currently PFGE used by PulseNet
)�����*8��'��� ������ ������� ������$��� �������0������E��� �����
)�����*3��$� ������������� ������ ������� ������$��� �������0������E��� �����
SSeerroottyyppiinngg
PPhhaaggeettyyppiinngg
BBaacctteerriioocciinnttyyppiinngg
PPllaassmmiiddpprrooffiilleess
RREEAA
MMLLEEEE
RRFFLLPP
PPFFGGEE
RRAAPPDD
AAFFLLPP
MMLLSSTT
11992200 11994400 11996600 11997700 11998800 22000000
IISS--ttyyppiinngg
VVTTNNRR
fflljj--ttyyppiinngg
29
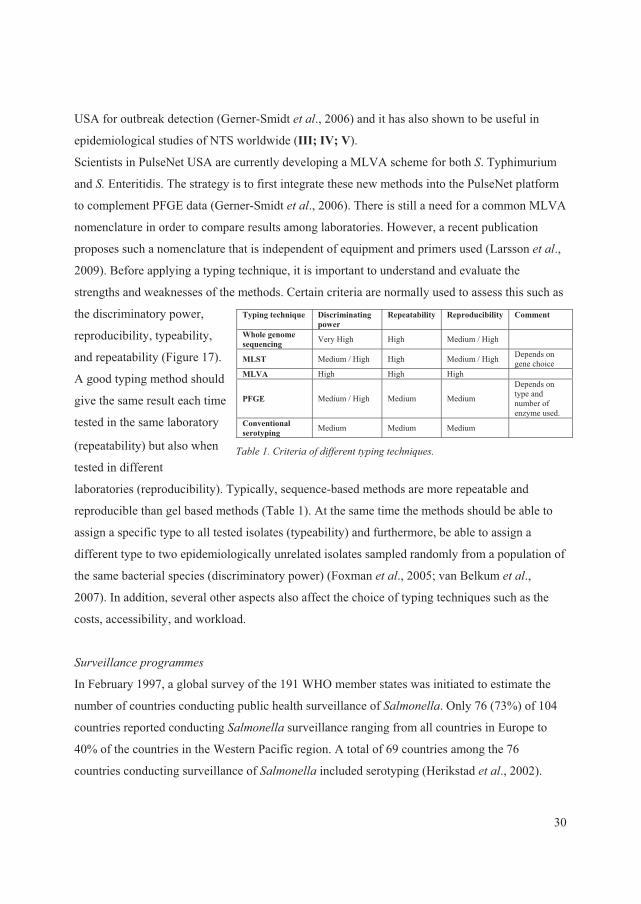
USA for outbreak detection (Gerner-Smidt � ��., 2006) and it has also shown to be useful in
epidemiological studies of NTS worldwide (III; IV; V).
Scientists in PulseNet USA are currently developing a MLVA scheme for both �. Typhimurium
and �� Enteritidis. The strategy is to first integrate these new methods into the PulseNet platform
to complement PFGE data (Gerner-Smidt � ��., 2006). There is still a need for a common MLVA
nomenclature in order to compare results among laboratories. However, a recent publication
proposes such a nomenclature that is independent of equipment and primers used (Larsson � ��.,
2009). Before applying a typing technique, it is important to understand and evaluate the
strengths and weaknesses of the methods. Certain criteria are normally used to assess this such as
the discriminatory power,
reproducibility, typeability,
and repeatability (Figure 17).
�����*��$� �������������� � ����� ����B������
A good typing method should
give the same result each time
tested in the same laboratory
(repeatability) but also when
tested in different
laboratories (reproducibility). Typically, sequence-based methods are more repeatable and
reproducible than gel based methods (Table 1). At the same time the methods should be able to
assign a specific type to all tested isolates (typeability) and furthermore, be able to assign a
different type to two epidemiologically unrelated isolates sampled randomly from a population of
the same bacterial species (discriminatory power) (Foxman � ��., 2005; van Belkum � ��.,
2007). In addition, several other aspects also affect the choice of typing techniques such as the
costs, accessibility, and workload.
Typing technique Discriminating power
Repeatability Reproducibility Comment
Whole genome sequencing Very High High Medium / High
MLST Medium / High High Medium / High Depends on gene choice
MLVA High High High
PFGE Medium / High Medium Medium
Depends on type and number of enzyme used.
Conventional serotyping Medium Medium Medium
����������������������
In February 1997, a global survey of the 191 WHO member states was initiated to estimate the
number of countries conducting public health surveillance of �������. Only 76 (73%) of 104
countries reported conducting ������� surveillance ranging from all countries in Europe to
40% of the countries in the Western Pacific region. A total of 69 countries among the 76
countries conducting surveillance of ������� included serotyping (Herikstad � ��., 2002).
30
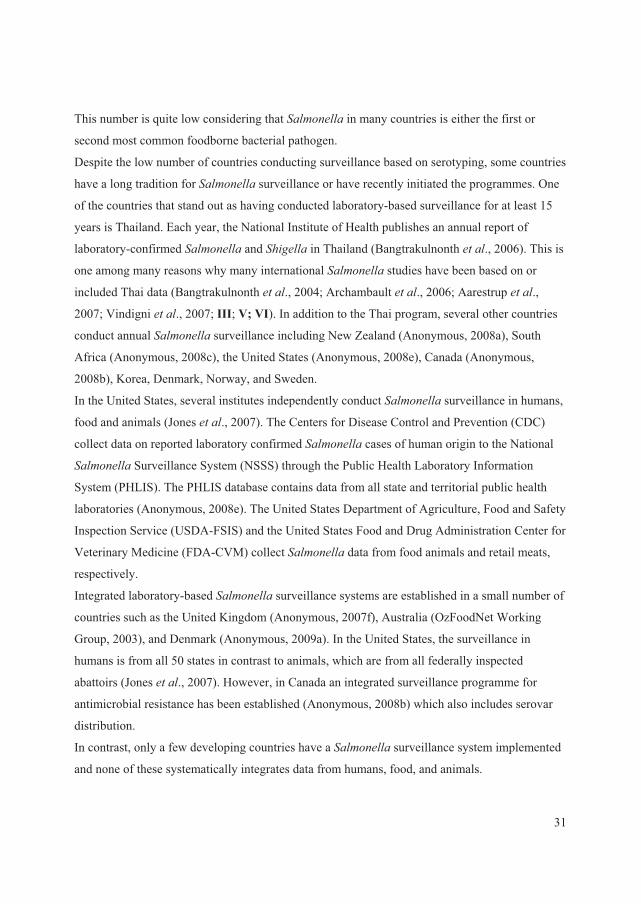
This number is quite low considering that ������� in many countries is either the first or
second most common foodborne bacterial pathogen.
Despite the low number of countries conducting surveillance based on serotyping, some countries
have a long tradition for ������� surveillance or have recently initiated the programmes. One
of the countries that stand out as having conducted laboratory-based surveillance for at least 15
years is Thailand. Each year, the National Institute of Health publishes an annual report of
laboratory-confirmed ������� and ����� in Thailand (Bangtrakulnonth � ��., 2006). This is
one among many reasons why many international ������� studies have been based on or
included Thai data (Bangtrakulnonth � ��., 2004; Archambault � ��., 2006; Aarestrup � ��.,
2007; Vindigni � ��., 2007; III; V; VI). In addition to the Thai program, several other countries
conduct annual ������� surveillance including New Zealand (Anonymous, 2008a), South
Africa (Anonymous, 2008c), the United States (Anonymous, 2008e), Canada (Anonymous,
2008b), Korea, Denmark, Norway, and Sweden.
In the United States, several institutes independently conduct ������� surveillance in humans,
food and animals (Jones � ��., 2007). The Centers for Disease Control and Prevention (CDC)
collect data on reported laboratory confirmed ������� cases of human origin to the National
������� Surveillance System (NSSS) through the Public Health Laboratory Information
System (PHLIS). The PHLIS database contains data from all state and territorial public health
laboratories (Anonymous, 2008e). The United States Department of Agriculture, Food and Safety
Inspection Service (USDA-FSIS) and the United States Food and Drug Administration Center for
Veterinary Medicine (FDA-CVM) collect ������� data from food animals and retail meats,
respectively.
Integrated laboratory-based ������� surveillance systems are established in a small number of
countries such as the United Kingdom (Anonymous, 2007f), Australia (OzFoodNet Working
Group, 2003), and Denmark (Anonymous, 2009a). In the United States, the surveillance in
humans is from all 50 states in contrast to animals, which are from all federally inspected
abattoirs (Jones � ��., 2007). However, in Canada an integrated surveillance programme for
antimicrobial resistance has been established (Anonymous, 2008b) which also includes serovar
distribution.
In contrast, only a few developing countries have a ������� surveillance system implemented
and none of these systematically integrates data from humans, food, and animals.
31
In developing countries, information on foodborne pathogens is limited due to several factors
such as patients who do not seek medical care, samples that are not processed and/or reported
data to central public health institutes. In Mexico, syndromic surveillance was replaced in 2002
by an integrated laboratory-based surveillance system in four states. The sampling scheme was
designed to follow the food chain in a temporal mode. In a test week, food animal intestines were
collected on the first sampling day, followed by raw retail meats on the second to the fourth day.
From day 7 to 14, fecal samples from asymptomatic children were collected. This surveillance
revealed high rates of contaminated meat and ceftriaxone resistant salmonellae. Genotyping data
showed 14 PFGE clusters with indistinguishable patterns associated with human, retail meat, and
food animals (Zaidi � ��., 2008). This approach could be technical feasible for many developing
countries for future surveillance efforts. Unfortunately, it is too expensive why the described
study is currently not operating.
One could wish that WHO had the power and authority to strengthen through Codex
Alimentarius mandatory laboratory-based surveillance of foodborne pathogens in food animals,
food and humans in order to gain detailed data for initiating action to prevent human
salmonellosis.
�������������� ��� ����� ���� �������� ������������������������������
In 2003, the European Parliament and Council, adopted; Directive 2003/99/EC on the monitoring
of zoonoses and zoonotic agents (Anonymous, 2003a; O’Brien et al., 2005) amending Decision
90/424/EEC (Anonymous, 1990) and repealing Council Directive 92/117/EEC (Anonymous,
1992). The purpose of the Directive 2003/99/EC was, among other things, to ensure a proper and
harmonised surveillance of zoonoses including �������. The Directive was supplemented later
the same years with the Regulation 2160/2003 on the control of ������� and other specified
foodborne zoonotic agents, which in principle should cover the whole food chain, from farm to
table (breeding flocks of Gallus gallus, laying hens, broilers, turkeys, herds of slaughter, pigs,
breeding herds of pigs) (Anonymous, 2003b; O’Brien � ��., 2005). The sampling should take
place over a three year period with the possibility of extension. The surveillance should take
place on a harmonised basis by all member states according the detailed rules laid down in the
regulation. In addition, all national reference laboratories should participate in proficiency testing
arranged by the Community Reference Laboratory (CRL) to insure a high quality of the results
32

1
6
7
89
10 11
2
34
5
1
2
34
5
6
7
8
910 11
1
2
34
5
6
7
8
910 12
1
2
3
4
5
6
8
9
1314 16
1
2
3
4
5
6
910 11 15
8
submitted. The data are
complied and published
annually by the European
Food Safety Authority
(EFSA) (Anonymous,
2009b) including human
data collected by European
Centre for Disease
Prevention and Control
(ECDC) and through the
European Surveillance
System.
Others (1)S. Enteritidis (2)S. Stanley (3)S. Weltevreden (4)S. Rissen (5)S. I 4, 12:i:- (6)S. Choleraesuis (7)S. Anatum (8)S. Typhimurium (9)S. Corvallis (10)S. Panama (11)S. Kedougou (12)S. Hvittingfoss (13)S. Derby (14)S. Albany (15)S. Virchow (16)
The experience from the
European Union has
proven how important it is
to design the surveillance
program to include as
many of the countries and
the population as possible and to ensure a high quality of the data. Nevertheless, the overall
serovar distribution and frequencies in the EFSA report does not necessarily reflect the
distribution of serovars in a single country. Several studies have shown large differences in the
distribution of NTS�between countries but also among regions within a country (V; VI).
Hendriksen � ��. revealed that the serovar distribution varied considerably among five regions
within Thailand as 15 serovars were listed among the top 10 most common serovars in the
regions (Figure 18). In Thailand, the distribution of serovars seemed to be culturally linked, and
was for instance influenced by differences in pork and poultry consumption between the
Buddhist North and the Muslim population in Southern Thailand (VI).
)�����*9��/� ��� ������ ��� ��� ������ ������������������� ���������� ����������������������1771��1773��+VI,�
In Thailand, a large amount of data has been generated, but it is not easily accessible.
Nevertheless, harmonizing surveillance programmes will in the future be of high priority in order
to have comparable data on occurrence and frequencies between countries and regions, and to
33
facilitate joint actions directed towards the most important sources of human infections in a
region or country.
!� ���������������������������
Sporadic cases and outbreaks caused by NTS is often linked to consumption of meat, egg and
recently also to contaminated fruits and vegetables (Nygård � ��., 2008; Hanning � ��., 2009). In
the United States, 121 ������� outbreaks were recorded to the CDC Foodborne Outbreak
Reporting System in 2006. The outbreak consisted of more than 3.300 cases and the most
common serovars responsible for the outbreaks were �� Enteritidis (n=26), �� Typhimurium
(n=26), �� Newport (n=10), and �� Heidelberg (n=10) (Anonymous, 2008e). In comparison, there
were in 2007 observed six outbreaks caused by ������� which accounted for 12% of all
outbreaks in Denmark. The serovars involved in these outbreaks were �� Typhimurium (n=27), �.
Weltevreden (n=19), �. Heidelberg (n=13), �� Enteritidis (n=9), and ���Senftenberg (n=3)
(Anonymous, 2009a). In 2007, a total of 2.201 outbreaks were reported in 22 European countries
ranging from five in Ireland and Romania to 843 in Germany.��. Enteritidis was by far the most
common serovar responsible for the outbreaks (n=355) infecting 5.940 humans. The second most
common serovar was �. Typhimurium with 63 outbreak (Anonnymous, 2009d).
In recognition that infections, including outbreaks, may originate in different countries, the Salm-
net project was established in 1993 under the leadership of the Health Protection Agency (HPA).
A main goal of Salm-net was to harmonise the ������� phage typing schemes used in Europe
(Fisher � ��., 2004; Hald � ��., 2004). Participants in the Salm-net project were public health
reference laboratories in the European Union, Norway, Switzerland, Australia, Canada, Japan,
and South Africa. Salm-gene, another European network established by HPA, began in 2001 to
build a database based for ������� PFGE profiles among European countries. By the end of
2004, the Salm-gene database contained approximately 20.000 profiles of primarily �� Enteritidis
and �� Typhimurium (Swaminathan � ��., 2006). In 2004, the Salm-gene network merged with
Enter-Net which later became PulseNet Europe in 2004 (O’Brien � ��., 2005; Fisher � ��.,
2005).
In the United States, PulseNet USA was established in 1996 as the national molecular
surveillance network for foodborne infections (Gerner-Smidt � ��., 2006). The aim of the
network was to rapidly detect outbreaks caused by foodborne pathogens by the use of the PFGE.
34
In 2001, full national participation by all 50 states was achieved. By 2005 the network consisted
of 65 participating public health laboratories, four countries, three cities and eight food safety
regulatory laboratories. All PFGE profiles are uploaded to the national database where local or
multi-state outbreaks are investigated. In 1999, PulseNet USA harmonised protocols with
PulseNet Canada forming PulseNet International (Swaminathan � ��., 2006). PulseNet USA and
PulseNet Canada have investigated numerous multi-national outbreaks, showing the advantage of
international collaboration in food safety surveillance. In addition to PulseNet USA and PulseNet
Canada, PulseNet networks have been established in the Asia Pacific region, Latin America,
Europe, and China. Surveillance by PulseNet Europe ceased in 2007 due to lack of funding, but
it is expected that funding from the ECDC will resume in 2010.
CONTROL, INTERVENTION, AND PREVENTION ���������������������� ��
Surveillance of NTS is not only about collecting data, but also analyzing the data to identify
critical points of intervention. Many types of analyses are possible. Case control studies to
identify risk factors can be sufficient to focus interventions and prevention measurements. Source
attribution modelling can provide detailed information about the nature and magnitude of
different reservoirs contributing to infection. Source attribution is partitioning of the human
disease burden of one or more foodborne infections to specific sources, guiding authorities to
prioritise intervention and control efforts and measuring the impact (Pires � ��., 2009). Several
factors need to be known to attribute burden to specific sources. A laboratory-based surveillance
system must be in place, and the burden of illness determined. In addition, the proportion of
foodborne disease due to international travel should be estimated and food items categorised. In
2004, a Danish mathematical model was published for quantifying the number of domestic and
sporadic cases caused by different serovars and phage types as a function of the prevalence of the
same serovars in each major animal or food sources (Hald � ��., 2004). In the following years,
the model was enhanced to include information on antimicrobial susceptibility. Using this model,
researchers in Denmark were able to quantify the contribution of various animals, foods, and
international travel to human infections with resistant NTS�(Hald � ��., 2007). In the United
States, the Foodborne Diseases Active Surveillance Network (FoodNet) adopted the same model
to attribute the human ������� cases to various sources (Gerner-Smidt � ��., 2006).
35
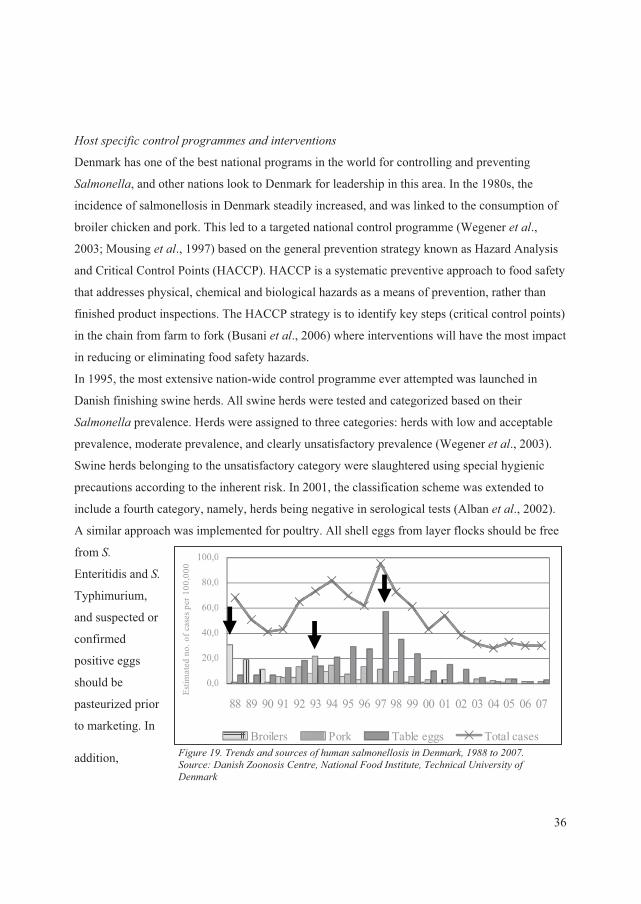
��� ����������� ������������� ����� ����� ���
Denmark has one of the best national programs in the world for controlling and preventing
�������, and other nations look to Denmark for leadership in this area. In the 1980s, the
incidence of salmonellosis in Denmark steadily increased, and was linked to the consumption of
broiler chicken and pork. This led to a targeted national control programme (Wegener � ��.,
2003; Mousing � ��., 1997) based on the general prevention strategy known as Hazard Analysis
and Critical Control Points (HACCP). HACCP is a systematic preventive approach to food safety
that addresses physical, chemical and biological hazards as a means of prevention, rather than
finished product inspections. The HACCP strategy is to identify key steps (critical control points)
in the chain from farm to fork (Busani � ��., 2006) where interventions will have the most impact
in reducing or eliminating food safety hazards.
In 1995, the most extensive nation-wide control programme ever attempted was launched in
Danish finishing swine herds. All swine herds were tested and categorized based on their
������� prevalence. Herds were assigned to three categories: herds with low and acceptable
prevalence, moderate prevalence, and clearly unsatisfactory prevalence (Wegener � ��., 2003).
Swine herds belonging to the unsatisfactory category were slaughtered using special hygienic
precautions according to the inherent risk. In 2001, the classification scheme was extended to
include a fourth category, namely, herds being negative in serological tests (Alban � ��., 2002).
A similar approach was implemented for poultry. All shell eggs from layer flocks should be free
from ��
Enteritidis and ��
Typhimurium,
and suspected or
confirmed
positive eggs
should be
pasteurized prior
to marketing. In
addition, )�����*=������������������������������������������/��������*=99� ��1773��������"�/�����?�������$�� ����@� ����)���� �� � �����������A����� �����/�������
0,0
20,0
40,0
60,0
80,0
100,0
88 89 90 91 92 93 94 95 96 97 98 99 00 01 02 03 04 05 06 07
Estim
ated
no.
of c
ases
per
100
,000
Broilers Pork Table eggs Total cases
0,0
20,0
40,0
60,0
80,0
100,0
88 89 90 91 92 93 94 95 96 97 98 99 00 01 02 03 04 05 06 07
Estim
ated
no.
of c
ases
per
100
,000
Broilers Pork Table eggs Total cases
36
infected flocks either were eliminated or slaughtered separately or late in the day to avoid cross-
contamination (Wegener � ��., 2003; Hald � ��., 2005). These control programmes and targeted
interventions resulted in a major reduction in the incidence of human salmonellosis in Denmark.
The broiler, pork, and egg associated salmonellosis incidences were reduced by 95% (1988 to
2001), 85% (1993 to 2001), and 75% (1997 to 2001), respectively (Figure 19) (Wegener � ��.,
2003). The benefit of implementing the control programmes by eliminating infected animals and
diversifying slaughter were estimated to save the taxpayers in Denmark $25.5 million annually.
In 2003, the European Parliament and Council issued, in combination with the harmonised
surveillance system, Regulation 2160 on the control of ������� and other specified food-
borne zoonotic agents. This regulation was intented to control ������� and other specified
foodborne zoonotic agents by reducing transmission from poultry and pigs (Anonymous, 2003b).
The regulation enforced strict rules for all Member States to reduce the prevalence of �������
in primary production. The control programmes target breeding flocks of >���������in 2004,
followed by laying hens, broilers, turkeys, slaughter pigs and breeding pigs over the subsequent
four years (Anonymous, 2003b).
The increased number of human infections caused by international travel is in many countries a
major concern. Currently, there is no vaccine to prevent infections caused by NTS for travellers.
Thus, in many countries, public health authorities have initiated campaigns to educate the public
on steps to reduce the risk of salmonellosis. Consumers are advised not to eat raw or
undercooked eggs, poultry or meat, not to consume raw and unpasteurised dairy products, and to
clean vegetables before consumption. The WHO instituted a similar communication programme
as part of their global strategy to decrease the burden of foodborne diseases. This lead to the
WHO report “The Five Keys to Safer Food”, which was published in 2001, and included and
associated training materials developed to provide countries with materials that are easy to use,
reproduce and adapt to different target audiences (www.who.int/foodsafety/consumer/5keys/en/).
Several publications have shown that adopted children carrying ������� is an overlooked
problem (Saiman � ��., 2001; Weill � ��., 2004; Fabre � ��., 2009; IV). The American Academy
of Paediatrics recommends that a stool specimen be collected from all adopted children entering
the United States and cultured for the presence of bacterial pathogens such as �������
(Hostetter � ��., 1991; Nicholson � ��., 1992; Stauffer � ��., 2002). The utility of this
recommendation was highlighted to all countries in a study where family members were infected
37
with �� Concord which was introduced by adopted children (IV). Another approach in preventing
travel associated salmonellosis is by publishing data on the burden of salmonellosis, and routes of
transmission, in different countries. Thus, urging the country to take action to limit the sources of
infections among the general population and travelers by improving the food safety. (Aarestrup � �
�., 2007; V; VI). However, this might be a challenge due to the limited knowledge of the
epidemiology of ������� in developing countries and the circumstances associated with the
production systems, which often are many small operations where animals are reared with
minimal oversight such as free range.
������������������ ����������������� � ����� ���
To date, only a few studies describe effective serovars-specific control programmes that do not
rely on vaccination. Multidrug resistant �. Typhimurium DT104 appeared in the 1980s and
became a major cause of salmonellosis around the world. In Denmark, a component to control
and prevent �. Typhimurium DT104 to spread and cause infections in humans was incorporated
into the existing control program for pig herds (Alban � ��., 2002). Farmers with �.
Typhimurium DT104 infected herds had to follow a herd intervention plan which included
restrictions on livestock trade and special slurry management. Carcasses of infected pigs had to
be heat treated or decontaminated before leaving the abattoir (Nielsen � ��., 2001). Likewise, a
Danish control programme for ���Dublin was launched in 2002 attempting to reduce the
increasing number of human infections and the economic losses for the cattle industry, where this
serovars was a problem. In contrast to the control programme in pigs, this programme sought to
identify cattle herds free of infection by periodic measurement of �� Dublin antibody titres in bulk
milk and by modelling the spread between herds (Hald � ��., 2005; Jordan � ��., 2008). The
outcome of the modelled control programme showed that restricting the movement of herds
between regions was more important that attempting control within herds. However, a
combination seems to be more effective but needs to be further explored (Jordan � ��., 2008).
������ ������������ ���
To date, all attempts to develop a comprehensive vaccine for humans and animals that will cover
all important serovars of ������� have failed. Today, only vaccines for humans against ��
Typhi exist. One study revealed that a Vi ���Typhi vaccine did not protect against �. Paratyphi A
38
or B since these serovars do not express the Vi polysaccharide. However, a Ty21a �� Typhi
vaccine conferred substantial cross protection against �� Paretyphi B but not to �� Paratyphi A
(Levine � ��., 2009). This example highlights the difficulties in developing ������� vaccines.
A major problem is that both serovar-dependent and host-dependent factors, as well as the
attributes influencing serovar host specificity, are unknown among the more than 2.500 serovars
(Barrow � ��., 2007). Some success has been seen with �. Enteritidis, which is associated with
chickens and is mainly transmitted in eggs. In the United Kingdom, a widespread vaccination
program was implemented for egg-laying hens to reduce transmission of �� Enteritidis. The
programme was successful in achieving a significant decrease of human infections caused solely
by �� Enteritidis (Gast � ��., 2007).
FUTURE PREDICTIONS AND PERSPECTIVES Zoonotic infections are responsible for a large and growing proportion of the mortality and
morbidity throughout the world. Foodborne zoonoses will likely continue to be important in the
future as the global population moves more toward meat products as a source of protein
(Merianos � ��., 2007; Murphy � ��., 2008). In general, the human infections caused by NTS
will most likely not significantly decrease in the future unless the global intervention towards
eggs succeeds. However, the serovar distribution will probably on a global scale be influenced by
increased trade, travel and consumption of exotic food or food produced to low costs (III; IV;
V;VI ).
Most of the research conducted in the last decades has been focused on �� Enteritidis and ��
Typhimurium, while relatively little is know about the epidemiology of rare serovars with the
potential to increase globally.
Recently focus on NTS in the African region revealed that serovars causing gastrointestinal
infections also are invasive (Morpeth � ��., 2009). We predict to see stronger evidence of NTS
causing bacteremia in humans from Africa in time due to the efforts by WHO to implement and
enhance ������� surveillance and burden of illness studies in this area. Another alarming
development which lay ahead is the increasing frequency of antimicrobial resistance in NTS. In
the last decade, the Western world has tried to minimise the usage of fluoroquinolones and third
and fourth generation cephalosporins in both the human and veterinary medicine. These two drug
classes are paramount in treating salmonellosis caused my multi-drug resistant strains. Recently,
39

the WHO has stated that antimicrobial resistance is a global public health concern and has top
priority. Evidence shows extensive usage and resistance to fluoroquinolones and third and fourth
generation cephalosporins from developing countries, driven in part by low prices and weak or
absent use restrictions (Archambault � ��., 2006; Aarestrup � ��., 2007; Fabre � ��., 2009; Lee � �
�., 2009; II; IV).
In the past two decades, our understanding of ������� biology and epidemiology has grown
tremendously. Advances in technology are moving toward rapid, high-throughput,
comprehensive analytical methods. It is highly likely that many, if not all, phenotyping
techniques will be supplanted by platforms based on DNA sequence and gene expression tools.
To make this transition, it will be necessary to validate the sequenced-based methods to the older
phenotypic methods in order to avoid the loss of knowledge and the ability to compare with
“historical” data (Hyytiä-Trees � ��., 2007). It is expected that within the next decade, microbial
genomic sequencing will become inexpensive and routine worldwide. Currently, the technique is
faced with a limiting factor of how to assemble, process and handle the large amount of data full
genome sequencing will create. Despite of this limitation, software to resolve this problem will
most likely be developed in the future making rapid tools for analysis available for extraction of
biological and epidemiological data. The data could be applied in multiple ways for typing,
genetic comparison or even non-specific vaccines.
Over the past decade, the WHO GFN has promoted capacity building for integrated, laboratory-
based surveillance through training courses and activities around the world. The network consists
of more than 1200 researchers in more than 700 institutes in 158 member states and 64 training
courses have been conducted to date. It is expected that more countries will establish �������
laboratory-based or integrated laboratory-based surveillance. One challenge is to ensure
international harmonization of surveillance systems so that data can be directly compared.
Despite of the good intention for conducting surveillance in a global context the benefit for
developing countries might be controversial. ������� infections in developing countries are
frequently endemic resulting in a high incidence of symptomatic infections primarily in children
causing immunity. Food consumption is often based on locally produced food and with the
acquired immunity it is likely to result in much fewer outbreaks compared to e.g. the United
States. It will require huge investments in sanitation infrastructure as a whole to decrease the
40

burden of ������� in these countries in contrast to a recall of a specific food product in a
developed country (Zaidi � ��., 2009).
The recent development of source attribution models and the increased number of developed
countries conducting integrated laboratory-based surveillance will most certainly results in more
countries attributing human infections to various sources. An increased number of countries
performing source attribution will probably enable epidemiologists to target control and
prevention programmes to the principal reservoirs and serovars responsible for the majority of
salmonellosis cases in a global context to avoid a new pandemic. In addition, applied research
linking across the human, livestock and food products is needed to increase preparedness
planning and the development of evidence-based approaches to zoonotic disease prevention and
control (Merianos � ��., 2007). Therefore, long term planning that takes into consideration the
unique nature of zoonosis is needed.
CONCLUSIONS AND RECOMMENDATIONS The studies included in this thesis have confirmed the importance of international travel and
consumption of imported food for NTS infections in humans. Globally, the serovars �. Enteritidis
and �. Typhimurium seems to decrease in relative importance whereas a large diversity of other
non-specific serovars are increasing; indicating that serovar specific interventions for �.
Enteritidis and �. Typhimurium are ineffective against other NTS. Reliable serotyping data
revealed large differences among commonly isolated serovars between continents and less
difference between countries within the same continent. Global surveillance identified common
problems in several countries, which then was elucidated by detailed epidemiological and
molecular studies. Country specific studies have also revealed differences between regions within
a country associated with specific risk factors. The thesis illustrates the value of global
harmonised surveillance in detecting global trends and identifying local and global problems
which then were elucidated. The thesis also illustrates the great value of combining epidemiology
and molecular microbiology. There is still a huge lack of knowledge regarding the global
epidemiology of �������. There is a global need for implementing timely systematic
integrated laboratory-based surveillance for ������� in combination with extensive collection
of epidemiological data to target prevention and intervention strategies to diminish the worldwide
burden of human salmonellosis.
41
REFERENCESAarestrup FM, Lertworapreecha M, Evans MC, Bangtrakulnonth A, Chalermchaikit T,
Hendriksen RS, Wegener HC. Antimicrobial susceptibility and occurrence of resistance genes
among ������� enterica serovar Weltevreden from different countries. J Antimicrob
Chemother. 2003; 52: 715-718.
Aarestrup FM, Hasman H, Olsen I, Sørensen G. International spread of bla(CMY-2)-mediated
cephalosporin resistance in a multiresistant ������� enterica serovar Heidelberg isolate
stemming from the importation of a boar by Denmark from Canada. Antimicrob Agents
Chemother. 2004; 48: 1916-7.
Aarestrup FM, Hendriksen RS, Lockett J, Gay K, Teates K, McDermott PF, White DG, Hasman
H, Sørensen G, Bangtrakulnonth A, Pornreongwong S, Pulsrikarn C, Angulo FJ, Gerner-Smith P.
International spread of multidrug-resistant ������� Schwarzengrund in Food Products. Emerg.
Infect. Dis. 2007; 13: 726-31.
Adak GK, Long SM, O'Brien SJ.Trends in indigenous foodborne disease and deaths, England
and Wales: 1992 to 2000. Gut. 2002; 51: 832-41.
Alban L, Stege H, Dahl J. The new classification system for slaughter-pig herds in the Danish
������� surveillance-and-control program. Prev Vet Med. 2002; 53: 133-46.
Andrysiak AK, Olson AB, Tracz DM, Dore K, Irwin R, Ng LK, Gilmour MW; Canadian
Integrated Program for Antimicrobial Resistance Surveillance Collaborative. Genetic
characterization of clinical and agri-food isolates of multi drug resistant ������� enterica
serovar Heidelberg from Canada. BMC Microbiol. 2008; 8: 89.
Anonymous. Council Decision 90/424/EEC. On expenditure in the veterinary field. 26 June
1990; Brussels, Belgium.
42
Anonymous. Council Directive 92/117/EEC. Concerning measures for protection against
specified zoonoses and specified zoonotic agents in animals and products of animal origin in
order to prevent outbreaks of food-borne infections and intoxications.17 December 1992;
Brussels, Belgium.
Anonymous. Council Directive 2003/99/EC. On the monitoring of zoonoses and zoonotic
agents.17 November 2003a; Brussels, Belgium.
Anonymous. Council Directive 2160/2003. On the control of ������� and other specified
food-borne zoonotic agents. 17 November 2003b; Brussels, Belgium.
Anonymous. Twelfth CRL-��������interlaboratory comparison study (2007) on typing of
��������spp. 2007, National Institute for Public Health and the Environment, 2007b; the
Netherlands.
Anonymous. National Antimicrobial Resistance Monitoring System Retail Meat Annual Report,
2007, U.S. Food and Drug Administration/Center for Veterinary Medicine (FDA/CVM), the
Centers for Disease Control and Prevention (CDC), and the 2007 FoodNet laboratoriums, 2007c;
United States.
Anonymous. Serotypes profile of ������� isolates from meat and poultry products.�1998–
2007. United States Department of Agriculture and Food Safety and Inspection service. 2007d;
United States.
Anonymous. Critically important antimicrobials for human medicine: categorization for the
development of risk management strategies to contain antimicrobial resistance due to non-human
antimicrobial use: report of the second WHO expert meeting, 2007e; Copenhagen, Denmark.
Anonymous. Zoonoses Report. United Kingdom 2007, Department for Environment, Food and
Rural Affairs. 2007f; London. United Kingdom.
43
Anonymous. Notifiable and Other Diseases in New Zealand. 2008 Annual Surveillance report.
2008a; New Zealand.
Anonymous. Gouvernment of Canada. Canadian Integrated Program for antimicrobial resistance
surveillance (CIPARS) 2007 – preliminary results. Guelph (Ontario): Public health Agency of
Canada, 2008b; Guelph, Canada.
Anonymous. Group for Enteric, Respiratory and Meningeal disease Surveillance in South Africa.
GERMS-SA annual report 2008. 2008c; Sandringham, South Africa.
Anonymous. European centre for disease prevention and control: Annual epidemiological report
on communicable diseases in Europe 2008. 2008d; Stockholm, Sweden.
Anonymous. Centers for Disease Control and Prevention (CDC). ������� Surveillance:
Annual summary, 2006. Atlanta, Geogia: US Department of Health and Human Services, CDC,
2008e; United States.
Anonymous. Centers for Disease Control and Prevention (CDC). Outbreak of �������
serotype Saintpaul infections associated with multiple raw produce items. 2008f; United States.
Anonymous. Annual report on zoonoses in Denmark 2007, 2009; National Food Institute,
Technical University of Denmark, 2009a; Copenhagen, Denmark
Anonymous. The Community summary report on trends and sources of zoonotic agents in the
European Union in 2007, The EFSA Journal 2009. 2009b; Parma, Italy.
Anonymous, Preliminary FoodNet data on the incidence of infection with pathogens transmitted
commonly through food – 10 states, 2008. MMWR weekly 2009c; 58: 333-337.
Anonymous, The Community summary report on Food-borne outbreaks in the European Union
in 2007. The EFSA journal 2009d, 271.
44
Archambault M, Petrov P, Hendriksen RS, Asseva G, Bangtrakulnonth A, Aarestrup FM.
Molecular characterization and occurrence of extended-spectrum beta-lactamase resistance genes
among ���������� ���� serovar Corvallis from Thailand, Bulgaria and Denmark. Microbial
Drug Resistance, 2006; 12 192-198,
Bangtrakulnonth A, Pornreongwong S, Pulsrikarn C, Sawanpanyalert P, Hendriksen RS, Lo Fo
Wong DM, Aarestrup FM. ������� serovars from humans and other sources in Thailand,
1993-2002. Emerg Infect Dis. 2004;10: 131-6.
Bangtrakulnonth A and Tishyadhigama P. Annual report of confirmed ������� and ����� in
Thailand 2006, National Institute of Health, Bangkok, Thailand.
Barrow PA. ������� infections: immune and non-immune protection with vaccines. Avian
Pathol. 2007; 36: 1-13.
van Belkum A, Tassios PT, Dijkshoorn L, Haeggman S, Cookson B, Fry NK, Fussing V, Green
J, Feil E, Gerner-Smidt P, Brisse S, Struelens M; European Society of Clinical Microbiology and
Infectious Diseases (ESCMID) Study Group on Epidemiological Markers (ESGEM). Guidelines
for the validation and application of typing methods for use in bacterial epidemiology. Clin
Microbiol Infect. 2007; 13: 1-46.
Ben-Ben-Aissa R, Al-Gallas N, Troudi H, Belhadj N, Belhadj A.Trends in ������� enterica
serotypes isolated from human, food, animal, and environment in Tunisia, 1994-2004. J Infect.
2007; 55: 324-39.
Busani L, Scavia G, Luzzi I, Caprioli A. Laboratory surveillance for prevention and control of
foodborne zoonoses. Ann Ist Super Sanita. 2006; 42: 401-4.
Chiu CH, Su LH, Chu C. ������� enterica serotype Choleraesuis: epidemiology,
pathogenesis, clinical disease, and treatment. Clin Microbiol Rev. 2004;17: 311-22.
45

Cho SH, Shin HH, Choi YH, Park MS, Lee BK. Enteric bacteria isolated from acute diarrheal
patients in the Republic of Korea between the year 2004 and 2006. J Microbiol. 2008; 46: 325-
30.
Collard JM, Place S, Denis O, Rodriguez-Villalobos H, Vrints M, Weill FX, Baucheron S,
Cloeckaert A, Struelens M, Bertrand S. Travel-acquired salmonellosis due to �������
Kentucky resistant to ciprofloxacin, ceftriaxone and co-trimoxazole and associated with treatment
failure. J Antimicrob Chemother. 2007; 60: 190-2.
Collignon P, Powers JH, Chiller TM, Aidara-Kane A, Aarestrup FM. World Health Organization
ranking of antimicrobials according to their importance in human medicine: A critical step for
developing risk management strategies for the use of antimicrobials in food production animals.
Clin Infect Dis. 2009; 49: 132-41.
Cooke FJ, De Pinna E, Maguire C, Guha S, Pickard DJ, Farrington M, Threlfall EJ. First report
of human infection with Salmonella enterica serovar Apapa resulting from exposure to a pet
lizard. J Clin Microbiol. 2009; 47: 2672-4.
Cray PJF, Gray JT, Wray C 2000 ��������Infections in Pigs. In: ��������in domestic
animals. (Wray C, Wray A, editors). CABI Publishing, Wallingford, United Kingdom, 191-208.
Ekdahl K, de Jong B, Wollin R, Andersson Y. Travel-associated non-typhoidal salmonellosis:
geographical and seasonal differences and serotype distribution. Clin Microbiol Infect. 2005;11:
138-44.
Fabre L, Delauné A, Espié E, Nygard K, Pardos M, Polomack L, Guesnier F, Galimand M,
Lassen J, Weill FX.Chromosomal integration of the extended-spectrum beta-lactamase gene
blaCTX-M-15 in ������� enterica serotype Concord isolates from internationally adopted
children. Antimicrob Agents Chemother. 2009; 53: 1808-16.
46
Fisher IS; Enter-net participants International trends in ������� serotypes 1998-2003 A
surveillance report from the Enter-net international surveillance network. Euro Surveill. 2004; 9:
45-7.
Fisher IS, Threlfall EJ; Enter-net; Salm-gene. The Enter-net and Salm-gene databases of
foodborne bacterial pathogens that cause human infections in Europe and beyond: an
international collaboration in surveillance and the development of intervention strategies.
Epidemiol Infect. 2005; 133: 1-7.
Fitzgerald C, Collins M, van Duyne S, Mikoleit M, Brown T, Fields P. Multiplex, bead-based
suspension array for molecular determination of common ������� serogroups. J Clin
Microbiol. 2007; 45: 3323-34.
Foley SL, Lynne AM, Nayak R. ������� challenges: prevalence in swine and poultry and
potential pathogenicity of such isolates. J Anim Sci. 2008; 14: 149-62.
Folster JP, Pecic G, Bolcen S, Theobald L, Hise K, Carattoli A, Zhao S, McDermott PF,
Whichard JM. Characterization of Extended-Spectrum Cephalosporin-Resistant Salmonella
enterica Serovar Heidelberg Isolated from Humans in the United States. Foodborne Pathog Dis.
2009 Sep 28.
Foxman B, Zhang L, Koopman JS, Manning SD, Marrs CF. Choosing an appropriate bacterial
typing technique for epidemiologic studies. Epidemiol Perspect Innov. 2005; 2: 10.
Galanis E, Lo Fo Wong DM, Patrick ME, Binsztein N, Cieslik A, Chalermchikit T, Aidara-Kane
A, Ellis A, Angulo FJ, Wegener HC; World Health Organization Global Salm-Surv. Web-based
surveillance and global ������� distribution, 2000-2002. Emerg Infect Dis. 2006; 12: 381-8.
Gast RK. Serotype-specific and serotype-independent strategies for preharvest control of food-
borne ������� in poultry. Avian Dis. 2007; 51: 817-28.
47
Gerner-Smidt P, Hise K, Kincaid J, Hunter S, Rolando S, Hyytiä-Trees E, Ribot EM,
Swaminathan B; Pulsenet Taskforce. PulseNet USA: a five-year update. Foodborne Pathog Dis.
2006; 3: 9-19.
Giannella RA. �������: Epidemiology chapter 21 in Baron S � ���� Baron's Medical
Microbiology. 1996; University of Texas Medical Branch at Galveston. 1996; United States.
Grimont PAD, Grimont F, Bouvet P. 2000 Taxonomy of the Genus �������. In: ��������in
domestic animals. (Wray C, Wray A, editors). CABI Publishing, Wallingford, United Kingdom,
1-17.
Grimont P. A. D and Weill F. X. Antigenic formulae of the ������� serovars, 2007, 9th
edition. WHO Collaborating Center for Reference and Research on �������, Institut Pasteur,
Paris, France.
Gray JT, Fedorka-Cray PJ, Stabel TJ, Kramer TT. Natural transmission of �������
choleraesuis in swine. Appl Environ Microbiol. 1996; 62: 141-6.
Guinée PA, Scholtens RT. Phage-typing of ������� panama according to the method of
Craigie and Yen. Antonie Van Leeuwenhoek. 1967; 33: 25-9.
Hald T, Vose D, Wegener HC, Koupeev T. A Bayesian approach to quantify the contribution of
animal-food sources to human salmonellosis. Risk Anal. 2004; 24: 255-69.
Hald, T., Wegener, H. C., Borck, B., Wong, D. M. A. L. F., Baggesen, D. L., Madsen, M.,
Korsgaard, H., Ethelberg, S., Gerner-Smidt, P., Mølbak, K. The integrated surveillance of
������� in Denmark and the effect on public health. in Food safety assurance and veterinary
public health: risk management strategies, monitoring and surveillance (Smulders, F. J. M.,
Collins, J. D. editors). Wageningen academic Publisher, the Netherlands, 2005; 213-238.
48
Hald T, Lo Fo Wong DM, Aarestrup FM.The attribution of human infections with antimicrobial
resistant ������� bacteria in Denmark to sources of animal origin. Foodborne Pathog Dis.
2007; 4: 313-26.
Hanning IB, Nutt JD, Ricke SC. Salmonellosis outbreaks in the United States due to fresh
produce: sources and potential intervention measures. Foodborne Pathog Dis. 2009; 6: 635-48.
Helms M, Vastrup P, Gerner-Smidt P, Mølbak K.Excess mortality associated with antimicrobial
drug-resistant ������� typhimurium. Emerg Infect Dis. 2002; 8: 490-5.
Helms M, Vastrup P, Gerner-Smidt P, Mølbak K. Short and long term mortality associated with
foodborne bacterial gastrointestinal infections: registry based study. BMJ. 2003; 326: 357.
Helms M, Simonsen J, Molbak K. Quinolone resistance is associated with increased risk of
invasive illness or death during infection with ������� serotype Typhimurium. J Infect Dis.
2004; 190: 1652-4.
Hendriksen SW, Orsel K, Wagenaar JA, Miko A, van Duijkeren E. Animal-to-human
transmission of Salmonella Typhimurium DT104A variant. Emerg Infect Dis. 2004; 10: 2225-7.
Herikstad H, Motarjemi Y, Tauxe RV. ������� surveillance: a global survey of public health
serotyping. Epidemiol Infect. 2002; 129: 1-8.
Hohmann EL. Nontyphoidal salmonellosis. Clin Infect Dis. 2001; 32: 263-9.
Holmberg SD, Solomon SL, Blake PA. Health and economic impacts of antimicrobial resistance.
Rev Infect Dis. 1987; 9: 1065-78.
Hostetter MK, Iverson S, Thomas W, McKenzie D, Dole K, Johnson DE. Medical evaluation of
internationally adopted children. N Engl J Med.1991;325:479-85.
49
Hyytiä-Trees EK, Cooper K, Ribot EM, Gerner-Smidt P. Recent developments and future
prospects in subtyping of foodborne bacterial pathogens. Future Microbiol. 2007; 2: 175-85.
Jafari F, Garcia-Gil LJ, Salmanzadeh-Ahrabi S, Shokrzadeh L, Aslani MM, Pourhoseingholi
MA, Derakhshan F, Zali MR. Diagnosis and prevalence of enteropathogenic bacteria in children
less than 5 years of age with acute diarrhea in Tehran children's hospitals. J Infect. 2009; 58: 21-
7.
Jones TF, Scallan E, Angulo FJ. FoodNet: overview of a decade of achievement. Foodborne
Pathog Dis. 2007; 4: 60-6
Jones TF, Ingram LA, Cieslak PR, Vugia DJ, Tobin-D'Angelo M, Hurd S, Medus C, Cronquist
A, Angulo FJ. Salmonellosis outcomes differ substantially by serotype. J Infect Dis. 2008; 198:
109-14.
Jordan D, Nielsen LR, Warnick LD. Modelling a national programme for the control of
foodborne pathogens in livestock: the case of ������� Dublin in the Danish cattle industry.
Epidemiol Infect. 2008; 136: 1521-36.
Kasper SS, Fretz R, Kornschober C, Allerberger F, Schmid D. Imported ������� Enteritidis
cases: a multiphage outbreak among Austrian vacationers in Turkey, 2008. Wien Klin
Wochenschr. 2009; 121: 144-8.
Kumar Y, Sharma A, Sehgal R, Kumar S. Distribution trends of ������� serovars in India
(2001-2005).Trans R Soc Trop Med Hyg. 2009; 103: 390-4.
Larsson JT, Torpdahl M, Petersen RF, Sorensen G, Lindstedt BA, Nielsen EM. Development of a
new nomenclature for ������� Typhimurium multilocus variable number of tandem repeats
analysis (MLVA). Euro Surveill. 2009; 14.
50
Lauderdale TL, Aarestrup FM, Chen PC, Lai JF, Wang HY, Shiau YR, Huang IW, Hung CL;
TSAR hospitals. Multidrug resistance among different serotypes of clinical ������� isolates in
Taiwan. Diagn Microbiol Infect Dis. 2006; 55: 149-55.
Lee LA, Puhr ND, Maloney EK, Bean NH, Tauxe RV. Increase in antimicrobial-resistant
Salmonella infections in the United States, 1989-1990. J Infect Dis. 1994; 170: 128-34.
Lee HY, Su LH, Tsai MH, Kim SW, Chang HH, Jung SI, Park KH, Perera J, Carlos C, Tan BH,
Kumarasinghe G, So T, Chongthaleong A, Hsueh PR, Liu JW, Song JH, Chiu CH. High rate of
reduced susceptibility to ciprofloxacin and ceftriaxone among nontyphoid ������� clinical
isolates in Asia. Antimicrob Agents Chemother. 2009; 53: 2696-9.
Levine MM. Typhoid vaccines ready for implementation. N Engl J Med. 2009; 361: 403-5.
Lindstedt BA, Heir E, Gjernes E, Kapperud G. DNA fingerprinting of ������� enterica subsp.
enterica serovar typhimurium with emphasis on phage type DT104 based on variable number of
tandem repeat loci. J Clin Microbiol. 2003; 41: 1469-79.
Lindstedt BA, Tham W, Danielsson-Tham ML, Vardund T, Helmersson S, Kapperud G.
Multiple-locus variable-number tandem-repeats analysis of Listeria monocytogenes using
multicolour capillary electrophoresis and comparison with pulsed-field gel electrophoresis
typing. J Microbiol Methods. 2008; 72: 141-8.
Lo Fo Wong DMA, Andersen JK, Nørrung B, Wegener HC. Food Contamination Monitoring
and Food Borne Disease Surveillance at National Level. Second FAO/WHO Global Forum for
Food Safety Regulators; 2004
Martin LJ, Fyfe M, Doré K, Buxton JA, Pollari F, Henry B, Middleton D, Ahmed R, Jamieson F,
Ciebin B, McEwen SA, Wilson JB; Multi-Provincial Salmonella Typhimurium Case-Control
Study Steering Committee. Increased burden of illness associated with antimicrobial-resistant
Salmonella enterica serotype typhimurium infections. J Infect Dis. 2004; 189: 377-84.
51

Maslow JN, Mulligan ME, Arbeit RD. Molecular epidemiology: application of contemporary
techniques to the typing of microorganisms. Clin Infect Dis. 1993; 17: 153-62.
McDermott PF. Antimicrobial Resistance in notyphoidal Salmonellae chapter 17, 293-314 in
Aaretrup FM, Antimicrobial Resistance in Bacteria�of Animal Origin. 2006; Danish Institute for
Food and Veterinary Research, Copenhagen, Denmark.
McQuiston JR, Parrenas R, Ortiz-Rivera M, Gheesling L, Brenner F, Fields PI. Sequencing and
comparative analysis of flagellin genes fliC, fljB, and flpA from �������. J Clin Microbiol.
2004; 42: 1923-32.
Mead PS, Slutsker L, Dietz V, McCaig LF, Bresee JS, Shapiro C, Griffin PM, Tauxe RV. Food-
related illness and death in the United States. Emerg Infect Dis.1999; 5: 607-25.
Merianos A. Surveillance and response to disease emergence. Curr Top Microbiol Immunol.
2007; 315: 477-509.
Miller LC. International adoption: infectious diseases issues. Clin Infect Dis. 2005; 40: 286-93.
Morpeth SC, Ramadhani HO, Crump JA. Invasive non-Typhi ������� disease in Africa. Clin
Infect Dis. 2009; 49: 606-11.
Mousing J, Jensen PT, Halgaard C, Bager F, Feld N, Nielsen B, Nielsen JP, Bech-Nielsen S.
Nation-wide ������� enterica surveillance and control in Danish slaughter swine herds. Prev
Vet Med. 1997; 29: 247-61.
Murphy FA. Emerging zoonoses: the challenge for public health and biodefense. Prev Vet Med.
2008; 86: 216-23.
52
Mølbak K, Baggesen DL, Aarestrup FM, Ebbesen JM, Engberg J, Frydendahl K, Gerner-Smidt
P, Petersen AM, Wegener HC. An outbreak of multidrug-resistant, quinolone-resistant
������� enterica serotype typhimurium DT104. N Engl J Med. 1999; 341: 1420-5.
Nicholson AJ, Francis BM, Mulholland EK, Moulden AL, Oberklaid F. Health screening of
international adoptees. Evaluation of a hospital based clinic. Med J Aust 1992;156:377-9.
Nielsen B, Alban L, Stege H, Sørensen LL, Møgelmose V, Bagger J, Dahl J, Baggesen DL. A
New ������� surveillance and control programme in Danish pig herds and slaughterhouses.
Berl Munch Tierarztl Wochenschr. 2001; 114: 323-6.
Nygård K, Lassen J, Vold L, Andersson Y, Fisher I, Löfdahl S, Threlfall J, Luzzi I, Peters T,
Hampton M, Torpdahl M, Kapperud G, Aavitsland P. Outbreak of ������� Thompson
infections linked to imported rucola lettuce. Foodborne Pathog Dis. 2008; 5: 165-73.
O'Brien, S. J., Gillespie, I. A., Adak, G. K. Foodborne disease surveillance as a basis for policy-
making in Food safety assurance and veterinary public health: risk management strategies,
monitoring and surveillance (Smulders, F. J. M., Collins, J. D. editors). Wageningen academic
Publisher, the Netherlands, 2005; 33-52
Olsen SJ, Bishop R, Brenner FW, Roels TH, Bean N, Tauxe RV, Slutsker L. The changing
epidemiology of �������: trends in serotypes isolated from humans in the United States,
1987-1997. J Infect Dis. 2001; 183: 753-61.
OzFoodNet Working Group. Foodborne disease in Australia: incidence, notifications and
outbreaks. Annual report of the OzFoodNet network, 2002. Commun Dis Intell. 2003; 27: 209-
43.
Pedersen K, Lassen-Nielsen AM, Nordentoft S, Hammer AS. Serovars of ������� from
captive reptiles. Zoonoses Public Health. Accepted.
53
Petersen A, Aarestrup FM, Angulo FJ, Wong S, Stöhr K, Wegener HC. WHO global salm-surv
external quality assurance system (EQAS): an important step toward improving the quality of
������� serotyping and antimicrobial susceptibility testing worldwide. Microb Drug Resist.
2002; 8: 345-53.
Petrov P, Parmakova K, Siitonen A, Asseva G, Kauko T, Kojouharova M, Kantardjiev T.
Salmonellosis cases caused by a rare ������� Enteritidis PT6c associated with travel to
Bulgaria, June-July 2008. Euro Surveill. 2009; 14. pii: 19130.
Petrov P, Hendriksen RS, Kantardjiev T, Asseva G, Sørensen G, Fields P, Mikoleit M, Whichard
J, McQuiston JR, Torpdahl M, Aarestrup FM, Angulo FJ. Occurrence and characterization of
������� enterica subspecies enterica serovar 9,12:l,v:- strains from Bulgaria, Denmark, and
the United States. Eur J Clin Microbiol Infect Dis. 2009; 28: 473-9.
Petrow S, Kasatiya SS, Pelletier J, Ackermann HW, Peloquin J. A phage typing scheme for
������� newport. Ann Microbiol (Paris). 1974; 125: 433-45.
Pires SM, Evers EG, van Pelt W, Ayers T, Scallan E, Angulo FJ, Havelaar A, Hald T; Med-Vet-
Net Workpackage 28 Working Group. Attributing the human disease burden of foodborne
infections to specific sources. Foodborne Pathog Dis. 2009; 6: 417-24.
Raufu I, Hendriksen RS, Ameh JA, Aarestrup FM. Occurrence and characterization of
������� Hiduddify from chickens and poultry meat in Nigeria. Foodborne Pathog Dis. 2009;
6: 425-30
Ribot EM, Fair MA, Gautom R, Cameron DN, Hunter SB, Swaminathan B, Barrett TJ.
Standardization of pulsed-field gel electrophoresis protocols for the subtyping of '�����������
O157:H7, �������, and ����� for PulseNet. Foodborne Pathog Dis. 2006; 3: 59-67.
Rowe B, Hall ML, Ward LR, de Sa JD.Epidemic spread of ������� Hadar in England and
Wales. Br Med J. 1980; 280: 1065-6.
54
Saiman L, Aronson J, Zhou J, Gomez-Duarte C, Gabriel PS, Alonso M, Maloney S, Schulte J.
Prevalence of infectious diseases among internationally adopted children. Pediatrics. 2001; 108:
608-12.
Scarlata G, Massenti MF, Nastasi A, Lo Piparo C. Phage typing of ������� Wien. Nuovi Ann
Ig Microbiol. 1982; 33: 825-34.
Schlundt J, Toyofuku H, Jansen J, Herbst SA.Emerging food-borne zoonoses. Rev Sci Tech.
2004; 23: 513-33.
Sechter I, Gerichter CB. Phage typing scheme for ������� Braenderup. Appl Microbiol.
1968;16: 1708-12.
Sharma NC, John PC, Mago ML, Saxena SN. Phage-typing scheme of ������� Bareilly based
on lysogeny. Antonie Van Leeuwenhoek. 1984; 50: 275-9.
Sivapalasingam S, Barrett E, Kimura A, Van Duyne S, De Witt W, Ying M, Frisch A, Phan Q,
Gould E, Shillam P, Reddy V, Cooper T, Hoekstra M, Higgins C, Sanders JP, Tauxe RV,
Slutsker L. A multistate outbreak of Salmonella enterica Serotype Newport infection linked to
mango consumption: impact of water-dip disinfestation technology. Clin Infect Dis. 2003; 37:
1585-90.
Smith HW.The typing of ������� Thompson by means of bacteriophage. J Gen Microbiol.
1951; 5: 472-9.
Sood LR, Basu S. Biological characteristics of ������� Weltevreden typing phages. Folia
Microbiol (Praha). 1984; 29: 93-5.
Stauffer WM, Kamat D, Walker PF. Screening of international immigrants, refugees, and
adoptees. Prim Care. 2002; 29: 879-905.
55
Swaminathan B, Gerner-Smidt P, Ng LK, Lukinmaa S, Kam KM, Rolando S, Gutiérrez EP,
Binsztein N. Building PulseNet International: an interconnected system of laboratory networks to
facilitate timely public health recognition and response to foodborne disease outbreaks and
emerging foodborne diseases. Foodborne Pathog Dis. 2006; 3: 36-50.
Tapalski D, Hendriksen RS, Hasman H, Ahrens P, Aarestrup FM. Molecular characterisation of
multiple drug resistant ���������� �����serovar Typhimurium from Gomel region, Belarus.
Clin Microbiol Infect. 2007;13: 1030-3.
Tenover FC, Arbeit RD, Goering RV, Mickelsen PA, Murray BE, Persing DH, Swaminathan B.
Interpreting chromosomal DNA restriction patterns produced by pulsed-field gel electrophoresis:
criteria for bacterial strain typing. J Clin Microbiol. 1995; 33: 2233-9.
Tyc Z. Pattern of bacteriophage differentiation of ������� Agona. Med Dosw Mikrobiol.
1980; 32: 17-22.
Uzzau S, Brown DJ, Wallis T, Rubino S, Leori G, Bernard S, Casadesús J, Platt DJ, Olsen JE.
Host adapted serotypes of ������� enterica. Epidemiol Infect. 2000; 125: 229-55.
Vandenberg O, Nyarukweba DZ., Ndeba PM., Hendriksen RS., Barzilay EJ., Schirvel C,
Bisimwa BB., Collard JM., Aidara-Kane A., Aarestrup FM. Microbiological and clinical features
of ������� species isolated from bacteremic children in Eastern democratic republic of Congo.
Microbiologic and clinical features of Salmonella species isolated from bacteremic children in
Eastern Democratic Republic of Congo. 2009; PIDJ
Varma JK, Molbak K, Barrett TJ, Beebe JL, Jones TF, Rabatsky-Ehr T, Smith KE, Vugia DJ,
Chang HG, Angulo FJ. Antimicrobial-resistant nontyphoidal ������� is associated with
excess bloodstream infections and hospitalizations. J Infect Dis. 2005a; 191: 554-61.
56
Varma JK, Greene KD, Ovitt J, Barrett TJ, Medalla F, Angulo FJ. Hospitalization and
antimicrobial resistance in ������� outbreaks, 1984-2002. Emerg Infect Dis. 2005b; 11: 943-
6.
Vindigni SM, Srijan A, Wongstitwilairoong B, Marcus R, Meek J, Riley PL, Mason C.
Prevalence of foodborne microorganisms in retail foods in Thailand. Foodborne Pathog Dis.
2007; 4: 208-15.
Voetsch AC, Van Gilder TJ, Angulo FJ, Farley MM, Shallow S, Marcus R, Cieslak PR, Deneen
VC, Tauxe RV; Emerging Infections Program FoodNet Working Group. FoodNet estimate of the
burden of illness caused by nontyphoidal ������� infections in the United States. Clin Infect
Dis. 2004; 38: 127-34.
Ward LR, de Sa JD, Rowe B. A phage-typing scheme for ������� enteritidis. Epidemiol
Infect. 1987; 99: 291-4.
Wegener HC, Hald T, Lo Fo Wong D, Madsen M, Korsgaard H, Bager F, Gerner-Smidt P,
Mølbak K. ������� control programmes in Denmark. Emerg Infect Dis. 2003; 9: 774-80.
Weill FX, Demartin M, Tandé D, Espié E, Rakotoarivony I, Grimont PA. SHV-12-like extended-
spectrum-beta-lactamase-producing strains of ������� enterica serotypes Babelsberg and
Enteritidis isolated in France among infants adopted from Mali. J Clin Microbiol. 2004; 42:
2432-7.
Wheeler JG, Sethi D, Cowden JM, Wall PG, Rodrigues LC, Tompkins DS, Hudson MJ, Roderick
PJ. Study of infectious intestinal disease in England: rates in the community, presenting to
general practice, and reported to national surveillance. The Infectious Intestinal Disease Study
Executive. BMJ. 1999; 318: 1046-50.
Wray C and Davies RH. ��������Infections in Cattle. In: ��������in domestic animals.
(Wray C, Wray A, editors). CABI Publishing, Wallingford, United Kingdom, 2000, 169-190.
57
Zaidi MB, Calva JJ, Estrada-Garcia MT, Leon V, Vazquez G, Figueroa G, Lopez E, Contreras J,
Abbott J, Zhao S, McDermott P, Tollefson L.Integrated food chain surveillance system for
������� spp. in Mexico. Emerg Infect Dis. 2008; 14: 429-35.
Zaidi MB and Estrada-Garcia MT. A perspective on the role of pulsed-field gel electrophoresis
for ������� surveillance in Mexico in Molecular biology and molecular epidemiology of
������� infections. (Juan J. Calva and Edmundo Calva editors). Mexico, 2009, 90-107
Xia S, Hendriksen RS, Xie Z, Huang L, Zhang J, Guo W, Xu B, Ran L, Aarestrup FM.
Molecular Characterization and Antimicrobial Susceptibility of ������� Isolates from
Infections in Humans in Henan Province, China J. Clin. Microbiol., 2009; 47: 401 - 409.
58
59
AR
TIC
LE
I
Article I
WHO Global Salm-Surv External Quality Assurance System (EQAS) for serotyping of
Salmonella isolates, 2000 - 2007.
Rene S. Hendriksen,1* Matthew Mikoleit,2 Valeria P. Carlson,2 Susanne Karlsmose,1 Antonio
R. Vieira,1 Arne B. Jensen,1 Anne Mette Seyfarth,1 Stephanie M. Delong,2 François-Xavier
Weill,3 Danilo Marino Armando Lo Fo Wong,4 Frederick J. Angulo,2 Henrik C. Wegener,1
Frank M. Aarestrup1
1 National Food Institute, WHO Collaborating Centre for Antimicrobial Resistance in
Foodborne Pathogens and Community Reference Laboratory for Antimicrobial Resistance,
Technical University of Denmark, Copenhagen, Denmark 2 Centers for Disease Control and Prevention, WHO Collaborating Centre for Surveillance,
Epidemiology and Control of ������� and other Foodborne Diseases, the Enteric Disease
Epidemiology Branch, Atlanta, GA, USA 3 Institut Pasteur, WHO Collaborating Centre for �������, Paris, France 4 World Health Organization, Department of Food Safety, Zoonoses and Foodborne Diseases,
Geneva, Switzerland
Corresponding author: Rene S. Hendriksen,
National Food Institute,
Bülowsvej 27, DK-1790 Copenhagen V, Denmark
Phone: +45 35 88 70 00
Fax: +45 35 88 60 01
E-mail: [email protected]
Foodborne Pathog Dis. 2008 Oct; 5 (5): 605-19.
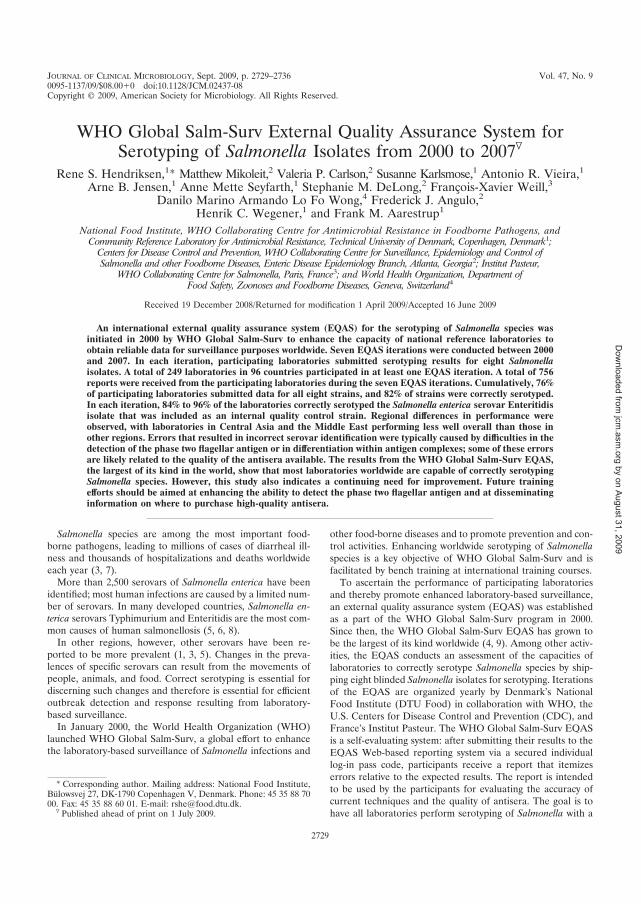
JOURNAL OF CLINICAL MICROBIOLOGY, Sept. 2009, p. 2729–2736 Vol. 47, No. 90095-1137/09/$08.00�0 doi:10.1128/JCM.02437-08Copyright © 2009, American Society for Microbiology. All Rights Reserved.
WHO Global Salm-Surv External Quality Assurance System forSerotyping of Salmonella Isolates from 2000 to 2007�
Rene S. Hendriksen,1* Matthew Mikoleit,2 Valeria P. Carlson,2 Susanne Karlsmose,1 Antonio R. Vieira,1Arne B. Jensen,1 Anne Mette Seyfarth,1 Stephanie M. DeLong,2 Francois-Xavier Weill,3
Danilo Marino Armando Lo Fo Wong,4 Frederick J. Angulo,2Henrik C. Wegener,1 and Frank M. Aarestrup1
National Food Institute, WHO Collaborating Centre for Antimicrobial Resistance in Foodborne Pathogens, andCommunity Reference Laboratory for Antimicrobial Resistance, Technical University of Denmark, Copenhagen, Denmark1;
Centers for Disease Control and Prevention, WHO Collaborating Centre for Surveillance, Epidemiology and Control ofSalmonella and other Foodborne Diseases, Enteric Disease Epidemiology Branch, Atlanta, Georgia2; Institut Pasteur,
WHO Collaborating Centre for Salmonella, Paris, France3; and World Health Organization, Department ofFood Safety, Zoonoses and Foodborne Diseases, Geneva, Switzerland4
Received 19 December 2008/Returned for modification 1 April 2009/Accepted 16 June 2009
An international external quality assurance system (EQAS) for the serotyping of Salmonella species wasinitiated in 2000 by WHO Global Salm-Surv to enhance the capacity of national reference laboratories toobtain reliable data for surveillance purposes worldwide. Seven EQAS iterations were conducted between 2000and 2007. In each iteration, participating laboratories submitted serotyping results for eight Salmonellaisolates. A total of 249 laboratories in 96 countries participated in at least one EQAS iteration. A total of 756reports were received from the participating laboratories during the seven EQAS iterations. Cumulatively, 76%of participating laboratories submitted data for all eight strains, and 82% of strains were correctly serotyped.In each iteration, 84% to 96% of the laboratories correctly serotyped the Salmonella enterica serovar Enteritidisisolate that was included as an internal quality control strain. Regional differences in performance wereobserved, with laboratories in Central Asia and the Middle East performing less well overall than those inother regions. Errors that resulted in incorrect serovar identification were typically caused by difficulties in thedetection of the phase two flagellar antigen or in differentiation within antigen complexes; some of these errorsare likely related to the quality of the antisera available. The results from the WHO Global Salm-Surv EQAS,the largest of its kind in the world, show that most laboratories worldwide are capable of correctly serotypingSalmonella species. However, this study also indicates a continuing need for improvement. Future trainingefforts should be aimed at enhancing the ability to detect the phase two flagellar antigen and at disseminatinginformation on where to purchase high-quality antisera.
Salmonella species are among the most important food-borne pathogens, leading to millions of cases of diarrheal ill-ness and thousands of hospitalizations and deaths worldwideeach year (3, 7).
More than 2,500 serovars of Salmonella enterica have beenidentified; most human infections are caused by a limited num-ber of serovars. In many developed countries, Salmonella en-terica serovars Typhimurium and Enteritidis are the most com-mon causes of human salmonellosis (5, 6, 8).
In other regions, however, other serovars have been re-ported to be more prevalent (1, 3, 5). Changes in the preva-lences of specific serovars can result from the movements ofpeople, animals, and food. Correct serotyping is essential fordiscerning such changes and therefore is essential for efficientoutbreak detection and response resulting from laboratory-based surveillance.
In January 2000, the World Health Organization (WHO)launched WHO Global Salm-Surv, a global effort to enhancethe laboratory-based surveillance of Salmonella infections and
other food-borne diseases and to promote prevention and con-trol activities. Enhancing worldwide serotyping of Salmonellaspecies is a key objective of WHO Global Salm-Surv and isfacilitated by bench training at international training courses.
To ascertain the performance of participating laboratoriesand thereby promote enhanced laboratory-based surveillance,an external quality assurance system (EQAS) was establishedas a part of the WHO Global Salm-Surv program in 2000.Since then, the WHO Global Salm-Surv EQAS has grown tobe the largest of its kind worldwide (4, 9). Among other activ-ities, the EQAS conducts an assessment of the capacities oflaboratories to correctly serotype Salmonella species by ship-ping eight blinded Salmonella isolates for serotyping. Iterationsof the EQAS are organized yearly by Denmark’s NationalFood Institute (DTU Food) in collaboration with WHO, theU.S. Centers for Disease Control and Prevention (CDC), andFrance’s Institut Pasteur. The WHO Global Salm-Surv EQASis a self-evaluating system: after submitting their results to theEQAS Web-based reporting system via a secured individuallog-in pass code, participants receive a report that itemizeserrors relative to the expected results. The report is intendedto be used by the participants for evaluating the accuracy ofcurrent techniques and the quality of antisera. The goal is tohave all laboratories perform serotyping of Salmonella with a
* Corresponding author. Mailing address: National Food Institute,Bulowsvej 27, DK-1790 Copenhagen V, Denmark. Phone: 45 35 88 7000. Fax: 45 35 88 60 01. E-mail: [email protected].
� Published ahead of print on 1 July 2009.
2729
by on August 31, 2009
jcm.asm
.orgD
ownloaded from
maximum of one error out of eight isolates. Here we report theresults of the first seven iterations of the WHO Global Salm-Surv EQAS Salmonella serotyping procedures, conductedfrom 2000 to 2007. In 2005, no iteration was conducted, due toan internal assessment of the system.
MATERIALS AND METHODS
Participation in the WHO Global Salm-Surv EQAS is open to all laboratoriesfree of charge. An invitation to participate in each EQAS iteration was an-nounced through Electronic Discussion Group messages, which are received byWHO Global Salm-Surv members. All members receive these messages bye-mail or by fax. Previous messages are archived on the WHO Global Salm-Survwebsite (http://www.who.int/salmsurv/activities/bulletin_board/en/). In 2007,WHO Global Salm-Surv membership included �1,000 microbiologists and epi-demiologists from 152 countries representing �140 national reference laborato-ries (animal, food, or public health). Scientists who attended WHO GlobalSalm-Surv international training courses were automatically registered as WHOGlobal Salm-Surv members. Through 2008, 56 training courses were held at 17training sites worldwide. The training curricula provided in these courses typi-cally include both classroom and laboratory instructional modules on the iden-tification and serotyping of Salmonella species.
Eight Salmonella strains, based on the global prevalence of the serotypes, wereselected for each EQAS iteration (3). Strains were obtained from the isolatecollection of DTU Food. The same strain of Salmonella serovar Enteritidis wasincluded as an internal quality control in 2000, 2001, 2004, 2006, and 2007. Forthe 2002 iteration, an alternate but phenotypically identical strain of Salmonellaserovar Enteritidis was chosen. All other strains were included only once in theEQAS iterations. Some serovars (e.g., Salmonella serovar Typhimurium) wereutilized in multiple iterations; however, these strains had different antimicrobialresistance profiles (Table 1).
All Salmonella isolates included in the EQAS were serotyped at DTU Food,the CDC, and Institut Pasteur; the serotypes obtained served as the referencestandard. O (somatic) and H (flagellar) antigens were characterized by aggluti-nation with hyperimmune sera, and serotypes were assigned according to theKauffmann-White scheme (11).
Testing instructions and a “participating laboratory record sheet” (PLRS)were copied to a compact disc, enclosed with the Salmonella agar stab cultures indouble-pack containers (class UN 6.2), and sent to the participating laboratoriesaccording to the International Air Transport Association regulations as “Biolog-ical Substance Category B,” classified as UN 3373. Prior to shipping, eachparticipating laboratory was notified of the shipping arrangements that had beenmade for the parcels and was given the airway bill number to enable it to trackthe package and pick it up from the airport. Import permits were necessary forshipping the parcels to several countries.
WHO Global Salm-Surv EQAS participation was free of charge, but eachparticipating laboratory was expected to cover the expenses associated with itstesting of the strains in its facility. Participating laboratories were provided withinstructions for the initial subculture of the Salmonella strains. Participatinglaboratories serotyped the isolates using protocols routinely utilized in theirinstitutions; therefore, instructions for serotyping the isolates were not provided.Laboratories were required to submit results by uploading the PLRS onto theWHO Global Salm-Surv website or by submitting the completed PLRS by fax toDTU Food.
After submitting results, each participating laboratory received an individualreport. Laboratories that submitted results via the website received an instantreport via the secure website, and laboratories that sent the results by fax ore-mail received the report using media. The individual reports included all errorsand suggestions on how to either solve or investigate the problem. Errors aredefined as results that are different from the expected serotypes. Errors werereported as incorrect results only, and no attempt was made to quantify theirseverity. Fisher exact tests were performed to assess the significance of theobserved changes in correct serotyping results and reported errors. Laboratoryparticipation over the years was assessed by logistic regression, and a P valueof �0.05 was regarded as significant for all statistical tests. SAS Enterprise Guidesoftware (version 3.0; SAS Institute, Cary, NC) was used for the statisticalanalyses.
RESULTS
A total of 249 laboratories in 97 countries participated in atleast one of the seven iterations of EQAS from 2000 to 2007;44 laboratories in 35 countries participated in 2000, 96 labo-ratories in 55 countries in 2001, 99 laboratories in 61 countriesin 2002, 127 laboratories in 72 countries in 2003, 127 labora-tories in 71 countries in 2004, 130 laboratories in 66 countriesin 2006, and 140 laboratories in 68 countries in 2007. Theaverage number of participating laboratories per EQAS itera-tion between 2000 and 2007 was 102. One hundred twenty-fivelaboratories participated in three or more iterations, and 92laboratories participated in four or more iterations. The par-ticipating laboratories included national reference laborato-ries; veterinary, food, and regional public health laboratories;and clinical laboratories. One or more institutions from thecountries listed in Table 2 participated in at least one of theEQAS iterations.
The percentage of participating laboratories that performedserotyping on all eight strains during the seven iterationsranged from 54% to 92%, with an average of 76% (Table 3).The percentage of participating laboratories that correctly se-rotyped the Salmonella serovar Enteritidis isolate that wasincluded in six of the seven iterations increased over the years,although the increase was not statistically significant (P �0.37), from 92% (2000) to 96% (2007).
The percentage of correct serotyping results oscillated in theinitial years, decreasing from 76% in 2000 to 72% in 2001 andrising to 91% in 2002. In the 2003 cycle, the percentage ofcorrect serotyping results was 80%, and since then it has in-creased annually, reaching 88% in 2007. Overall, logistic re-gression indicates a significant increase in the percentage ofcorrect serotyping results over the years (P � 0.01), and theaverage percentage of correctly serotyped isolates across all 7years was 82% (Table 3).
The goal of the EQAS program is for all participating lab-oratories to perform Salmonella serotyping with a maximum ofone error. A total of 756 PLRSs were received during the sevenEQAS iterations. The percentage of laboratories reaching thethreshold of reporting one or zero errors increased signifi-cantly (P � 0.04), from 48% in 2000 to 68% in 2007 (data notshown). In addition, the 2007 iteration was the first in whichevery participating laboratory correctly identified at least onestrain.
A wide range of incorrect results was observed across theseven-cycle study period. The rate of errors ranged from 3.6%(2007) to 41.0% (2006). The rate of errors also differed widelybetween the different isolates within a single year. For exam-ple, in 2001, rates of incorrect results for a single isolate rangedfrom 9.6% for the Salmonella serovar Typhimurium isolate to38.0% for a Salmonella serovar Kottbus isolate.
A Salmonella enterica subsp. enterica serovar 4,5,12:i:� iso-late included in the 2006 iteration accounted for the greatestnumber of incorrect results (Table 1). A total of 38 laborato-ries (31.1%) incorrectly serotyped this isolate as Salmonellaserovar Typhimurium. Salmonella enterica subsp. enterica ser-ovar 4,5,12:i:� is a common monophasic variant in both Eu-rope and North America. Characterization of other Salmonellaenterica subsp. enterica serovar 4,5,12:i:� strains suggests thatthese strains are most likely variants of Salmonella serovar
2730 HENDRIKSEN ET AL. J. CLIN. MICROBIOL.
by on August 31, 2009
jcm.asm
.orgD
ownloaded from
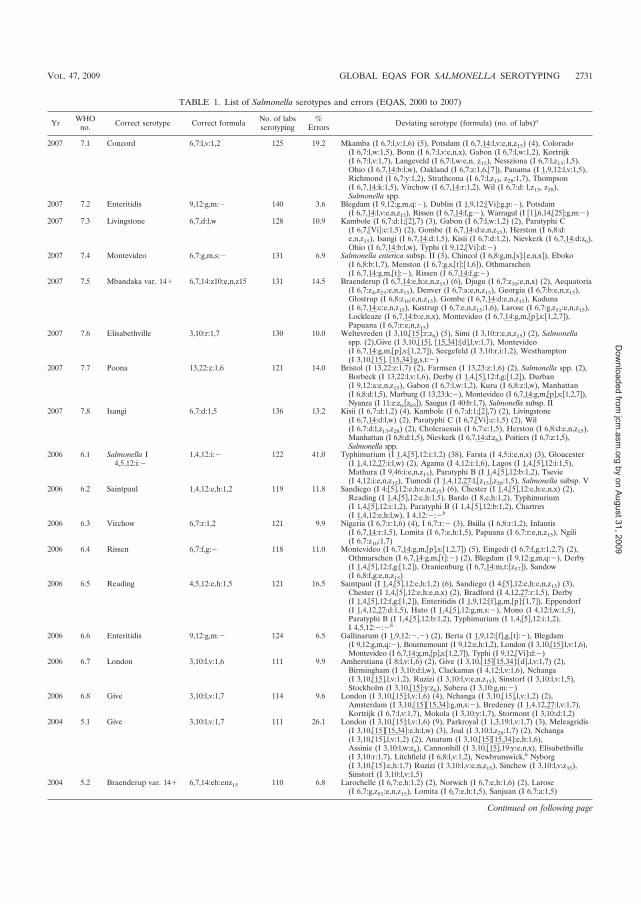
TABLE 1. List of Salmonella serotypes and errors (EQAS, 2000 to 2007)
Yr WHOno. Correct serotype Correct formula No. of labs
serotyping%
Errors Deviating serotype (formula) (no. of labs)a
2007 7.1 Concord 6,7:l,v:1,2 125 19.2 Mkamba (I 6,7:l,v:1,6) (5), Potsdam (I 6,7,14:l,v:e,n,z15) (4), Colorado(I 6,7:l,w:1,5), Bonn (I 6,7:l,v:e,n,x), Gabon (I 6,7:l,w:1,2), Kortrijk(I 6,7:l,v:1,7), Langeveld (I 6,7:l,w:e,n, z15), Nessziona (I 6,7:l,z13:1,5),Ohio (I 6,7,14:b:l,w), Oakland (I 6,7:z:1,6,�7�), Panama (I 1,9,12:l,v:1,5),Richmond (I 6,7:y:1,2), Strathcona (I 6,7:l,z13, z28:1,7), Thompson(I 6,7,14:k:1,5), Virchow (I 6,7,14:r:1,2), Wil (I 6,7:d: l,z13, z28),Salmonella spp.
2007 7.2 Enteritidis 9,12:g,m:� 140 3.6 Blegdam (I 9,12:g,m,q:�), Dublin (I 1,9,12;�Vi�:g,p:�), Potsdam(I 6,7,14:l,v:e,n,z15), Rissen (I 6,7,14:f,g:�), Warragul (I �1�,6,14,�25�:g,m:�)
2007 7.3 Livingstone 6,7,d:l,w 128 10.9 Kambole (I 6,7:d:1;�2�,7) (3), Gabon (I 6,7:l,w:1,2) (2), Paratyphi C(I 6,7,�Vi�:c:1,5) (2), Gombe (I 6,7,14:d:e,n,z15), Herston (I 6,8:d:e,n,z15), Isangi (I 6,7,14:d:1,5), Kisii (I 6,7:d:1,2), Nievkerk (I 6,7,14:d:z6),Ohio (I 6,7,14:b:l,w), Typhi (I 9,12,�Vi�:d:�)
2007 7.4 Montevideo 6,7:g,m,s:� 131 6.9 Salmonella enterica subsp. II (3), Chincol (I 6,8:g,m,�s�:�e,n,x�), Eboko(I 6,8:b:1,7), Menston (I 6,7:g,s,�t�:�1,6�), Othmarschen(I 6,7,14:g,m,�t�:�), Rissen (I 6,7,14:f,g:�)
2007 7.5 Mbandaka var. 14� 6,7,14:z10:e,n,z15 131 14.5 Braenderup (I 6,7,14:e,h:e,n,z15) (6), Djugu (I 6,7:z10:e,n,x) (2), Aequatoria(I 6,7:z4,z23:e,n,z15), Denver (I 6,7:a:e,n,z15), Georgia (I 6,7:b:e,n,z15),Glostrup (I 6,8:z10:e,n,z15), Gombe (I 6,7,14:d:e,n,z15), Kaduna(I 6,7,14:c:e,n,z15), Kastrup (I 6,7:e,n,z15:1,6), Larose (I 6,7:g,z51:e,n,z15),Lockleaze (I 6,7,14:b:e,n,x), Montevideo (I 6,7,14:g,m,�p�,s:�1,2,7�),Papuana (I 6,7:r:e,n,z15)
2007 7.6 Elisabethville 3,10:r:1,7 130 10.0 Weltevreden (I 3,10,�15�:r:z6) (5), Simi (I 3,10:r:e,n,z15) (2), Salmonellaspp. (2),Give (I 3,10,�15�, �15,34�:�d�,l,v:1,7), Montevideo(I 6,7,14:g,m,�p�,s:�1,2,7�), Seegefeld (I 3,10:r,i:1,2), Westhampton(I 3,10,�15�, �15,34�:g,s,t:�)
2007 7.7 Poona 13,22:z:1,6 121 14.0 Bristol (I 13,22:z:1,7) (2), Farmsen (I 13,23:z:1,6) (2), Salmonella spp. (2),Borbeck (I 13,22:l,v:1,6), Derby (I 1,4,�5�,12:f,g:�1,2�), Durban(I 9,12:a:e,n,z15), Gabon (I 6,7:l,w:1,2), Kuru (I 6,8:z:l,w), Manhattan(I 6,8:d:1,5), Marburg (I 13,23:k:�), Montevideo (I 6,7,14:g,m,�p�,s:�1,2,7�),Nyanza (I 11:z:z6:�z83�), Saugus (I 40:b:1,7), Salmonella subsp. II
2007 7.8 Isangi 6,7:d:1,5 136 13.2 Kisii (I 6,7:d:1,2) (4), Kambole (I 6,7:d:1;�2�,7) (2), Livingstone(I 6,7,14:d:l,w) (2), Paratyphi C (I 6,7,�Vi�:c:1,5) (2), Wil(I 6,7:d:l,z13,z28) (2), Choleraesuis (I 6,7:c:1,5), Herston (I 6,8:d:e,n,z15),Manhattan (I 6,8:d:1,5), Nievkerk (I 6,7,14:d:z6), Poitiers (I 6,7:z:1,5),Salmonella spp.
2006 6.1 Salmonella I4,5,12:i:�
1,4,12:i:� 122 41.0 Typhimurium (I 1,4,�5�,12:i:1,2) (38), Farsta (I 4,5:i:e,n,x) (3), Gloucester(I 1,4,12,27:i:l,w) (2), Agama (I 4,12:i:1,6), Lagos (I 1,4,�5�,12:i:1,5),Mathura (I 9,46:i:e,n,z15), Paratyphi B (I 1,4,�5�,12:b:1,2), Tsevie(I 4,12:i:e,n,z15), Tumodi (I 1,4,12,27:l,�z15�,z28:1,5), Salmonella subsp. V
2006 6.2 Saintpaul 1,4,12:e,h:1,2 119 11.8 Sandiego (I 4;�5�,12:e,h:e,n,z15) (6), Chester (I 1,4,�5�,12:e,h:e,n,x) (2),Reading (I 1,4,�5�,12:e,h:1,5), Bardo (I 8,e,h:1,2), Typhimurium(I 1,4,�5�,12:i:1,2), Paratyphi B (I 1,4,�5�,12:b:1,2), Chartres(I 1,4,12:e,h:l,w), I 4,12:�:�b
2006 6.3 Virchow 6,7:r:1,2 121 9.9 Nigeria (I 6,7:r:1,6) (4), I 6,7:r:� (3), Bsilla (I 6,8:r:1,2), Infantis(I 6,7,14:r:1,5), Lomita (I 6,7:e,h:1,5), Papuana (I 6,7:r:e,n,z15), Ngili(I 6,7:z10:1,7)
2006 6.4 Rissen 6,7:f,g:� 118 11.0 Montevideo (I 6,7,14:g,m,�p�,s:�1,2,7�) (5), Eingedi (I 6,7:f,g,t:1,2,7) (2),Othmarschen (I 6,7,14:g,m,�t�:�) (2), Blegdam (I 9,12:g,m,q:�), Derby(I 1,4,�5�,12:f,g:�1,2�), Oranienburg (I 6,7,14:m,t:�z57�), Sandow(I 6,8:f,g:e,n,z15)
2006 6.5 Reading 4,5,12:e,h:1,5 121 16.5 Saintpaul (I 1,4,�5�,12:e,h:1,2) (6), Sandiego (I 4;�5�,12:e,h:e,n,z15) (3),Chester (I 1,4,�5�,12:e,h:e,n,x) (2), Bradford (I 4,12,27:r:1,5), Derby(I 1,4,�5�,12:f,g:�1,2�), Enteritidis (I 1,9,12:�f�,g,m,�p�:�1,7�), Eppendorf(I 1,4,12,27:d:1,5), Hato (I 1,4,�5�,12:g,m,s:�), Mono (I 4,12:l,w:1,5),Paratyphi B (I 1,4,�5�,12:b:1,2), Typhimurium (I 1,4,�5�,12:i:1,2),I 4,5,12:�:�b
2006 6.6 Enteritidis 9,12:g,m:� 124 6.5 Gallinarum (I 1,9,12:�,�) (2), Berta (I 1,9,12:�f�,g,�t�:�), Blegdam(I 9,12:g,m,q:�), Bournemount (I 9,12:e,h:1,2), London (I 3,10,�15�:l,v:1,6),Montevideo (I 6,7,14:g,m,�p�,s:�1,2,7�), Typhi (I 9,12,�Vi�:d:�)
2006 6.7 London 3,10:l,v:1,6 111 9.9 Amherstiana (I 8:l,v:1,6) (2), Give (I 3,10,�15��15,34�:�d�,l,v:1,7) (2),Birmingham (I 3,10:d:l,w), Clackamas (I 4,12:l,v:1,6), Nchanga(I 3,10,�15�,l,v:1,2), Ruzizi (I 3,10:l,v:e,n,z15), Sinstorf (I 3,10:l,v:1,5),Stockholm (I 3,10,�15�:y:z6), Suberu (I 3,10:g,m:�)
2006 6.8 Give 3,10:l,v:1,7 114 9.6 London (I 3,10,�15�:l,v:1,6) (4), Nchanga (I 3,10,�15�,l,v:1,2) (2),Amsterdam (I 3,10,�15��15,34�:g,m,s:�), Bredeney (I 1,4,12,27:l,v:1,7),Kortrijk (I 6,7:l,v:1,7), Mokola (I 3,10:y:1,7), Stormont (I 3,10:d:1,2)
2004 5.1 Give 3,10:l,v:1,7 111 26.1 London (I 3,10,�15�:l,v:1,6) (9), Parkroyal (I 1,3,19:l,v:1,7) (3), Meleagridis(I 3,10,�15��15,34�:e,h:l,w) (3), Joal (I 3,10:l,z28:1,7) (2), Nchanga(I 3,10,�15�,l,v:1,2) (2), Anatum (I 3,10,�15��15,34�:e,h:1,6),Assinie (I 3,10:l,w:z6), Cannonhill (I 3,10,�15�,19:y:e,n,x), Elisabethville(I 3,10:r:1,7), Litchfield (I 6,8:l,v:1,2), Newbrunswick,b Nyborg(I 3,10,�15�:e,h:1,7) Ruzizi (I 3,10:l,v:e,n,z15), Sinchew (I 3,10:l,v:z35),Sinstorf (I 3,10:l,v:1,5)
2004 5.2 Braenderup var. 14� 6,7,14:eh:enz15 110 6.8 Larochelle (I 6,7:e,h:1,2) (2), Norwich (I 6,7:e,h:1,6) (2), Larose(I 6,7:g,z51:e,n,z15), Lomita (I 6,7:e,h:1,5), Sanjuan (I 6,7:a:1,5)
Continued on following page
VOL. 47, 2009 GLOBAL EQAS FOR SALMONELLA SEROTYPING 2731
by on August 31, 2009
jcm.asm
.orgD
ownloaded from
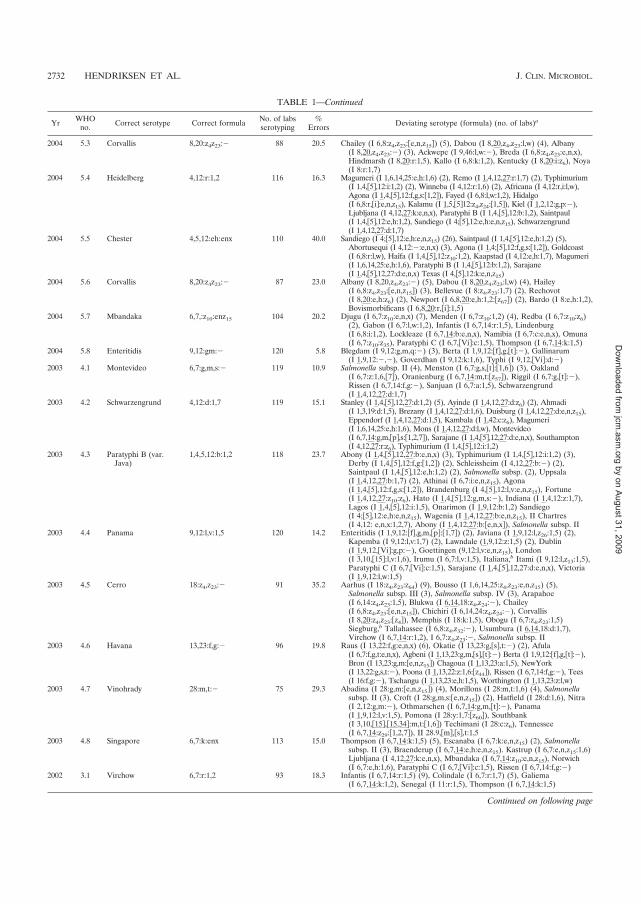
TABLE 1—Continued
Yr WHOno. Correct serotype Correct formula No. of labs
serotyping%
Errors Deviating serotype (formula) (no. of labs)a
2004 5.3 Corvallis 8,20:z4z23:� 88 20.5 Chailey (I 6,8:z4,z23:�e,n,z15�) (5), Dabou (I 8,20,z4,z23:l,w) (4), Albany(I 8,20,z4,z23:�) (3), Ackwepe (I 9,46:l,w:�), Breda (I 6,8:z4,z23:e,n,x),Hindmarsh (I 8,20:r:1,5), Kallo (I 6,8:k:1,2), Kentucky (I 8,20:i:z6), Noya(I 8:r:1,7)
2004 5.4 Heidelberg 4,12:r:1,2 116 16.3 Magumeri (I 1,6,14,25:e,h:1,6) (2), Remo (I 1,4,12,27:r:1,7) (2), Typhimurium(I 1,4,�5�,12:i:1,2) (2), Winneba (I 4,12:r:1,6) (2), Africana (I 4,12:r,i:l,w),Agona (I 1,4,�5�,12:f,g,s:�1,2�), Fayed (I 6,8:l,w:1,2), Hidalgo(I 6,8:r,�i�:e,n,z15), Kalamu (I 1,5,�5�12:z4,z24:�1,5�), Kiel (I 1,2,12:g,p:�),Ljubljana (I 4,12,27:k:e,n,x), Paratyphi B (I 1,4,�5�,12:b:1,2), Saintpaul(I 1,4,�5�,12:e,h:1,2), Sandiego (I 4;�5�,12:e,h:e,n,z15), Schwarzengrund(I 1,4,12,27:d:1,7)
2004 5.5 Chester 4,5,12:eh:enx 110 40.0 Sandiego (I 4;�5�,12:e,h:e,n,z15) (26), Saintpaul (I 1,4,�5�,12:e,h:1,2) (5),Abortusequi (I 4,12:�:e,n,x) (3), Agona (I 1,4;�5�,12:f,g,s:�1,2�), Goldcoast(I 6,8:r:l,w), Haıfa (I 1,4,�5�,12:z10:1,2), Kaapstad (I 4,12:e,h:1,7), Magumeri(I 1,6,14,25:e,h:1,6), Paratyphi B (I 1,4,�5�,12:b:1,2), Sarajane(I 1,4,�5�,12,27:d:e,n,x) Texas (I 4,�5�,12:k:e,n,z15)
2004 5.6 Corvallis 8,20:z4z23:� 87 23.0 Albany (I 8,20,z4,z23:�) (5), Dabou (I 8,20,z4,z23:l,w) (4), Hailey(I 6,8:z4,z23:�e,n,z15�) (3), Bellevue (I 8:z4,z23:1,7) (2), Rechovot(I 8,20:e,h:z6) (2), Newport (I 6,8,20:e,h:1,2:�z67�) (2), Bardo (I 8:e,h:1,2),Bovismorbificans (I 6,8,20:r,�i�:1,5)
2004 5.7 Mbandaka 6,7,:z10:enz15 104 20.2 Djugu (I 6,7:z10:e,n,x) (7), Menden (I 6,7:z10:1,2) (4), Redba (I 6,7:z10:z6)(2), Gabon (I 6,7:l,w:1,2), Infantis (I 6,7,14:r:1,5), Lindenburg(I 6,8:i:1,2), Lockleaze (I 6,7,14:b:e,n,x), Namibia (I 6,7:c:e,n,x), Omuna(I 6,7:z10:z35), Paratyphi C (I 6,7,�Vi�:c:1,5), Thompson (I 6,7,14:k:1,5)
2004 5.8 Enteritidis 9,12:gm:� 120 5.8 Blegdam (I 9,12:g,m,q:�) (3), Berta (I 1,9,12:�f�,g,�t�:�), Gallinarum(I 1,9,12:�,�), Goverdhan (I 9,12:k:1,6), Typhi (I 9,12,�Vi�:d:�)
2003 4.1 Montevideo 6,7:g,m,s:� 119 10.9 Salmonella subsp. II (4), Menston (I 6,7:g,s,�t�:�1,6�) (3), Oakland(I 6,7:z:1,6,�7�), Oranienburg (I 6,7,14:m,t:�z57�), Riggil (I 6,7:g,�t�:�),Rissen (I 6,7,14:f,g:�), Sanjuan (I 6,7:a:1,5), Schwarzengrund(I 1,4,12,27:d:1,7)
2003 4.2 Schwarzengrund 4,12:d:1,7 119 15.1 Stanley (I 1,4,�5�,12,27:d:1,2) (5), Ayinde (I 1,4,12,27:d:z6) (2), Ahmadi(I 1,3,19:d:1,5), Brezany (I 1,4,12,27:d:1,6), Duisburg (I 1,4,12,27:d:e,n,z15),Eppendorf (I 1,4,12,27:d:1,5), Kambala (I 1,42:c:z6), Magumeri(I 1,6,14,25:e,h:1,6), Mons (I 1,4,12,27:d:l,w), Montevideo(I 6,7,14:g,m,�p�,s:�1,2,7�), Sarajane (I 1,4,�5�,12,27:d:e,n,x), Southampton(I 4,12,27:r:z6), Typhimurium (I 1,4,�5�,12:i:1,2)
2003 4.3 Paratyphi B (var.Java)
1,4,5,12:b:1,2 118 23.7 Abony (I 1,4,�5�,12,27:b:e,n,x) (3), Typhimurium (I 1,4,�5�,12:i:1,2) (3),Derby (I 1,4,�5�,12:f,g:�1,2�) (2), Schleissheim (I 4,12,27:b:�) (2),Saintpaul (I 1,4,�5�,12:e,h:1,2) (2), Salmonella subsp. (2), Uppsala(I 1,4,12,27:b:1,7) (2), Athinai (I 6,7:i:e,n,z15), Agona(I 1,4,�5�,12:f,g,s:�1,2�), Brandenburg (I 4,�5�,12:l,v:e,n,z15), Fortune(I 1,4,12,27:z10:z6), Hato (I 1,4,�5�,12:g,m,s:�), Indiana (I 1,4,12:z:1,7),Lagos (I 1,4,�5�,12:i:1,5), Onarimon (I 1,9,12:b:1,2) Sandiego(I 4;�5�,12:e,h:e,n,z15), Wagenia (I 1,4,12,27:b:e,n,z15), II Chartres(I 4,12: e,n,x:1,2,7), Abony (I 1,4,12,27:b:�e,n,x�), Salmonella subsp. II
2003 4.4 Panama 9,12:l,v:1,5 120 14.2 Enteritidis (I 1,9,12:�f�,g,m,�p�:�1,7�) (2), Javiana (I 1,9,12:l,z26:1,5) (2),Kapemba (I 9,12:l,v:1,7) (2), Lawndale (1,9,12:z:1,5) (2), Dublin(I 1,9,12,�Vi�:g,p:�), Goettingen (9,12:l,v:e,n,z15), London(I 3,10,�15�:l,v:1,6), Irumu (I 6,7:l,v:1,5), Italiana,b Itami (I 9,12:l,z13:1,5),Paratyphi C (I 6,7,�Vi�:c:1,5), Sarajane (I 1,4,�5�,12,27:d:e,n,x), Victoria(I 1,9,12:l,w:1,5)
2003 4.5 Cerro 18:z4,z23:� 91 35.2 Aarhus (I 18:z4,z23:z64) (9), Bousso (I 1,6,14,25:z4,z23:e,n,z15) (5),Salmonella subsp. III (3), Salmonella subsp. IV (3), Arapahoe(I 6,14:z4,z23:1,5), Blukwa (I 6,14,18:z4,z24:�), Chailey(I 6,8:z4,z23:�e,n,z15�), Chichiri (I 6,14,24:z4,z24:�), Corvallis(I 8,20:z4,z23:�z4�), Memphis (I 18:k:1,5), Obogu (I 6,7:z4,z23:1,5)Siegburg,b Tallahassee (I 6,8:z4,z32:�), Usumbura (I 6,14,18:d:1,7),Virchow (I 6,7,14:r:1,2), I 6,7:z4,z23:�, Salmonella subsp. II
2003 4.6 Havana 13,23:f,g:� 96 19.8 Raus (I 13,22:f,g:e,n,x) (6), Okatie (I 13,23:g,�s�,t:�) (2), Afula(I 6,7:f,g,t:e,n,x), Agbeni (I 1,13,23:g,m,�s�,�t�:�) Berta (I 1,9,12:�f�,g,�t�:�),Bron (I 13,23:g,m:�e,n,z15�) Chagoua (I 1,13,23:a:1,5), NewYork(I 13,22:g,s,t:�), Poona (I 1,13,22:z:1,6:�z44�), Rissen (I 6,7,14:f,g:�), Tees(I 16:f,g:�), Tschangu (I 1,13,23:e,h:1,5), Worthington (I 1,13,23:z:l,w)
2003 4.7 Vinohrady 28:m,t:� 75 29.3 Abadina (I 28:g,m:�e,n,z15�) (4), Morillons (I 28:m,t:1,6) (4), Salmonellasubsp. II (3), Croft (I 28:g,m,s:�e,n,z15�) (2), Hatfield (I 28:d:1,6), Nitra(I 2,12:g,m:�), Othmarschen (I 6,7,14:g,m,�t�:�), Panama(I 1,9,12:l,v:1,5), Pomona (I 28:y:1,7:�z60�), Southbank(I 3,10,�15�,�15,34�:m,t:�1,6�) Techimani (I 28:c:z6), Tennessee(I 6,7,14:z29:�1,2,7�), II 28.9,�m�,�s�,t:1,5
2003 4.8 Singapore 6,7:k:enx 113 15.0 Thompson (I 6,7,14:k:1,5) (5), Escanaba (I 6,7:k:e,n,z15) (2), Salmonellasubsp. II (3), Braenderup (I 6,7,14:e,h:e,n,z15). Kastrup (I 6,7:e,n,z15:1,6)Ljubljana (I 4,12,27:k:e,n,x), Mbandaka (I 6,7,14:z10:e,n,z15), Norwich(I 6,7:e,h:1,6), Paratyphi C (I 6,7,�Vi�:c:1,5), Rissen (I 6,7,14:f,g:�)
2002 3.1 Virchow 6,7:r:1,2 93 18.3 Infantis (I 6,7,14:r:1,5) (9), Colindale (I 6,7:r:1,7) (5), Galiema(I 6,7,14:k:1,2), Senegal (I 11:r:1,5), Thompson (I 6,7,14:k:1,5)
Continued on following page
2732 HENDRIKSEN ET AL. J. CLIN. MICROBIOL.
by on August 31, 2009
jcm.asm
.orgD
ownloaded from
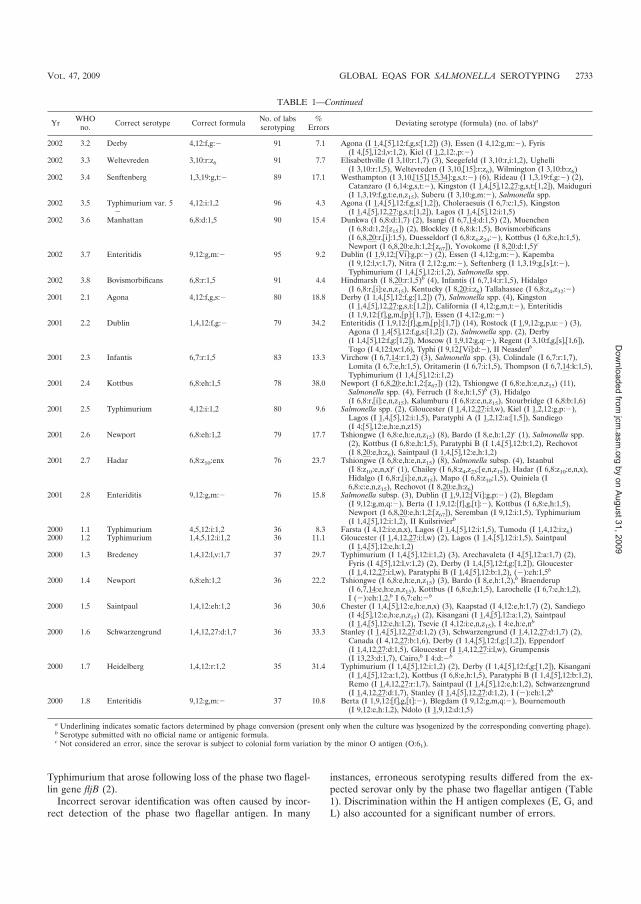
Typhimurium that arose following loss of the phase two flagel-lin gene fljB (2).
Incorrect serovar identification was often caused by incor-rect detection of the phase two flagellar antigen. In many
instances, erroneous serotyping results differed from the ex-pected serovar only by the phase two flagellar antigen (Table1). Discrimination within the H antigen complexes (E, G, andL) also accounted for a significant number of errors.
TABLE 1—Continued
Yr WHOno. Correct serotype Correct formula No. of labs
serotyping%
Errors Deviating serotype (formula) (no. of labs)a
2002 3.2 Derby 4,12:f,g:� 91 7.1 Agona (I 1,4,�5�,12:f,g,s:�1,2�) (3), Essen (I 4,12:g,m:�), Fyris(I 4,�5�,12:l,v:1,2), Kiel (I 1,2,12:,p:�)
2002 3.3 Weltevreden 3,10:r:z6 91 7.7 Elisabethville (I 3,10:r:1,7) (3), Seegefeld (I 3,10:r,i:1,2), Ughelli(I 3,10:r:1,5), Weltevreden (I 3,10,�15�:r:z6), Wilmington (I 3,10:b:z6)
2002 3.4 Senftenberg 1,3,19:g,t:� 89 17.1 Westhampton (I 3,10,�15�,�15,34�:g,s,t:�) (6), Rideau (I 1,3,19:f,g:�) (2),Catanzaro (I 6,14:g,s,t:�), Kingston (I 1,4,�5�,12,27:g,s,t:�1,2�), Maiduguri(I 1,3,19:f,g,t:e,n,z15), Suberu (I 3,10:g,m:�), Salmonella spp.
2002 3.5 Typhimurium var. 5�
4,12:i:1,2 96 4.3 Agona (I 1,4,�5�,12:f,g,s:�1,2�), Choleraesuis (I 6,7:c:1,5), Kingston(I 1,4,�5�,12,27:g,s,t:�1,2�), Lagos (I 1,4,�5�,12:i:1,5)
2002 3.6 Manhattan 6,8:d:1,5 90 15.4 Dunkwa (I 6,8:d:1,7) (2), Isangi (I 6,7,14:d:1,5) (2), Muenchen(I 6,8:d:1,2:�z15�) (2), Blockley (I 6,8:k:1,5), Bovismorbificans(I 6,8,20:r,�i�:1,5), Duesseldorf (I 6,8:z4,z24:�), Kottbus (I 6,8:e,h:1,5),Newport (I 6,8,20:e,h:1,2:�z67�), Yovokome (I 8,20:d:1,5)c
2002 3.7 Enteritidis 9,12:g,m:� 95 9.2 Dublin (I 1,9,12;�Vi�:g,p:�) (2), Essen (I 4,12:g,m:�), Kapemba(I 9,12:l,v:1,7), Nitra (I 2,12:g,m:�), Seftenberg (I 1,3,19:g,�s�,t:�),Typhimurium (I 1,4,�5�,12:i:1,2), Salmonella spp.
2002 3.8 Bovismorbificans 6,8:r:1,5 91 4.4 Hindmarsh (I 8,20:r:1,5)b (4), Infantis (I 6,7,14:r:1,5), Hidalgo(I 6,8:r,�i�:e,n,z15), Kentucky (I 8,20:i:z6) Tallahassee (I 6,8:z4,z32:�)
2001 2.1 Agona 4,12:f,g,s:� 80 18.8 Derby (I 1,4,�5�,12:f,g:�1,2�) (7), Salmonella spp. (4), Kingston(I 1,4,�5�,12,27:g,s,t:�1,2�), California (I 4,12:g,m,t:�), Enteritidis(I 1,9,12:�f�,g,m,�p�:�1,7�), Essen (I 4,12:g,m:�)
2001 2.2 Dublin 1,4,12:f,g:� 79 34.2 Enteritidis (I 1,9,12:�f�,g,m,�p�:�1,7�) (14), Rostock (I 1,9,12:g,p,u:�) (3),Agona (I 1,4�5�,12:f,g,s:�1,2�) (2), Salmonella spp. (2), Derby(I 1,4,�5�,12:f,g:�1,2�), Moscow (I 1,9,12:g,q:�), Regent (I 3,10:f,g,�s�,�1,6�),Togo (I 4,12:l,w:1,6), Typhi (I 9,12,�Vi�:d:�), II Neasdenb
2001 2.3 Infantis 6,7:r:1,5 83 13.3 Virchow (I 6,7,14:r:1,2) (3), Salmonella spp. (3), Colindale (I 6,7:r:1,7),Lomita (I 6,7:e,h:1,5), Oritamerin (I 6,7:i:1,5), Thompson (I 6,7,14:k:1,5),Typhimurium (I 1,4,�5�,12:i:1,2)
2001 2.4 Kottbus 6,8:eh:1,5 78 38.0 Newport (I 6,8,20:e,h:1,2:�z67�) (12), Tshiongwe (I 6,8:e,h:e,n,z15) (11),Salmonella spp. (4), Ferruch (I 8:e,h:1,5)b (3), Hidalgo(I 6,8:r,�i�:e,n,z15), Kalumburu (I 6,8:z:e,n,z15), Stourbridge (I 6,8:b:1,6)
2001 2.5 Typhimurium 4,12:i:1,2 80 9.6 Salmonella spp. (2), Gloucester (I 1,4,12,27:i:l,w), Kiel (I 1,2,12:g,p:�),Lagos (I 1,4,�5�,12:i:1,5), Paratyphi A (I 1,2,12:a:�1,5�), Sandiego(I 4;�5�,12:e,h:e,n,z15)
2001 2.6 Newport 6,8:eh:1,2 79 17.7 Tshiongwe (I 6,8:e,h:e,n,z15) (8), Bardo (I 8,e,h:1,2)c (1), Salmonella spp.(2), Kottbus (I 6,8:e,h:1,5), Paratyphi B (I 1,4,�5�,12:b:1,2), Rechovot(I 8,20:e,h:z6), Saintpaul (I 1,4,�5�,12:e,h:1,2)
2001 2.7 Hadar 6,8:z10:enx 76 23.7 Tshiongwe (I 6,8:e,h:e,n,z15) (8), Salmonella subsp. (4), Istanbul(I 8:z10:e,n,x)c (1), Chailey (I 6,8:z4,z23:�e,n,z15�), Hadar (I 6,8:z10:e,n,x),Hidalgo (I 6,8:r,�i�:e,n,z15), Mapo (I 6,8:z10:1,5), Quiniela (I6,8:c:e,n,z15), Rechovot (I 8,20:e,h:z6)
2001 2.8 Enteriditis 9,12:g,m:� 76 15.8 Salmonella subsp. (3), Dublin (I 1,9,12;�Vi�:g,p:�) (2), Blegdam(I 9,12:g,m,q:�), Berta (I 1,9,12:�f�,g,�t�:�), Kottbus (I 6,8:e,h:1,5),Newport (I 6,8,20:e,h:1,2:�z67�), Seremban (I 9,12:i:1,5), Typhimurium(I 1,4,�5�,12:i:1,2), II Kuilsrivierb
2000 1.1 Typhimurium 4,5,12:i:1,2 36 8.3 Farsta (I 4,12:i:e,n,x), Lagos (I 1,4,�5�,12:i:1,5), Tumodu (I 1,4,12:i:z6)2000 1.2 Typhimurium 1,4,5,12:i:1,2 36 11.1 Gloucester (I 1,4,12,27:i:l,w) (2), Lagos (I 1,4,�5�,12:i:1,5), Saintpaul
(I 1,4,�5�,12:e,h:1,2)2000 1.3 Bredeney 1,4,12:l,v:1,7 37 29.7 Typhimurium (I 1,4,�5�,12:i:1,2) (3), Arechavaleta (I 4,�5�,12:a:1,7) (2),
Fyris (I 4,�5�,12:l,v:1,2) (2), Derby (I 1,4,�5�,12:f,g:�1,2�), Gloucester(I 1,4,12,27:i:l,w), Paratyphi B (I 1,4,�5�,12:b:1,2), (�):eh:1,5b
2000 1.4 Newport 6,8:eh:1,2 36 22.2 Tshiongwe (I 6,8:e,h:e,n,z15) (3), Bardo (I 8,e,h:1,2),b Braenderup(I 6,7,14:e,h:e,n,z15), Kottbus (I 6,8:e,h:1,5), Larochelle (I 6,7:e,h:1,2),I (�):eh:1,2,b I 6,7:eh:�b
2000 1.5 Saintpaul 1,4,12:eh:1,2 36 30.6 Chester (I 1,4,�5�,12:e,h:e,n,x) (3), Kaapstad (I 4,12:e,h:1,7) (2), Sandiego(I 4;�5�,12:e,h:e,n,z15) (2), Kisangani (I 1,4,�5�,12:a:1,2), Saintpaul(I 1,4,�5�,12:e,h:1,2), Tsevie (I 4,12:i:e,n,z15), I 4:e,h:e,nb
2000 1.6 Schwarzengrund 1,4,12,27:d:1,7 36 33.3 Stanley (I 1,4,�5�,12,27:d:1,2) (3), Schwarzengrund (I 1,4,12,27:d:1,7) (2),Canada (I 4,12,27:b:1,6), Derby (I 1,4,�5�,12:f,g:�1,2�), Eppendorf(I 1,4,12,27:d:1,5), Gloucester (I 1,4,12,27:i:l,w), Grumpensis(I 13,23:d:1,7), Cairo,b I 4:d:�b
2000 1.7 Heidelberg 1,4,12:r:1,2 35 31.4 Typhimurium (I 1,4,�5�,12:i:1,2) (2), Derby (I 1,4,�5�,12:f,g:�1,2�), Kisangani(I 1,4,�5�,12:a:1,2), Kottbus (I 6,8:e,h:1,5), Paratyphi B (I 1,4,�5�,12:b:1,2),Remo (I 1,4,12,27:r:1,7), Saintpaul (I 1,4,�5�,12:e,h:1,2), Schwarzengrund(I 1,4,12,27:d:1,7), Stanley (I 1,4,�5�,12,27:d:1,2), I (�):eh:1,2b
2000 1.8 Enteritidis 9,12:g,m:� 37 10.8 Berta (I 1,9,12:�f�,g,�t�:�), Blegdam (I 9,12:g,m,q:�), Bournemouth(I 9,12:e,h:1,2), Ndolo (I 1,9,12:d:1,5)
a Underlining indicates somatic factors determined by phage conversion (present only when the culture was lysogenized by the corresponding converting phage).b Serotype submitted with no official name or antigenic formula.c Not considered an error, since the serovar is subject to colonial form variation by the minor O antigen (O:61).
VOL. 47, 2009 GLOBAL EQAS FOR SALMONELLA SEROTYPING 2733
by on August 31, 2009
jcm.asm
.orgD
ownloaded from
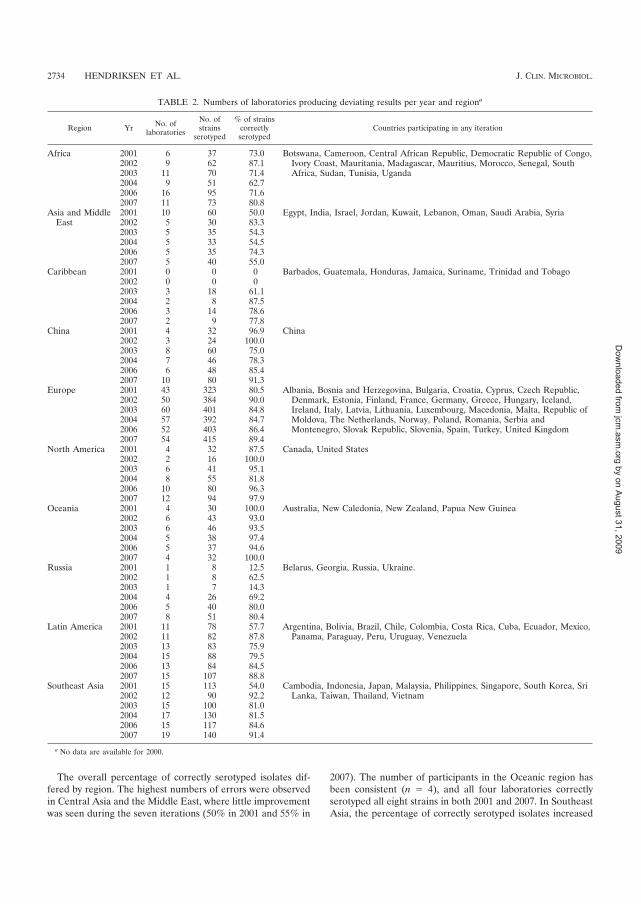
The overall percentage of correctly serotyped isolates dif-fered by region. The highest numbers of errors were observedin Central Asia and the Middle East, where little improvementwas seen during the seven iterations (50% in 2001 and 55% in
2007). The number of participants in the Oceanic region hasbeen consistent (n � 4), and all four laboratories correctlyserotyped all eight strains in both 2001 and 2007. In SoutheastAsia, the percentage of correctly serotyped isolates increased
TABLE 2. Numbers of laboratories producing deviating results per year and regiona
Region Yr No. oflaboratories
No. ofstrains
serotyped
% of strainscorrectlyserotyped
Countries participating in any iteration
Africa 2001 6 37 73.0 Botswana, Cameroon, Central African Republic, Democratic Republic of Congo,Ivory Coast, Mauritania, Madagascar, Mauritius, Morocco, Senegal, SouthAfrica, Sudan, Tunisia, Uganda
2002 9 62 87.12003 11 70 71.42004 9 51 62.72006 16 95 71.62007 11 73 80.8
Asia and MiddleEast
2001 10 60 50.0 Egypt, India, Israel, Jordan, Kuwait, Lebanon, Oman, Saudi Arabia, Syria2002 5 30 83.32003 5 35 54.32004 5 33 54.52006 5 35 74.32007 5 40 55.0
Caribbean 2001 0 0 0 Barbados, Guatemala, Honduras, Jamaica, Suriname, Trinidad and Tobago2002 0 0 02003 3 18 61.12004 2 8 87.52006 3 14 78.62007 2 9 77.8
China 2001 4 32 96.9 China2002 3 24 100.02003 8 60 75.02004 7 46 78.32006 6 48 85.42007 10 80 91.3
Europe 2001 43 323 80.5 Albania, Bosnia and Herzegovina, Bulgaria, Croatia, Cyprus, Czech Republic,Denmark, Estonia, Finland, France, Germany, Greece, Hungary, Iceland,Ireland, Italy, Latvia, Lithuania, Luxembourg, Macedonia, Malta, Republic ofMoldova, The Netherlands, Norway, Poland, Romania, Serbia andMontenegro, Slovak Republic, Slovenia, Spain, Turkey, United Kingdom
2002 50 384 90.02003 60 401 84.82004 57 392 84.72006 52 403 86.42007 54 415 89.4
North America 2001 4 32 87.5 Canada, United States2002 2 16 100.02003 6 41 95.12004 8 55 81.82006 10 80 96.32007 12 94 97.9
Oceania 2001 4 30 100.0 Australia, New Caledonia, New Zealand, Papua New Guinea2002 6 43 93.02003 6 46 93.52004 5 38 97.42006 5 37 94.62007 4 32 100.0
Russia 2001 1 8 12.5 Belarus, Georgia, Russia, Ukraine.2002 1 8 62.52003 1 7 14.32004 4 26 69.22006 5 40 80.02007 8 51 80.4
Latin America 2001 11 78 57.7 Argentina, Bolivia, Brazil, Chile, Colombia, Costa Rica, Cuba, Ecuador, Mexico,Panama, Paraguay, Peru, Uruguay, Venezuela2002 11 82 87.8
2003 13 83 75.92004 15 88 79.52006 13 84 84.52007 15 107 88.8
Southeast Asia 2001 15 113 54.0 Cambodia, Indonesia, Japan, Malaysia, Philippines, Singapore, South Korea, SriLanka, Taiwan, Thailand, Vietnam2002 12 90 92.2
2003 15 100 81.02004 17 130 81.52006 15 117 84.62007 19 140 91.4
a No data are available for 2000.
2734 HENDRIKSEN ET AL. J. CLIN. MICROBIOL.
by on August 31, 2009
jcm.asm
.orgD
ownloaded from
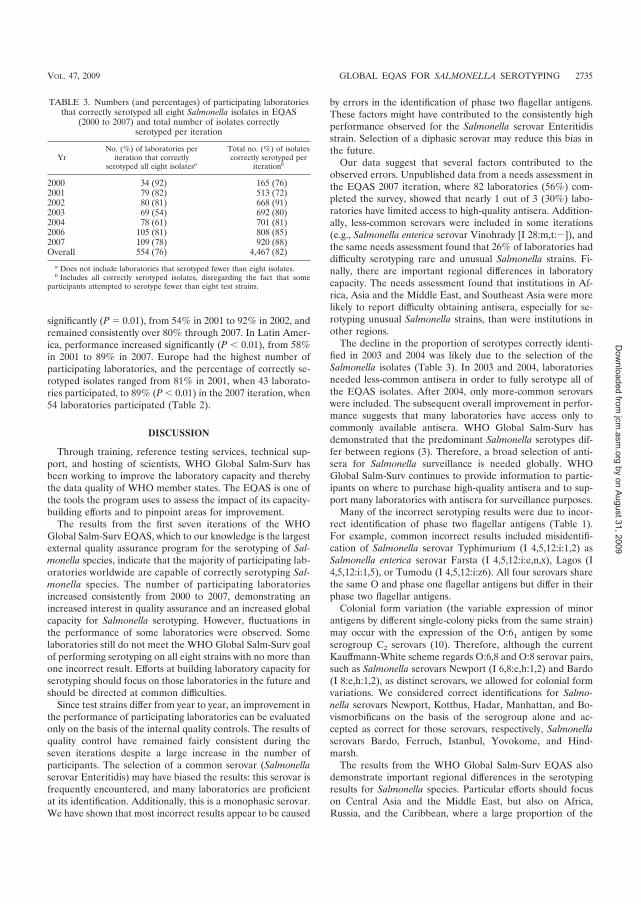
significantly (P � 0.01), from 54% in 2001 to 92% in 2002, andremained consistently over 80% through 2007. In Latin Amer-ica, performance increased significantly (P � 0.01), from 58%in 2001 to 89% in 2007. Europe had the highest number ofparticipating laboratories, and the percentage of correctly se-rotyped isolates ranged from 81% in 2001, when 43 laborato-ries participated, to 89% (P � 0.01) in the 2007 iteration, when54 laboratories participated (Table 2).
DISCUSSION
Through training, reference testing services, technical sup-port, and hosting of scientists, WHO Global Salm-Surv hasbeen working to improve the laboratory capacity and therebythe data quality of WHO member states. The EQAS is one ofthe tools the program uses to assess the impact of its capacity-building efforts and to pinpoint areas for improvement.
The results from the first seven iterations of the WHOGlobal Salm-Surv EQAS, which to our knowledge is the largestexternal quality assurance program for the serotyping of Sal-monella species, indicate that the majority of participating lab-oratories worldwide are capable of correctly serotyping Sal-monella species. The number of participating laboratoriesincreased consistently from 2000 to 2007, demonstrating anincreased interest in quality assurance and an increased globalcapacity for Salmonella serotyping. However, fluctuations inthe performance of some laboratories were observed. Somelaboratories still do not meet the WHO Global Salm-Surv goalof performing serotyping on all eight strains with no more thanone incorrect result. Efforts at building laboratory capacity forserotyping should focus on those laboratories in the future andshould be directed at common difficulties.
Since test strains differ from year to year, an improvement inthe performance of participating laboratories can be evaluatedonly on the basis of the internal quality controls. The results ofquality control have remained fairly consistent during theseven iterations despite a large increase in the number ofparticipants. The selection of a common serovar (Salmonellaserovar Enteritidis) may have biased the results: this serovar isfrequently encountered, and many laboratories are proficientat its identification. Additionally, this is a monophasic serovar.We have shown that most incorrect results appear to be caused
by errors in the identification of phase two flagellar antigens.These factors might have contributed to the consistently highperformance observed for the Salmonella serovar Enteritidisstrain. Selection of a diphasic serovar may reduce this bias inthe future.
Our data suggest that several factors contributed to theobserved errors. Unpublished data from a needs assessment inthe EQAS 2007 iteration, where 82 laboratories (56%) com-pleted the survey, showed that nearly 1 out of 3 (30%) labo-ratories have limited access to high-quality antisera. Addition-ally, less-common serovars were included in some iterations(e.g., Salmonella enterica serovar Vinohrady [I 28:m,t:�]), andthe same needs assessment found that 26% of laboratories haddifficulty serotyping rare and unusual Salmonella strains. Fi-nally, there are important regional differences in laboratorycapacity. The needs assessment found that institutions in Af-rica, Asia and the Middle East, and Southeast Asia were morelikely to report difficulty obtaining antisera, especially for se-rotyping unusual Salmonella strains, than were institutions inother regions.
The decline in the proportion of serotypes correctly identi-fied in 2003 and 2004 was likely due to the selection of theSalmonella isolates (Table 3). In 2003 and 2004, laboratoriesneeded less-common antisera in order to fully serotype all ofthe EQAS isolates. After 2004, only more-common serovarswere included. The subsequent overall improvement in perfor-mance suggests that many laboratories have access only tocommonly available antisera. WHO Global Salm-Surv hasdemonstrated that the predominant Salmonella serotypes dif-fer between regions (3). Therefore, a broad selection of anti-sera for Salmonella surveillance is needed globally. WHOGlobal Salm-Surv continues to provide information to partic-ipants on where to purchase high-quality antisera and to sup-port many laboratories with antisera for surveillance purposes.
Many of the incorrect serotyping results were due to incor-rect identification of phase two flagellar antigens (Table 1).For example, common incorrect results included misidentifi-cation of Salmonella serovar Typhimurium (I 4,5,12:i:1,2) asSalmonella enterica serovar Farsta (I 4,5,12:i:e,n,x), Lagos (I4,5,12:i:1,5), or Tumodu (I 4,5,12:i:z6). All four serovars sharethe same O and phase one flagellar antigens but differ in theirphase two flagellar antigens.
Colonial form variation (the variable expression of minorantigens by different single-colony picks from the same strain)may occur with the expression of the O:61 antigen by someserogroup C2 serovars (10). Therefore, although the currentKauffmann-White scheme regards O:6,8 and O:8 serovar pairs,such as Salmonella serovars Newport (I 6,8:e,h:1,2) and Bardo(I 8:e,h:1,2), as distinct serovars, we allowed for colonial formvariations. We considered correct identifications for Salmo-nella serovars Newport, Kottbus, Hadar, Manhattan, and Bo-vismorbificans on the basis of the serogroup alone and ac-cepted as correct for those serovars, respectively, Salmonellaserovars Bardo, Ferruch, Istanbul, Yovokome, and Hind-marsh.
The results from the WHO Global Salm-Surv EQAS alsodemonstrate important regional differences in the serotypingresults for Salmonella species. Particular efforts should focuson Central Asia and the Middle East, but also on Africa,Russia, and the Caribbean, where a large proportion of the
TABLE 3. Numbers (and percentages) of participating laboratoriesthat correctly serotyped all eight Salmonella isolates in EQAS
(2000 to 2007) and total number of isolates correctlyserotyped per iteration
YrNo. (%) of laboratories per
iteration that correctlyserotyped all eight isolatesa
Total no. (%) of isolatescorrectly serotyped per
iterationb
2000 34 (92) 165 (76)2001 79 (82) 513 (72)2002 80 (81) 668 (91)2003 69 (54) 692 (80)2004 78 (61) 701 (81)2006 105 (81) 808 (85)2007 109 (78) 920 (88)Overall 554 (76) 4,467 (82)
a Does not include laboratories that serotyped fewer than eight isolates.b Includes all correctly serotyped isolates, disregarding the fact that some
participants attempted to serotype fewer than eight test strains.
VOL. 47, 2009 GLOBAL EQAS FOR SALMONELLA SEROTYPING 2735
by on August 31, 2009
jcm.asm
.orgD
ownloaded from

laboratories do not correctly serotype many of the strains.Addressing the regional differences will involve additionaltraining courses in selected regions.
WHO Global Salm-Surv is a platform that can assist WHOmember states to strengthen their core public health capacitiesunder the International Health Regulations (IHR, 2005) fordisease surveillance and response, which will in turn strengtheninternational public health security. WHO Global Salm-Survpromotes intersectoral collaboration among human health,veterinary, and food-related disciplines in food safety andother issues that arise at the human-animal interface. As theprogram continues to expand, it increasingly addresses re-gional training and support needs.
Conclusion. This study showed that there is a continuingneed to improve Salmonella serotyping and that this needappears to be greater in specific regions. Detection of thephase two flagellar antigen is one of the more profound bar-riers to obtaining a satisfactory serotyping result. Future train-ing efforts should be aimed at enhancing the ability to charac-terize the phase two flagellar antigen and disseminatinginformation on where to purchase high-quality antisera.
ACKNOWLEDGMENTS
We thank the technical staff at the National Food Institute forpreparing, testing, and shipping the strains; the staff of the participat-ing laboratories who contributed to this program; and the staff at theregional sites for further distributing the EQAS parcels.
REFERENCES
1. Bangtrakulnonth, A., S. Pornreongwong, C. Pulsrikarn, P. Sawanpanyalert,R. S. Hendriksen, D. M. Lo Fo Wong, and F. M. Aarestrup. 2004. Salmonella
serovars from humans and other sources in Thailand, 1993–2002. Emerg.Infect. Dis. 10:131–136.
2. Echeita, M. A., S. Herrera, and M. A. Usera. 2001. Atypical, fljB-negativeSalmonella enterica subsp. enterica strain of serovar 4,5,12:i:� appears to bea monophasic variant of serovar Typhimurium. J. Clin. Microbiol. 39:2981–2983.
3. Galanis, E., D. M. Lo Fo Wong, M. E. Patrick, N. Binsztein, A. Cieslik, T.Chalermchikit, A. Aidara-Kane, A. Ellis, F. J. Angulo, and H. C. Wegener.2006. World Health Organization Global Salm-Surv. Web-based surveillanceand global Salmonella distribution, 2000–2002. Emerg. Infect. Dis. 12:381–388.
4. Hendriksen, R. S., A. M. Seyfarth, A. B. Jensen, J. Whichard, S. Karlsmose,K. Joyce, M. Mikoleit, S. M. Delong, F. X. Weill, A. Aidara-Kane, D. M. LoFo Wong, F. J. Angulo, H. C. Wegener, and F. M. Aarestrup. 19 November2008. Results of use of WHO Global Salm-Surv external quality assurancesystem for antimicrobial susceptibility testing of Salmonella isolates from2000 to 2007. J. Clin. Microbiol. doi:10.1128/JCM.00894-08.
5. Herikstad, H., Y. Motarjemi, and R. V. Tauxe. 2002. Salmonella surveillance:a global survey of public health serotyping. Epidemiol. Infect. 129:1–8.
6. Humphrey, T. J. 2000. Public-health aspects of Salmonella infections, p.245–263. In C. Wray and A. Wray (ed.), Salmonella in domestic animals.CABI Publishing, Wallingford, England.
7. Mead, P. S., L. Slutsker, V. Dietz, L. F. McCaig, J. S. Bresee, C. Shapiro,P. M. Griffin, and R. V. Tauxe. 1999. Food-related illness and death in theUnited States. Emerg. Infect. Dis. 5:607–625.
8. Olsen, S. J., R. Bishop, F. W. Brenner, T. H. Roels, N. Bean, R. V. Tauxe, andL. Slutsker. 2001. The changing epidemiology of Salmonella: trends in se-rotypes isolated from humans in the United States, 1987-1997. J. Infect. Dis.183:753–761.
9. Petersen, A., F. M. Aarestrup, F. J. Angulo, S. Wong, K. Stohr, and H. C.Wegener. 2002. WHO Global Salm-Surv External Quality Assurance System(EQAS): an important step towards improving the quality of Salmonellaserotyping and antimicrobial susceptibility testing worldwide. Microb. DrugResist. 8:345–353.
10. Popoff, M. Y. 2001. Guidelines for the preparation of Salmonella antisera,6th ed. WHO Collaborating Centre for Reference and Research on Salmo-nella. Institut Pasteur, Paris, France.
11. Popoff, M. Y., and L. Le Minor. 2001. Antigenic formulas of the Salmonellaserovars, 8th ed. WHO Collaborating Centre for Reference and Research onSalmonella, Institut Pasteur, Paris, France.
2736 HENDRIKSEN ET AL. J. CLIN. MICROBIOL.
by on August 31, 2009
jcm.asm
.orgD
ownloaded from

�
� �
Article II
Global monitoring of Salmonella serovar distribution based on quality assured data
from the WHO Global Salm-Surv Country Data Bank; 2001 – 2007.
�
Rene S. Hendriksen������������ ����������������������������������������������
������������ �!������"��#�����������$������������ ���%�����&���� ����������'��(��
#���� ����������������������$��
���)�������'�*����������%+�&���,���� �&������-������(�,����������(����
�',����.��� ������'�&�����/���-����(����,����/�-������(�,����������(���
0�(��(���1�2����/�-����������&$���� ��������������&�������-���������&�������'�.��2�������%+�&���,���� �&������-�����2�����(���
3$'��� /���'�&�����-�����������'�������',�����������������3����(��������
3$'��� /�"���(������������4���1���!����'�%������+� ��5�������$��������-��'���-��/���'�6������4���2������5�����'�
�
�&����$�'� �����or Rene S. Hendriksen,�
� �� )��io�����'�*���������
� �� �"8l��2�9��:����;�:<=�&$���� ��� ����������
� ��� .�one7�>?@�!@�AA�B=�==�
� � � � ��C7�>?@�!@�AA�B=�=��
� �� 3;�a�7�����D-'�'���'��
0�,����,����'��7�Foodborne Pathog Dis.�
AR
TIC
LE
II
�
)�������� ����7�)����������� �����������/������
4�,�������� �-������������2���'���,����,���'���E����/�������'�'����-�������
�%+�4�,����',����*�-�(����)������&����/������"���F��==��G��==:��
�
��������%��'����������������� ����������������������������������������������������
������ �!������"��#�����������$������������ ���%�����&���� ����������'��(��#��
�� ����������������������$��
�
��)�������'�*����������%+�&���,���� �&������-������(�,����������(�����',����
.��� ������'�&�����/���-����(����,����/�-������(�,����������(���0�(��(���
1�2����/�-����������&$���� ������������
��&�������-���������&�������'�.��2�������%+�&���,���� �&������-�����2�����(���
3$'��� /���'�&�����-�����������'�������',�����������������3����(��������
3$'��� /�"���(������������4���1���
!����'�%������+� ��5�������$��������-��'���-��/���'�6������4���2������5�����'�
�
�&����$�'� ������7� ��������%��'�������
� � )�������'�*���������
� � "8���2�9��:����;�:<=�&$���� ��� ���
�� ���m����
� � .���7�>?@�!@�AA�B=�==�
� � ��C7�>?@�!@�AA�B=�=��
�� 3;�a�7�����D-'�'���'��
����� �����7�4�,�������� �-����������
� �

�
��/���'�7������������2���������� ��4�,���
� �
�
ABSTRACT (FPD
�����������'����� �,���'���,����-������=�����(����/�'���-�'������������2����
��(2���'�-���������(��(������$����,/��C���(�� � �,���'����-�������(��'�'�����������0���
'����-������������/�����,����'�-�������4�,����',����*�-�(����)������H4�)I�
H-�����/����������%+�4�,�������;���2I�&����/������"����H&�"I���'�����,���'���
E����/;������'��������������������'����-���!:�(���������(��$����'������������(��
�������'�-�����4�)�3C�������J����/��������(���/�����H3J��I��0���$��$���-�����������/�
��������(2����� ������'� �,�������'��������'���,����-������������2�����0���'����
$�������'����������'/�(��'�$�2'�� �'��(����(��(���,�����'�-����� ���'�����2��������'�
(�����$� ����������$�(-(������2���-�����(�������������������2����� �������
�
���-��'�(��'���,����� ����2��������� ���������(����/���$���'����2�����
%��2����(����������������������� ���/$(���/���$���'����������2�������'�(����� �
���'��(/�����������'�����/$����������������(��������(��'�'����������'/����������
,���2�'����-������2����$��'���������'�'���,��������$�����������'--������-��E���(�����
'--�������� ����*�������� �/�����,���2�'������ �,���/����������2��$��(���� ���-����3�����'��
��'����0/$�����������'�(����� ���������������2������(��������0/$������*�-���������%�'����
���)��$������� �(�������� �����'���������2���������(����� ��42������� �,����������-�
���2�����'�-'����'���������-�'� ���� ����������-�������(����������������2����,��'�2��$�'�
��'��$�������'������ �,����(�����
�
�
� !
�
INTRODUCTION
���������� ���������(����(�����-������� ��������������'�,�(����������'�'���*����
�������'������������1���'�������������������������?��������;�/$�'�����������
�-�(������������ ����BA�===�$�/�(���2������@�===���$���5�������'�@A=�'������H ���(��
� ������==?I�����'��2����/�-���������$���(�����/�-'�����������2��,����'���-�'����
�����2���-����;�/$�'�����������H&/���� ������<AAF�%��$���/�� ������<AAF�%��$���/�� �
�����===I���
�
����� �������������@==����2����-����������� �������2��,����'���-�'���'���������
�������-�(��������(����'�,/�������'����,���-����2�����*������'�2��$�'�(��������
���������� ��������2����0/$���������'�3�����'��������������(����/���$���'�
(������-����������������������2�����������2�����$$������,������$��2���������$�(-(�
�� ���H%��$���/�� ������===F�%�������'�� ������==�F�+������ ������==�F�"�� ������������ �
�����==?F�4������� ������==BI����-���������$�$����-��$�(-(��������/$�����'����2������
��������'�������$$�������(���,��'�������������'�(������� ����������������2����
������� ��������'� �,��5����-�-'���'��2���(�����'���0���������((�����(��-�
�������������(����/�$����������$�������$�,����-�������(��������0����5������
,��'���-�����$��� ��F�������(�����/�������������������2���'���,����������
(���������$���������������(������������������ ��������-'�$�'�(���(�������'�
����������--�(�2������-�����(��������������������(���-(����'���������(�����-�
����������2��,����'��(��'�����'�����3�����'����'����0/$����������������C$�(��'������
������(�����������������������--�(�2��� �������������2���������(�(�$���������,����
��--(����/��2������'��
�
� ?
�
*��#�����/��===���������'�%������+� ��5����H�%+I�����(��'������%+�4�,�������;���2�
$� ������H�%+�4��I���� �,����--�����,��'�(�$�(�/���'���(���(�������'�$��2����
-',������'�����������(��-�(����-���-��������,����0�� ��� ����/�-(��� ���
��������'� ���(����'��$'��� /������$� �����������2�2�'������(�$�(�/;,��'� �
$���-���������((��'�������2����/�-�-',������'�����������(�$��� ������'�'�������-�
�$����(��������2������� ����*���'�������-��(������,��'����($����'��$$�(����������%+�
4������������(����/�(��� �'��������K4�,����',����*�-�(����)������H4�)I�K��
3����(� ����'�'����,����/�(�$�(�/�-����������/$� �-��������������������/�,9�(�2��
-�4�)���'�����,9�(�2����-�(�����'�,/�,��(���$������ ���������������(��������'�
�����$���
�
�''�����,9�(�2���-�����4�)�$� �����(��'�������(� ���,����/�,���'����2�����(��
����������'������ ����� ���,����/�E����/����� �������/�������0���3C�������J����/�
�������(���/�����H3J��I���'�����*�������;,���'�&����/������"����H&�"I����������/�4�)�
$� �������(���������'������$��((�$����������,9�(�2����0���(����������$��-����(��-�
$���($��� ���,���������'������,/�$����������(�'���,����/;,���'����2�����(�������������
3C�������J����/��������(���/�����H3J��I���������,����'����===������$����-�����4�)�
$� ������H.��������� ������==�F�%��'������� ������==AF�%��'������� ������==<I��0���
*�������;,���'�&����/������"����H&�"I������������'���,��������(�����,���(�����������
��(��� �'����������/��$��'�'������������@�����(����/�'���-�'������������2����
H���$7LL����'-2-�'�L ��I����/����������������((������/������E���/�����'���,������'�2���'����
�����2���$��2����(��,/�(����/���'��� �����
�
� @
�
*������$�$���������������'�����'���,����-������������2����-������(��'�(��������,���'�
���C���(��'� �,���'����-�������(��'�'���������'����������&�"��0���$��$���-��������'/�������
��(2�������'����'�$���������������������2���$��2����(��'��� �����$��'�-����==����
�==:��0�������/�����'�������/�����,���'���'����-�����,���������(���������(��$����'�
����3J���E����/��������(���������'�H� ���������������'���������C����-����'�2����
-��������C$�(��'�����/$� �������I�����,����'�,/����������� �(�������-�����4�)��
�
METHODS
'5 �����.�� ��������������� ����
0���3J�����'��(�,�'���'���������������H.�����������������==�F�%��'������� ������==<I��*��
,��-��,��������?=���'��A=�$���($��� ���,���������(�2��� ����������-��������������
�������,�����0�����,�������������E�����'�������/$���������������'���,����������������
���� ����$�����'�$���(��'�'���,�����������%+�&���,���� �&������-������(�,���
�������(�����',����.��� �����&$���� ������������H����(�'���� ���,����/I��0���
$���($�����������������/�,��������2���������$��������� ������-��(���(�2���(�����0���
'������������'�(�������/��������5�'���'�������������$�����$�,����'������
H���$7LL��������(�,���������(��'�L�!!;�B<;��@;�E���������
���$7LL���������L�������2L�(�2���L4��M3J��L��LI���
�
$��� ����� �������
0���&�"�������,;���,��'�+��(���'���,�����+��/��������'����,������/�������'�����������
&�"���'�'��������/���$�����'�$���(��'��%��2��������&�"���/�,��2���'���'�E����'�,/�����
�������$�,�(��3�(��/�������'�� ����'����������,����/���$��������2���������������
��������'��������������������'�����������&�"��0���������'�'���������(�����-�����
� B
�
���,���-��������������'���'�����/$�'�-�����������������-'����2������������'L��
-��'����(�����'������@�����-��E�����/�'���-�'����2����-�����(��-������������2������(��
�����(�$���-�����$� ���������===���������,���-�4�)����,����$���� �����'�������&�"�
�����(�����'�����'�/���'����==<����������-�2������==����,�������@A�(��������0��� ����
����$��'���@:�4�)�N���,�������������$��������2��O���2��,����'�� ����'��0��������,���
����������$��������2������������ ����$��'��������'�����������$��@������������2����
,/������2��������''�����??@�N �������������������$��������2��O������ 2���� ������
�$��'�����������'����������$������$����-�����&�"��*��������<A:��������'�����������'��::�
����������'����������2��,�����$��'�'��������&�"��
�
���,��������-�����4�)�3J�����'�����&�"������(�$���'�����(�������+��(���'���,������'���
����-�������������'�����������,����$���($��� ���,���$� ������(�$����������
,����'��+��/�'����-������,���������'��$��'�'���������'�'����-�������� ���������
&�"���'���������E����/��������(���������'��������������������-�����3J��������
�(��'�'�����������/����)�;������'����H�����������-'������2��������I���������'�-���
�������'/�'������������������,���-����,�������,����$��'�'�'����-�����;���������(���
��'���������E����/��������(���������'�����,���'����H���,���-��������������'���'�
����/$�'�����������������$��@�����(�������2����-���������������I��� ���� �-���
���2���/�����-����==�����==:����������'�������-���,/����'���(���� ��H����3��$��������
+(�������-�(���)��������(����'����������(�I���'�����'�,/�����((�����(��-��������2���
��(���������'�,/�/���������������'/���/���������-������$��=�����-��E��������2����$���
�� ��������(��'�'�H0�,������;�BI���
�
/����� �������� � � �����������
� :
�
����(�$�2������/���������������������'���(���� ������2����-�����$�$����-����2���������
$��-���'��,���'�������'������$���'�,/�����(������L�����������'�����$$��������������������������'��(�$�2������/���������,���2�'�'--����(��������2���'���,��������$��-���'�
��� �(����-(�����$�2'�'�,/�����*�����������������/����'�H*��I�
H���$7LL�����-�� L�C������L�'�C����I���'�����&�������*����� ��(��� ��(/�H&*�I�
H���$�7LL����(�� 2L�,���/L$�,�(����L���;���';-�(�,�L�'�C�����I��0��������(��������
���'���,����$$�����������������'���(����-/�����(����������'�2��$�'�H����������&���'���
��������������'��4�����/��4���(���*�������*���/��#�$������C��,�� ���������)��������'���)���
6�����'���$����1���'�������I���'�2��$� �H���������$���($��� �(������I��
�
&(����;����� ������'���������(����-���/�'��(�,�'�����������'(�����������������'���
���'/������ �-(��(��-���$���'�����'��2�������/�������'������������;2������P=�=@������
������'����� �-(��������'����������� �������������'���'�2��$�����'������-��������2����
$�$���������������(���� ��������3����$����4�'��!�=�H����*���������&��/��)&I�����
���'���'�������'�� ���'�����/�����'��(��-��3C(���H�(��-��&�$����'��'����I���$���
����- ������
�
RESULTS
$�� �� ���� ����� ��� �
0���'��������C���(��'�-�������&�"���'��(��'�'�������$�$���� ����'�-���!:�(�������
H.�,�(�%��������,������I�������C��� ���������-�������''�����!A���,�������-���!@�
(���������(����2��$���($���'������������3J����������������C(��'�'�-�������/���
,�(�����������,����/�-���'������������E����/��������'�-�����3J���H�A���,������I�H����
� A
�
����������LA�'�2�����-��������C$�(��'��������I��������,����/��$��'�'�����������'����,���
�������'����������2���,�����'��(��'�'�H� �����,������I���,�(�����������,����/�''����
��,���'����-�������� ��H�����,������I��0���-����'�������(�$���'�-�,���2�����-���
(���������,���� �'����,����������������-���/��������������'/�H0�,������;�BI��"�����������
���'/�/�������������,���-�(���������������,����-�����&�"���,���� �'����'--���'� �����/��
����!!�(���������,���� �'�������==���!?����==!��������==@���'���/��<�(�������
��,���� �'�������==:��0����2��� �����,���-������������/$�'�$����==�===����,������$���
�� ��������/�����-��(�����'�-���!�@����������������(����� ����A��?�������+(������� ���
%��2���������2��� �����,���-������������/$�'�$����==�===����,������,/�����(�������
'�(�����'�2�������/������-���<������==������<����==:���
�
����� ��2���������������,���-����2��������,���2�'����������� ������2����0���� �����
���,���-����2����H�Q<�I�������$���'�-����:�(�������������3��$������ ���)����
����(��H����1���'����������'�&���'�I���$���'�����-���������2����H�Q��I��*������+(�����
�� ������(���������,����'�'����������$��'�H�==��G��==:I���'�!��'--���������2���������
��$���'���0�����(���������$���'�'����-��������-�(����� ���((���� �-��:!�'--������
���2��������$�����$��� �'--���������2������'�'--������$��(���� �����������������(�����'�
����������� ���,�����$���'������/�������������,���-�'--���������2���F�@<�H� ���(������I�
��'�@?�H-2��(������I�����$�(�2��/��
�
������ ������������� ����� ��� ����������������� -������������������� �����
���,���2�'����������(������(/�������(�����2�����������$���'�,/�����(�������2���'�,���
,/���(�;�� ����'�'�2��$�������������*�� �������������$�(�������'�$��(���� ������2����
� <
�
��$���'�,/�'�2��$�'�(�������������'�-���/�(�������F���������(��'���,���/������/����
2���,��/���,����$�(�������'�$��(���� ��-����2��������,���2�'���'�2��$� �(���������
�������-���������(����/���$���'����2���������$�$�������$���'�,/���(��(����/�
�����$����'�,/��� ������� ��������������'�������������$�������2����5������'��2���/�����
H� ���������'�!I��*����-���� ����$��$�$�����������������'��������(����/�'�2��$�����
��2���� ��$� ���������$���($��� �(����������'�2��$� ���'�'�2��$�'�(��������0���'��
2�������/����������$����'��� ���'��������� �'--����(���������$�$��������'����� �����
�2������'� ��$��H� ����?I���
�
���'� �� ���������������������
*�������� ��������C(�$���-�����+(�������'�)��������(���� �������3�����'����'����
0/$������������'������������(������'���(�'�����(�������2�������$�(�2��/��*��
)��������(����'�����+(������� ������0/$�������������������(�������2�����$���'�
��'����3�����'������������(�'�����(�������2����H0�,���?���'�@I���
�
4�,���/�����2������$�$����-�������������2��������'�(�����'�2��������������3�����'��
'�(����� �-���??��R���?��@R���'����0/$�������'�(����� �-����A�<R����@�=R�H� ����
�I��0�����������/�'�������� �-(����'�(����� �����'�H$P=�=�I�������$�$����-����
3�����'����'�2��$� �(���������'�����;� �-(����'�(����� �����'�H$Q=��BI�������
$�$����-����0/$���������'�2��$�'�(�������H� ����?I����������������������'��'--���'�
,��������� �����'�(�������H� ��������'�!I��0���������$�$�����-����3�����'��$�������'�
��� �-(�����(����� �����'����-�(��H$Q=�=�I���'�+(�����H$Q=�=?I���'�����;� �-(����
�(����� �����'���)��������(��H$Q=��!I��%��2��������$�$�����$�������'���;� �-(����
'�(����� �����'���������'����������(����'�����������/�(���������3��$��H� �����I�����
� �=
�
0/$��������(�����'������������(���,���'�(�����'�������������� �����C(�$������H� ����
!I��%��2��������-��������� ��������'�������������(���/�� �-(�����
�
0���(��� ������������E����/�'���,���'�,�������(����������������������� ���0���������
�(������-����3�����'�����-�(������'���������9���(������-��������2�����0�������'�����
'�(������-����0/$�����������'�������'�(������-��������2�����&������H0�,����I��
������/�����'�(������-����3�����'������������'�����'�(���������#�$�����'������H0�,���
�I�����3�����'���(�����'���������(�������-����������(���,���'�(�����'���-���H0�,���BI��
�
���������
����(������������$�$����-����0/$���������� ���,� �����,��,���2�'����==!����(���==!��
����2������$�$����-����0/$�������(�����'�-���=�:R������R�H� �����I��0����(����������
,���2�'���,���'�2��$�'���'�'�2��$� �(��������'��� ��������'�'�$��'�H� ����?I���
�
*������+(������� ������0/$����������� ��������(�������2�����$���'�������&�"�-���
)���6�����'�H0�,���@I������������2�������,���2�'�������)��������(����� ��H0�,���?I��*��
�����-�(����� ������0/$�����������'��������--�������(�������2����*������ �������0/$��
'�(�����'�-���:�AR���?�<R�H0�,����I��+������(�����/������$�$����-����0/$���(�����'�
-���?�AR����B��R���&��������'�����-������$���'���0�������� ������$��@����==:�
H0�,����I���
�
����(�����������������C(�$���-�&�����(���.��� ��/���'�1�� ��/����������������(���
�� ����$���'����0/$����� ������$��@�����(�������2�����������/��*��"��5����'�&�����
����$�$����$�������'�'�(����� �����'��H$Q=�=:���'�$P=�=�����$�(�2��/I�������������
� ��
�
�(����� �����'�������$���'���&��,��H$P=�=�I�H0�,���BI��*������������� ������0/$������
����!�'�����(�������2�����$���'�,/�������$�,�(�-������H!�'I���'���������(����
���2�����$���'�,/�����/�����'�����.��$$����H0�,����I��*������3��$������ ������0/$������
�� �����������'���/��������!@�������(�������2���H������������I���
�
! �������� ������������������������
*���''��������3�����'����'����0/$������F���������*�-���������������� �����
���2������$���'�-��������� ���H0�,�����;�BI��4�,���/������2������$�$����-����*�-�����
�(�����'�2�������/������-�����@R������R��%��2�����������(���/�� �-(�����(����� �����'�
����'���(��'�H$Q=�:BI�H� �����I��0����(��������������/����(���'���������'�2��$�'�
�� ���H� ����?I��0������2������������'��������--�������(�������2���������3��$����
�� ��H0�,���!�,I��
�
���������� �������-��E�����/�,���2�'���������'����������(�������� ���� ������$�
����������(�������2�����0������2����������������'���2�������3��$����'��!�����)����
����(��H0�,����!���'�?I��+2�����������$�$����-��������2����(�����'�-���=�AR�����@R�
,��������==����'��==:��0����(����������,���2�'���,���'�2��$���'�'�2��$� �(��������
��'������((�������'�,��������==@���'��==:�H� ����?I��
�
���� ���'�(������������2������$�$����2�������H��@R;��!RI����������-����������
%�'��,�� �H� �����I��0������2�����������(������� �'�2��$�'�(�������H� ����?I��
��������%�'��,�� ������'�-�������)��������(�F������-��E���(���������������3��$��
H<��I���'����������(��H�<��I�H0�,����!��?���'�BI���
�
� ��
�
�������� �(���������/���$���'���� ������$����2�����������3��$����'�����+(�����
�� ����%��2�������������� ������ �(���-������$�������'���� ��$�$����-�����
��������������'����������� ���H0�,������!���'�@I��0���2������$�$����-��������2���
�����(�����'�2�������/�����H� �����I���'����(���==@������(����������,������������ �
'�2��$�'�(�����������$�$������'�(��������$���'�,/�'�2��$� �(�������H� ����?I���
�
% ��-��E���(���-���������0��$���������������3��$����'�)��������(��H0�,���!���'�
?I���''�����/����������)��$�������(��������/�,������$���'���� ������$��C����2����
,/�����)��������(����3��$�������'����������(����� ����)�2���������F�����2������
$�$����-����)��$������(���(����� ������������/�����-��������'/��'�(�����'�-���@�=R�
���==@�����/����R����==:�H� �����I����������+�����,�� �������/�,���2�'���)����
��'����������(�����'�������$���'��������=�����'��@�������(�������2�������$�(�2��/�
H0�,���?���'�BI���
�
��������%�'�����'�������������2'���������$���'�,/������������� ����%��2�������
-��E���(���2���'�(��'���,�/�����%�'�������,���2�'���� ������$����������2������3��$���
,��������������������-��E���(������������ ����*�� �����������������C(�$���-����� ���
'�(���������==@������2������$�$����-����%�'���������'������2��/�(����������� ��������
���2�/�$��'�H� �����I�������/��������������2'����������(������)���;���'������
����(�������������������$������������$��'��������+(�������'�)��������(���"���
���2����$�������'����������$�$����������'��2������F��(���������,������2���������
,���2�'����==!���'��==@F��������(������������-����'�,/���'�(���������==:�H� �����I��
��
DISCUSSION�
� �!
�
0������'/���,���'�����$���'�'����-�����-����(����,���������!:�(��������0�����/�
��$���������,����=R�-������%+����,��������������$�������-�(����������� � ��$�(���
�� ���������$�������'�,/�������'����,���-�(�����������,���2�����������'��������,��'�
��� ����'�-���--(����E����/���'��(�,�� �,�������'���������������2���'���,�����
��
$�� �� ���� ����� ���� �
���&�����������/����"��������&������4�����/���'�����������������'����������2���,���
������&�"�����������(�������������2���(��'�'�����������'����-�������������������������
E����/�����'��'��������'�-�����3J����*����������'����-���������(������������(��'�'���
,������,������(2��� ��-�(��������������� ���H0�,����;�BI���������(���������������'����
��,����'�,/��������������-����(����,����/�� ��������(��'��'����(���(��'�-��������
�����������(����/�����/������2��,����$���($��� �������3J���$� �������&���E�����/��
����2��'�/�-�������'���������������/�������,������C$�(��'���,��� ���,���'���������������'�
E����/�-��������������-����(����,��������*�� ������������� �� ���'����2������� ��������
$�������'�,/�4�������������H�==BI�,���'�����;����(��'�'�����2���,���������&�"�,��������===�
��'��==���������,����� ����������������'����-����������'/���,����'�,/���,������������
$��-���������,2������E����/�����'��'��������'�-�����3J����0���,���2������ ����������
������9��/�-�����������'����������&�"�(��'�,���� ��'�'����2��'���'������-���,���(��'�'�
��-����������/���-�� �� ���'�'�����%��2�����������3J�����������-��'2'������,�����������
(�-'����������� ������������-�����&�"�'����(����������������2��'�/�-�'����$�2'�'�,/���
�� ������(���0����-����(��������'�,�����������������$���� ���������-���'��(��(�$������
,��������� ���(����������$�(���/���������������� � ��$�(���/�'���(����'���2���������
���� �����2��������'����
�
� �?
�
���,���2�'���'�(����� ����,���-��������,�� �����/$�'�����'��������-�������-��(�����
����� �,���'�(������������((�����(��-����������$$����� �,���'�(���������������-��'��
�2���,���-�����������-�$�,�(��������(������-�����(���������$��� �������&�"��0���&�"�
����'�� ��'���,�������-;�$'��� �'���,��������������'�� ����'����,�����������$��,���-��
$$����� �����'���,�����%��2����������,�����-�'����������&�"���2������/���'������������
�������/��������(���/������-����'�������((������������'�� ����'����,�����������
��$��������2�����2�������$�����
�
0�����������,���-������������/$�'��������/�����(�2����'��������('��(��H�����������,���
-������������/$�'�$����==�===����,������$���/���I���� 2����,������(�$�����-�����
���,����,�������(��������0������������/�$����������������/��������('��(����������/�
'--���,�������(������������$$������/�����('��(�������-�������������������/�,��'���
�� � ��$�(����(�����������(;�(��(�-�(�����;(����/���(����������$$�����S���((����
����'(���(���F�����'��((��������,����/������ F���������/�����('��(��-�����������
������(��������*��(����������� ���('��(����������/�,��'����������������,����������$�(-(�
/����������$��'��0���&�"�'������ �����������-�������������$��������2�����,���'����
-��������(��������0����('��(����(������/������-����(�'�,/��(�2�����2�����(��
$� ������������������$��(������2�����(��������%��2�������,���2����������2��������
�--�(������������� �-��������2��������� ��������'������(�$����'�-�������$��������2�����$���
-�����$$�������"���'������'�������(��'����'���-/���$���(�����(����/���(������
$��-��� ���,����������� �-����������������������
�
0������������9��'--����(������ ���������(����/������'����2����,��������� ���,���
-�����'--����(���,�������(����������������������� ���*���''�������,���2�'���9��
� �@
�
'--����(���,�������(���������'��� ��������2����'���(��'�,/�/������'����,���2�������
��2�����$����������� �����2���-����(�'�������'--����(����*��'�2��$�'�(������������
$�'�(���-�-'������������������'�����������(�����$�(���L�,���'����'�����$�'�(���
�/����������-�����--�(�2����'�� ���(�����*���''��������$�'�(�����(��(����/�������
-���� ��/�(������5�'������ �-�(������0��������� �����$�������-���$���'�-����������
������������/$���������� �����,���-����'����'�-�(�����������'���������'�,/��������
3�����'��$��'��(����� �����������������(���--�(��'�,���'�2��$�'���'�'�2��$� �
(��������*��'�2��$� �(������������$�'�(����(������������/���������2���*���''����
'�2��$� �(�����������$(����� ����/$(���/���������2��(�$����'����������(�����������
(�����'��(���/��0����(���/�$�'�(�'�-'���/����,���� �������'2����/�-������(����/�
��$���'����2������
�
���'� �� ���������������������
&��������������������'��F����'������2����'���������3�����'���-����'�,/����0/$�������
�������������-��E�����/������'����2����-�������������'�'���0�������'���������,���2�'�
��������(���'��(�,� ���;����(��'�'����-�������&�"����===����==��H4������� ������==BI��
*�������� �/��'��$�������-��(�������,�������(����������,���2�'��� �,���'�(������������
$�$����-����3�����'����'����0/$��������*���������������/���'������������������������
�������'����,��� �,�������'��,������ ����'(���������������������2�������� �,����(��������
'�(����� ��0���'�(������(��'�,���C$����'�,/������������-(������'�'����������$���(�����
���2������'��������'�(���-��$�(-(������ ���'�(�����$� ��������
�
��������
� �B

�
+2�����������$�$����-����0/$�������(����� �'��� ��������'/�$��'��������������,/�-���
��������(����/���$���'�-������/$�'������2������'�$���������� ������$��=�����
(�������2����������������-������� �����(��'� �,���'�2��$� ���'�'�2��$�'�
(��������%��2�����$�(-(�(���������'��� ����������,����(�������--�(��'�,/��������2���
������������*����'��(�(��������0/$�'�-�2������/$(���/����(���'�����$�;��������
H �����'�� ������==?IF���'�2��$�'�(������������(�����-��/$�'�((��������2�������������� �
-���'�2��$� �(�������H����,�� �� ������==?I������������$'��� /�-��/$�'�2�����,/�
'�2��$�������������������'������ �����������������������'����(������������������'�$��2�����
���������-������/$�'�������������,���'�2��$�'���'�'�2��$� �(���������
�
! �������� ������������������������
��-������2����$��'���������'�'�����(�����,���2����(����'�����/�,/�(������������ �-�
$�'�(�������������������������'�����'����2����*���������$��,�����������������/$������
����������($��-�������'����,�����2�����$�,�(�������$$�������,���2������������2����
-�������'��$�������������C��$��������(������,�����������1���'������������(����'�,/����
����$������(��� ����'�-����$���'�9���$����$�$$����-�����C(�H&�������-���������
&�������'�.��2�����H&�&II��*���==?����2�����(���������3��$����'�,���2�'����� ����
��,�����(����'�,/����0��$�������(��������(��� ���� �-������$�'�(�����*���/�H)/ T�'�
� ������==AI�������-�����(�������'�����2��'���-�'��'��� ����,���.�43�$��������-����
�(����5�� ���'�-���$����������������������1���'����������'�0�����'���'�(�(���������
� ���� �-���0�����'�H��������$�� ������==:I��������/��'���(���(�����-���������������
-��'���� �0���$���������'�������$�����������������/�-����2�����0�����'�H%��'������
� ������==AI�����(������,����'����-�����������������$$�����������'����'������������
���2���$��/�����9����������������������-���������H%��'�� �����==:I��*�����������/������
� �:
�
��������3�����'����'����0/$������'�(�����'�'��� �����,���2������$��'�������,���-�
��������2������(��������0/$������*�-��������'���� �(����(�������������2���$����(���0���
(��'��'(�������������-�����(��������������������� ��������3�����'����'����0/$�������
��������E����/��--(����� �������������2�������������������(�����(���(����������2���-��
���������2������2��,�(����(����� �/��$������H�� ����(�2�������-'��������$�(����
��'���-���;��� ��'����(�������I��0����-���������/���2����'�2��$���'��$��������2���
(����������� ���-�����������2�����0�'���������������(�������'����(��(�����$� �������
����'�,�������'���������������'�������������$�(��-�����$� ���������$��(�������������
(����� ����'�-������������ ������'� �,�������� ��
�
)� ��������� ��
0���'����$�������'����������'/�������-���������$��������,���� ��� �,�������� �,���'���
E����/�������'�'����-�����((�����(��-����������-�(��������������0�����'����$�2'��
�(�,� ������'��$'��� ������������E����������'������'������$'��� /�-�
�����������'�'������������0'�/����������������'�����-��� �,���2��� �F���������
�(�����'����'��-�-'���2���(���������������(�����'����2�����'�������� ����F��-�(����
'������������ ���(�-��'������� ���(����/��0���'����$�������'����������'/���2��������
(�$��C�/�-� �,����$'��� /��$���(�����/����-��E���(/���'�((�����(��(��� ��2���������
(���������'��� ����)�2������������$'��� ������/� ���2����,��������' ��-����,�����
'���(�����'��/$������ ���������� ��'� ������ ��-������-�(����,/����� ���(��
���2����$��'����������(���� ����0����-������� ������'������2��� ��������
�$�(-(�(����/�����(��$���������2�����2����'�����������(������-'����(��� �������0���
'����(��'��������2����������-������(�� ���� ��� �����2��������'���������,��'���-�
�����������(����'�,/��$�(-(����2�����0���'������2�������������'�2��$� ��� �����/�
� �A

�
���,������(�����-������������� � ����2������(��$�������/�(��'�,��(��(���-�� �,���
-'���-��/��0�����/���E����-'���-��/��������������������2���(�������$������� �
����2�������'�(�����$� ��������������2���-��$�(-(�$��'��������������
����/$���0���(��'�-�������(��,������� ���'��(�����'�(����������-��E���(/�-����0/$������
�$�(-(��� ����� ��������*�-��������'�'�����2'�������$��'��(����2�����(��������
3�����'���������������������(�����/�����(��� ��-'���'�2�������/�������������$��'�
�''�����'����������&�"����(��(��'���2�������� ���,����������������������'�����'--������
�����2���-����������������2������
�
CONCLUSION
0�����(���-��������'/��������� ��'--����(���-������$��=�����(����/������'����2����
,��������� ���,����������'--����(���,������������$��@�����(����/������'����2����
,�������(����������������������� ���)�2�������������-������2������������-��E����������
�����������/�-������� �����'�(��������+���-�'� ��� �� �������(�$��C�/�-����� �,���
�$'��� /�-�����������'������� �������'���'��$����(��-���$�2� ������ �'����
-���������2����-�� ������$'��� (��$����(�����'������2'�������$��'��(���(�����
�����(����'�,/����3�����'�����������'2���(���-���/������ ����� �,�����2���-�����
���2�������(��������*�-���������%�'�������)��$������� �(�����'����� ����*���''��������'����
������'�(����� ����'��(/�����������'�����/$��������(��������(��'�'��������'/��0�������
,������������'�������������'�������,�/$��'����,����'�-����������������(����;�����-�
��,����/�,���'����2�����(���/������-����������������(��� ����,�����������������
�����(��(���(�����$��������(�������������,���-����$������,����'�-��(���������'�����/$� ��
����������������������-�E����/�����'����'���������/���$��� �-�'����������������2�����(��
���������0����--�(��-���� �E����/�������'�'�����,���'�������3J���$���($������2����'���
� �<
�
,�������,��������(����'���� �� �� ���'�'������(���������'����� ���� �-����� ���
����������0���'����$�������'����������'/�(��'� �'������'�2��$�����-��� ������'����2���
�$�(-(�����2�������'�(�����$� ������������(����� ��-'���'�2�������/������������
�$��'�����'�����������@�����(����/������'������������2����������&�"��)�;������
'���������������������&�"������'������������$$�������'�����������(��(���'�����(������$���
'���-/��$�����������2�����'����$��������� ��������$��2�������'�(���������������
�
ACKNOWLEDGEMENTS
0�������������$$���'�,/��������'�%������+� ��5����4�,����',����*�-�(����
)������H���������L�������2I���'�������,�����
�
� �=
�
REFERENCES
��������$�����%������%��+�����*���U�������4��*������������$���'�-�,��H&�V;�I;��'���'�
(�$����$����������(��������������������������������(�����2���%�'��,�� �������
������ �-��������$������-���,���,/���������-���&���'�������(�,�� �����
&����������==?F�?A7��<�B;:�
�
��������$�����%��'�����������(�����#��4�/����0����������(�������.����������*�����������
�$���'�-�����'�� ;������������������(����5�� ���'���-'�$�'�(����3��� �*�-�(�����
13(5):726-31�W�
%��'�0�������� �������������$�����0�������,����-��������-�(������������(�,���
�������������������,�(��������������������(���-�������� ����',����.��� �����
�==:�����F?H!I7!�!;�B��
�
"�� ��������������.����� �� ����.���������&�������$��/������.��%��'��������������
�� �������������$����������������2����-������������'���������(�����0�����'��
�<<!G�==���3��� �*�-�(�������==?F��=7��!�GB��
�
"��'���&����������������(������/$��3�����'����'�� �7�����������$'��(�������1���'�
��������&���*�-�(�������==BF�?!�H?I7�@��;:��
�
� ��
�
&�������-���������&�������'�.��2�����H&�&I��+��,�����-���������������/$������$����
�-�(�������(���'���������$�������$�'�(������;;1���'����������==A���������,�
���������/���$���==AF�@:7�<�<;!?���
�
&/���3���.�����������,���&���#����%*��%���'��#�����'�������������������3�����'��
$�� ���/$��?��-�(��7����(�����������S��� ������(�����<AAF��7���<@G:��
�
4������3�������� �����.���(���3��"��5����)��&��������&������(����0���'���;�����
���3��������� ����#���� �����%&�����'�%������+� ��5����4�,�������;���2����,;,���'�
���2�����(����'� �,�����������'���,������===G�==���3��� �*�-�(�������==BF���7�!A�GA��
�
%��'������������/-���������#�������"����(���'�#��������������#/(��������������
���� �����������X���'���;�������������� ������� ����#���� �����%&����������$�
�����%+�4�,�������;���2�3C�������J����/��������(���/�����H3J��I�-������(�,���
���(�$�,��/������ �-������������������===�;��==:��#�&����(�,����==A�)2��<���
�
%��'������������"�� ���������������.���������&�������������(�,����������(����'����(�����
�$'��� /�-���������������-�����������-'�$�'�(�����'�$���������0�����'���'�
����������',����.��� �����==AF�@7�B=@;�<�
�
%��'�������������������&������ .�������������� ��������#�������"����/-���������
���� �����������X�������� ������� ����#���� �����%&����������$������%+�4�,���
����;���2�3C�������J����/��������(���/�����H3J��I�-������/$� �-�����������������
�===�G��==:��H*��.����I�
� ��
�
�
%������'�%������9���V��0��C��� �������������2�����(�7��� �,������2�/�-�$�,�(��������
����/$� ��3$'����*�-�(����==�F���<7��GA�
�
%��$���/�0#�����'�4&������"��.����/��������������(��-��������������������3� ���'�
��'��������3$'��� (���2��2����3$'����*�-�(����<AAF��==7��:@GA?��
�
%��$���/�0#��.�,�(;���������$�(���-����������-�(�����*�7����/�&�����/�����'�����
����������'����(�������������� -�'�H3� ���'I7�&�"*�.�,���� F��===��
�
�����)/ T�'��#U� ��������������� �'��V2������'�������*�����������2����Y-'�����#���
0����-�����*'����55��0���/�.��������(�����%��$�������0�$'�����4�� ���$$���'��.��,���
��2�����'��+��,�����-�����������0��$���*�-�(��������'���*�$���'���(��������(���
�',����.��� ������'����������$����==A��@H�I7��B@;�:!���
�
+������#��"��$����"����������������0%��"����)��0��C��� ��������������0���(��� � �
�$'��� /�-��������7�����'��������/$��������'�-����������������1���'���������
�<A:G�<<:��#�*�-�(�������==�F��A!7�:@!GB���
�
.�������������������$������� ����#���� ������Y������� �����%&���%+�4�,�������;���2�
3C�������J����/��������(���/�����H3J��I7�����$���������$�����'���$�2� �����E����/�-�
������������/$� ���'�����(�,������(�$�,��/������ ����'�'����(�,����� ��������
�==�F�A�7�!?@G!@!��
�
� �!
�
� �?
����,�� �3"��"��$����%�,���.�����$��/�����%�����������)�����#����(��������&��� ���
������5�3���0/$�'�-�2��������2�����7��������'�,����� ���'�-��$��2����Z�&���*�-�(������
�==?F�!<�H�I7��AB;<���
�
���(���&�� ���4�'���0#���� ����#�������/������������������(������&������.����������
&��0��C��� ��3��� � �*�-�(����.� �����')������� �4��$��
�')�����������-�����,��'���-��������(����'�,/����/$�'������������-�(����������
1���'���������&���*�-�(�������==?F�!A�H!I7���:;!?��
�
�����'�����������2���������%�4%���'9�9����� ������4�����9�'�&��2���������#0������
��(����-��0/$�'���'�.����/$�'���2�����#��������*�'������#�����==?F��<�7��B=:;�B�@���
���
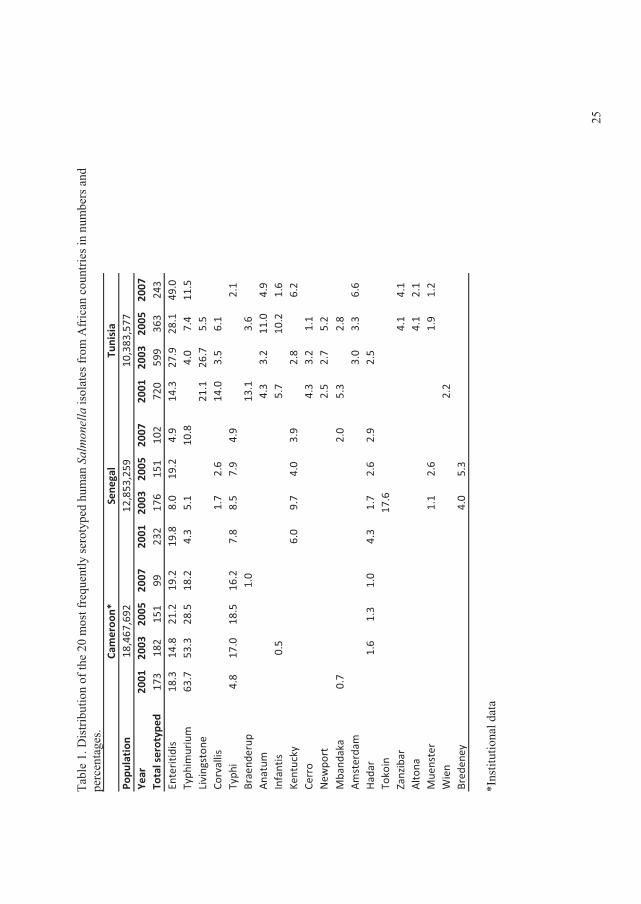
� 0�,����������,�
���-���
���=
�����-��E�
����/
�����/$�'���
�����
��
���
���������-��
��-�(���(�
����
������
�,������'
�$��(���� ����
Popu
lation
Year
2001
2003
2005
2007
2001
2003
2005
2007
2001
2003
2005
2007
Total�serotyp
ed17
318
215
199
232
176
151
102
720
599
363
243
Enteritid
is18
.314
.821
.219
.219
.88.0
19.2
4.9
14.3
27.9
28.1
49.0
Typh
imurium
63.7
53.3
28.5
18.2
4.3
5.1
10.8
4.0
7.4
11.5
Livingston
e21
.126
.75.5
Corvallis
1.7
2.6
14.0
3.5
6.1
Typh
i4.8
17.0
18.5
16.2
7.8
8.5
7.9
4.9
2.1
Braend
erup
1.0
13.1
3.6
Anatum
4.3
3.2
11.0
4.9
Infantis
0.5
5.7
10.2
1.6
Kentucky
6.0
9.7
4.0
3.9
2.8
6.2
Cerro
4.3
3.2
1.1
New
port
2.5
2.7
5.2
Mband
aka
0.7
2.0
5.3
2.8
Amsterdam
3.0
3.3
6.6
Hadar
1.6
1.3
1.0
4.3
1.7
2.6
2.9
2.5
Tokoin
17.6
Zanzibar
4.1
4.1
Alto
na4.1
2.1
Mue
nster
1.1
2.6
1.9
1.2
Wien
2.2
Bred
eney
4.0
5.3
Cameroo
n*Sene
gal
Tunisia
18,467
,692
12,853
,259
10,383
,577
�
�*����������'
����
� � ��@
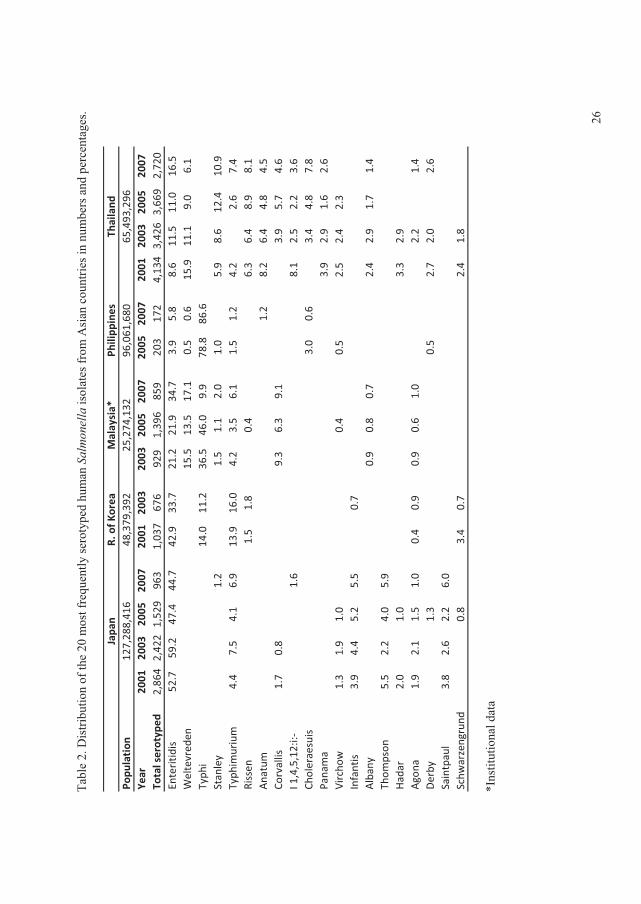
� 0�,����������,�
���-���
���=
�����-��E�
����/
�����/$�'���
�����
��
���
���������-��
������(�
����
������
�,������'
�$��(���� ����
Popu
lation
Year
2001
2003
2005
2007
2001
2003
2003
2005
2007
2005
2007
2001
2003
2005
2007
Total�serotyp
ed2,86
42,42
21,52
996
31,03
767
692
91,39
685
920
317
24,13
43,42
63,66
92,72
0Enteritid
is52
.759
.247
.444
.742
.933
.721
.221
.934
.73.9
5.8
8.6
11.5
11.0
16.5
Weltevred
en15
.513
.517
.10.5
0.6
15.9
11.1
9.0
6.1
Typh
i14
.011
.236
.546
.09.9
78.8
86.6
Stanley
1.2
1.5
1.1
2.0
1.0
5.9
8.6
12.4
10.9
Typh
imurium
4.4
7.5
4.1
6.9
13.9
16.0
4.2
3.5
6.1
1.5
1.2
4.2
2.6
7.4
Rissen
1.5
1.8
0.4
6.3
6.4
8.9
8.1
Anatum
1.2
8.2
6.4
4.8
4.5
Corvallis
1.7
0.8
9.3
6.3
9.1
3.9
5.7
4.6
I�1,4,5,12:i:�
1.6
8.1
2.5
2.2
3.6
Choleraesuis
3.0
0.6
3.4
4.8
7.8
Panama
3.9
2.9
1.6
2.6
Vircho
w1.3
1.9
1.0
0.4
0.5
2.5
2.4
2.3
Infantis
3.9
4.4
5.2
5.5
0.7
Albany
0.9
0.8
0.7
2.4
2.9
1.7
1.4
Thom
pson
5.5
2.2
4.0
5.9
Hadar
2.0
1.0
3.3
2.9
Agona
1.9
2.1
1.5
1.0
0.4
0.9
0.9
0.6
1.0
2.2
1.4
Derby
1.3
0.5
2.7
2.0
2.6
Saintpaul
3.8
2.6
2.2
6.0
Schw
arzengrund
0.8
3.4
0.7
2.4
1.8Thailand
Japa
nR.�of�K
orea
Malaysia*
Philipp
ines
127,28
8,41
648
,379
,392
25,274
,132
96,061
,680
65,493
,296
�
�*����������'
����
� ��B
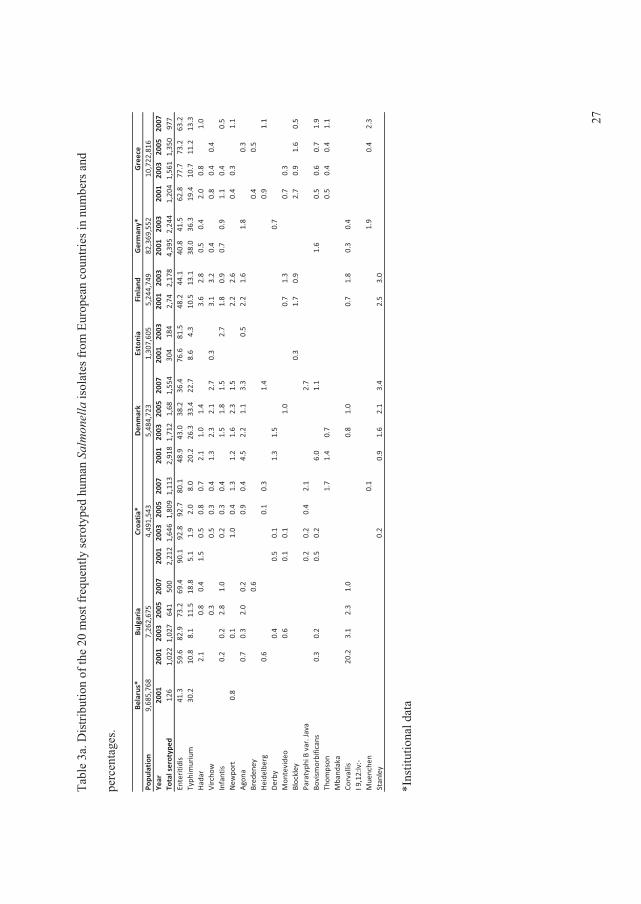
� 0�,���!����
���,�
���-���
���=
�����-��E�
����/
�����/$�'���
�����
��
���
���������-��
�3��$
����(��
������
����
,������'
�
$��(���� ����
Belarus*
Popu
lation
9,68
5,76
8Ye
ar20
0120
0120
0320
0520
0720
0120
0320
0520
0720
0120
0320
0520
0720
0120
0320
0120
0320
0120
0320
0120
0320
0520
07To
tal�serotyped
126
1,02
21,02
764
150
02,21
21,64
61,80
91,11
32,91
81,71
21,68
1,55
430
418
42,74
2,17
84,39
52,24
41,20
41,56
11,35
097
7Enteritid
is41
.359
.682
.973
.269
.490
.192
.892
.780
.148
.943
.038
.236
.476
.681
.548
.244
.140
.841
.562
.877
.773
.263
.2Typh
imurium
30.2
10.8
8.1
11.5
18.8
5.1
1.9
2.0
8.0
20.2
26.3
33.4
22.7
8.6
4.3
10.5
13.1
38.0
36.3
19.4
10.7
11.2
13.3
Hadar
2.1
0.8
0.4
1.5
0.5
0.8
0.7
2.1
1.0
1.4
3.6
2.8
0.5
0.4
2.0
0.8
1.0
Vircho
w0.3
0.5
0.3
0.4
1.3
2.3
2.1
2.7
0.3
3.1
3.2
0.4
0.8
0.4
0.4
Infantis
0.2
0.2
2.8
1.0
0.2
0.3
0.4
1.5
1.8
1.5
2.7
1.8
0.9
0.7
0.9
1.1
0.4
0.5
New
port
0.8
0.1
1.0
0.4
1.3
1.2
1.6
2.3
1.5
2.2
2.6
0.4
0.3
1.1
Agona
0.7
0.3
2.0
0.2
0.9
0.4
4.5
2.2
1.1
3.3
0.5
2.2
1.6
1.8
0.3
Bred
eney
0.6
0.4
0.5
Heide
lberg
0.6
0.1
0.3
1.4
0.9
1.1
Derby
0.4
0.5
0.1
1.3
1.5
0.7
Mon
tevide
o0.6
0.1
0.1
1.0
0.7
1.3
0.7
0.3
Blockley
0.3
1.7
0.9
2.7
0.9
1.6
0.5
Paratyph
i�B�var.�Java
0.2
0.2
0.4
2.1
2.7
Bovism
orbificans
0.3
0.2
0.5
0.2
6.0
1.1
1.6
0.5
0.6
0.7
1.9
Thom
pson
1.7
1.4
0.7
0.5
0.4
0.4
1.1
Mband
aka
Corvallis
20.2
3.1
2.3
1.0
0.8
1.0
0.7
1.8
0.3
0.4
I�9,12:lv:�
Mue
nche
n0.1
1.9
0.4
2.3
Stanley
0.2
0.9
1.6
2.1
3.4
2.5
3.0
Finlan
dGerman
y*Greece
Bulgaria
Croa
tia*
Den
mark
Estonia
7,26
2,67
54,49
1,54
35,48
4,72
31,30
7,60
55,24
4,74
982
,369
,552
10,722
,816
�
�*����������'
����
� � � � ��:
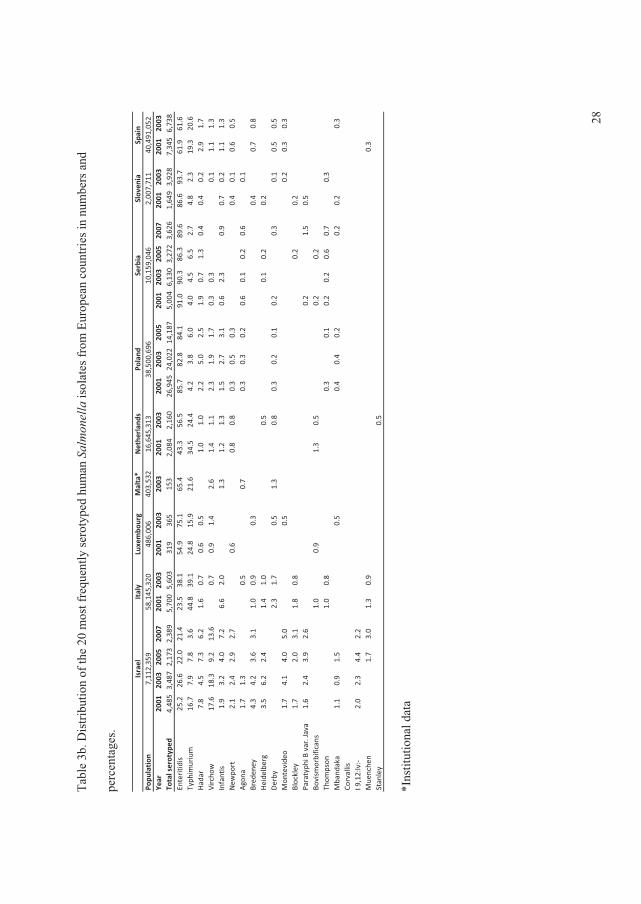
� 0�,���!,
������,�
���-���
���=
�����-��E�
����/
�����/$�'���
�����
��
���
���������-��
�3��$
����(��
������
����
,������'
�
$��(���� ����
Malta*
Popu
lation
403,53
2Ye
ar20
0120
0320
0520
0720
0120
0320
0120
0320
0320
0120
0320
0120
0320
0520
0120
0320
0520
0720
0120
0320
0120
03To
tal�serotyped
4,48
53,48
72,17
32,38
95,70
05,60
331
936
515
32,08
42,16
026
,945
24,022
14,187
5,00
46,13
03,27
23,62
61,64
93,92
87,34
56,73
8Enteritid
is25
.226
.622
.021
.423
.538
.154
.975
.165
.443
.356
.585
.782
.884
.191
.090
.386
.389
.686
.693
.761
.961
.6Typh
imurium
16.7
7.9
7.8
3.6
44.8
39.1
24.8
15.9
21.6
34.5
24.4
4.2
3.8
6.0
4.0
4.5
6.5
2.7
4.8
2.3
19.3
20.6
Hadar
7.8
4.5
7.3
6.2
1.6
0.7
0.6
0.5
1.0
1.0
2.2
5.0
2.5
1.9
0.7
1.3
0.4
0.4
0.2
2.9
1.7
Vircho
w17
.618
.39.2
13.6
0.7
0.9
1.4
2.6
1.4
1.1
2.3
1.9
1.7
0.3
0.3
0.1
1.1
1.3
Infantis
1.9
3.2
4.0
7.2
6.6
2.0
1.3
1.2
1.3
1.5
2.7
3.1
0.6
2.3
0.9
0.7
0.2
1.1
1.3
New
port
2.1
2.4
2.9
2.7
0.6
0.8
0.8
0.3
0.5
0.3
0.4
0.1
0.6
0.5
Agona
1.7
1.3
0.5
0.7
0.3
0.3
0.2
0.6
0.1
0.2
0.6
0.1
Bred
eney
4.3
4.2
3.6
3.1
1.0
0.9
0.3
0.4
0.7
0.8
Heide
lberg
3.5
6.2
2.4
1.4
1.0
0.5
0.1
0.2
0.2
Derby
2.3
1.7
0.5
1.3
0.8
0.3
0.2
0.1
0.2
0.3
0.1
0.5
0.5
Mon
tevide
o1.7
4.1
4.0
5.0
0.5
0.2
0.3
0.3
Blockley
1.7
2.0
3.1
1.8
0.8
0.2
0.2
Paratyph
i�B�var.�Java
1.6
2.4
3.9
2.6
0.2
1.5
0.5
Bovism
orbificans
1.0
0.9
1.3
0.5
0.2
0.2
Thom
pson
1.0
0.8
0.3
0.1
0.2
0.2
0.6
0.7
0.3
Mband
aka
1.1
0.9
1.5
0.5
0.4
0.4
0.2
0.2
0.2
0.3
Corvallis
I�9,12:lv:�
2.0
2.3
4.4
2.2
Mue
nche
n1.7
3.0
1.3
0.9
0.3
Stanley
0.5
Spain
Israel
Italy
Nethe
rlan
dsPo
land
Serbia
Sloven
iaLuxembo
urg
38,500
,696
10,159
,046
2,00
7,71
140
,491
,052
7,11
2,35
958
,145
,320
486,00
616
,645
,313
�
�*����������'
����
� � � � ��A
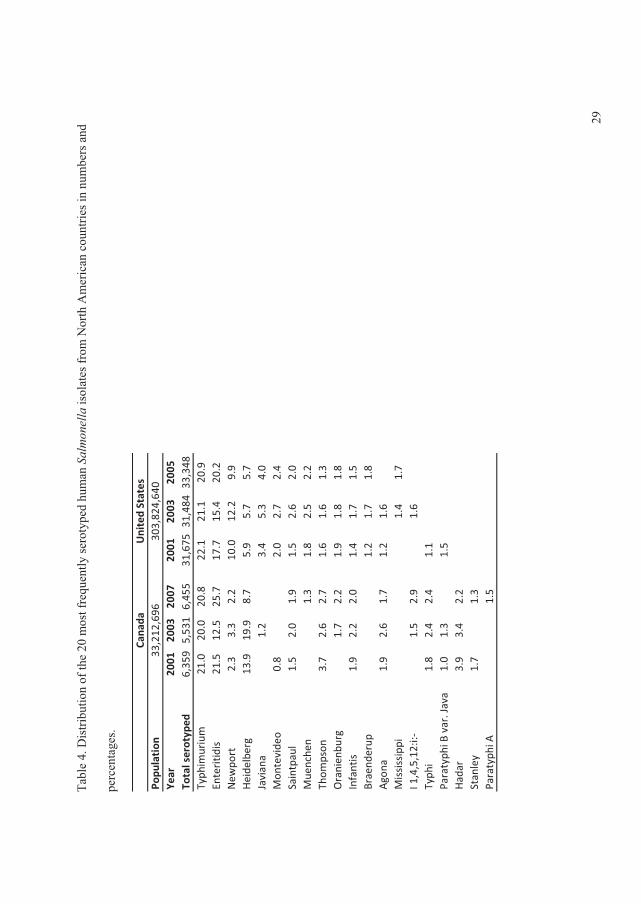
� 0�,���?������,�
���-���
���=
�����-��E�
����/
�����/$�'���
�����
��
���
���������-��
�)��������(���(�
����
������
�,������'
�
$��(���� ����
Popu
lation
Year
2001
2003
2007
2001
2003
2005
Total�serotyped
6,35
95,53
16,45
531
,675
31,484
33,348
Typh
imurium
21.0
20.0
20.8
22.1
21.1
20.9
Enteritid
is21
.512
.525
.717
.715
.420
.2New
port
2.3
3.3
2.2
10.0
12.2
9.9
Heide
lberg
13.9
19.9
8.7
5.9
5.7
5.7
Javiana
1.2
3.4
5.3
4.0
Mon
tevide
o0.8
2.0
2.7
2.4
Saintpaul
1.5
2.0
1.9
1.5
2.6
2.0
Mue
nche
n1.3
1.8
2.5
2.2
Thom
pson
3.7
2.6
2.7
1.6
1.6
1.3
Oranienbu
rg1.7
2.2
1.9
1.8
1.8
Infantis
1.9
2.2
2.0
1.4
1.7
1.5
Braend
erup
1.2
1.7
1.8
Agona
1.9
2.6
1.7
1.2
1.6
Mississippi
1.4
1.7
I�1,4,5,12:i:�
1.5
2.9
1.6
Typh
i1.8
2.4
2.4
1.1
Paratyph
i�B�var.�Java
1.0
1.3
1.5
Hadar
3.9
3.4
2.2
Stanley
1.7
1.3
Paratyph
i�A1.5
Cana
daUnited�States
33,212
,696
303,82
4,64
0
�
� ��<
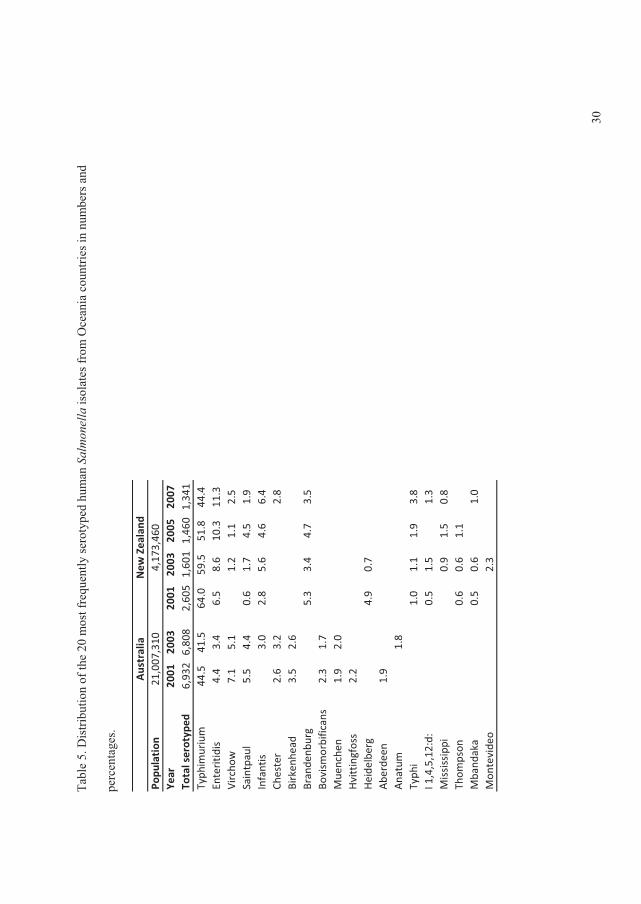
� 0�,���@������,�
���-���
���=
�����-��E�
����/
�����/$�'���
�����
��
���
���������-��
�+(�����(�
����
������
�,������'
�
$��(���� ����
Popu
lation
Year
2001
2003
2001
2003
2005
2007
Total�serotyped
6,93
26,80
82,60
51,60
11,46
01,34
1Typh
imurium
44.5
41.5
64.0
59.5
51.8
44.4
Enteritid
is4.4
3.4
6.5
8.6
10.3
11.3
Vircho
w7.1
5.1
1.2
1.1
2.5
Saintpaul
5.5
4.4
0.6
1.7
4.5
1.9
Infantis
3.0
2.8
5.6
4.6
6.4
Chester
2.6
3.2
2.8
Birken
head
3.5
2.6
Brandenb
urg
5.3
3.4
4.7
3.5
Bovism
orbificans
2.3
1.7
Mue
nche
n1.9
2.0
Hvittingfoss
2.2
Heide
lberg
4.9
0.7
Abe
rdeen
1.9
Anatum
1.8
Typh
i1.0
1.1
1.9
3.8
I�1,4,5,12:d:
0.5
1.5
1.3
Mississippi
0.9
1.5
0.8
Thom
pson
0.6
0.6
1.1
Mband
aka
0.5
0.6
1.0
Mon
tevide
o2.3
Australia
New
�Zealand
21,007
,310
4,17
3,46
0
�
� �!=
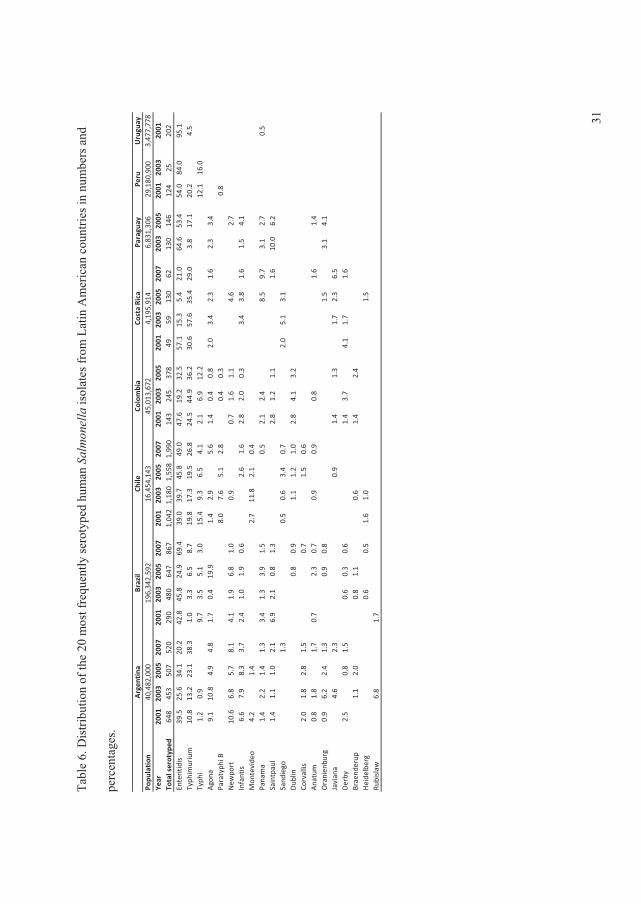
� �!�
Uruguay
Popu
lation
3,47
7,77
8Ye
ar20
0120
0320
0520
0720
0120
0320
0520
0720
0120
0320
0520
0720
0120
0320
0520
0120
0320
0520
0720
0320
0520
0120
0320
01To
tal�serotyped
648
453
507
520
290
480
647
867
1,04
21,18
01,55
81,99
014
324
537
849
5913
062
130
146
124
2520
2Enteritid
is39
.525
.634
.120
.242
.845
.824
.969
.439
.039
.745
.849
.047
.619
.232
.557
.115
.35.4
21.0
64.6
53.4
54.0
84.0
95.1
Typh
imurium
10.8
13.2
23.1
38.3
1.0
3.3
6.5
8.7
19.8
17.3
19.5
26.8
24.5
44.9
36.2
30.6
57.6
35.4
29.0
3.8
17.1
20.2
4.5
Typh
i1.2
0.9
9.7
3.5
5.1
3.0
15.4
9.3
6.5
4.1
2.1
6.9
12.2
12.1
16.0
Agona
9.1
10.8
4.9
4.8
1.7
0.4
19.9
1.4
2.9
5.6
1.4
0.4
0.8
2.0
3.4
2.3
1.6
2.3
3.4
Paratyph
i�B8.0
7.6
5.1
2.8
0.4
0.3
0.8
New
port
10.6
6.8
5.7
8.1
4.1
1.9
6.8
1.0
0.9
0.7
1.6
1.1
4.6
2.7
Infantis
6.6
7.9
8.3
3.7
2.4
1.0
1.9
0.6
2.6
1.6
2.8
2.0
0.3
3.4
3.8
1.6
1.5
4.1
Mon
tevide
o4.2
1.4
2.7
11.8
2.1
0.4
Panama
1.4
2.2
1.4
1.3
3.4
1.3
3.9
1.5
0.5
2.1
2.4
8.5
9.7
3.1
2.7
0.5
Saintpaul
1.4
1.1
1.0
2.1
6.9
2.1
0.8
1.3
2.8
1.2
1.1
1.6
10.0
6.2
Sand
iego
1.3
0.5
0.6
3.4
0.7
2.0
5.1
3.1
Dub
lin0.8
0.9
1.1
1.2
1.0
2.8
4.1
3.2
Corvallis
2.0
1.8
2.8
1.5
0.7
1.5
0.6
Anatum
0.8
1.8
1.7
0.7
2.3
0.7
0.9
0.9
0.8
1.6
1.4
Oranien
burg
0.9
6.2
2.4
1.3
0.9
0.8
1.5
3.1
4.1
Javiana
4.6
2.3
0.9
1.4
1.3
1.7
2.3
6.5
Derby
2.5
0.8
1.5
0.6
0.3
0.6
1.4
3.7
4.1
1.7
1.6
Braend
erup
1.1
2.0
0.8
1.1
0.6
1.4
2.4
Heide
lberg
0.6
0.5
1.6
1.0
1.5
Rubislaw
6.8
1.7
Paragu
ayPe
ruArgen
tina
Brazil
Chile
Colombia
Costa�Rica
29,180
,900
40,482
,000
196,34
2,59
216
,454
,143
45,013
,672
4,19
5,91
46,83
1,30
6
�
0�,���B������,�
���-���
���=
�����-��E�
����/
�����/$�'���
�����
��
���
���������-��
����������(���(�
����
������
�,������'
�
$��(���� ����
� � � � �
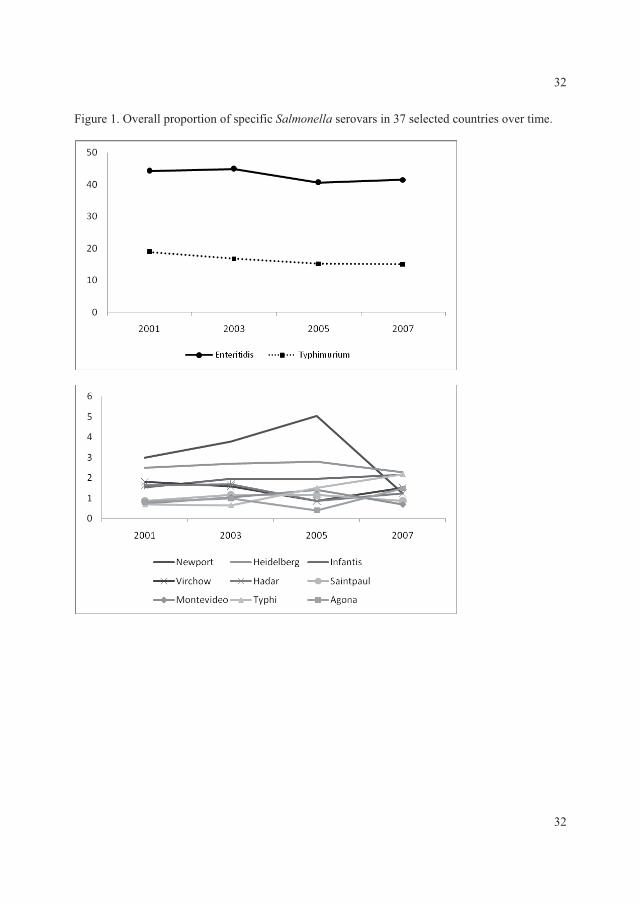
� !�
� �������+2������$�$����-��$�(-(������������2������!:�����(��'�(�������2��������
�
�
�
�
�
�
�
�
� !�
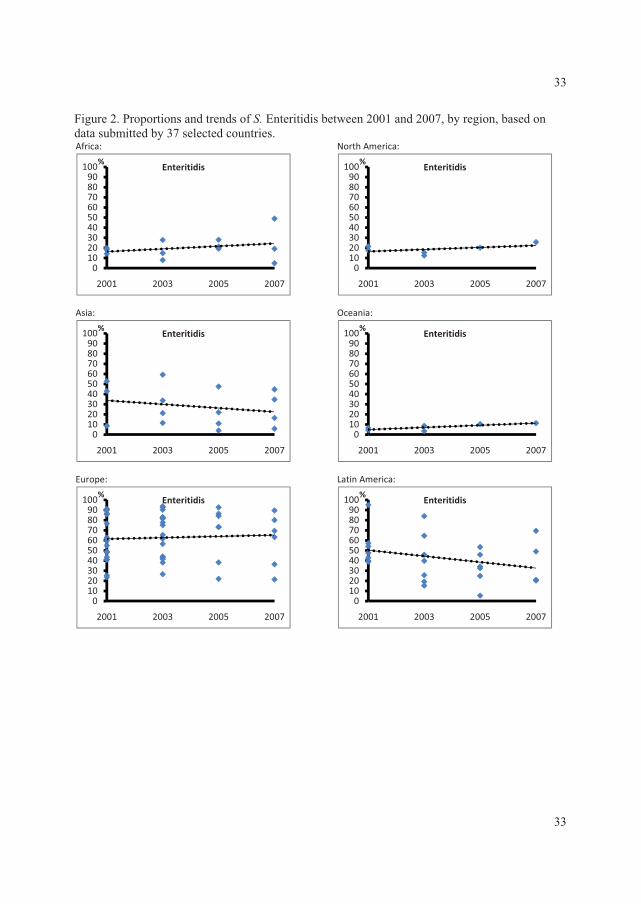
� !!
� �������.�$�������'�����'��-����3�����'��,��������==����'��==:��,/��� ���,���'���'������,����'�,/�!:�����(��'�(���������Africa:�
�
Asia:�
�
Europe:�
�
North�America:
�
Oceania:�
�
Latin�America:�
�
0102030405060708090
100
2001 2003 2005 2007
%Enteritidis
0102030405060708090
100
2001 2003 2005 2007
%Enteritidis
0102030405060708090
100
2001 2003 2005 2007
%Enteritidis
0102030405060708090
100
2001 2003 2005 2007
%Enteritidis
0102030405060708090
100
2001 2003 2005 2007
%Enteritidis
0102030405060708090
100
2001 2003 2005 2007
%Enteritidis
�����������
� !!
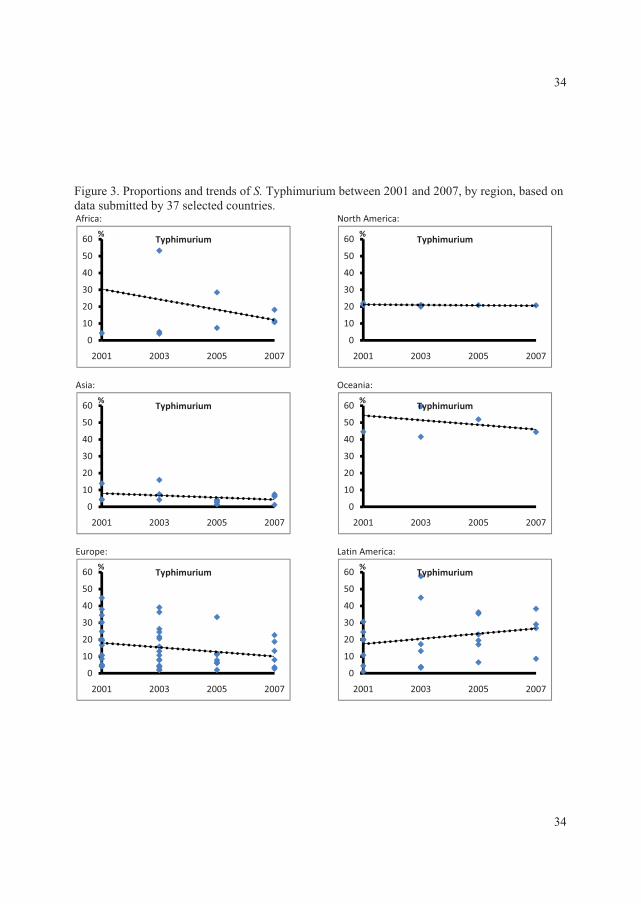
� !?
������ ����!��.�$�������'�����'��-����0/$�������,��������==����'��==:��,/��� ���,���'���'������,����'�,/�!:�����(��'�(���������Africa:�
�
Asia:�
�
Europe:�
�
North�America:
�
Oceania:�
�
Latin�America:�
�
0
10
20
30
40
50
60
2001 2003 2005 2007
%Typhimurium
0
10
20
30
40
50
60
2001 2003 2005 2007
%Typhimurium
0
10
20
30
40
50
60
2001 2003 2005 2007
%Typhimurium
0
10
20
30
40
50
60
2001 2003 2005 2007
%Typhimurium
0
10
20
30
40
50
60
2001 2003 2005 2007
%Typhimurium
0
10
20
30
40
50
60
2001 2003 2005 2007
%Typhimurium
������
� !?

�
�
!@
!@
��� ����?��0���'��-����2����,��������==����'��==:��,/�(����/�'�2��$�������������
0
10
20
30
40
50
60
70
80
2001 2003 2005 2007
S.Enteritidis
Developed
Developing
0.00
5.00
10.00
15.00
20.00
25.00
30.00
2001 2003 2005 2007
S. Typhimurium
Developed
Developing
0.00
0.50
1.00
1.50
2.00
2.50
3.00
3.50
4.00
2001 2003 2005 2007
S. Typhi
Developed
Developing
0.00
0.50
1.00
1.50
2.00
2.50
3.00
3.50
4.00
2001 2003 2005 2007
S. Infantis
Developed
Developing
0.00
0.20
0.40
0.60
0.80
1.00
1.20
1.40
1.60
1.80
2001 2003 2005 2007
S. Agona
Developed
Developing
0.00
0.50
1.00
1.50
2.00
2.50
3.00
3.50
4.00
4.50
5.00
2001 2003 2005 2007
S.Heidelberg
Developed
Developing
0.00
0.50
1.00
1.50
2.00
2.50
3.00
3.50
2001 2003 2005 2007
S. Virchow
Developed
Developing
0.00
0.50
1.00
1.50
2.00
2.50
3.00
3.50
2001 2003 2005 2007
S.Hadar
Developed
Developing
�

�
�
Article III
Antimicrobial resistance and molecular epidemiology of Salmonella Rissen from
animals, food products, and patients in Thailand and Denmark.
� �
Rene S.Hendriksen�������"�� �������������&������.�����������������.����� �� ���
%�����%��������������� !�������������������$��
���%+�&���,���� �&������-������(�,����������(�����'�,����.��� ������'�31�
&�����/���-����(����,����/�-������(�,����������(���)�������'�*���������
0�(��(���1�2����/�-����������"8���2�9��:����;�:<=�&$���� ��� ������������%+�*���������������������'�������&�������)������*��������-�%���������$��������
-���'(����(��(���������/�-�.�,�(�%�������"�� ����0�����'�!0���)������ �������/�������(����'�J������������2(���������
�
&����$�'� ������7� Rene S. Hendriksen��
� �� �)��o�����'�*���������
� �� �"8l��2�9��:����;�:<=�&$���� ��� ����������
� �� �.��e7�>?@�:��!?�B=�==�
� � � � ��C7�>?@�:��!?�B=�=��
� �� �3;�a�7����D-'�'���'�� �
�
Foodborne Pathog Dis. 2008 Oct; 5 (5): 605-19.
�
�
�
AR
TIC
LE
III

Antimicrobial Resistance and Molecular Epidemiologyof Salmonella Rissen from Animals, Food Products,
and Patients in Thailand and Denmark
Rene S. Hendriksen,1 Aroon Bangtrakulnonth,2 Chaiwat Pulsrikarn,2 Srirat Pornreongwong,2
Henrik Hasman,1 Si Wook Song,3 and Frank M. Aarestrup1
Abstract
Recently we reported increases in both the number of Salmonella infections due to Salmonella Rissen inThailand and the isolation of this serovar from pork products in Thailand. The objectives of the present studywere to determine the genetic diversity and antimicrobial resistance of Salmonella Rissen isolates recoveredfrom humans, food products, and animals in Denmark and Thailand. Additionally, risk factors due to traveland consumption of specific food products were analyzed and evaluated. A total of 112 Salmonella Rissenisolates were included in this study from Thailand andDenmark. Thai isolates were recovered from humans,uncooked food, and ready-to-eat food. Danish isolates were obtained from humans (with and without ahistory of travel to Thailand prior to the infection), Danish pig or pork products, imported pig or porkproducts, turkeys, and animal feed. A total of 63 uniqueXbaI PFGEpatternswere observed. The predominantpattern was shared by 22 strains. Limited antimicrobial resistance was observed in the Danish strains, and ahigher degree of resistance was observed in strains originating from Thailand. Virtually all isolates wereresistant to tetracycline. The tetA gene was detected in tetracycline-resistant isolates. Statistical analysis andmolecular subtyping identified the combination of travel to Thailand and consumption of imported pig orpork products as well consumption of as pig or pork products produced in Denmark as risk factors forSalmonella Rissen infection among the Danish patients. The outcome of this study might be used as a sup-plement for future Salmonella Rissen investigations and outbreak detection.
Introduction
Salmonella enterica is a common cause ofhuman gastroenteritis and bacteremia and a
wide variety of animals, particularly food ani-mals, have been identified as reservoirs for non-Typhi Salmonella (Coyle et al., 1988; Humphreyet al., 1988, 2000). Although 2587 serovars of Sal-monella enterica have been identified, most hu-man infections are caused by a limited number
of serovars. In developed countries, Salmonellaenterica serovars Typhimurium and Enteritidisare the most common causes of human salmo-nellosis, although other serovars have been re-ported to be more prevalent in specific regions(Humphrey et al., 2000; Olsen et al., 2001; Her-ikstad et al., 2002; Bangtrakulnonth et al., 2004b;Galanis et al., 2006). Shifts in prevalence of spe-cific strain types and serovars can be due tointernational travel, human migration, and a
1WHO Collaborating Centre for Antimicrobial Resistance in Foodborne Pathogens and EU Community Reference Laboratory forAntimicrobial Resistance, National Food Institute, Technical University of Denmark, Copenhagen, Denmark.
2WHO International Salmonella and Shigella Centre, National Institute of Health, Department of Medical Sciences, Ministry of PublicHealth, Bangkok, Thailand.
3The National Veterinary Research and Quarantine Service, Anyang, Korea.
FOODBORNE PATHOGENS AND DISEASEVolume 5, Number 5, 2008ª Mary Ann Liebert, Inc.DOI: 10.1089=fpd.2007.0075
605
global food and livestockmarket. Knowledge ofthe prevalence and molecular epidemiology ofdifferent serovars in specific regions may facili-tate the recognition and control of new andemerging pathogens.
We recently reported an increase in Salmonellainfections due to Salmonella enterica serovar Ris-sen in Thailand. The reported number of humanSalmonella infections due to Salmonella Rissen inThailand has increased from 54 cases in 1993 to334 in 2002. During that same time period, a 10percentage point increase (4.7% to 14.7%) in theisolation of Salmonella Rissen from specific foodproducts was also observed (Bangtrakulnonthet al., 2004b).While this serovar is rarely reportedelsewhere in the world, it is among the top threeSalmonella serovars found in pigs and porkproducts in Thailand, other Southeast Asiancountries, and Spain (Bangtrakulnonth et al.,2003, 2004a, 2005; Angkititrakul et al., 2005;Vaeteewootacharn et al., 2005; VAV, 2005; In-thavong et al., 2006; Padungtod and Kaneene,2006; Riano et al., 2006; Vo et al., 2006; Astorgaet al., 2007).
In recent years, increased antimicrobial resis-tance has been reported in several serovars ofS. enterica. However, only limited data on theprevalence of antimicrobial resistance of Salmo-nella Rissen is available. In 2005, Angkititrakulreported tetracycline, streptomycin, and sul-phonamide resistance among Salmonella Rissenisolates recovered from pork and chicken inThailand. The isolates recovered fromporkwerehowever susceptible to ciprofloxacin, gentami-cin, chloramphenicol, amoxicillin, and sulpha-methoxazoleþ trimethroprim (Angkititrakulet al., 2005). In contrast, multidrug-resistant iso-lates of Salmonella Rissen have been reportedfrom Spain. Previous studies have shown theseisolates to be resistant to ampicillin, amoxy-cillin, streptomycin, neomycin, sulphonamides,sulphanamidesþ trimethoprim, chlorampheni-col, and tetracycline (Riano et al., 2006; Astorgaet al., 2007). One study (Riano et al., 2006) alsodescribed the identification of the blaSHV-12
gene in a cefotaxime and ceftazidime resistantisolate.
Antimicrobial susceptibility profiles and mo-lecular subtyping are useful epidemiologicaltoolswhich can be used to determine the sourcesof an outbreak. To our knowledge, only one
molecular study of Salmonella Rissen has previ-ously been undertaken. In this earlier study 19Portuguese isolates of Salmonella Rissen werecharacterized bypulsed-field gel electrophoresis(PFGE). Three unique XbaI patterns were ob-served, with the predominant pattern beingshared by 17 isolates (Vieira-Pinto et al., 2006).The objectives of the present study were to
determine the genetic diversity and antimicro-bial resistance of Salmonella Rissen isolates re-covered from humans, food products, andanimals in Denmark and Thailand.Microbiological findingswere correlatedwith
epidemiological data, and risk factors for infec-tion with Salmonella Rissen were calculated.The outcome of this study might be used as a
supplement for future Salmonella Rissen inves-tigations and outbreak detection.
Methods
Bacterial isolates
The WHO National Salmonella and ShigellaCentre in Bangkok receives all presumptivepositive Salmonella isolates from all diagnosticlaboratories throughout Thailand. In 2004, 300isolates were identified as SalmonellaRissen. Theisolates originated from 9 of 12 districts andBangkok.In addition to human isolates, The WHO Na-
tional Salmonella and Shigella Centre also re-ceives isolates recovered from food products. In2004, the centre received 295 isolates, originatingfrom various food sources. The majority of theisolates originated from pork products. Thesesamples were further characterized as ‘‘rawfood’’ (n¼ 128) or ‘‘ready-to-eat food’’ (n¼ 92).The raw food isolates were submitted from dis-tricts 1, 3, and 4 and Bangkok over a 1-year pe-riod, excluding the months of February to Apriland October to December. The isolates origi-nating from ready-to-eat food were collectedover a 9-month period (April–December) fromdistricts 1 and 10 and Bangkok.The 23 human isolates from Denmark were
collected between 2000 and 2005 by theNationalReference Laboratory for EnteropathogenicBacteria, Statens Serum Institut (SSI) in Den-mark. These isolates were recovered from pa-tients suffering from gastrointestinal infectionscaused by Salmonella Rissen. Four cases were
606 HENDRIKSEN ET AL.
acquired in Denmark. Six patients had traveledto Thailand prior to becoming ill. Travel historywas unavailable for the remaining 13 cases. Anadditional 155 isolates were identified by theNational Food Institute,Copenhagen,Denmark.These isolates were obtained from pig or porkproducts of Danish origin (n¼ 61), imported pigor pork products (n¼ 19), turkey (n¼ 19), andanimal feed (n¼ 24). The remaining 32 isolateswere either from an unknown source or origi-nated from caged birds, chickens, the environ-ment, horses, cattle, or bone meal. All isolateswere collected between 1996 and 2005.
The isolates were initially identified as Sal-monella spp. according to internationally recog-nized procedures. Isolates were then serotypedusing slide agglutination in the countryof origin.
Selection of isolates
Usingastratifiedrandomsampling technique,33 of the 300 human isolates fromThailandwereselected for additional characterization. Isolateswere from both male and female patients resid-ing in districts 1, 4, 5, 7, 8, and 12 and Bangkok.Patients ranged in age from 1 to 42 years. A re-view of the sample collection date was used toinsure that the isolateswere representative of thestudy period. The isolates from the raw food andready-to-eat food were selected from the sametime period as the Thai human isolates. Themajority of the food isolates were recovered inMay and June.
Thirteen of the 128 raw food isolates were se-lected for additional characterization. The se-lected isolates were from districts 1, 3, and 4 andBangkok. Ten of the ninety-two isolates fromready-to-eat food were selected for additionalcharacterization. The selected isolateswere fromdistrict 1 and Bangkok.
All 23 human isolates from Denmark wereincluded in the study. A stratified randomsampling technique was used to select isolatesfrom the NFI collection for additional charac-terization.
Isolates selected for additional characteriza-tion were obtained from: Danish pigs and porkproducts collectedbetween2002 to 2005 (n¼ 10);imported pig or pork products (Spanish originn¼ 5, German origin n¼ 1, unknown originn¼ 3) submitted to Danish import control au-
thorities between 2002 and 2005 (n¼ 9); turkeycollected between 2000 and 2002 (n¼ 6); andanimal feed collected between 2001 and 2005(n¼ 8).
Risk factors
SAS version 9.1.3 (SAS Institute Inc., Cary,NC) was used to calculate the relative risk usinga Fisher’s Exact test. The risk of disease for con-sumption of imported pork from Spain and therisk factor of travel to Thailand among theDanish patients infected with Salmonella Rissenwere evaluated.
Serotyping
O and H antigens were characterized byagglutination with hyperimmune sera and sero-type was assigned according to the Kauffmann–White scheme (Popoff and Le Minor, 2001).
Antimicrobial susceptibility testing
Susceptibility to antimicrobial agents wasperformed at the NFI on all selected isolates asminimum inhibitory concentration determina-tions using a commercially prepared, dehy-dratedpanel (Sensititre�) fromTREKDiagnosticSystems Ltd. (East Grinstead, England).The following antimicrobials and resistance
cut-off values or breakpoint were used in thestudy: ampicillin, AMP (R> 4 mg=mL); amoxi-cillinþ clavulanic acid, AUG (R> 4 mg=mL);apramycin, APR (R> 16mg=mL); cefalothin,CEF (R> 16mg=mL); cefpodoxime, POD (R> 1mg=mL); ceftiofur, XNL (R> 2 mg=mL); chlor-amphenicol, CHL (R> 16mg=mL); cipro-floxacin, CIP (R> 0.06mg=mL); colistin COL(R> 8 mg=mL); florfenicol, FFN (R> 2 mg=mL);gentamicin, GEN (R> 2 mg=mL); nalidixic acid,NAL (R> 16mg=mL); neomycin, NEO (R> 8mg=mL); spectinomycin, SPE (R> 64 mg=mL);streptomycin, STR (R> 16 mg=mL); sulpha-methoxazole, SMX (R> 256 mg=mL); tetracy-cline, TET (R> 8 mg=mL); and trimethoprim,TMP (R> 2mg=mL).Epidemiological cut-off values were inter-
preted according to current eucast (http:==www.eucast.org) and European Food SafetyAuthority (EFSA) recommendations. Exceptionsweremade for interpretationofAPR,AUG,CEF,
CHARACTERIZATION OF SALMONELLA RISSEN 607
COL, FFN, POD, SPE, and XNL, where Clinicaland Laboratory Standards Institute (CLSI, 2002,2006a, 2006b)guidelinesandclinicalbreakpointswere utilized. NEO and STR were interpretedaccording to research conduced at NFI. Qualitycontrol using E. coliATCC 25922was conductedon a weekly basis according to CLSI.
Detection of resistance genes
Resistant and intermediate strains were fur-ther characterized through the use of a poly-merase chain reaction (PCR) assay with primersspecific for 25 antimicrobial resistance genes(Table 1).
All PCR amplifications were performed withbuffer supplied by the manufacturer, 20 pmol=mL of each primer and 0.5 U of Amplicon TaqPolymerase (Ampliqon,Copenhagen,Denmark).The final reaction volume was (50mL), The fol-lowing cycling conditions were used for all re-actions: 3minutes at 948C; 35 cycles of 1minute at948C, 1 minute at the appropriate annealingtemperature, and 1minute at 728C; 10minutes at728C. Primer names and sequences, resistancegenes, primer position, annealing temperature,control strains, amplicon sizes, and references arelisted in Table 1.
Amplicons produced by the seven CIP-resistant strains and the single blaCTX amplicongenerated,were selected for sequencing. Prior tosequencing, the amplicons were purified usingthe GFX� PCR DNA kit (Amersham Bios-ciences, Piscataway, NJ), The DNAwas shippedto Macrogen Inc. (Seoul, Korea) for sequencingusing the same primers as in the PCR analysis.Sequence analysis and alignment was per-formedusingVectonNTI suite 9 (InforMax, Inc.,Bethesda, MD) software. The resulting nucleo-tide sequences were compared to sequencesobtained from the GenBank database (http:==www.lahey.org =studies=webt.html).
Pulsed-field gel electrophoresis
The selected isolateswere analyzed for geneticrelatedness by PFGE usingXbaI according to theCenters for Disease Control and Prevention(CDC) PulseNet protocol (Ribot et al., 2002). Theelectrophoresis was performedwith a CHEFDRIII System (Bio-Rad Laboratories, Hercules,CA) by using 1% SeaKem agarose in 0.5�Tris-
borate-EDTA at 180 V. Running conditionsconsisted of 1phase from2.2 to 63.8 seconds for arun time of 22 hours.PFGE following digestion with BlnI was uti-
lized to further differentiate the 22 isolateswhich exhibited the predominant XbaI pattern(TEEX01.0017.DK). Comparison of the PFGEprofiles was performed by using Bionumericssoftware version 4.6 (Applied Maths, Sint-Martens-Latem, Belgium) and the dice correla-tion for band matching with a 1.0% positiontolerance andanoptimization at 1.0%usingbothXbaI and BlnI.
Results
Risk factors
Available travel histories suggested that sixDanish patients (5%) may have acquired theirinfection abroad and four patients (4%) mayhave obtained the infection in Denmark. All sixpatients (5%) who traveled to Thailand shared acommon PFGE pattern with a Thai isolate. Six(5%) of the remaining 17 patients (15%) did notshare a common PFGE pattern. Among theDanish patients, there did not appear to be astatistically significant connection using Fisher’sExact test ( p¼ 0.1438) between travel to Thai-land (exposure) and sharing a common PFGEprofile with a Thai source (outcome).Nine isolates (8%) included in the study
originated from imported pig or pork products.Six of these isolates (5%) shared a commonPFGE pattern with a Danish patient. Three (3%)of the ten Danish pig or pork product samples(9%) included in this study shared a commonPFGE pattern with a Danish patient. The risk ofconsuming imported pig or pork (exposure)was estimated between pork or pig and shar-ing a common PFGE profile with Danish pa-tients who had not traveled prior to the onsetof infection (outcome). No statistical signifi-cance was observed using Fisher’s Exact test( p¼ 0.3469).
Antimicrobial resistance
All eight (7%) isolates from animal feed orig-inating from Denmark were fully susceptible toall antimicrobials tested. A similarly low fre-quency of resistance was observed in six (5%)
608 HENDRIKSEN ET AL.
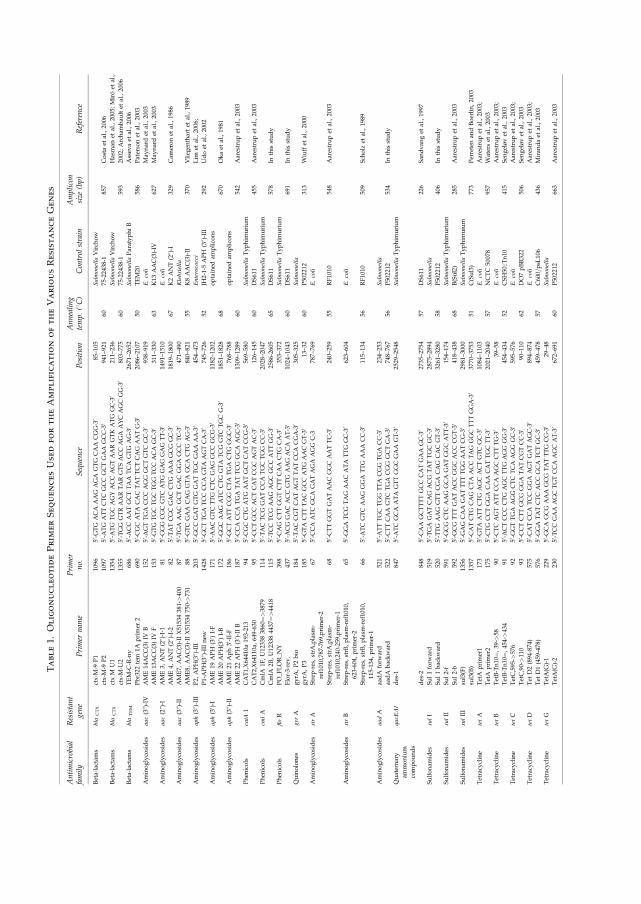
Table1.
OligonucleotidePrimerSequencesUsedfortheAmplification
oftheVariousResistanceGenes
Antimicrobial
family
Resistant
gene
Primer
nam
ePrimer
no.
Sequence
Position
Annealing
temp.(8C)
Control
strain
Amplicon
size
(bp)
Reference
Beta-lactam
sbla
CTX
ctx-M
-9P1
1096
50-G
TG
ACA
AAG
AGA
GTG
CAA
CGG-3
085–105
Salmonella
Virch
ow
ctx-M
-9P2
1097
50-A
TG
ATTCTC
GCC
GCTGAA
GCC-3
0941–921
6075-22438-1
857
Costaet
al.,2006
Beta-lactam
sbla
CTX
ctxM
U1
1354
50-A
TG
TGC
AGY
ACC
AGTAAR
GTK
ATG
GC-3
0211–236
Salmonella
Virch
ow
Hasman
etal.,2005;Miroet
al.,
ctx-M
-U2
1355
50-TGG
GTRAARTARGTSACC
AGA
AYC
AGC
GG-3
0803–775
6075-22438-1
593
2002;Archam
bau
ltet
al.,2006
Beta-lactam
sbla
TEM
TEM-C
-R-ny
686
50-A
CC
AATGCTTAA
TCA
GTG
AG-3
02671–2652
Salmonella
ParatyphiB
Assev
aet
al.,2006
Pbr322
tem
1Aprimer
2690
50-C
GC
ATA
CAC
TATTCTCAG
AATG-3
02086–2107
50TEM20
586
Patersonet
al.,2003
Aminoglycosides
aac(3@)-IV
AME14ACC(3)IV
B152
50-A
GTTGA
CCC
AGG
GCTGTC
GC-3
0938–919
E.coli
May
nardet
al.,2003
AME13ACC(3)IV
F153
50-G
TG
TGC
TGC
TGG
TCC
ACA
GC-3
0311–330
63K13
AAC(3)-IV
627
May
nardet
al.,2003
Aminoglycosides
aac(2@)-I
AME3,
ANT(2@)-I-1
8150-G
GG
CGC
GTC
ATG
GAG
GAG
TT-3
01491–1510
E.coli
AME4,
ANT(2@)-I-2
8250-TATCGC
GAC
CTG
AAA
GCG
GC-3
01819–1800
67K2ANT(2@)-I
329
Cam
eronet
al.,1986
Aminoglycosides
aac(3@)-II
AME7,
AAC(3)-II
X51534381->400
8750-TGA
AAC
GCTGAC
GGA
GCC
TC-3
0471–490
Klebsiella
AME8,
AAC(3)-II
X51534750->731
8850-G
TC
GAA
CAG
GTA
GCA
CTG
AG-3
0840–821
55K8AAC(3)-II
370
Vlieg
enthartet
al.,1989
Aminoglycosides
aph(3@)-III
P2,
APH(3@)-III
203
50-G
CC
GATGTG
GATTGC
GAA
AA-3
0454–473
Enterococci
Lim
etal.,2006;
P1-APH(3@)-IIInew
1428
50-G
CTTGA
TCC
CCA
GTA
AGTCA-3
0745–726
52JH
2-1-5APH
(3@)-III
292
Udoet
al.,2002
Aminoglycosides
aph(3
0 )-I
AME19
APH
(30 )I-F
171
50-A
AC
GTC
TTG
CTC
GAG
GCC
GCG-3
01182–1202
optained
amplicons
AME20
APH(3
0 )I-B
172
50-G
GC
AAG
ATC
CTG
GTA
TCG
GTC
TGC
G-3
01851–1828
68670
Okaet
al.,1981
Aminoglycosides
aph(3@)-II
AME21
Aph30-II-F
186
50-G
CTATTCGG
CTA
TGA
CTG
GGC-3
0768–788
optained
amplicons
AME22
APH
(30 )-IIB
187
50-C
CA
CCA
TGA
TATTCG
GCA
AGC-3
01309–1289
60542
Aarestrupet
al.,2003
Phen
icols
catA
1CAT1,X64410a
193-213
9450-C
GC
CTG
ATG
AATGCTCATCCG-3
0569–580
Salmonella
Typhim
urium
CAT2,X64110a,649-630
9550-C
CTGCC
ACTCATCGC
AGTAC-3
0126–145
60DS611
455
Aarestrupet
al.,2003
Phen
icols
cmlA
CmlA
1F,U123383860¼>
3879
114
50-TAC
TCG
GATCCA
TGC
TGG
CC-3
02028–2047
Salmonella
Typhim
urium
CmlA
2B,U123384437¼>
4418
115
50-TCC
TCG
AAG
AGC
GCC
ATTGG-3
02586-2605
65DS611
578
Inthis
study
Phen
icols
floR
PO_F
LOR_N
Y398
50-C
AG
CTTGGTCTTCAA
CTG
CA-3
0353–372
Salmonella
Typhim
urium
Flor-3-rev.
437
50-A
CG
GAC
ACC
GTG
AAG
ACA
AT-3
01024–1043
60DS611
691
Inthis
study
Quinolones
gyr
AgyrA
,P2bio
184
50-TAC
CGTCATAGTTATCCA
CGA-3
0305–325
Salmonella
gyrA
,P3
185
50-G
TA
CTTTAC
GCC
ATG
AAC
GT-3
013–32
60P502212
313
Wiuffet
al.,2000
Aminoglycosides
strA
Strep
-res,strA
,plasm
-
ref1010,787-769,primer-2
6750-C
CA
ATC
GCA
GATAGA
AGG
C-3
787–769
E.coli
Strep
-res,strA
,plasm
-
ref1010,240-259,primer-1
6850-C
TTGGTGATAAC
GGC
AATTC-3
0240–259
55RF1010
548
Aarestrupet
al.,2003
Aminoglycosides
strB
Strep
-res,strB,plasm
-ref1010,
623-604,
primer-2
6550-G
GA
TCG
TAG
AAC
ATA
TTG
GC-3
0623–604
E.coli
Strep
-res,strB,plasm
-ref1010,
115-134,
primer-1
6650-A
TC
GTC
AAG
GGA
TTG
AAA
CC-3
0115–134
56RF1010
509
Sch
olz
etal.,1989
Aminoglycosides
aadA
aadA
forw
ard
521
50-A
TTTGC
TGG
TTA
CGG
TGA
CC-3
0234–253
Salmonella
aadA
backward
522
50-C
TTCAA
GTC
TGA
CGG
GCTGA-3
0748–767
56P502212
534
Inthis
study
Quaternary
ammonium
compounds
qacE
D1
des-1
847
50-A
TC
GCA
ATA
GTTGGC
GAA
GT-3
02529–2548
Salmonella
Typhim
urium
des-2
848
50-C
AA
GCTTTTGCC
CATGAA
GC-3
02735–2754
57DS611
226
San
dvan
get
al.,1997
Sulfonam
ides
sulI
Sul1forw
ard
519
50-TGA
GATCAG
ACG
TATTGC
GC-3
02875–2894
Salmonella
Sul1backward
520
50-TTG
AAG
GTTCGA
CAG
CAC
GT-3
03261–3280
58P502212
406
Inthis
study
Sulfonam
ides
sulII
Sul2-f
591
50-G
CG
CTC
AAG
GCA
GATGGC
ATT-3
0154–174
Salmonella
Typhim
urium
Sul2-b
592
50-G
CG
TTTGATACC
GGC
ACC
CGT-3
0418–438
68B(Sul2)
285
Aarestrupet
al.,2003
Sulfonam
ides
sulIII
sul3(F)
1356
50-G
AG
CAA
GATTTTTGG
AATCG-3
02981–3000
Salmonella
Typhim
uium
sul3(B)
1357
50-C
ATCTG
CAG
CTA
ACC
TAG
GGC
TTTGGA-3
03770–3753
51C(Sul3)
773
Perretenan
dBoerlin,2003
Tetracycline
tetA
TetA
primer1
173
50-G
TA
ATTCTG
AGC
ACTGTC
GC-3
01084–1103
E.coli
Aarestrupet
al.,2003;
TetA
primer2
175
50-C
TG
CCTGGA
CAA
CATTGC
TT-3
02021–2040
57NCTC
50078
957
Waterset
al.,2003
Tetracycline
tetB
TetB-Tn10¼,
39->
5890
50-C
TC
AGTATTCCA
AGC
CTTTG-3
039–58
E.coli
Aarestrupet
al.,2003;
TetB-Tn10¼,
454->434
9150-A
CTCCC
CTG
AGC
TTG
AGG
GG-3
0454–434
52CSH50::T
n10
415
Sen
geløvet
al.,2003
Tetracycline
tetC
TetC,595->
576
9250-G
GTTGA
AGG
CTC
TCA
AGG
GC-3
0595–576
E.coli
Aarestrupet
al.,2003;
TetC,90->110
9350-C
CTCTTGCG
GGA
TATCGTCC-3
090–110
62DO7pBR322
506
Sen
geløvet
al.,2003
Tetracycline
tetD
Tet
D2(894-874)
575
50-C
ATCCA
TCC
GGA
AGTGATAGC-3
0894–874
E.coli
Aarestrupet
al.,2003;
Tet
D1(459-478)
576
50-G
GA
TATCTC
ACC
GCA
TCTGC-3
0459–478
57C600=psL
106
436
Miran
daet
al.,2003
Tetracycline
tetG
TetA(G
)-1
229
50-G
CA
GCG
AAA
GCG
TATTTG
CG-3
029–48
Salmonella
TetA(G
)-2
230
50-TCC
GAA
AGC
TGTCCA
AGC
AT-3
0672–691
60P502212
663
Aarestrupet
al.,2003
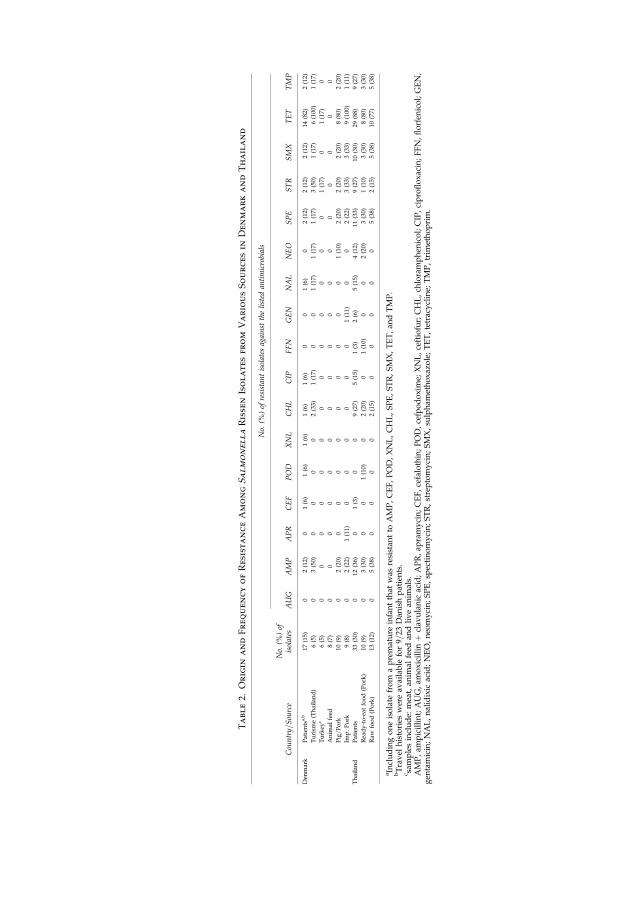
Table2.
Origin
andFrequencyofResistanceAmongSalmonellaRissen
Isolatesfrom
VariousSourcesin
DenmarkandThailand
No.
(%)of
resistantisolates
against
thelisted
antimicrobials
Country=Source
No.
(%)of
isolates
AUG
AMP
APR
CEF
POD
XNL
CHL
CIP
FFN
GEN
NAL
NEO
SPE
STR
SMX
TET
TMP
Den
mark
Patientsa,b
17(15)
02(12)
01(6)
1(6)
1(6)
1(6)
1(6)
00
1(6)
02(12)
2(12)
2(12)
14(82)
2(12)
Turism
e(Thailand)
6(5)
03(50)
00
00
2(33)
1(17)
00
1(17)
1(17)
1(17)
3(50)
1(17)
6(100)
1(17)
Turkey
c6(5)
00
00
00
00
00
00
01(17)
01(17)
0
Anim
alfeed
8(7)
00
00
00
00
00
00
00
00
0
Pig=Pork
10(9)
02(20)
00
00
00
00
01(10)
2(20)
2(20)
2(20)
8(80)
2(20)
Imp.Pork
9(8)
02(22)
1(11)
00
00
00
1(11)
00
2(22)
3(33)
3(33)
9(100)
1(11)
Thailand
Patients
33(30)
012
(36)
01(3)
00
9(27)
5(15)
1(3)
2(6)
5(15)
4(12)
11(33)
9(27)
10(30)
29(88)
9(27)
Ready-to-eat
food(Pork)
10(9)
03(30)
00
1(10)
02(20)
01(10)
00
2(20)
3(30)
1(10)
3(30)
8(80)
3(30)
Raw
food(Pork)
13(12)
05(38)
00
00
2(15)
00
00
05(38)
2(15)
5(38)
10(77)
5(38)
aIncludingoneisolate
from
apremature
infantthat
was
resistan
tto
AMP,CEF,POD,XNL,CHL,SPE,STR,SMX,TET,an
dTMP.
bTravel
histories
wereav
ailable
for9=
23Dan
ishpatients.
c sam
plesinclude:
meat,an
imal
feed
andlivean
imals.
AMP,am
picillint;AUG,am
oxicillinþ
clav
ulanic
acid;APR,ap
ramycin;CEF,cefalothin;POD,cefpodoxim
e;XNL,ceftiofur;CHL,ch
loramphen
icol;CIP,ciprofloxacin;FFN,florfen
icol;GEN,
gen
tamicin;NAL,nalidixic
acid;NEO,neo
mycin;SPE,sp
ectinomycin;STR,streptomycin;SMX,su
lpham
ethoxazole;TET,tetracycline;
TMP,trim
ethoprim.
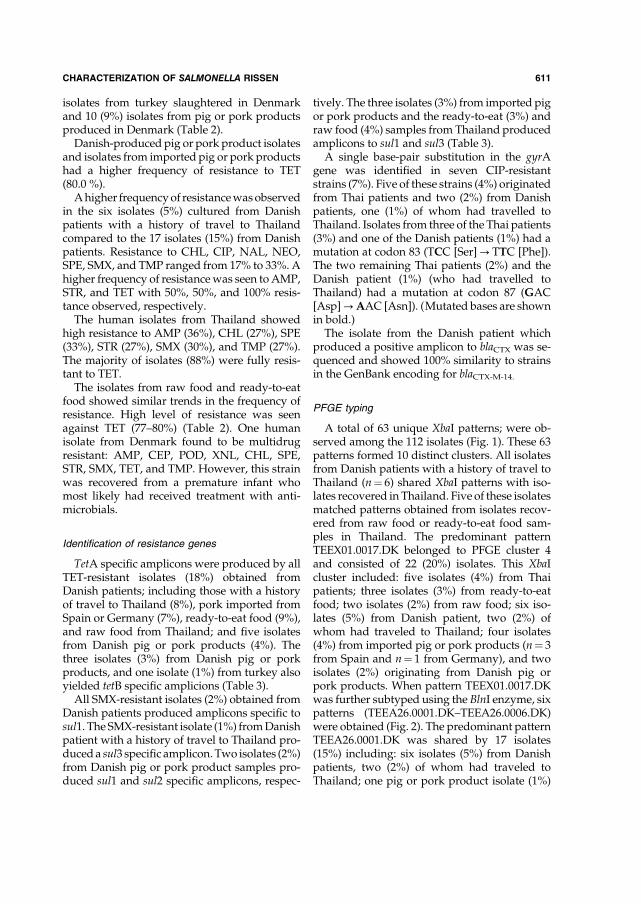
isolates from turkey slaughtered in Denmarkand 10 (9%) isolates from pig or pork productsproduced in Denmark (Table 2).
Danish-produced pig or pork product isolatesand isolates from imported pig or pork productshad a higher frequency of resistance to TET(80.0 %).
Ahigher frequencyof resistancewasobservedin the six isolates (5%) cultured from Danishpatients with a history of travel to Thailandcompared to the 17 isolates (15%) from Danishpatients. Resistance to CHL, CIP, NAL, NEO,SPE, SMX, and TMP ranged from 17% to 33%. Ahigher frequency of resistancewas seen toAMP,STR, and TET with 50%, 50%, and 100% resis-tance observed, respectively.
The human isolates from Thailand showedhigh resistance to AMP (36%), CHL (27%), SPE(33%), STR (27%), SMX (30%), and TMP (27%).The majority of isolates (88%) were fully resis-tant to TET.
The isolates from raw food and ready-to-eatfood showed similar trends in the frequency ofresistance. High level of resistance was seenagainst TET (77–80%) (Table 2). One humanisolate from Denmark found to be multidrugresistant: AMP, CEP, POD, XNL, CHL, SPE,STR, SMX, TET, and TMP. However, this strainwas recovered from a premature infant whomost likely had received treatment with anti-microbials.
Identification of resistance genes
TetA specific amplicons were produced by allTET-resistant isolates (18%) obtained fromDanish patients; including those with a historyof travel to Thailand (8%), pork imported fromSpain or Germany (7%), ready-to-eat food (9%),and raw food from Thailand; and five isolatesfrom Danish pig or pork products (4%). Thethree isolates (3%) from Danish pig or porkproducts, and one isolate (1%) from turkey alsoyielded tetB specific amplicions (Table 3).
All SMX-resistant isolates (2%) obtained fromDanish patients produced amplicons specific tosul1. The SMX-resistant isolate (1%) fromDanishpatient with a history of travel to Thailand pro-duceda sul3 specific amplicon. Two isolates (2%)from Danish pig or pork product samples pro-duced sul1 and sul2 specific amplicons, respec-
tively. The three isolates (3%) from imported pigor pork products and the ready-to-eat (3%) andraw food (4%) samples from Thailand producedamplicons to sul1 and sul3 (Table 3).A single base-pair substitution in the gyrA
gene was identified in seven CIP-resistantstrains (7%). Five of these strains (4%) originatedfrom Thai patients and two (2%) from Danishpatients, one (1%) of whom had travelled toThailand. Isolates from three of the Thai patients(3%) and one of the Danish patients (1%) had amutation at codon 83 (TCC [Ser]?TTC [Phe]).The two remaining Thai patients (2%) and theDanish patient (1%) (who had travelled toThailand) had a mutation at codon 87 (GAC[Asp]?AAC [Asn]). (Mutated bases are shownin bold.)The isolate from the Danish patient which
produced a positive amplicon to blaCTX was se-quenced and showed 100% similarity to strainsin the GenBank encoding for blaCTX-M-14.
PFGE typing
A total of 63 unique XbaI patterns; were ob-served among the 112 isolates (Fig. 1). These 63patterns formed 10 distinct clusters. All isolatesfrom Danish patients with a history of travel toThailand (n¼ 6) shared XbaI patterns with iso-lates recovered in Thailand. Five of these isolatesmatched patterns obtained from isolates recov-ered from raw food or ready-to-eat food sam-ples in Thailand. The predominant patternTEEX01.0017.DK belonged to PFGE cluster 4and consisted of 22 (20%) isolates. This XbaIcluster included: five isolates (4%) from Thaipatients; three isolates (3%) from ready-to-eatfood; two isolates (2%) from raw food; six iso-lates (5%) from Danish patient, two (2%) ofwhom had traveled to Thailand; four isolates(4%) from imported pig or pork products (n¼ 3from Spain and n¼ 1 from Germany), and twoisolates (2%) originating from Danish pig orpork products. When pattern TEEX01.0017.DKwas further subtyped using the BlnI enzyme, sixpatterns (TEEA26.0001.DK–TEEA26.0006.DK)were obtained (Fig. 2). The predominant patternTEEA26.0001.DK was shared by 17 isolates(15%) including: six isolates (5%) from Danishpatients, two (2%) of whom had traveled toThailand; one pig or pork product isolate (1%)
CHARACTERIZATION OF SALMONELLA RISSEN 611

Table3.
Distribution
ofAntimicrobialResistanceGenesin
SalmonellaRissen
Isolatesfrom
DifferentSources
No.
(%)of
isolates
foreach
gene
Tetracycline
Cloramphenicol
Florphenicol
Neomycin
Gentamicin
Quinolones
Streptomycin
Spectinom
ycin
&Streptomycin
Sulfam
ethoxazole
Quatem
ary
ammonium
compounds
(QAC)
Ampicillin
Ceftiofur
Country=S
ource
tetA
tetB
tetC
tetD
tetG
cmlA
catA1
floR
aph(3@)-III
aph(3@)-IIaph(3@)-I
aac(3@)-IV
ent(2@)-II
aac(3@)-II
gyrA
strA
strB
aadA
sul1
sul2
sul3
qacE
D1
bla T
EM
bla C
TX
Den
mark
Patients
fg.
14=14
(100)0=
14(0)
0=14
(0)0=14
(0)0=
14(0)
0=2(0)
2=2(100)
——
——
——
—1a=1(100)
0=3(0)
0=3(0)
2=3(67)
2=2(100)
0=2(0)
0=2(0)
2=2(100)
1=2(50)
1d=1(100)
Turism
e
(Thailand)
6=6(100)
0=6(0)
0=6(0)
0=6(0)
0=6(0)
1=1(100)
1=1(100)
0=1(0)
0=1(0)
1=1(100)
0=1(0)
——
—1b=1(100)
2=4(50)
2=4(50)
1=4(25)
0=1(0)
0=1(0)
1=1(100)
0=1(0)
3=3(100)
—
Turkey
@0=
1(0)
1=1(100)
0=1(0)
0=1(0)
0=1(0)
——
——
——
——
——
1=2(50)
1=2(50)
0=2(0)
——
——
——
Anim
alfeed
——
——
——
——
——
——
——
——
——
——
——
——
Pig=Pork
5=8(63)
3=8(37)
0=8(0)
0=8(0)
0=8(0)
——
—0=
1(0)
1=1(100)
0=1(0)
——
——
2=5(40)
1=5(20)
2=5(40)
1=2(50)
1=2(50)
0=2(0)
2=2(100)
2=2(100)
Imp.Pork
9=9(100)
0=9(0)
0=9(0)
0=9(0)
0=9(0)
——
——
——
1=1(100)
0=1(0)
0=1(0)
—2=
4(50)
2=4(50)
2=4(50)
1=3(33)
0=3(0)
2=3(66)
1=3(33)
2=2(100)
Thailand
Patients
29=29
(100)0=
29(0)
0=29
(0)0=29
(0)0=
29(0)5=
11(45)
11=11
(100)
0=3(0)
0=5(0)
4=5(80)
0=5(0)
0=2(0)
0=2(0)
2=2(100)
58=5(100)
4=14
(29)
4=14
(29)
11=15
(73)
6=10
(60)
1=10
(10)
5=10
(50)
6=10
(60)
12=13
(92)
—
Readyfood
(Pork)
8=8(100)
0=8(0)
0=8(0)
0=8(0)
0=8(0)
2=3(67)
3=3(100)
0=2(0)
0=2(0)
2=2(100)
0=2(0)
——
——
0=6(0)
0=6(0)
3=6(50)
1=3(33)
0=3(0)
2=3(66)
1=3(33)
3=3(100)
—
Raw
food
(Pork)
10=10
(100)0=
10(0)
0=10
(0)0=10
(0)0=
10(0)
2=2(100)
2=2(100)
0=1(0)
——
——
——
—0=
5(0)
0=5(0)
5=5(100)
4=5(80)
0=5(0)
2=5(40)
4=5(80)
5=5(100)
—
aTheisolate
contained
substitutionin
code83
.bTheisolate
contained
substitutionin
codon87.
c Thefiveciprofloxacin
resistan
tisolatescontained
asingle
pointmutationin
thegyrA
gen
e.Threeoftheisolatescontained
substitutionsin
codon83
andtw
oisolatesin
codon87.
dTheceftiofurresistan
tisolatesoriginatingfrom
apremature
born
childin
Den
markcontained
theblac
CTX-M
-14gen
e.eIsolatedfrom
both
freshmeat,an
imal
feed
anddeceasedan
imal.
f Oneisolatesfrom
apremature
childin
Den
markaccountedforresistan
ceto
AMP,CEF,POD,XNL,CHL,SPE,STR,SMX,TET,TMP.
gTravel
histories
wereav
ailable
for9=23
Dan
ishpatients.Molecu
larch
aracterizationwas
perform
edonResistant(R)an
dInterm
ediate
(I)isolates.
AMP,am
picillin;CEF,cefalothin;POD,cefpodoxim
e;XNL,ceftiofur;CHL,ch
loramphen
icol;SPE,sp
ectinomycin;STR,streptomycin;XNL,ceftiofur;CHL,ch
loramphen
icol;SPE,sp
ectinomycin;
STR,streptomycin;SMX,su
lpham
ethoxazole;TET,tetracycline;
TMP,trim
ettoprim.
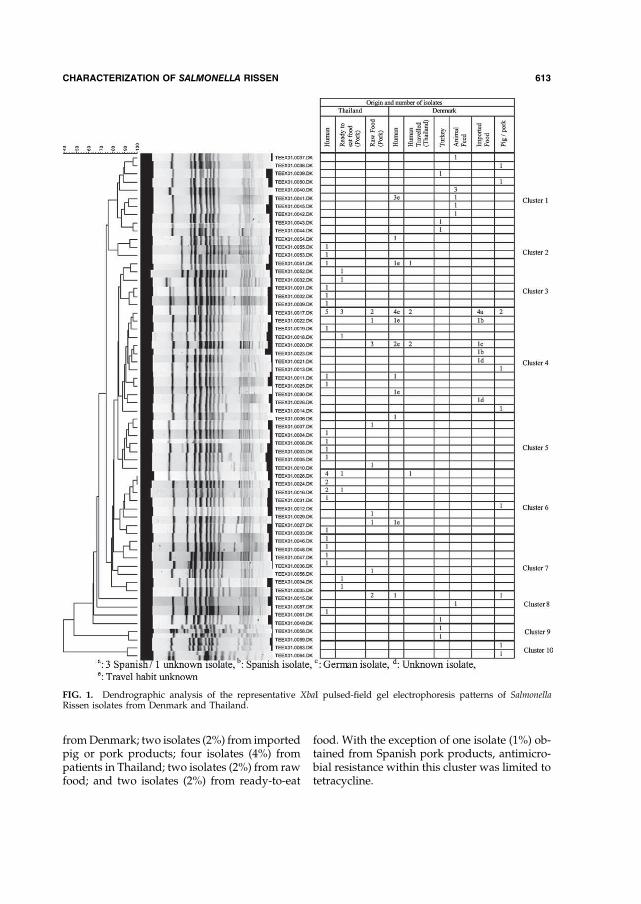
fromDenmark; two isolates (2%) from importedpig or pork products; four isolates (4%) frompatients in Thailand; two isolates (2%) from rawfood; and two isolates (2%) from ready-to-eat
food. With the exception of one isolate (1%) ob-tained from Spanish pork products, antimicro-bial resistance within this cluster was limited totetracycline.
FIG. 1. Dendrographic analysis of the representative XbaI pulsed-field gel electrophoresis patterns of SalmonellaRissen isolates from Denmark and Thailand.
CHARACTERIZATION OF SALMONELLA RISSEN 613
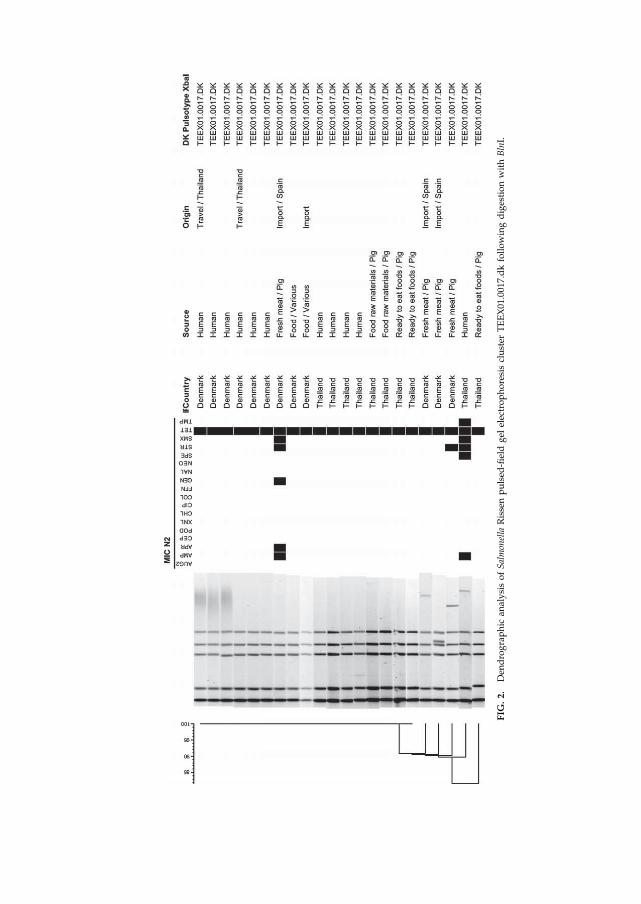
FIG
.2.
Den
drographic
analysisofSalmonella
Rissenpulsed
-fieldgel
electrophoresiscluster
TEEX01.0017.dkfollowingdigestionwithBlnI.

A similarity of approximately 82% wasobserved among PFGE cluster 1 strains. Thiscluster of isolates originated from Denmark andwas pan-susceptible.
In PFGE cluster 6; the predominant pattern,TEEX01.0026.DK was shared by six isolates(5%): four from Thai patients (4%), one isolate(1%) from ready-to-eat food and one isolate (1%)from a Danish patient with a history of travel toThailand prior to the infection. All of the isolates(5%) were resistant to AMP, CHL, NEO, SPE,STR, SMX, TET, and TMP (data not shown)(Fig. 1).
Discussion
The majority of Salmonella Rissen isolates in-cluded in this study exhibited resistance to tet-racycline and displayed limited resistance toother antimicrobials. A previous study fromThailand found almost all porcine isolates to befully resistant to TET, STR, and SMX (Angkiti-trakul et al., 2005). Thai isolates and isolates fromDanish patients with a history of travel to Thai-land were more likely to be resistant to AMP,CHL, STR, SMX, and TMP than isolates origi-nating from Denmark.
Almost all ampicillin-resistant isolates con-tained a sequence similar to blaTEM-1b. blaTEMgenes have also been widely found among Sal-monella isolates in other studies (Gallardo et al.,1999; Olesen et al., 2004). Chloramphenicol re-sistance was mediated by the catA1 or the cmlAgene, which has also been observed previously(Guerra et al., 2002; Zhao et al., 2007), but is alsowidespread among other gram-negative bacte-ria. Florfenicol resistance is normally encodedbythe flogene,which specifies nonenzymatic cross-resistance to both florfenicol and chloramphen-icol. However, none of the florfenicol-resistantisolates tested contained the flo gene. It has pre-viously been suggested that several of isolatesmay possess an unknown chromosomal flo gene(White et al., 2000). Tetracycline resistance wasprimarily mediated by tetA. However, the tetBgene was identified in one turkey isolate andthree of the eight Danish pig or pork isolates.tetA is commonly found on transposons such asTn1721, this gene has been identified in manygram-negative bacteria including Salmonella(Frech and Schwarz, 2000).
Sulphonamide resistance in Enterobacteriaceaeis typicallymediated by the resistance genes sulI(encoded on aClass I integron), sul2 (encodedona nonconjugative plasmid), or sul3 (putativelyassociated with both an integron system anda conjugative plasmid) (Radstrom et al., 1991).sul1-, sul2-, and sul3-mediated resistance wasidentified among the sulphamethoxazole-resistant isolates.The aph(3’’)-II gene was identified in all
neomycin-resistant isolates. This gene has pre-viouslybeen identified in several other species ofgram-negative bacteria. Streptomycin resistancewas encoded by aadA, strA, and strB. This ge-notype is also commonly observed in Denmarkamong streptomycin-resistant isolates of Salmo-nella Typhimurium (Madsen et al., 2000).Seven ciprofloxacin-resistant isolates con-
tained a single mutation in gyrA at codons 83(Ser?Phe) or 87 (Asp?Asn). Mutations atthese positions, located within the quinoloneresistance–determining region of gyrA, havebeen associated with ciprofloxacin resistance inseveral bacterial species, including high-levelciprofloxacin resistance in Salmonella spp. (Chiuet al., 2002; Casin et al., 2003; Ling et al., 2003).To our knowledge, this is the first study uti-
lizing PFGE to demonstrate the molecular di-versity of Salmonella Rissen. This appears to be agenetically diverse serotype, with 112 strainsproducing a total of 63 unique XbaI pat-terns (Fig. 1). The predominant pattern wasTEEX01.0017.DK which consisted of 22 isolatesandwas shared betweenThai patients, ready-to-eat food, raw food, Danish patients with andwithout a history of travel, and imported andDanish pig or pork. Several other patterns wereshared by isolates from different sources whichcould support a link between the reservoirs.The biological analysis strongly suggests that
Thai patients acquire Salmonella Rissen infec-tions by consumption of Thai-produced pig orpork products. These data also suggest that tra-vel to Thailand and consumption of importedand Danish-produced pig or pork products arepotential risk factors for infection with Salmo-nella Rissen infection among Danish patients.Previous studies have also indicated that Danishpatientsmight acquire infectionswith Salmonellaserotypes Corvallis or Schwarzengrund fromThailand through a combination of travelling
CHARACTERIZATION OF SALMONELLA RISSEN 615

and the import of different food products(Archambault et al. 2006; Aarestrup et al. 2007).Source attribution analysis in Denmark has alsoshown the increased importance of importedfoodproducts as a source ofSalmonella infections(Hald et al., 2007). With increases in tourism andinternational trade, Salmonella subtypes whichhad been confined to specific regions mayemerge elsewhere. These studies emphasise theneed to view Salmonella epidemiology from aglobal perspective.
It should be noted that some degree ofselection and statistical bias may have influ-enced the results of the present study. The ma-jority of Thai isolates were collected betweenMay and June 2004 and only isolates collectedduring this time period were selected for mo-lecular characterization. In contrast, the Danishisolates were collected over a period of severalyears. Comparing isolates from different timeperiods may reduce the chances of findingclones with identical antibiogrammes or indis-tinguishable PFGE patterns. Additionally, thelimited number of isolates included in the studymight have influenced the statistical analysis ofspecific risk factors, particularly the consump-tion of imported pork. It should also be notedthat travel histories could only be obtained fornine of the 23 Danish patients. No informationregarding travel prior infectionwas available for14 patients.
Conclusion
This study suggest that travel to Thailand andthe consumption of pig or pork products (Dan-ish and imported)were risk factors forSalmonellaRissen infections among the Danish patients in-cluded in this study. This study also suggeststhat the Thai patients included in this studymostlikely became infected with Salmonella Rissen bythe consumption of Thai pig or pork products.This studymayhavepotential benefits for futureSalmonella Rissen investigations and outbreakdetection.
Acknowledgments
We are grateful to Miss Berith Kummerfeldt(NFI) for outstanding technical assistance, Dr.MikoleitMatthew (CDC,USA) for reviewing the
manuscript and improving the English, Mrs.Gitte Sørensen (NFI) for assistance in obtaininginformation on food products imported toDenmark, and Dr. Katharina E.P. Olsen andMrs. Ingrid B. Jensen (SSI) for providing strainsand data for infections in patients in Denmark.This work and hosting Mr. Si Wook Song weresupported by the World Health Organiza-tion Global Salm-Surv (http:==www.who.int=salmsurv).
References
Aarestrup FM, Hendriksen RS, Lockett J, Gay K, Teates K,McDermott PF, White DG, Hasman H, Sørensen G,Bangtrakulnonth A, Pornreongwong S, Pulsrikarn C,Angulo FJ, and Gerner-Smidt P. International spread ofmultidrug-resistant Salmonella Schwarzengrund in foodproducts. Emerg. Infect. Dis. 2007;13:726–731.
Aarestrup FM, Lertworapreecha M, Evans MC, Bang-trakulnonth A, Chalermchaikit T, Hendriksen RS, andWegener HC. Antimicrobial susceptibility and occur-rence of resistance genes among Salmonella entericaserovar Weltevreden from different countries. J. Anti-microb. Chemother. 2003;52:715–718.
Angkititrakul S, Chomvarin C, Chaita T, Kanistanon K,and Waethewutajarn S. Epidemiology of antimicrobialresistance in Salmonella isolated from pork, chickenmeat and humans in Thailand. Southeast Asian J. Trop.Med. Public Health 2005;36:1510–1515.
Archambault M, Petrov P, Hendriksen RS, Asseva G,Bangtrakulnonth A, Hasman H, and Aarestrup FM.Molecular characterization and occurrence of extended-spectrum beta-lactamase resistance genes amongSalmonella enterica serovar Corvallis from Thailand,Bulgaria, and Denmark. Microb. Drug Resist. 2006;12:192–198.
Asseva G, Petrov P, Ivanov I, and Kantardjiev T. Surveil-lance of human salmonellosis in Bulgaria, 1999–2004:trends, shifts and resistance to antimicrobial agents.Euro. Surveill. 2006;11:97–100.
Astorga RJ, Salaberria AE, Garcia AM, Jimenez SV, Mar-tinez AC, Garcia AA, and Casas AA. Surveillance andantimicrobial resistance of Salmonella strains isolatedfrom slaughtered pigs in Spain. J. Food Prot. 2007;70:1502–1506.
Bangtrakulnonth A, Bunyaraksyotin G, and NantanawootP. Annual Report of Confirmed Salmonella and Shigellain Thailand. Available at http:==narst.dmsc.moph.go.th=another=salmonella=Annual_Report_2004.pdf. Non-thaburi, Thailand: Department of Medical Sciences,Ministry of Public Health, 2004a. Accessed October 7,2007.
Bangtrakulnonth A, Pornruangwong S, and Pulsrikarn C.Annual Report of Confirmed Salmonella and Shigellain Thailand. Available at http:==narst.dmsc.moph.go.th=another=salmonella=Annual_Report_2005.pdf. Non-
616 HENDRIKSEN ET AL.
thaburi, Thailand: Department of Medical Sciences,MinistryofPublicHealth, 2005.AccessedOctober7, 2007.
Bangtrakulnonth A, Pornreongwong S, Pulsrikarn C, Sa-wanpanyalert P, Hendriksen RS, Lo Fo Wong DM, andAarestrup FM. Salmonella serovars from humans andother sources in Thailand, 1993–2002. Emerg. Infect. Dis.2004b;10:131–136. Accessed October 7, 2007.
Bangtrakulnonth A and Tishyadhigama P. Annual Reportof Confirmed Salmonella and Shigella in Thailand.Available at http:==webdb.dmsc.moph.go.th=ifc_nih=applications=files=Annual_report_2006.pdf. Nontha-buri, Thailand: Department of Medical Sciences, Ministryof Public Health, 2006. Accessed October 6, 2007.
Bangtrakulnonth A, Tishyadhigama P, Bunyaraksyotin G,and Nantanawoot P. Annual Report of Confirmed Sal-monella and Shigella in Thailand. Available at http:==narst.dmsc.moph.go.th=another=salmonella=Annual_Report_2003.pdf. Nonthaburi, Thailand: Department ofMedical Sciences, Ministry of Public Health, 2003. Ac-cessed October 7, 2007.
Cameron FH, Groot Obbink DJ, Ackerman VP, and HallRM. Nucleotide sequence of the AAD(2’’) aminoglyco-side adenylyltransferase determinant aadB. Evolutionaryrelationship of this region with those surrounding aadAin R538-1 and dhfrII in R388. Nucleic Acids Res.1986;14:8625–8635.
Casin I, Breuil J, Darchis JP, Guelpa C, and Collatz E.Fluoroquinolone resistance linked to GyrA, GyrB,and ParC mutations in Salmonella enterica Typhimuriumisolates in humans. Emerg. Infect. Dis. 2003;9:1455–1457.
Chiu CH, Wu TL, Su LH, Chu C, Chia JH, Kuo AJ, ChienMS, and Lin TY. The emergence in Taiwan of fluor-oquinolone resistance in Salmonella enterica serotypeCholeraesuis. N. Engl. J. Med. 2002;346:413–419.
[CLSI] Clinical and Laboratory Standards Institute.Performance Standards for Antimicrobial Disk and Di-lution Susceptibility Tests for Bacterial Isolated fromAnimals, 2nd Edition. Approved Standard. M31-A2.Wayne, PA: Clinical and Laboratory Standards Institute,2002.
[CLSI] Clinical and Laboratory Standards Institute. Meth-ods for Dilution Antimicrobial Susceptibility Tests forBacteria That Grow Aerobically, 7th Edition. ApprovedStandard. M07-A7. Wayne, PA: Clinical and LaboratoryStandards Institute, 2006a.
[CLSI] Clinical and Laboratory Standards Institute. Per-formance Standards for Antimicrobial SusceptibilityTesting, 16th Informational Supplement. M100-S16.Wayne, PA: Clinical and Laboratory Standards Institute,2006b.
Costa D, Poeta P, Saenz Y, Vinue L, Rojo-Bezares B, JouiniA, Zarazaga M, Rodrigues J, and Torres C. Detection ofEscherichia coli harbouring extended-spectrum beta-lactamases of the CTX-M, TEMand SHV classes in faecalsamples of wild animals in Portugal. J. Antimicrob.Chemother. 2006;58:1311–1312.
Coyle EF, Palmer SR, Ribeiro CD, Jones HI, Howard AJ,Ward L, and Rowe B. Salmonella enteritidis phage type 4
infection: association with hen’s eggs. Lancet 1988;2:1295–1297.
Frech G and Schwarz S. Molecular analysis of tetracyclineresistance in Salmonella enterica subsp. enterica serovarsTyphimurium, Enteritidis, Dublin, Choleraesuis, Hadarand Saintpaul: construction and application of specificgene probes. J. Appl. Microbiol. 2000;89:633–641.
Galanis E, Lo Fo Wong DM, Patrick ME, Binsztein N,Cieslik A, Chalermchikit T, Aidara-Kane A, Ellis A,Angulo FJ, Wegener HC, and World Health Organiza-tion Global Salm-Surv. Web-based surveillance andglobal Salmonella distribution, 2000–2002. Emerg. Infect.Dis. 2006;12:381–388.
Gallardo F, Ruiz J, Marco F, Towner KJ, and Vila J. Increasein incidence of resistance to ampicillin, chloramphenicoland trimethoprim in clinical isolates of Salmonella sero-type Typhimurium with investigation of molecularepidemiology and mechanisms of resistance. J. Med.Microbiol. 1999;48;367–374.
Guerra B, Soto S, Helmuth R, and Mendoza MC. Char-acterization of a self-transferable plasmid from Salmo-nella enterica serotype Typhimurium clinical isolatescarrying two integron-borne gene cassettes togetherwithvirulence and drug resistance genes. Antimicrob. AgentsChemother. 2002;46:2977–2981.
Hald T, Lo Fo Wong DM, and Aarestrup FM. The attri-bution of human infections with antimicrobial resistantSalmonella bacteria in Denmark to sources of animalorigin. Foodborne Pathog. Dis. 2007;4:313–326.
Hasman H, Mevius D, Veldman K, Olesen I, andAarestrup FM. beta-Lactamases among extended-spectrum beta-lactamase (ESBL)-resistant Salmonellafrom poultry, poultry products and human patients inthe Netherlands. J. Antimicrob. Chemother. 2005;56:115–121.
Herikstad H, Motarjemi Y, and Tauxe RV. Salmonella sur-veillance: a global survey of public health serotyping.Epidemiol. Infect. 2002;129:1–8.
Humphrey TJ. Public-health aspects of Salmonella infec-tions. In: Wray C and Wray A (eds.) Salmonella indomestic animals.Wallingford (England): CABIPublish-ing, 2000.
Humphrey TJ, Mead GC, and Rowe B. Poultry meat as asource of human salmonellosis in England and Wales.Epidemiological overview. Epidemiol. Infect. 1988;100:175–184.
Inthavong P, Srikitjakarn L, Kyule M, Zessin KH, Bau-mann M, Douangngeun B, and Fries R. Microbial con-tamination of pig carcasses at a slaughterhouse inVientiane capital, Lao PDR. Southeast Asian J. Trop.Med. Public Health 2006;37:1237–1241.
Lim SK, Tanimoto K, Tomita H, and Ike Y. Pheromone-responsive conjugative vancomycin resistance plasmidsin Enterococcus faecalis isolates from humans and chickenfeces. Appl. Environ. Microbiol. 2006;72:6544–6553.
Ling JM, Chan EW, LamAW, and Cheng AF. Mutations intopoisomerase genes of fluoroquinolone-resistant sal-monellae in Hong Kong. Antimicrob. Agents Che-mother. 2003;47:3567–3573.
CHARACTERIZATION OF SALMONELLA RISSEN 617

Madsen L, Aarestrup FM, and Olsen JE. Characterisationof streptomycin resistance determinants in Danish iso-lates of Salmonella Typhimurium. Vet. Microbiol.2000;75:73–82.
Maynard C, Fairbrother JM, Bekal S, Sanschagrin F, Lev-esque RC, Brousseau R,Masson L, Lariviere S, andHarelJ. Antimicrobial resistance genes in enterotoxigenic Es-cherichia coli O149:K91 isolates obtained over a 23-yearperiod from pigs. Antimicrob. Agents Chemother. 2003;47:3214–3221.
Miranda CD, Kehrenberg C, Ulep C, Schwarz S, and Ro-berts MC. Diversity of tetracycline resistance genes inbacteria fromChilean salmon farms. Antimicrob. AgentsChemother. 2003;47:883–888.
Miro E, Navarro F, Mirelis B, Sabate M, Rivera A, Coll P,and Prats G. Prevalence of clinical isolates of Escherichiacoli producing inhibitor-resistant beta-lactamases at auniversity hospital in Barcelona, Spain, over a 3-yearperiod. Antimicrob. Agents Chemother. 2002;46:3991–3994.
Oka A, Sugisaki H, and TakanamiM. Nucleotide sequenceof the kanamycin resistance transposon Tn903. J. Mol.Biol. 1981;147:217–226.
Olesen I, Hasman H, and Aarestrup FM. Prevalence ofbeta-lactamases among ampicillin-resistant Escherichiacoli and Salmonella isolated from food animals in Den-mark. Microb. Drug Resist. 2004;10:334–340.
Olsen SJ, Bishop R, Brenner FW, Roels TH, Bean N, TauxeRV, and Slutsker L. The changing epidemiology of Sal-monella: trends in serotypes isolated from humans inthe United States, 1987–1997. J. Infect. Dis. 2001;183:753–761.
Paterson DL, Hujer KM, Hujer AM, Yeiser B, BonomoMD,Rice LB, Bonomo RA; International Klebsiella StudyGroup. Extended-spectrum beta-lactamases in Klebsiellapneumoniae bloodstream isolates from seven countries:dominance and widespread prevalence of SHV- andCTX-M-type beta-lactamases. Antimicrob. Agents Che-mother. 2003;47:3554–3560.
Padungtod P and Kaneene JB. Salmonella in food animalsand humans in northern Thailand. Int. J. FoodMicrobiol.2006;108:346–354.
Perreten V and Boerlin P. A new sulfonamide resistancegene (sul3) in Escherichia coli is widespread in the pigpopulation of Switzerland. Antimicrob. Agents Che-mother. 2003;47:1169–1172.
Popoff MY and Le Minor L. Antigenic Formulas of theSalmonella serovars, 8th ed. WHO Collaborating Centrefor Reference and Research on Salmonella. Paris, France:Institute Pasteur, 2001.
Radstrom P, SwedbergG, and Skold O. Genetic analyses ofsulfonamide resistance and its dissemination in gram-negative bacteria illustrate new aspects of R plasmidevolution. Antimicrob. Agents Chemother. 1991;35:1840–1848.
Riano I, Moreno MA, Teshager T, Saenz Y, Domınguez L,and Torres C. Detection and characterization of ex-
tended-spectrum beta-lactamases in Salmonella entericastrains of healthy food animals in Spain. J. Antimicrob.Chemother. 2006;58:844–847.
Ribot EM, Wierzba RK, Angulo FJ, and Barrett TJ. Salmo-nella enterica serotype Typhimurium DT104 isolatedfrom humans, United States, 1985, 1990, and 1995.Emerg. Infect. Dis. 2002;8:387–391.
Sandvang D, Aarestrup FM, and Jensen LB. Characterisa-tion of integrons and antibiotic resistance genes inDanish multiresistant Salmonella enterica TyphimuriumDT104. FEMS Microbiol. Lett. 1997;157:177–181.
Scholz P, Haring V, Wittmann-Liebold B, Ashman K,BagdasarianM, and Scherzinger E. Complete nucleotidesequence and gene organization of the broad-host-rangeplasmid RSF1010. Gene 1989;75:271–288.
Sengelov G, Agerso Y, Halling-Sorensen B, Baloda SB,Andersen JS, and Jensen LB. Bacterial antibiotic resis-tance levels in Danish farmland as a result of treatmentwith pig manure slurry. Environment International2003;28:587–595.
Udo EE, Al-Sweih N, John P, and Chugh TD. Antibioticresistance of enterococci isolated at a teaching hospital inKuwait. Diagn. Microbiol. Infect. Dis. 2002;43:233–238.
Vaeteewootacharn K, Sutra S, Vaeteewootacharn S, Sithi-gon D, Jamjane O, Chomvarin C, Hahnvajanawong C,Thongskulpanich N, and Thaewnon-giew K. Salmo-nellosis and the food chain in Khon Kaen, northeasternThailand. Southeast Asian J. Trop. Med. Public Health2005;36:123–129.
[VAV]. Veterinary Monitoring of Antimicrobial Resistancein Spain. Madrid, Spain: Universidad Complutense,2005.
Vieira-Pinto M, Tenreiro R, and Martins C. Unveilingcontamination sources and dissemination routes ofSalmonella sp. in pigs at a Portuguese slaughterhousethrough macrorestriction profiling by pulsed-field gelelectrophoresis. Int. J. Food Microbiol. 2006;110:77–84.
Vliegenthart JS, Ketelaar-van Gaalen PA, and van deKlundert JA. Nucleotide sequence of the aacC2 gene, agentamicin resistance determinant involved in a hospitalepidemic of multiply resistant members of the familyEnterobacteriaceae. Antimicrob. Agents Chemother.1989;33:1153–1159.
Vo AT, van Duijkeren E, Fluit AC, Heck ME, VerbruggenA, Maas HM, and Gaastra W. Distribution of Salmonellaenterica serovars from humans, livestock and meat inVietnam and the dominance of Salmonella Typhimuriumphage type 90. Vet. Microbiol. 2006;113(1–2):153–158.
Waters SH, Rogowsky P, Grinsted J, Altenbuchner J, andSchmitt R. The tetracycline resistance determinants ofRP1 and Tn1721: nucleotide sequence analysis. NucleicAcids Res. 1983;11:6089–6105.
White DG, Hudson C,Maurer JJ, Ayers S, Zhao S, LeeMD,Bolton L, Foley T, and Sherwood J. Characterization ofchloramphenicol and florfenicol resistance in Escherichiacoli associated with bovine diarrhea. J. Clin. Microbiol.2000;38:4593–4598.
618 HENDRIKSEN ET AL.

Wiuff C, Madsen M, Baggesen DL, and Aarestrup FM.Quinolone resistance among Salmonella enterica fromcattle, broilers, and swine in Denmark. Microb. DrugResist. 2000;6:11.
Zhao S, McDermott PF, White DG, Qaiyumi S, FriedmanSL, Abbott JW, Glenn A, Ayers SL, Post KW, Fales WH,Wilson RB, Reggiardo C, and Walker RD. Character-ization of multidrug resistant Salmonella recovered fromdiseased animals. Vet. Microbiol. 2007;123:122–132.
Address reprint requests to:Rene S. Hendriksen
National Food InstituteBulowsvej 27
DK-1790 Copenhagen VDenmark
E-mail: [email protected]
CHARACTERIZATION OF SALMONELLA RISSEN 619
�
�
Article IV
Emergence of multidrug-resistant Salmonella Concord infections in Europe and the
United States in children adopted from Ethiopia, 2003-2007
Rene Sjøgren Hendriksen�F���������������F�&�����������(�,������!F��� ������
�(�������.%�F��������� �����/���F�&���������9���U���3'?F�%�����%�������.���F�������
&��(����.��@F������2����� ��.��:�AF�#���0����-�����.��BF����'��(�#��� ����� ��
.���F��������U�������������$��� ��.���
���%+�&���,���� �&������-������(�,����������(�����',����.��� ������'�
&�����/���-����(����,����/�-������(�,����������(���)�������'�*���������
0�(��(���1�2����/�-����������&$���� �����������. ���%+�&���,���� �&������-��
���2�����(���3$'��� /���'�&�����-�����������'�������',�������������&�������
-���������&�������'�.��2���������������4���1��. !���������� ��(/�-��%��������'�
�'���-��/��*��������-����'(����(�,� /���'�%/ �����4��5����������?���������������
*�����������*��&$���� �����������. @�)������1�2����/�-�*�����'��4����/��*�����'. B�
%������.���(���� ��(/��4��������������3��� � ���'�6��(�*�-�(�����&������-�
*�-�(�������'���1���'��� '�. :�&������� �������/�*��������-��� ��� ���1���
���/���'��0���)��������'�. A�1���(���1�2����/����(���/�-� �������/���'(������$��������
-�*�-�(��������������'�*����� /��1���(����0���)��������'�
&����$�'� ������7 Rene S. Hendriksen,
� ��� )��o�����'�*��������
� ��� 0�c��(���1�2����/�-��������
� ��� "8l��2�9��:����;�:<=�&$���� ��� ����������
� �� �.��e7�>?@�:��!?�B=�==� �� ��
� � � � ��C7�>?@�:��!?�B=�=��� �
� ��� 3;�a�7�����D-'�'���'��
Pediatr Infect Dis J. 2009 Sep; 28 (9): 814-818.
AR
TIC
LE
IV
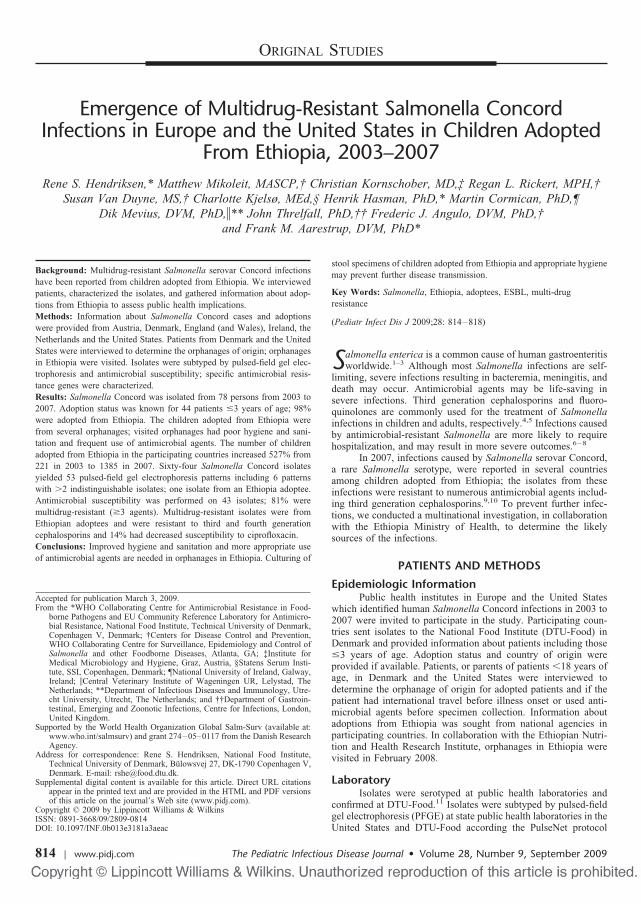
ORIGINAL STUDIES
Emergence of Multidrug-Resistant Salmonella ConcordInfections in Europe and the United States in Children Adopted
From Ethiopia, 2003–2007Rene S. Hendriksen,* Matthew Mikoleit, MASCP,† Christian Kornschober, MD,‡ Regan L. Rickert, MPH,†
Susan Van Duyne, MS,† Charlotte Kjelsø, MEd,§ Henrik Hasman, PhD,* Martin Cormican, PhD,¶Dik Mevius, DVM, PhD,�** John Threlfall, PhD,†† Frederic J. Angulo, DVM, PhD,†
and Frank M. Aarestrup, DVM, PhD*
Background: Multidrug-resistant Salmonella serovar Concord infectionshave been reported from children adopted from Ethiopia. We interviewedpatients, characterized the isolates, and gathered information about adop-tions from Ethiopia to assess public health implications.Methods: Information about Salmonella Concord cases and adoptionswere provided from Austria, Denmark, England (and Wales), Ireland, theNetherlands and the United States. Patients from Denmark and the UnitedStates were interviewed to determine the orphanages of origin; orphanagesin Ethiopia were visited. Isolates were subtyped by pulsed-field gel elec-trophoresis and antimicrobial susceptibility; specific antimicrobial resis-tance genes were characterized.Results: Salmonella Concord was isolated from 78 persons from 2003 to2007. Adoption status was known for 44 patients �3 years of age; 98%were adopted from Ethiopia. The children adopted from Ethiopia werefrom several orphanages; visited orphanages had poor hygiene and sani-tation and frequent use of antimicrobial agents. The number of childrenadopted from Ethiopia in the participating countries increased 527% from221 in 2003 to 1385 in 2007. Sixty-four Salmonella Concord isolatesyielded 53 pulsed-field gel electrophoresis patterns including 6 patternswith �2 indistinguishable isolates; one isolate from an Ethiopia adoptee.Antimicrobial susceptibility was performed on 43 isolates; 81% weremultidrug-resistant (�3 agents). Multidrug-resistant isolates were fromEthiopian adoptees and were resistant to third and fourth generationcephalosporins and 14% had decreased susceptibility to ciprofloxacin.Conclusions: Improved hygiene and sanitation and more appropriate useof antimicrobial agents are needed in orphanages in Ethiopia. Culturing of
stool specimens of children adopted from Ethiopia and appropriate hygienemay prevent further disease transmission.
Key Words: Salmonella, Ethiopia, adoptees, ESBL, multi-drugresistance
(Pediatr Infect Dis J 2009;28: 814–818)
Salmonella enterica is a common cause of human gastroenteritisworldwide.1–3 Although most Salmonella infections are self-
limiting, severe infections resulting in bacteremia, meningitis, anddeath may occur. Antimicrobial agents may be life-saving insevere infections. Third generation cephalosporins and fluoro-quinolones are commonly used for the treatment of Salmonellainfections in children and adults, respectively.4,5 Infections causedby antimicrobial-resistant Salmonella are more likely to requirehospitalization, and may result in more severe outcomes.6–8
In 2007, infections caused by Salmonella serovar Concord,a rare Salmonella serotype, were reported in several countriesamong children adopted from Ethiopia; the isolates from theseinfections were resistant to numerous antimicrobial agents includ-ing third generation cephalosporins.9,10 To prevent further infec-tions, we conducted a multinational investigation, in collaborationwith the Ethiopia Ministry of Health, to determine the likelysources of the infections.
PATIENTS AND METHODS
Epidemiologic InformationPublic health institutes in Europe and the United States
which identified human Salmonella Concord infections in 2003 to2007 were invited to participate in the study. Participating coun-tries sent isolates to the National Food Institute (DTU-Food) inDenmark and provided information about patients including those�3 years of age. Adoption status and country of origin wereprovided if available. Patients, or parents of patients �18 years ofage, in Denmark and the United States were interviewed todetermine the orphanage of origin for adopted patients and if thepatient had international travel before illness onset or used anti-microbial agents before specimen collection. Information aboutadoptions from Ethiopia was sought from national agencies inparticipating countries. In collaboration with the Ethiopian Nutri-tion and Health Research Institute, orphanages in Ethiopia werevisited in February 2008.
LaboratoryIsolates were serotyped at public health laboratories and
confirmed at DTU-Food.11 Isolates were subtyped by pulsed-fieldgel electrophoresis (PFGE) at state public health laboratories in theUnited States and DTU-Food according the PulseNet protocol
Accepted for publication March 3, 2009.From the *WHO Collaborating Centre for Antimicrobial Resistance in Food-
borne Pathogens and EU Community Reference Laboratory for Antimicro-bial Resistance, National Food Institute, Technical University of Denmark,Copenhagen V, Denmark; †Centers for Disease Control and Prevention,WHO Collaborating Centre for Surveillance, Epidemiology and Control ofSalmonella and other Foodborne Diseases, Atlanta, GA; ‡Institute forMedical Microbiology and Hygiene, Graz, Austria, §Statens Serum Insti-tute, SSI, Copenhagen, Denmark; ¶National University of Ireland, Galway,Ireland; �Central Veterinary Institute of Wageningen UR, Lelystad, TheNetherlands; **Department of Infectious Diseases and Immunology, Utre-cht University, Utrecht, The Netherlands; and ††Department of Gastroin-testinal, Emerging and Zoonotic Infections, Centre for Infections, London,United Kingdom.
Supported by the World Health Organization Global Salm-Surv (available at:www.who.int/salmsurv) and grant 274–05–0117 from the Danish ResearchAgency.
Address for correspondence: Rene S. Hendriksen, National Food Institute,Technical University of Denmark, Bulowsvej 27, DK-1790 Copenhagen V,Denmark. E-mail: [email protected].
Supplemental digital content is available for this article. Direct URL citationsappear in the printed text and are provided in the HTML and PDF versionsof this article on the journal’s Web site (www.pidj.com).
Copyright © 2009 by Lippincott Williams & WilkinsISSN: 0891-3668/09/2809-0814DOI: 10.1097/INF.0b013e3181a3aeac
The Pediatric Infectious Disease Journal • Volume 28, Number 9, September 2009814 | www.pidj.com
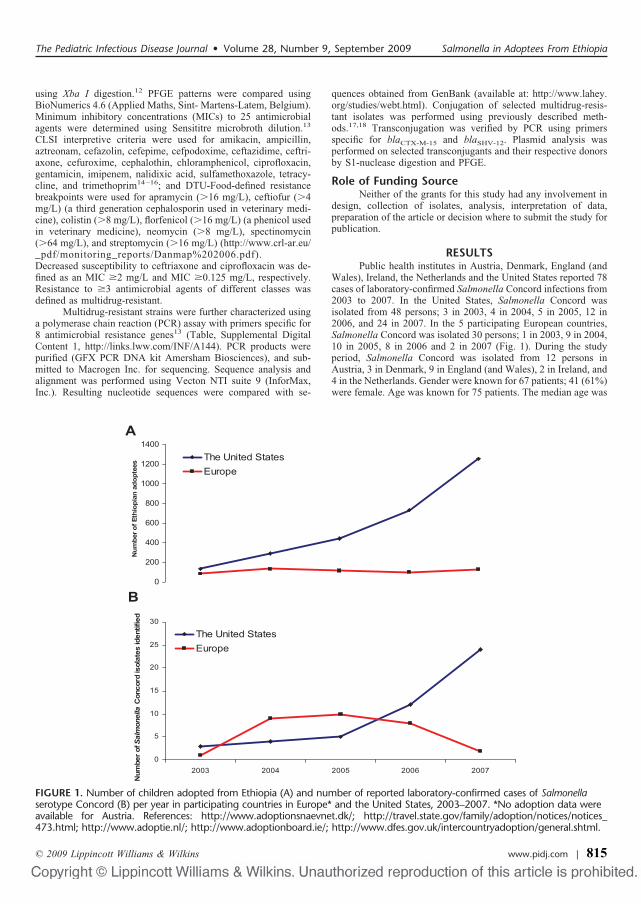
using Xba I digestion.12 PFGE patterns were compared usingBioNumerics 4.6 (Applied Maths, Sint- Martens-Latem, Belgium).Minimum inhibitory concentrations (MICs) to 25 antimicrobialagents were determined using Sensititre microbroth dilution.13
CLSI interpretive criteria were used for amikacin, ampicillin,aztreonam, cefazolin, cefepime, cefpodoxime, ceftazidime, ceftri-axone, cefuroxime, cephalothin, chloramphenicol, ciprofloxacin,gentamicin, imipenem, nalidixic acid, sulfamethoxazole, tetracy-cline, and trimethoprim14–16; and DTU-Food-defined resistancebreakpoints were used for apramycin (�16 mg/L), ceftiofur (�4mg/L) (a third generation cephalosporin used in veterinary medi-cine), colistin (�8 mg/L), florfenicol (�16 mg/L) (a phenicol usedin veterinary medicine), neomycin (�8 mg/L), spectinomycin(�64 mg/L), and streptomycin (�16 mg/L) (http://www.crl-ar.eu/_pdf/monitoring_reports/Danmap%202006.pdf).Decreased susceptibility to ceftriaxone and ciprofloxacin was de-fined as an MIC �2 mg/L and MIC �0.125 mg/L, respectively.Resistance to �3 antimicrobial agents of different classes wasdefined as multidrug-resistant.
Multidrug-resistant strains were further characterized usinga polymerase chain reaction (PCR) assay with primers specific for8 antimicrobial resistance genes13 (Table, Supplemental DigitalContent 1, http://links.lww.com/INF/A144). PCR products werepurified (GFX PCR DNA kit Amersham Biosciences), and sub-mitted to Macrogen Inc. for sequencing. Sequence analysis andalignment was performed using Vecton NTI suite 9 (InforMax,Inc.). Resulting nucleotide sequences were compared with se-
quences obtained from GenBank (available at: http://www.lahey.org/studies/webt.html). Conjugation of selected multidrug-resis-tant isolates was performed using previously described meth-ods.17,18 Transconjugation was verified by PCR using primersspecific for blaCTX-M-15 and blaSHV-12. Plasmid analysis wasperformed on selected transconjugants and their respective donorsby S1-nuclease digestion and PFGE.
Role of Funding SourceNeither of the grants for this study had any involvement in
design, collection of isolates, analysis, interpretation of data,preparation of the article or decision where to submit the study forpublication.
RESULTSPublic health institutes in Austria, Denmark, England (and
Wales), Ireland, the Netherlands and the United States reported 78cases of laboratory-confirmed Salmonella Concord infections from2003 to 2007. In the United States, Salmonella Concord wasisolated from 48 persons; 3 in 2003, 4 in 2004, 5 in 2005, 12 in2006, and 24 in 2007. In the 5 participating European countries,Salmonella Concord was isolated 30 persons; 1 in 2003, 9 in 2004,10 in 2005, 8 in 2006 and 2 in 2007 (Fig. 1). During the studyperiod, Salmonella Concord was isolated from 12 persons inAustria, 3 in Denmark, 9 in England (and Wales), 2 in Ireland, and4 in the Netherlands. Gender were known for 67 patients; 41 (61%)were female. Age was known for 75 patients. The median age was
A
0
200
400
600
800
1000
1200
1400
Num
ber o
f Eth
iopi
an a
dopt
ees The United States
Europe
B
0
5
10
15
20
25
30
2003 2004 2005 2006 2007
Num
ber o
f Salmonella
Con
cord
isol
ates
iden
tifie
d
The United StatesEurope
FIGURE 1. Number of children adopted from Ethiopia (A) and number of reported laboratory-confirmed cases of Salmonellaserotype Concord (B) per year in participating countries in Europe* and the United States, 2003–2007. *No adoption data wereavailable for Austria. References: http://www.adoptionsnaevnet.dk/; http://travel.state.gov/family/adoption/notices/notices_473.html; http://www.adoptie.nl/; http://www.adoptionboard.ie/; http://www.dfes.gov.uk/intercountryadoption/general.shtml.
The Pediatric Infectious Disease Journal • Volume 28, Number 9, September 2009 Salmonella in Adoptees From Ethiopia
© 2009 Lippincott Williams & Wilkins www.pidj.com | 815
12 months (range: 2 months–76 years); 56 (75%) were �3 years ofage and 11 (15%) were �18 years of age. Adoption status wasknown for 44 (79%) of the patients �3 years of age; of these, 43(98%) were adopted. The patient who was �3 years of age andwas not adopted was a sibling of a child adopted from Ethiopia. All43 adopted children were from Ethiopia except for 1 child whowas adopted from an unspecified African country. Of the 43adopted children, 10 adopted children were brought to Austria and33 to the other participating countries (29 to the United States, 3 toDenmark, and 1 to England). Six (54%) patients �18 years of agewere female; of these, 2 were mothers of children adopted fromEthiopia.
We interviewed patients or parents for 31 (61%) of the 51patients in Denmark and the United States. Among the 25 inter-viewed patients �3 years of age, 24 (96%) were adopted fromEthiopia. For the children adopted from Ethiopia, the median timein one or more orphanages in Ethiopia was 3 months (range: 1–6.5months). Stool specimens which yielded Salmonella Concord fromthe children adopted from Ethiopia were collected an average of 32days following adoption (range: 2–185 days). Six (25%) of thechildren adopted from Ethiopia were asymptomatic at the time ofadoption and specimen collection; 1 asymptomatic child had astool specimen cultured because of an ill sibling, and 5 asymp-tomatic children had stool specimens cultured resulting fromrecommendations by his or her pediatrician. Eighteen (75%) of thechildren adopted from Ethiopia were symptomatic at the time ofadoption; all had diarrhea, 7 (39%) had fever; 4 (22%) had bloodydiarrhea, and 3 (17%) were hospitalized. Median duration ofillness was 11 days (range: 5–90 days). One child received anti-microbial agents after illness onset and before specimen collection.Information regarding the adoption agency in Ethiopia was re-ported for 18 (75%) of the adopted children; the children wereadopted from 8 different orphanages in Addis Abba, Ethiopia.
A total of 3419 children were adopted from Ethiopia from2003 to 2007 and brought to countries participating in this study(no adoption information was available from Austria); during this5-year period, the number of children adopted from Ethiopiaincreased 527% from 221 adoptions in 2003 to 1385 in 2007. Ofthe 2852 children adopted from Ethiopia and brought to the UnitedStates, 1987 (70%) occurred in the last 2 years. Of the 567 childrenadopted from Ethiopia and brought to 1 of the 4 Europeancountries with adoption information participating in this study, 233(41%) occurred in the last 2 years. During the study period, 188children adopted from Ethiopia were brought to Denmark, 14 toEngland (and Wales), 66 to Ireland, and 299 to the Netherlands(Fig. 1).
Two orphanages in Ethiopia from where at least 3 patientswere adopted were visited. Children at the orphanages were mostcommonly abandoned at police stations shortly after birth. Familyor medical history before arrival at the orphanage was seldomknown. Children typically stayed at the orphanages for at least 3months before being adopted or sent to another agency. Poorhygiene and sanitation was observed at the orphanages. Cases ofdehydration and diarrhea were reported among the children in theorphanages. According to physicians at the orphanages, youngchildren in the orphanages were typically treated for diarrhea withceftriaxone, gentamicin and sulfamethoxazole, or with tri-methoprim and sulfamethoxazole; older children received cipro-floxacin.
LaboratorySalmonella Concord isolates from 64 (82%) of the 78
patients were subtyped by PFGE. Fifty-three unique XbaI PFGEpatterns were observed (Fig., Supplemental Digital Content 2,http://links.lww.com/INF/A145). There were 6 PFGE patterns
with �2 indistinguishable isolates. The pattern with the mostindistinguishable isolates included those from 7 children of whichat least 5 isolates were from children adopted from Ethiopia. Eachof the remaining 5 patterns with �2 indistinguishable isolatesincluded at least 1 isolate from a child adopted from Ethiopiaincluding 1 pattern with indistinguishable isolates from a childadopted from Ethiopia and his adopted mother.
Isolates were available for antimicrobial susceptibility test-ing for 43 (55%) of the 78 patients; 8 (19%) were susceptible to allagents and 35 (81%) were multidrug-resistant. Travel history wasknown for 4 of the patients infected with pansusceptible Salmo-nella Concord. None reported associations with Ethiopia but allwere adults who traveled to Kenya before illness onset; one adultalso traveled to South Africa, Zambia, and Malawi. Travel oradoption status was known for 30 of the 35 patients infected withmultidrug-resistant isolates. All were either from or associatedwith a child adopted from Ethiopia. All multidrug-resistant isolateswere resistant to ampicillin, aztreonam, cefazolin, cefepime, cef-podoxime, ceftazidime, ceftiofur, cefuroxime, cephalothin chlor-amphenicol, streptomycin, sulfamethoxazole, and trimethoprim.All multidrug-resistant isolates also had decreased susceptibility toceftriaxone; 34 (97%) were ceftriaxone-resistant. Of the multi-drug-resistant isolates, 34 (97%) were resistant to gentamicin, 24(69%) were resistant to tetracycline, and 6 (14%) showed de-creased susceptibility to ciprofloxacin.
At least 1 isolate was available for antimicrobial suscepti-bility testing from 3 of the 6 PFGE patterns with �2 indistinguish-able isolates; each of these available isolates was multidrug-resistant and was from a child adopted from Ethiopia.
All 35 multidrug-resistant isolates harbored a blaTEM geneand blaCTX gene; sequence analysis of the PCR products showed100% identity to blaTEM-1b and blaCTX-M-15, respectively. Of themultidrug-resistant isolates, 13 (37%) also harbored the blaSHV
gene; sequence analysis revealed 100% identity to blaSHV-12. Ninemultidrug-resistant isolates were selected for conjugation studies.Five transconjugants were successfully recovered yielding thesame susceptibility pattern as the donors. After digestion with S1enzyme and PFGE, a plasmid of approximately 380 kb. wasobserved. Two isolates yielded transconjugants with less resistancethan the donors (resulted in limited resistance to ampicillin, ceph-alothin, cefpodoxime, and ceftiofur). After digestion with S1 andPFGE, a single plasmid of approximately 80 kb was observed inthese 2 isolates. PCR confirmed the presence of the genes blaCTX
and the blaSHV in all transconjugants.The 6 multidrug isolates with decreased susceptibility to
ciprofloxacin were characterized. Three isolates were indistin-guishable by PFGE and contained the plasmid mediated quinoloneresistance gene qnrB; these isolates were isolated from childrenadopted from Ethiopia and brought to the United States. Twoisolates with different PFGE patterns contained the quinoloneresistance gene qnrA gene; these isolates were isolated fromchildren adopted from Ethiopia and brought to Austria. The re-maining isolate had a single base substitution in the gyrA gene atcodon 83 (�TCC {Ser} 3 TTC {Phe}�); this isolate was from a1-year old child in the United Kingdom with an unknown adoptionhistory.
DISCUSSIONIn this multinational study, we demonstrate that multidrug-
resistant Salmonella Concord infections are common among chil-dren adopted from Ethiopia. We found that from 2003 to 2007, atleast 33 (1.0%) of the 3419 children adopted from Ethiopia andbrought to the United States and 4 European countries had alaboratory-confirmed Salmonella Concord infection. In the United
Hendriksen et al The Pediatric Infectious Disease Journal • Volume 28, Number 9, September 2009
© 2009 Lippincott Williams & Wilkins816 | www.pidj.com
States alone the number was 24 cases of 2852 (0.8%) Ethiopianadoptees. Most of these infected children were symptomatic, somewith severe symptoms. Since only a fraction of Salmonella infec-tions are laboratory-confirmed, these data suggest a remarkablyhigh incidence of Salmonella infection among children in orphan-ages in Ethiopia. It is not known how long this Salmonella strainhas been present in these orphanages, but the diversity of PFGEpatterns (no indication of temporal evolution among the patterns)among the children adopted from Ethiopia and the adoption ofinfected children from at least 8 orphanages in Ethiopia indicatesan endemic problem in Ethiopian orphanages. The increasingisolation of this strain in the United States and Europe likelyreflects that increasing frequency of adoption of children fromEthiopia. Ethiopia was the fourth most common country of originfor adoptions in Denmark and the United States in 2007 followingChina, Vietnam and South Africa in Denmark (Available at:http://www.adoptionsnaevnet.dk), and China, Guatemala and Rus-sia in the United States (Available at: http://travel.state.gov/family/adoption/stats/stats_451.html).
The highly resistant nature of the Salmonella Concordisolates from children adopted from Ethiopia makes antimicrobialtreatment difficult. Although antimicrobial agents are not neces-sary for the treatment of most Salmonella infections, antimicrobialtreatment can be life-saving in severe infections.4,5 All of theisolates from children adopted from Ethiopia were resistant to 19antimicrobial agents including all antimicrobial agents commonlyused to treat Salmonella infections in children. Furthermore, someof the isolates from children adopted from Ethiopia had decreasedsusceptibility to ciprofloxacin; treatment of such infections withfluoroquinolones is not advised because such treatment has beenassociated with treatment failures.19,20
The highly resistant isolates from children adopted fromEthiopia illuminates the need for more appropriate use of antimi-crobial agents in orphanages in Ethiopia. The empiric treatment ofchildren with diarrhea at the orphanages with a combination ofceftriaxone, gentamicin, and sulfamethoxazole is particularly wor-risome. It is not known if other countries have similar endemicSalmonella problems in orphanages but the transmission of mul-tidrug-resistant Salmonella has been reported in orphanages inother countries in Africa; in a similar study of multidrug-resistantSalmonella Babelsberg and Salmonella Enteritidis infections inFrance among children adopted from Mali, the highly resistantnature of the isolates was thought to be due to the heavy use ofantimicrobial agents in orphanages in Mali.21 Preventing furtherinfections in orphanages in Ethiopia and elsewhere should focuson improvements in hygiene and sanitation. The highly resistantnature of Salmonella Concord in the orphanages in Ethiopiademonstrates the difficulties in controlling such infections usingantimicrobial agents. Treatment of children with diarrhea shouldfocus on supportive care particularly rehydration. Antimicrobialagents should be reserved for treatment of patients at risk forserious infections or with systemic symptoms.
This study provides useful information for parents adoptingchildren from Ethiopia and perhaps elsewhere. The AmericanAcademy of Pediatrics recommends that a stool specimen becollected from all adopted children and cultured for bacterialpathogens including Salmonella.22–24 Adherence to this recom-mendation identified Salmonella. Concord infections in severalasymptomatic children adopted from Ethiopia. The utility of thisrecommendation was highlighted in this study since we identifiedseveral instances in which family members were infected withSalmonella Concord which was apparently introduced into thefamily from an adopted child. Furthermore, considering the alarm-ingly high frequency of antimicrobial resistance among the Sal-
monella Concord isolates from adopted children in this studyincluding resistance to third and fourth generation cephalosporinsand ciprofloxacin, it may be useful to test Salmonella isolatesisolated from adopted children for antimicrobial susceptibility.
ACKNOWLEDGMENTSThe authors thank Berith Kummerfeldt, Christina Svendsen,
Jacob Dyring Jensen, Vibeke Hansen, and the Zoonosis laboratory(DTU-Food) for their outstanding technical assistance. In addi-tion, the authors also like to thank Katharina E.P. Olsen andIngrid B. Jensen (SSI) for providing strains and data of infectionsin patients in Denmark.
REFERENCES1. Voetsch AC, Van Gilder TJ, Angulo FJ, et al. FoodNet estimate of the
burden of illness caused by nontyphoidal Salmonella infections in theUnited States. Clin Infect Dis. 2004;38:127–134.
2. Galanis E, Lo Fo Wong DM, Patrick ME, et al. Web-based surveillance andglobal Salmonella distribution, 2000–2002. Emerg Infect Dis. 2006;12:381–388.
3. Helms M, Ethelberg S, Mølbak K; DT104 Study Group. InternationalSalmonella Typhimurium DT104 infections, 1992–2001. Emerg Infect Dis.2005;6:859–867.
4. Grohskopf LA, Huskins WC, Sinkowitz-Cochran RL, et al. Use of antimi-crobial agents in United States neonatal and pediatric intensive care pa-tients. Pediatr Infect Dis J. 2005;24:766–773.
5. Hohmann EL. Nontyphoidal salmonellosis. Clin Infect Dis. 2001;2:263–269.
6. Varma JK, Molbak K, Barrett TJ, et al. Antimicrobial-resistant nontyphoi-dal Salmonella is associated with excess bloodstream infections and hos-pitalizations. J Infect Dis. 2005;191:554–561.
7. Helms M, Simonsen J, Mølbak K. Quinolone resistance is associated withincreased risk of invasive illness or death during infection with Salmonellaserotype Typhimurium. J Infect Dis. 2004;190:1652–1654.
8. Helms M, Vastrup P, Gerner-Smidt P, et al. Excess mortality associatedwith antimicrobial drug–resistant Salmonella Typhimurium. Emerg InfectDis. 2002;8:490–495.
9. Morris D, Whelan M, Corbett-Feeney G, et al. First report of extended-spectrum-beta-lactamase-producing Salmonella enterica isolates in Ireland.Antimicrob Agents Chemother. 2006;50:1608–1609.
10. Cattoir V, Weill FX, Poirel L, et al. Prevalence of qnr genes in Salmonellain France. J Antimicrob Chemother. 2007;59:751–754.
11. Popoff MY, Le Minor L. Antigenic Formulas of the Salmonella Serovars.8th ed. Paris, France: WHO Collaborating Centre for Reference andResearch on Salmonella, Institute Pasteur; 2001.
12. Ribot EM, Fair MA, Gautom R, et al. Standardization of pulsed-field gelelectrophoresis protocols for the subtyping of Escherichia coli O157:H7, Salmonella, and Shigella for PulseNet. Foodborne Pathog Dis.2006;3:59 – 67.
13. Hendriksen RS, Bangtrakulnonth A, Pulsrikarn C, et al. Antimicrobialresistance and molecular epidemiology of Salmonella Rissen from animals,food products and patients in Thailand and Denmark. Foodborne PathogDis. 2008;5:605–619.
14. Clinical and Laboratory Standards Institute. Methods for Dilution Antimi-crobial Susceptibility Tests for Bacteria That Grow Aerobically. 7th ed.Wayne, PA: Clinical and Laboratory Standards Institute; 2006. ApprovedStandard M07-A7.
15. Clinical and Laboratory Standards Institute. Performance Standards forAntimicrobial Susceptibility Testing, 18th Informational Supplement.Wayne, PA: Clinical and Laboratory Standards Institute; 2008. M100-S16.
16. Clinical Laboratory Standards Institute. Performance Standards for Anti-microbial Disk and Dilution Susceptibility Tests for Bacteria Isolated FromAnimals. 3rd ed. Wayne, PA: Clinical and Laboratory Standards Institute;2008. Approved Standard M31-A3.
17. Rice R, Bonomo RA. Genetic and biochemical mechanism of bacterial resis-tance to antimicrobial agents. In: Lorian V, ed. Antibiotics in LaboratoryMedicine. 4th ed. Baltimore, MD: Williams and Wilkins; 1996:453–501.
18. Olsen JE, Brown DJ, Thomsen LE, et al. Differences in the carriage and theability to utilize the serotype associated virulence plasmid in strains of Salmo-nella enterica serotype Typhimurium investigated by use of a self-transferablevirulence plasmid, pOG669. Microb Pathog. 2004;36:337–347.
The Pediatric Infectious Disease Journal • Volume 28, Number 9, September 2009 Salmonella in Adoptees From Ethiopia
© 2009 Lippincott Williams & Wilkins www.pidj.com | 817
19. Aarestrup FM, Wiuff C, Mølbak K, et al. Is it time to change fluoroquin-olone breakpoints for Salmonella spp? Antimicrob Agents Chemother.2003;2:827–829.
20. Crump JA, Kretsinger K, Gay K, et al. Clinical response and outcome ofinfection with Salmonella enterica serotype Typhi with decreased suscep-tibility to fluoroquinolones: a United States foodnet multicenter retrospec-tive cohort study. Antimicrob Agents Chemother. 2008;4:1278–1284.
21. Weill FX, Demartin M, Tande D, et al. SHV-12-like extended-spectrum-beta-lactamase-producing strains of Salmonella enterica serotypes Babels-
berg and Enteritidis isolated in France among infants adopted from Mali.J Clin Microbiol. 2004;42:2432–2437.
22. Hostetter MK, Iverson S, Thomas W, et al. Medical evaluation of interna-tionally adopted children. N Engl J Med. 1991;325:479–485.
23. Nicholson AJ, Francis BM, Mulholland EK, et al. Health screening ofinternational adoptees: evaluation of a hospital based clinic. Med J Aust.1992;156:377–379.
24. Stauffer WM, Kamat D, Walker PF. Screening of international immigrants,refugees, and adoptees. Prim Care. 2002;29:879–905.
Hendriksen et al The Pediatric Infectious Disease Journal • Volume 28, Number 9, September 2009
© 2009 Lippincott Williams & Wilkins818 | www.pidj.com
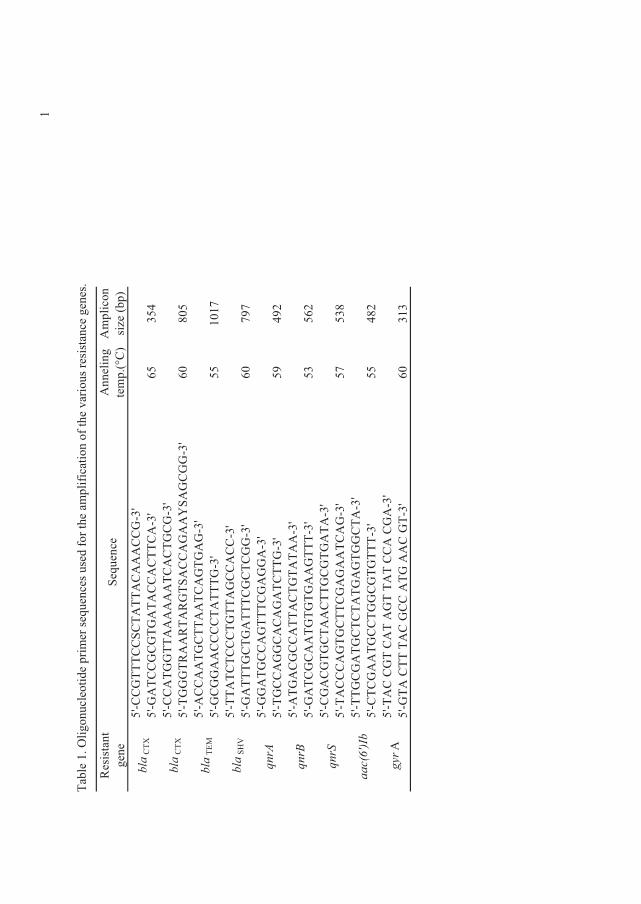
��
0�,������+�
��(���'��$��
�����
E���(����
��'�-��������$�-(��
��-���
��2��
�����
�����(�� ������
���������
���
��E�
��(�
���
��� �
���$�H[&I
��$�(�
��5��H,
$I@\;&
&400
0&&�&
0�00
�&���&&4;!\
@\;4
�0&
&4&404
�0�
&&�&00
&�;!\
@\;&
&�04
400
������0&
�&04
&4;!\
@\;04440�
���0�
�40�
�&&�4��V��
4&44;!\
@\;�
&&��04
&00
��0&
�404
�4;!\
@\;4
&44��&&&&0�
0004
;!\
@\;00�
0&0&
&&04
00�4&&�&&;!\
@\;4
�00
04&04
�00
0&4&0&
44;!\
@\;4
4�04
&&�400
0&4�44�;!\
@\;04&&�44&�&�4�0&
004;!\
@\;�
04�&4&&�00
�&04
0�0�
�;!\
@\;4
�0&
4&��04
0404
��400
0;!\
@\;&
4�&404
&0�
�&00
4&404
�0�
;!\
@\;0�&&&�404
&00
&4�4��0&
�4;!\
@\;004
&4�04
&0&
0�04
�404
4&0�
;!\
@\;&
0&4��04
&&04
4&404
000;!\
@\;0�&�&40�&�0��40�0�
0�&&��&4�;!\
@\;4
0��&00
�0�&�4
&&��
04���&�4
0;!\
B=!�
!
?A�
@B�
@!A
?<�
B=A=
@
�=�:
:<:
@< @@B=@@
���+
8F, �
B��0
B���
!@?
B@
����
��
&0X
��
&0X
��
03�
��
�%
B���
@:@!
�� � � � � � �
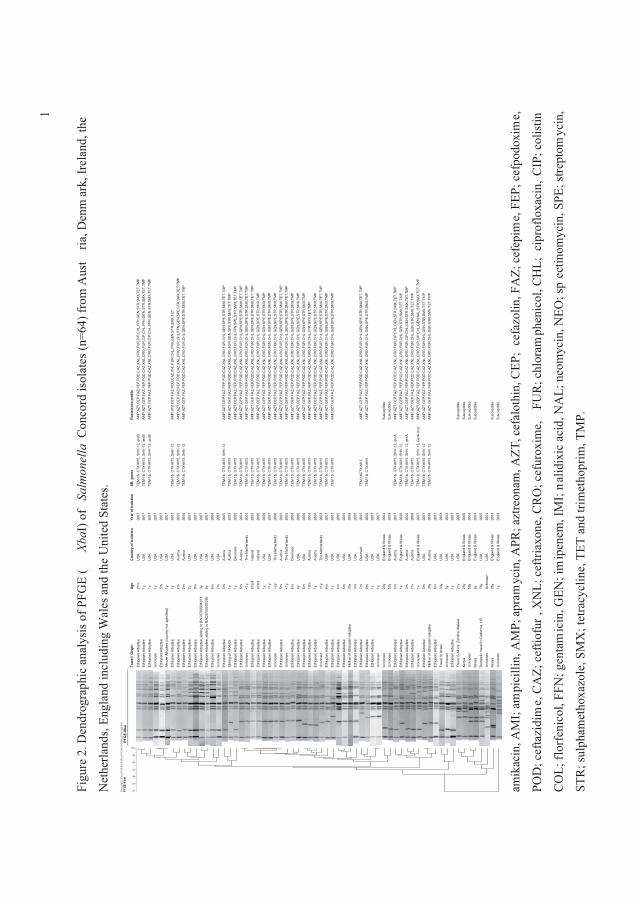
��
� �
�������
��'�
��$�
(�����/���
-�.�4
3�H
&��*I�
-���
���
��
�&�
(�'��������H�
QB?I�-��
�����
�����
���
�����*�����'����
��
)�������
�'���3�
���'��(��'
� ���������'
�����1���'����������
Dic
e (O
pt:0
.35%
) (To
l 0.9
%-0
.9%
) (H
>0.0
% S
>0.0
%) [
0.0%
-100
.0%
]P
FGE
-Xba
I
100
90
80
70
60
50
40
PFG
E-Xb
aI
Trav
el /
Orig
in
Ethi
opia
n A
dopt
eeEt
hiop
ian
Ado
ptee
Ethi
opia
n A
dopt
eeU
nkno
wn
Ethi
opia
n A
dopt
eeAf
rican
Ado
ptee
(cou
ntry
not
spe
cifie
d)Et
hiop
ian
Ado
ptee
Ethi
opia
n A
dopt
eeEt
hiop
ian
Ado
ptee
Ethi
opia
n A
dopt
eeEt
hiop
ian
Ado
ptee
Ethi
opia
n A
dopt
ee, s
iblin
g to
BAC
0700
0043
11Et
hiop
ian
Ado
ptee
, sib
ling
to B
AC07
0000
3260
Ethi
opia
n A
dopt
eeU
nkno
wn
Ethi
opia
n A
dopt
eeSi
blin
g of
140
4/05
Et
hiop
ian
Ado
ptee
Ethi
opia
n A
dopt
eeU
nkno
wn
Ethi
opia
n A
dopt
eeEt
hiop
ian
Ado
ptee
Ethi
opia
n A
dopt
eeEt
hiop
ian
Ado
ptee
Unk
now
nEt
hiop
ian
Ado
ptee
Unk
now
nEt
hiop
ian
Ado
ptee
Ethi
opia
n A
dopt
eeEt
hiop
ian
Ado
ptee
Ethi
opia
n A
dopt
eeEt
hiop
ian
Ado
ptee
Unk
now
nEt
hiop
ian
Ado
ptee
Ethi
opia
n A
dopt
eeEt
hiop
ian
Ado
ptee
Ethi
opia
n A
dopt
eeM
othe
r of E
thio
pian
ado
ptee
Ethi
opia
n A
dopt
eeEt
hiop
ian
Ado
ptee
Ethi
opia
n A
dopt
eeEt
hiop
ian
Ado
ptee
Unk
now
nU
nkno
wn
Unk
now
nEt
hiop
ian
Ado
ptee
Ethi
opia
n A
dopt
eeEt
hiop
ian
Ado
ptee
Ethi
opia
n A
dopt
eeU
nkno
wn
Ethi
opia
n A
dopt
eeM
othe
r of E
thio
pian
ado
ptee
Ethi
opia
n A
dopt
eeTr
avel
to Is
rael
Unk
now
nEt
hiop
ian
Ado
ptee
Trav
el S
.Afri
ca, Z
ambi
a, M
alaw
iKe
nya
Unk
now
nKe
nya
Dom
estic
trav
el to
Cal
forn
ia, U
SU
nkno
wn
Keny
aU
nkno
wn
Age
21m
1y 1y 1y 5m 1y 1y 4m 2m 2y 9m 3y 5y 8m 7m 3m 1y 1y 6m <1y
infa
ntin
fant
1y <1y
<2y
5m <1y
6m 4y 6m 10m
1y <1y
6m 1y 4m 5m 33y
3m 7m 6m 1y 1y 20y
53y
4m 1y 3m 7m 1y 3m 39y
8m 33y
3y 1y 21y
25y
58y
8y 76y
Unk
now
n26
y1y
Cou
ntry
of i
sola
tion
USA
USA
USA
USA
USA
USA
USA
Aus
tria
Aus
tria
USA
USA
USA
USA
USA
USA
Aus
tria
Aus
tria
Den
mar
kA
ustri
aTh
e N
ethe
rland
sIre
land
Irela
ndU
SAU
SATh
e N
ethe
rland
sA
ustri
aTh
e N
ethe
rland
sD
enm
ark
USA
USA
Aus
tria
Aus
tria
The
Net
herla
nds
USA
USA
USA
USA
USA
USA
Den
mar
kU
SAU
SAU
SAE
ngla
nd &
Wal
esE
ngla
nd &
Wal
esA
ustri
aE
ngla
nd &
Wal
esA
ustri
aA
ustri
aE
ngla
nd &
Wal
esU
SAA
ustri
aU
SAU
SAU
SAU
SAU
SAE
ngla
nd &
Wal
esE
ngla
nd &
Wal
esE
ngla
nd &
Wal
esU
SAU
SAE
ngla
nd &
Wal
esE
ngla
nd &
Wal
es
Year
of i
sola
tion
2007
2007
2007
2007
2007
2007
2007
2005
2005
2007
2007
2007
2007
2006
2007
2005
2005
2005
2004
2004
2005
2006
2006
2007
2006
2005
2005
2006
2006
2006
2004
2004
2003
2007
2007
2005
2005
2006
2005
2005
2006
2007
2007
2004
2005
2007
2006
2006
2006
2007
2007
2006
2007
2003
2003
2007
2007
2006
2004
2004
2005
2004
2004
2004
AR. g
enes
TEM
-1b,
CTX
-M15
, SH
V-1
2, q
nrB
TEM
-1b,
CTX
-M15
, SH
V-1
2, q
nrB
TEM
-1b,
CTX
-M15
, SH
V-1
2, q
nrB
TEM
-1b,
CTX
-M15
, SH
V-1
2TE
M-1
b, C
TX-M
15, S
HV
-12
TEM
-1b,
CTX
-M15
, SH
V-1
2
TEM
-1b,
CTX
-M15
, SH
V-1
2TE
M-1
b, C
TX-M
15TE
M-1
b, C
TX-M
15TE
M-1
b, C
TX-M
15TE
M-1
b, C
TX-M
15TE
M-1
b, C
TX-M
15TE
M-1
b, C
TX-M
15TE
M-1
b, C
TX-M
15TE
M-1
b, C
TX-M
15TE
M-1
b, C
TX-M
15TE
M-1
b, C
TX-M
15TE
M-1
b, C
TX-M
15TE
M-1
b, C
TX-M
15TE
M-1
b, C
TX-M
15TE
M-1
b, C
TX-M
15TE
M-1
b, C
TX-M
15TE
M-1
b, C
TX-M
15TE
M-1
b, C
TX-M
15TE
M-1
b, C
TX-M
15TE
M-1
b, C
TX-M
15
TEM
-1bC
TX-M
15TE
M-1
b, C
TX-M
15
TEM
-1b,
CTX
-M15
, SH
V-1
2, q
nrA
TEM
-1b,
CTX
-M15
, SH
V-1
2TE
M-1
b, C
TX-M
15, S
HV
-12,
qnr
ATE
M-1
b, C
TX-M
15TE
M-1
b, C
TX-M
15, S
HV
-12,
Gyr
A-m
utTE
M-1
b, C
TX-M
15, S
HV
-12
TEM
-1b,
CTX
-M15
, SH
V-1
2
Res
ista
nce
prof
ile
AM
P,A
ZT,C
EP
,FA
Z,FE
P,P
OD
,CAZ
,XN
L,C
RO
,FU
R,C
IP,C
HL,
FFN
,GE
N,S
TR,S
MX,
TET,
TMP
AM
P,A
ZT,C
EP
,FA
Z,FE
P,P
OD
,CAZ
,XN
L,C
RO
,FU
R,C
IP,C
HL,
FFN
,GE
N,S
TR,S
MX,
TET,
TMP
AM
P,A
ZT,C
EP
,FA
Z,FE
P,P
OD
,CAZ
,XN
L,C
RO
,FU
R,C
IP,C
HL,
FFN
,GE
N,S
TR,S
MX,
TET,
TMP
AM
P,A
TZ,C
EP
,FA
Z,P
OD
,CAZ
,XN
L,F
UR
,CH
L,FF
N,G
EN,S
TR,S
MX
,TET
AM
P,A
ZT,C
EP
,FA
Z,FE
P,P
OD
,CAZ
,XN
L,C
RO
,FU
R,C
HL,
FFN
,GE
N,S
PE
,STR
,SM
X,T
ET,
TMP
AM
P,A
ZT,C
EP
,FA
Z,FE
P,P
OD
,CAZ
,XN
L,C
RO
,FU
R,C
HL,
GEN
,SP
E,S
TR,S
MX,
TET,
TMP
AM
P,A
ZT,C
EP
,FA
Z,FE
P,P
OD
,CAZ
,XN
L,C
RO
,FU
R,C
HL,
GEN
,SP
E,S
TR,S
MX,
TET,
TMP
AM
P,A
ZT,C
EP
,FA
Z,FE
P,P
OD
,CAZ
,XN
L,C
RO
,FU
R,G
EN
,SP
E,S
TR,S
MX,
TET,
TMP
AM
P,A
ZT,C
EP
,FA
Z,FE
P,P
OD
,CAZ
,XN
L,C
RO
,FU
R,C
HL,
FFN
,SPE
,ST
R,S
MX,
TET,
TM
PA
MP
,AZT
,CE
P,F
AZ,
FEP,
PO
D,C
AZ,X
NL,
CR
O,F
UR
,CH
L,G
EN,S
PE,
STR
,SM
X,TE
T,TM
PA
MP
,AZT
,CE
P,F
AZ,
FEP,
PO
D,C
AZ,X
NL,
CR
O,F
UR
,CH
L,G
EN,S
PE,
STR
,SM
X,TE
T,TM
PA
MP
,AZT
,CE
P,F
AZ,
FEP,
PO
D,C
AZ,X
NL,
CR
O,F
UR
,CH
L,G
EN,S
PE,
STR
,SM
X,TE
T,TM
PA
MP
,AZT
,CE
P,F
AZ,
FEP,
PO
D,C
AZ,X
NL,
CR
O,F
UR
,CH
L,G
EN,S
PE,
STR
,SM
X,TM
PA
MP
,AZT
,CE
P,F
AZ,
FEP,
PO
D,C
AZ,X
NL,
CR
O,F
UR
,CH
L,G
EN,S
PE,
STR
,SM
X,TM
PA
MP
,AZT
,CE
P,F
AZ,
FEP,
PO
D,C
AZ,X
NL,
CR
O,F
UR
,CH
L,G
EN,S
PE,
STR
,SM
X,TM
PA
MP
,AZT
,CE
P,F
AZ,
FEP,
PO
D,C
AZ,X
NL,
CR
O,F
UR
,CH
L,G
EN,S
PE,
STR
,SM
X,TM
PA
MP
,AZT
,CE
P,F
AZ,
FEP,
PO
D,C
AZ,X
NL,
CR
O,F
UR
,CH
L,G
EN,S
PE,
STR
,SM
X,TE
T,TM
PA
MP
,AZT
,CE
P,F
AZ,
FEP,
PO
D,C
AZ,X
NL,
CR
O,F
UR
,CH
L,G
EN,S
PE,
STR
,SM
X,TE
T,TM
PA
MP
,AZT
,CE
P,F
AZ,
FEP,
PO
D,C
AZ,X
NL,
CR
O,F
UR
,CH
L,G
EN,S
PE,
STR
,SM
X,TM
PA
MP
,AZT
,CE
P,F
AZ,
FEP,
PO
D,C
AZ,X
NL,
CR
O,F
UR
,CH
L,G
EN,S
PE,
STR
,SM
X,TM
PA
MP
,AZT
,CE
P,F
AZ,
FEP,
PO
D,C
AZ,X
NL,
CR
O,F
UR
,CH
L,G
EN,S
PE,
STR
,SM
X,TM
PA
MP
,AZT
,CE
P,F
AZ,
FEP,
PO
D,C
AZ,X
NL,
CR
O,F
UR
,CH
L,S
TR,S
MX,
TET,
TMP
AM
P,A
ZT,C
EP
,FA
Z,FE
P,P
OD
,CAZ
,XN
L,C
RO
,FU
R,C
HL,
GEN
,SP
E,S
TR,S
MX,
TMP
AM
P,A
ZT,C
EP
,FA
Z,FE
P,P
OD
,CAZ
,XN
L,C
RO
,FU
R,C
HL,
GEN
,SP
E,S
TR,S
MX,
TET,
TMP
AM
P,A
ZT,C
EP
,FA
Z,FE
P,P
OD
,CAZ
,XN
L,C
RO
,FU
R,C
HL,
GEN
,SP
E,S
TR,S
MX,
TMP
AM
P,A
ZT,C
EP
,FA
Z,FE
P,P
OD
,CAZ
,XN
L,C
RO
,FU
R,C
HL,
GEN
,SP
E,S
TR,S
MX,
TMP
AM
P,A
ZT,C
EP
,FA
Z,FE
P,P
OD
,CAZ
,XN
L,C
RO
,FU
R,C
HL,
GEN
,SP
E,S
TR,S
MX,
TET,
TMP
AM
P,A
ZT,C
EP
,FA
Z,FE
P,P
OD
,CAZ
,XN
L,C
RO
,FU
R,C
HL,
GEN
,SP
E,S
TR,S
MX,
TMP
Sus
cept
ible
Sus
cept
ible
AM
P,A
ZT,C
EP
,FA
Z,FE
P,P
OD
,CAZ
,XN
L,C
RO
,FU
R,C
IP,C
HL,
GE
N,S
TR,S
MX
,TET
,TM
PA
MP
,AZT
,CE
P,F
AZ,
FEP,
PO
D,C
AZ,X
NL,
CR
O,F
UR
,CH
L,G
EN,S
TR,S
MX
,TET
,TM
PA
MP
,AZT
,CE
P,F
AZ,
FEP,
PO
D,C
AZ,X
NL,
CR
O,F
UR
,CIP
,CH
L,G
EN
,STR
,SM
X,T
ET,T
MP
AM
P,A
ZT,C
EP
,FA
Z,FE
P,P
OD
,CAZ
,XN
L,C
RO
,FU
R,C
HL,
GEN
,STR
,SM
X,T
ET,T
MP
AM
P,A
ZT,C
EP
,FA
Z,FE
P,P
OD
,CAZ
,XN
L,C
RO
,FU
R,C
IP,C
HL,
GE
N,N
AL,
STR
,SM
X,TE
T,TM
PA
MP
,AZT
,CE
P,F
AZ,
FEP,
PO
D,C
AZ,X
NL,
CR
O,F
UR
,CH
L,G
EN,S
TR,S
MX
,TET
,TM
PA
MP
,AZT
,CE
P,F
AZ,
FEP,
PO
D,C
AZ,X
NL,
CR
O,F
UR
,CH
L,G
EN,S
TR,S
MX
,TET
,TM
P
Sus
cept
ible
Sus
cept
ible
Sus
cept
ible
Sus
cept
ible
Sus
cept
ible
Sus
cept
ible
�
�
� � � � � � � � � � �
� �
� � �
����(����
�*F���
$(�������.F��$���
/(����
.�F��5����
�����
60��(�-�������&3.
F�(�-�5��
����6F�(�-�$�
����3.
F�(�-$
'C����
.+�F�(�-��5'����&�6F�(�-�
-����X)�F�(�-���C�
���&�+F�(�-��C
�����1
�F�(�����
$���(���&
%�F�($�-�
C�(���&
*.F�(����
�
&+�F�-��-��(�����
)F�
�����(���4
3)F��$����
��*�*F���
�'C(��('��)��F����/(���)
3+F��$�(��
�/(����
.3F�����
$��
/(���
�0�F����$�
�����
C�5�����
�XF������(/(�����030
���'
����
���
$��
��0�.��
�
�
Article V
Molecular characterization of extended spectrum cephalosporinases (ESC) producing
Salmonella Choleraesuis from patients in Thailand and Denmark
�
.���$���(������%�����%��������&������.��������!��%�����&�����(�U���/'��?��#�� ���
��������]?��������.������ �� !������"�� ����������@�������������������$���Rene
S. Hendriksen1*
����%+�&���,���� �&������-������(�,����������(�����'�,����.��� ������'�31�
&�����/���-����(����,����/�-������(�,����������(���)�������'�*���������
0�(��(���1�2����/�-����������"8���2�9��:����;�:<=�&$���� ��� �������������� ������'(����(��(���&������������� ���������$��������-���'(����(��(����
�����/�-�.�,�(�%�������������� �������0�����'��
!��%+�)����������������'�������&�������)������*��������-�%���������$��������-�
��'(����(��(���������/�-�.�,�(�%�������"�� ����0�����'�?����,� �%�$������������1�2����/�%�$�������$��������-�&��(����(�,� /��
���,� �����������@��� ������'(����(��(��&�����������������$��������-���'(����(��(���������/�-�
.�,�(�%����������������0�����'��
�
�&����$�'� ������7� Rene S. Hendriksen,�
� �� �)���a���'�*���������0�(��(���1�2����/�-���������
� ��� "8l��2�9��:����;�:<=�&$���� ��� ����������
� ��� .��e7�>?@�:��!?�B=�==�
� � � � ��C7�>?@�:��!?�B=�=��
� ��� 3;�a�7�����D-'�'���'��
Submitted to Journal of Clinical Microbiology
AR
TIC
LE
V

)�������� ����"�#���������$����%���������
Molecular characterization of extended spectrum cephalosporinases (ESC) producing �������
Choleraesuis from patients in Thailand and Denmark
Pantip Sirichote2, Henrik Hasman1, Chaiwat Pulsrikarn3, Henrik Carl Schønheyder4, Jurgita
Samulioniené4, Srirat Pornruangwong 3, Aroon Bangtrakulnonth5, Frank M. Aarestrup1, Rene S.
Hendriksen1*
1 WHO Collaborating Center for Antimicrobial Resistance in Food borne Pathogens and EU
Community Reference Laboratory for Antimicrobial Resistance, National Food Institute,
Technical University of Denmark, Bülowsvej 27, DK-1790 Copenhagen V, Denmark
2 Regional Medical Sciences Center Samutsongkhram, Department of Medical Sciences, Ministry
of Public Health, Samutsongkhram, Thailand.
3 WHO National ������� and ����� Center, National Institute of Health, Department of
Medical Sciences, Ministry of Public Health, Bangkok, Thailand
4 Aalborg Hospital, Aarhus University Hospital, Department of Clinical Microbiology, Aalborg,
Denmark.
5 Regional Medical Science Center Khonkaen, Department of Medical Sciences, Ministry of
Public Health, Khonkaen, Thailand.
*Corresponding author: Rene S. Hendriksen,
National Food Institute, Technical University of Denmark
Bülowsvej 27, DK-1790 Copenhagen V, Denmark
Phone: +45 72 34 60 00
1

Fax: +45 72 34 60 01
E-mail: [email protected]
Running title: Extended spectrum cephalosporinases (ESC) producing Salmonella Choleraesuis
in Thailand and Denmark
Key words: ��������Choleraesuis, bacteremia, extended spectrum cephalosporinases,
antimicrobial resistance, PFGE.
2
ABSTRACT
The objective of this study was to characterize extended spectrum cephalosporinases (ESC)
producing isolates of ��������serovar Choleraesuis recovered from patients in Thailand and
Denmark.
Twenty-four isolates were included in the study, 13 of which were blood culture isolates.
Twenty-three isolates were recovered from Thai patients in 2003, 2007, or 2008 and one isolate
was recovered from a Danish traveller to Thailand. ESC production was confirmed by minimum
inhibitory concentration testing. Micro-array and plasmid profiling (replicon typing and RFLP)
were used to characterize the genetic mechanisms of antimicrobial resistance in the ESC
producing isolates. PFGE was used to compare isolates resistant to third generation
cephalosporins with susceptible isolates from Thailand during the same period.
MIC determination, micro-array, PCR, plasmid profiling and replicon typing revealed the
presence of multi-drug resistant isolates harboring either ��CMY-2 containing incA/C or ��CTX-M-
14 containing incFIIA / incFrepB located on plasmids ranging in size from 75–200 kb. The RFLP
and replicon typing clustered the isolates into four distinct groups. PFGE revealed 16 unique
patterns and five clusters; each cluster contained two to three isolates. The isolate from the
Danish patient was indistinguishable from two Thai clinical isolates.
This study revealed the emergence of the ��CTX-M-14 gene among several clones of �������
serovar Choleraesuis. Numerous plasmids were identified containing up to two different ESC
genes and four distinct replicons. A “travel associated” spread was confirmed. The findings
represent a serious threat to public health for the Thai people and tourists.
3
INTRODUCTION
���������� ���� is a common cause of human gastroenteritis and bacteremia worldwide (15,
29) and a wide variety of animals, particularly food animals, has been identified as reservoirs for
non-Typhi ������� (11, 19, 20). Although approximately 2,600 serovars of ��������
�� ���� have been identified, most human infections are caused by a limited number of serovars
and in general these infections are self-limiting. Some ������� serovars including �
������� Choleraesuis (swine) and ������� Dublin (cattle) which are adapted to a specific
animal hosts, have a propensity to cause extra-intestinal infections in humans. When compared
to other serovars of non-Typhi �������, infections with these serovars are associated with
higher rates of bacteremia, meningitis, and mortality (4, 5, 21). For patients with severe
salmonellosis, antimicrobial chemotherapy may be life-saving. Due to increasing prevalence of
fluorquionolone resistance third generation cephalosporins are increasingly used for the treatment
of �������� infections in humans (14, 18, 22) and these compounds have been designated as
critically important for human health by the World Health Organization (10).
We recently reported that human infections with ��������serovar�Choleraesuis in Thailand
increased from 1.5% in 1993 to 9.2% in 2007 (16). The group of people at highest risk for these
infections was those between 6–40 years of age in the Central region of Thailand (16). A 2007
study of ��������serovar�Choleraesuis isolates from Thailand observed an increasing
resistance to both third generation cephalosporins and fluoroquinolones. Fifty-four isolates
obtained between 2003 and 2005 were tested, of which 30% were found to be resistant to third
generation cephalosporins (22).
4
To date, only two reports, both from Taiwan, have described mechanisms for third generation
cephalosporin resistance in �������� serovar�Choleraesuis. The first report was published in
2004 with the discovery of ��CMY-2 AmpC �-lactamase gene located on a 140 kb F-like plasmid
(6). The following year, the same authors detected ��CTX-M-3 in a �������� serovar�
Choleraesuis� isolate from a patient admitted to a university hospital (28). In 2007, a massive
increase of flouroquinolone and ceftriaxone resistant �������� serovar� Choleraesuis was
described in Thailand (22).
In Taiwan, the usage of antimicrobials in veterinary medicine and as growth promoter in animal
feed may have promoted the emerging of the resistance (5). Likewise, in Thailand, the third
generation cephalosporin ceftiofur is used extensively in the swine production (22).
The objectives of the present study were to determine the genetic diversity and antimicrobial
resistance of extended spectrum cephalosporinases (ESC) producing �������� serovar�
Choleraesuis� isolates from patients in Thailand and Denmark. Additionally, isolates of
�������� serovar� Choleraesuis from Thailand which were resistant to third generation
cephalosporins were compared with susceptible isolates using PFGE.
METHODS
0�� ������� ����
A total of 24 isolates were included in this study. Twenty-three isolates were recovered in
Thailand and one ESC producing isolate was recovered in 2008 at Aalborg Hospital, Aarhus
University Hospital, Denmark. The WHO National ������� and ������Center in Bangkok
receives all presumptive isolates of ��������spp. from all diagnostic laboratories throughout
Thailand. In 2003, as part of another study, the National Food Institute, Technical University of
5
Denmark (DTU-Food) received 82 isolates of ��������serovar�Choleraesuis which were
recovered from Thai patients. (1). In 2008, this collection was screened for the presence of ESC
producing isolates and two ESC producing strains, both isolated in 2003, were identified. DTU-
Food received 12 isolates of ��������serovar�Choleraesuis in 2008, ten isolates were ESC
producers isolated in 2008 from Thai patients at the Regional Medical Sciences Center in
Samutsongkhram, Thailand.
In addition, to assess the genetic diversity of ��������serovar�Choleraesuis in Thailand, nine
isolates from Thailand which were susceptible to third generation cephalosporins were included
in the study. These susceptible isolates were isolated from patients in Bangkok and were
randomly selected from the collection.
���� �����
The isolates were serotyped using slide agglutination in the country of origin.
O and H antigens were characterized by agglutination with hyperimmune sera (S & A reagents
lab, Ltd, Bangkok, Thailand and Statens Serum Institute, Copenhagen, Denmark) and serotype
was assigned according to the Kauffmann-White scheme (13).
�� ������������� � �� �� ���
Minimum inhibitory concentration testing of the 13 ESC producing isolates was performed at the
DTU-Food using previously described methods (17). Results were primarily interpreted using
current European Committee on Antimicrobial Susceptibility Testing (EUCAST)
(www.eucast.org) and European Food Safety Authority (EFSA) epidemiologic break points (26).
Due to the absence of some break points in the EUCAST system, exceptions were made for the
interpretation of cefepime and ceftriaxone where Clinical and Laboratory Standards Institute
6
guidelines and clinical breakpoints were utilised (7, 8, 9). Quality control using '���� ATCC
25922 was conducted according to CLSI.
%���������
Detection of gene-groups associated with the antimicrobial resistance phenotypes was carried out
using miniaturized microarrays (Identibac Amr-ve Array tubes, New Haw, Addlestore, Surrey,
UK) containing probes for most relevant Gram-negative antimicrobial gene groups (Identibac).
Analysis was performed as described by the manufacturer on the 13 ESC producing isolates.
�
/� �� �������������������������� ����� ���5 ���������� ��������������������
PCR amplification and sequencing of the ��CTX-M-9 group, ��TEM and ��CMY-2 genes were
performed on the 13 isolates using methods described previously (17, 25).
Amplicons produced were selected for sequencing. Prior to sequencing, the amplicons were
purified using the GFX™ PCR DNA kit (GE Healthcare, Chalfont St. Giles, UK) following the
protocol of the manufacturer. The DNA was shipped to Macrogen Inc., Seoul, Korea for
sequencing using the same primers as in the PCR analysis. Sequence analysis and alignment was
performed using Vecton NTI suite 9 (InforMax Inc., Bethesda, Maryland, US) software. The
resulting nucleotide sequences were compared to sequences obtained from the GenBank database
(http://www.lahey.org/studies/webt.html).
������������ ��(� ���
Plasmid DNA was extracted using QIAGEN Plasmid Mini Kit (Qiagen, Hilden, Germany). The
plasmid DNA was transferred into electrocompetent '�����DH10B cells and subjected to S1
nuclease PFGE as described below to ensure that only one plasmid had been transferred into the
7
competent cells as well as to estimate the approximate size of the plasmids carrying the ESC
phenotype. The electroporation was followed by selection of transformants on BHI agar
supplemented with cefotaxime (2 �g/ml). The presence of the plasmid in the transformants was
confirmed by PCR detection of relevant �� genes as described above. Additionally, testing was
performed to determine if any non-ESC resistance determinants co-transferred with the ESC
plasmids. The 13 transformants were analysed by PCR for all relevant resistance genes based on
the results of the Array tube analysis described above. Transformants were further subjected to
replicon PCR and plasmid purification followed by RFLP.
;������ ����
Plasmids within transformants were replicon typed as described previously (2).
���������� ��������������������G��� ���
Plate-mating experiments were performed with transformants as donors and plasmid-free,
rifampicin and nalidixic acid resistant '���� MT102RN as recipients (2, 25). The strains were
grown to both late exponential as well as stationary phase, mixed (1:1) and incubated on solid
blood agar at 37�C for 18 h. Transconjugants were selected on BHI medium supplemented with
50 �g/ml rifampicin, 32 �g/ml nalidixic acid, and 2 �g/ml cefotaxime.
�*����� ��������������(���� ����� ��
PFGE with S1 nuclease (Promega) digestion of whole genomic DNA performed as described
below was used to estimate sizes of larger plasmids. Following pre-incubation for 10 min. in 1:10
diluted S1 buffer, 2 mm slices of PFGE plugs made from cultures with an OD620 of 0.6 were
8
digested with 5 U of S1 (Promega, Madison, US) for 45 min. at 37�C. The slices were post-
incubated on ice for 10 min in 200 μL of ice-cold TE-buffer (10:1), loaded on the gel and run on
a CHEF-DRIII device (Bio-Rad, Hercules, USA) with a pulse time of 6.8 s – 38.4 s at 6 V/cm for
19 h. ���Braenderup H9812 digested with &��I was used as size marker .
�
���������������� ���������
All 24 isolates included this study were analyzed for genetic relatedness by PFGE using &��I
according to the CDC PulseNet protocol (24). The electrophoresis was performed with a CHEF
DR III System (Bio-Rad Laboratories, Hercules, CA, USA) using 1% SeaKem agarose in 0.5×
Tris-borate-EDTA at 180 V. Running conditions consisted of one pulse time of 2.2 - 63.8 s for 22
h at 6 V/cm on a 120 deg. angle in 14°C TBE buffer. Comparison of the PFGE profiles was
performed by using Bionumerics software version 4.6 (Applied Maths, Sint-Martens-Latem,
Belgium) and the dice correlation for band matching with a 0.9 % position tolerance and an
optimization at 0.9 % using both &�� .
RESULTS
'������������ ����� ��������� �� ��
Twelve of the ESC producing isolates from Thai patients were obtained from blood samples;11
of the isolates were obtained in Ratchaburi Province and one was from Bangkok. The 12 isolates
were obtained from 10 patients with two patients each having two positive blood cultures. All
samples were collected between April and May or between August and October. The patients
were unevenly distributed by gender, with eight isolates obtained from males and two from
females. The age of one patient was unknown. However, the age of the remaining nine patients
9
ranged from 17 to 58 years with a median of 34 years. Data on occupation of the patients were
not collected.
'�������������� �� ������� ���/������� �� �
A healthy 37-year old Danish male was on assignment to an industrial company in Bangkok from
July 27 to August 14 in 2008. He resided in a five star international hotel at Sukhumvit Road in
the center of Bangkok and worked full time at the Navanakorn Industrial Estate Zone 3 situated
45 km outside of Bangkok. Meals were primarily served in the hotel and at the work place.
Typical Thai food (soup and rice dishes) was daily consumed and included either fish or minced
pork.
One week before the return to Denmark the patient contracted diarrhoea with an acute onset, but
without blood. The patient was febrile up to 38.8°C with dizziness, cephalgia, and mild muscle
pain. Concurrently, the patient noticed flexor paresis of the interphalangeal joint of the left thumb
accompanied by hypestesia in the C6 dermatome. Except for paresis and hypestesia the
symptoms abated in a few days and the diarrhoea responded to loperamide. However, symptoms
recurred several times and the patient was admitted to a Danish hospital on September 10th with a
weight loss of 11 kg. A blood culture obtained by admission revealed ��������serovar�
Choleraesuis. Fecal cultures during admission were negative.
Empirical antimicrobial treatment included ciprofloxacin and pivmecillinam. Treatment with
meropenem was considered based on the multi-drug resistant phenotype of the isolate, but the
patient felt well and he declined. Eight months later the patient was in good health though the
flexor paresis persisted.
�
�� ����������� ������
10

All of the 13 ESC producing isolates were multi-drug resistant and exhibited resistance to at least
13 of the tested antimicrobials (eight antimicrobial drug classes) (Figure 1). Resistance was not
detected to apramycin (only approved for veterinary use), colistin, imipenem, meropenem and
trimethoprim. All isolates were resistant to ampicillin, cefalothin, cefazolin, cefotaxime,
cefpodoxime, ceftiofur, nalidixic acid, sulphamethoxazole and tetracycline. Twelve isolates
(92%) were resistant to chloramphenicol; four (31%) of these strains also were resistant to
florfenicol (only approved for veterinary use). Resistance to ciprofloxacin was observed in twelve
(92%) isolates, one isolate had a MIC just below the break point of ciprofloxacin. Eleven (85%),
four (31%), four (31%), and four (31%) of the isolates were resistant to the ceftriaxone,
ceftazidime, cefepime, and cefoxitin, respectively (Figure 1). Four isolates (31%) were also
resistant to amoxicillin and clavulanic acid and another six isolates (46%) to gentamicin. Only
two isolates (15%) were resistant to neomycin whereas eleven (85%) and ten (77%) isolates were
resistant to spectinomycin and streptomycin, respectively.
��� ��� ���������� �����������
Based on Array tube analysis and subsequent sequencing of PCR-generated DNA fragments,
eight of the 13 ESC producing isolates harbored the extended spectrum � -lactamase gen group
��CTX – M-9, the chloramphenicol resistance acetyltransferase gen ��A, the sulphonamide
resistance gen ��3, the aminoglycoside resistance gen ���A1, and the tetracycline resistance gen
� B. In addition, five (SH2867/08, SH2868/08, SH2871/08, SH2872/08, 08-120226) of the eight
isolates also harbored the intergase gen � 1.
Of the remaining five isolates, four contained the ��R gen conferring resistance to florfenicol, the
sulphonamide resistance gen ��2, the intergase gen � 1 encoding an intergron, the
aminoglycoside resistance genes � �A and � �B, the plasmidic ampC gen ��CMY, and the
11
tetracycline gen � A. In addition, one (SH508/03) of the four isolates also harbored the � B and
��1 genes. Furthermore, three (SH2870/08, SH2874/08, SH508/03) of the four isolates contained
also the aminoglycoside resistance gen ���A1.
One isolate (SH1208/03) was resistant to sulphamethoxazole and tetracycline containing the ��1
and � B genes, respectively. In addition, this isolate harbored the extended spectrum � -
lactamase gen group ��CTX – M-9 and the ��TEM gen.
The isolates which produced amplicons to ��CTX – M-9 group, ��CMY and ��TEM were sequenced
and showed 100% similarity to strains in the Genbank encoding for ��CTX-M-14 , ��CMY-2 and�
��TEM-1b, respectively.
������������ ��(� �������*����������)>'��������� ���������;)C��
Approximate plasmid sizes were given in Figure 2 and ranged from approximately 75 kb to 200
kb. Plasmid profiling by RFLP separated the plasmids into three distinct clusters (I, II and III in
Figure 2). Furthermore, one plasmid profile (from strain SH1208/03) was not associated to any of
the three main groups. The plasmid with ��CMY-2 genes was associated to cluster I, while
plasmids harboring the ��CTX-M-14 gene belonged to the two remaining clusters as well as the
plasmid out of line with the three clusters (Figure 2). Replicon typing identified the incA/C
replicon in RFLP cluster I, the incFrep in cluster II and incFIIA in cluster III, while the plasmid
from SH1208/03 was untypable.
$�� ���������������'�$��� ������������� � ������� ����
The PCR results revealed that only one (SH2862/08) of the eight ESC producing isolates which
harbored the extended spectrum �-lactamase gen group ��CTX – M-14 successfully transferred non-
12
ESC resistance determinants. In addition to ��CTX – M-14, the transformant contained the ��3, the
���A1 and the � B genes.
The four transformants containing plasmid ampC gen ��CMY-2 seemed to harbor many of the
non-ESC resistance determinants. All of the four transformants contained the ��R, the ��2, the
� �A / � �B and � A genes. In addition, one (SH508/03) of the four transformants also contained
the ��1 gene and three transformants (SH2870/08, SH2874/08, SH508/03) contained the ���A1
gene.
The transformant of the one isolate (SH1208/03) which harbored the ��CTX – M-14 also contained
the ��TEM gen.
�
$��G��� ����5������ ��
By conjugation experiments we found the ESC phenotype readily transferable from wild type
strains carrying plasmids belonging to RFLP cluster I and cluster II as well as from isolate SH
1208/03. However, the four strains carrying the incFIIA type plasmids of RFLP cluster III did not
succeed.
�
�)>'� ������
The 24 �������� serovar� Choleraesuis isolates from 22 patients were subtyped by PFGE.
Sixteen unique &��I PFGE patterns were observed (Figure 1). There were five distinct PFGE
clusters with >2 indistinguishable isolates. Three clusters contained ESC producing isolates of
which two included two indistinguishable isolates from different Thai patients (SH2858/08,
SH2867/08 and SH2870/08, SH2874/08). A second cluster contained three isolates with
indistinguishable patterns, two isolates from one Thai patient (SH2871-08, SH2872-08) (different
susceptibility profiles) and the isolate (08-120226) from the Danish traveller to Thailand. The
13
two remaining clusters only contained isolates susceptible to third generation cephalosporins of
which one included isolates from both 2003 and 2008.�
DISCUSSION
This study provides the first description of���CTX-M-14 in ��������serovar Choleraesuis isolates
and is the first reported isolation of an ESC producing �������� serovar Choleraesuis in an
international traveller who recovered with sequelae from his infection. In addition, these data
provide evidence that ESC producing isolates have emerged in Thailand on several plasmids and
in several clusters of ���Choleraesuis.
Characterization of the antimicrobial resistance genes indicates some similarity between isolates
harboring either ��CTX-M-14 or ��CMY-2. The data from the plasmid characterization, conjugation,
replicon typing and RFLP also suggested that these are not highly clonal strains and further
grouped the isolates into four distinct replicon clusters. Based on the data of the unknown
replicon, one could speculate if the plasmid of isolate SH1208/03 was the ancestor to the other
isolates harboring the ��CTX-M-14 gene and simply evolved rather than spread to other strains. All
of the analyses indicate multiple clones and multiple plasmids being responsible for the
resistance to extended spectrum cephalosporinases producing �������� serovar Choleraesuis
obtained from patients in Thailand and Denmark.
Several studies have described plasmids carrying ��CMY-2 containing the incA/C replicon along
with other resistance genes. A recent Canadian study investigated 38 '���� isolates where all of
the isolates harbored a plasmid carrying ��CMY-2 containing the incA/C replicon (24). A similar
association between ��CTX-M14 and incFII has been described previously. Geraldine Marcade � �
�� found that the great majority of genes encoding ��CTX-M-14 and ��CTX-M-15 were carried by
14
IncF replicons. Of 15 '���� isolates harboring ��CTX-M-14 eight of them contained the replicon
IncFII (23,.
PFGE patterns revealed a high degree of clonal diversity among the 24 isolates. ESC producing
and non-ESC producing isolates were generally interspersed although some rare clusters
comprised solely resistant or susceptible isolates. This indicates that multiple clones are
circulating in the population and that isolates resistant to third generation cephalosporins most
likely developed due to a long standing selection pressure from the use of these compounds in a
veterinary reservoir rather than a recent spread of a single clone.
�������� serovar Choleraesuis has been eradicated from the primary production of swine in
Denmark and many other industrialised countries. The isolate from the Danish traveller shared
the an identical PFGE pattern with an isolate from a Thai patient infected in the autumn of 2008.
The isolates were resistant to the same antimicrobials and harbored the same resistance genes
with exception of two additional resistance traits in the isolate from the Danish patient, namely
resistance to amoxicillin + clavulanic acid and gentamicin. We have no explanation for this
discrepancy because the Danish patient did receive only symptomic therapy prior to admission to
the hospital in Denmark.
The Danish case was remarkable for neurologic symptoms localized to the left hand which
coincided with diarrhoeal illness and persisting for at least 9 months. There was no evidence of
focal infection, but the similarity with mononeuropathy in association with typhoid fever may
indicate a common pathogenesis (12).
15
Thailand is a popular tourist destination for Europeans. Thus, in 2008 149.570 Danes visited
Thailand (http://www.tourism.go.th/). During the same year, 3,022 confirmed cases of
������� infections in humans were reported to Statens Serum Institute, Denmark. Of these,
706 (23.3%) were confirmed as travel associated and 95 (13.4%) cases were linked to travelling
to Thailand (Data not published). These numbers might be underestimated and probably should
be multiplied with 10 -20 times (30). Taking this underestimation into consideration 0.6% of the
Danes visiting Thailand might bring back a ������� infection based on these data.
The infections with ��������serovar Choleraesuis�has recently increased in Thailand and the
emergence of ESC producing �������� serovar Choleraesuis makes this problem even more
serious (16). We therefore urge the Thai authorities to take action in order to prevent and control
the spread of this serovar among animals and the human population. Targeted interventions can
benefit swine farmers by reducing losses and possible export restrictions. These interventions can
also reduce the high costs of hospitalization associated with treatment of invasive ��������
serovar Choleraesuis infections which include the necessity to use carbapenems which are
antibiotics of last resort. We recommend enforcing a strict policy on the usage of antimicrobials
in food animals and a ban on the usage of third generation cephalosporins as growth promoter.
CONCLUSSION
This study provides for the first time a description of��� CTX-M-14 found in �������� serovar
Choleraesuis isolates and documents a case of bacteremia with an ESC producing ��������
serovar Choleraesuis acquired by a Danish traveller during a stay in Bangkok. The data suggest
that ESC producing isolates have emerged in Thailand on several plasmids and in multiple clones
of ��������serovar Choleraesuis.
16
We found two genes and four replicons responsible for the resistance to third and fourth
generation cephalosporins present in the isolates from both 2003 and 2008. In addition, the
isolates exhibit a huge diversity among the molecular patterns indicating a variable population
despite having similar resistance patterns and genes.
The Thai authorities should initiate immediate actions to control and prevent infections with this
invasive serovar for the benefit of the Thai people and tourists travelling to Thailand. The first
step could be specific serovar targeted intervention and limitations in the usage of third
generation cephalosporins as growth promoters in the primary production of pigs.
ACKNOWLEDGEMENTS
We are grateful to Mrs. Christina Aaby Svendsen and Miss. Lisbeth Andersen (National Food
Institute) for outstanding technical assistance, to Dr. Matthew Mikoleit (Centers for Disease
Control and Prevention, US) for reviewing the manuscript and improving the English, and to Dr.
Steen Ethelberg (Statens Serum Institute, Denmark) for providing data on travel associated
infections in Danish patients.
This work was supported by the World Health Organization Global Salm-Surv
(www.who.int/salmsurv).
REFERENCES
1. Aarestrup F. M., Hendriksen R. S., Lockett J, Gay K, Teates K, McDermott P. F.,
White D. G., Hasman H, Sørensen G, Bangtrakulnonth A, Pornreongwong S,
Pulsrikarn C, Angulo F. J., and Gerner-Smidt P. 2007. International spread of
multidrug-resistant ������� Schwarzengrund in food products. Emerg Infect Dis. 13:
726-31.
17
2. Carattoli A, Bertini A, Villa L, Falbo V, Hopkins K. L., and Threlfall E. J. 2005.
Identification of plasmids by PCR-based replicon typing. J. Microbiol. Methods. 63: 219-
28.
3. Caroff N, Espaze E, Bérard I, Richet H, and Reynaud A. 1999. Mutations in the ampC
promoter of '������������isolates resistant to oxyiminocephalosporins without
extended spectrum beta-lactamase production. FEMS Microbiol. Lett. 173: 459-65.
4. Chiu C. H., Wu T. L., Su L. H., Chu C, Chia J. H., Kuo A. J., Chien M. S., and Lin
T. Y.. 2002. The emergence in Taiwan of fluoroquinolone resistance in �������
enterica serotype choleraesuis. N Engl J Med. 346: 413-9.
5. Chiu C. H., Su L. H., and Chu C. 2004. ������� enterica serotype Choleraesuis:
epidemiology, pathogenesis, clinical disease, and treatment. Clin Microbiol Rev. 17: 311-
22. Review.
6. Chiu C. H., Su L. H., Chu C, Chia J. H., Wu T. L., Lin T. Y., Lee Y. S., and Ou J. T..
2004. Isolation of ������� enterica serotype choleraesuis resistant to ceftriaxone and
ciprofloxacin. Lancet. 363: 1285-6.
7. Clinical and Laboratory Standards Institute. 2006. Methods for Dilution
Antimicrobial Susceptibility Tests for Bacteria That Grow Aerobically, 7th Edition.
Approved Standard. M07-A7. Wayne, PA.
18
8. Clinical Laboratory Standards Institute. 2008. Performance Standards for
Antimicrobial Disk and Dilution Susceptibility Tests for bacteria Isolated from Animals,
3rd Edition, Approved Standard. M31-A3. Wayne, PA.
9. Clinical and Laboratory Standards Institute. 2008. Performance Standards for
Antimicrobial Susceptibility Testing, 18th Informational Supplement. M100-S16. Wayne,
PA.
10. Collignon P, Powers J. H., Chiller T. M., Aidara-Kane A, and Aarestrup F. M. 2009.
World Health Organization Ranking of Antimicrobials According to Their Importance in
Human Medicine: A Critical Step for Developing Risk Management Strategies for the
Use of Antimicrobials in Food Production Animals. Clin Infect Dis. 49:132-41.
11. Coyle E. F., Palmer S. R., Ribeiro C. D., Jones H. I., Howard A. J., Ward L, and
Rowe B. 1988. ��������Enteritidis�phage type 4 infection: association with hen’s eggs.
Lancet. 2: 1295–7.
12. Gkrania-Klotsas E, Cooke F. J., Zochios V, and Lofitou N. 2009. Fever, a blue hand,
and abducens nerve paralysis in a returning traveler. J Travel Med. 16: 57-9.
13. Grimont P. A. D and Weill F. X. Antigenic formulae of the ������� serovars, 2007,
9th edition. WHO Collaborating Center for Reference and Research on �������,
Institut Pasteur, Paris, France.
19
14. Grohskopf L. A., Huskins W. C., Sinkowitz-Cochran R. L., Levine G. L., Goldmann
D. A., Jarvis W. R.; Pediatric Prevention Network. 2005. Use of antimicrobial agents
in United States neonatal and pediatric intensive care patients. Pediatr Infect Dis J. 24:
766-73.
15. Helms M, Ethelberg S, Mølbak K, and DT104 Study Group. 2005. International
������� Typhimurium DT104 infections, 1992-2001. Emerg Infect Dis. 6: 859-67.
16. Hendriksen R. S., Bangtrakulnonth A, Pulsrikarn C, Pornreongwong S, Hasman H, Song S.
W., and Aarestrup F. M. 2008. Antimicrobial resistance and molecular epidemiology of
������� Rissen from animals, food products and patients in Thailand and Denmark.
Foodborne Pathog Dis. 5: 605-19
17. Hendriksen R. S., Bangtrakulnonth A, Pulsrikarn C, Pornruangwong S,
Noppornphan G, Emborg H. D., and Aarestrup F.M. 2009. Risk factors and
epidemiology of the ten most common ������� serovars from patients in Thailand;
2002 - 2007. Foodborne Pathog Dis. In press.
18. Hohmann E. L. 2001. Nontyphoidal salmonellosis. Clin Infect Dis. 2: 263-9.
19. Humphrey T. J., Mead G. C., Rowe B. 1988. Poultry meat as a source of human
salmonellosis in England and Wales. Epidemiological overview. Epidemiol Infect. 100:
175–84.
20
20. Humphrey T. J. 2000 Public-health aspects of ��������infections. In: ��������in
domestic animals. (Wray C, Wray A, editors). CABI Publishing, Wallingford, United
Kingdom, 245 – 263.
21. Jones T. F., Ingram L. A., Cieslak P. R., Vugia D. J., Tobin-D'Angelo M, Hurd S,
Medus C, Cronquist A, and Angulo F. J. 2008. Salmonellosis outcomes differ
substantially by serotype. J Infect Dis. 198: 109-14.
22. Kulwichit W, Chatsuwan T, Unhasuta C, Pulsrikarn C, Bangtrakulnonth A, and
Chongthaleong A. 2007. Drug-resistant nontyphoidal ������� bacteremia, Thailand.
Emerg Infect Dis. 13: 501-2.
23. Marcadé G, Deschamps C, Boyd A, Gautier V, Picard B, Branger C, Denamur E,
and Arlet G. 2009. Replicon typing of plasmids in�'������������producing extended-
spectrum beta-lactamases. J Antimicrob Chemother. 63: 67-71.
24. Mulvey M. R., Susky E, McCracken M, Morck D. W., and Read R. R. 2009. Similar
cefoxitin-resistance plasmids circulating in '������������from human and animal
sources. Vet Microbiol. 134: 279-87.
25. Olesen I, Hasman H, and Aarestrup F. M. 2004. Prevalence of ß-lactamases among
ampicillin resistant '����������� and ������� isolated from food animals in
Denmark. Microb Drug Resist. 10: 334–40
21
26. Report of the Task Force of Zoonoses Data Collection including a proposal for a
harmonized monitoring scheme of antimicrobial resistance in ������� in fowl (Gallus
gallus), turkeys, and pigs and $�������� �� G�G�� and $���� in broilers. 2007. the
EFSA Journal. 96,1-46
27. Ribot E. M., Fair M. A., Gautom R, Cameron D. N., Hunter S. B., Swaminathan B,
and Barrett T. J. 2006. Standardization of pulsed-field gel electrophoresis protocols for
the subtyping of '����������� O157:H7, �������� and ������for PulseNet.
Foodborne Pathog Dis. 3: 59-67.
28. Su L. H., Wu T. L., Chia J. H., Chu C, Kuo A. J., and Chiu C. H. 2005. Increasing
ceftriaxone resistance in ������� isolates from a university hospital in Taiwan. J
Antimicrob Chemother. 55: 846-52.
29. Voetsch A. C., Van Gilder T. J., Angulo F. J., Farley M. M., Shallow S, Marcus R,
Cieslak P. R., Deneen V. C., Tauxe R. V., and Emerging Infections Program
FoodNet Working Group. 2004. FoodNet estimate of the burden of illness caused by
nontyphoidal ������� infections in the United States. Clin. Infect. Dis. 38: 127-34.
30. Wheeler J. G., Sethi D, Cowden J. M., Wall P. G., Rodrigues L. C., Tompkins D. S.,
Hudson M. J., Roderick P. J. 1999. Study of infectious intestinal disease in England:
22

23
rates in the community, presenting to general practice, and reported to national
surveillance. The Infectious Intestinal Disease Study Executive. BMJ. 318: 1046-50.
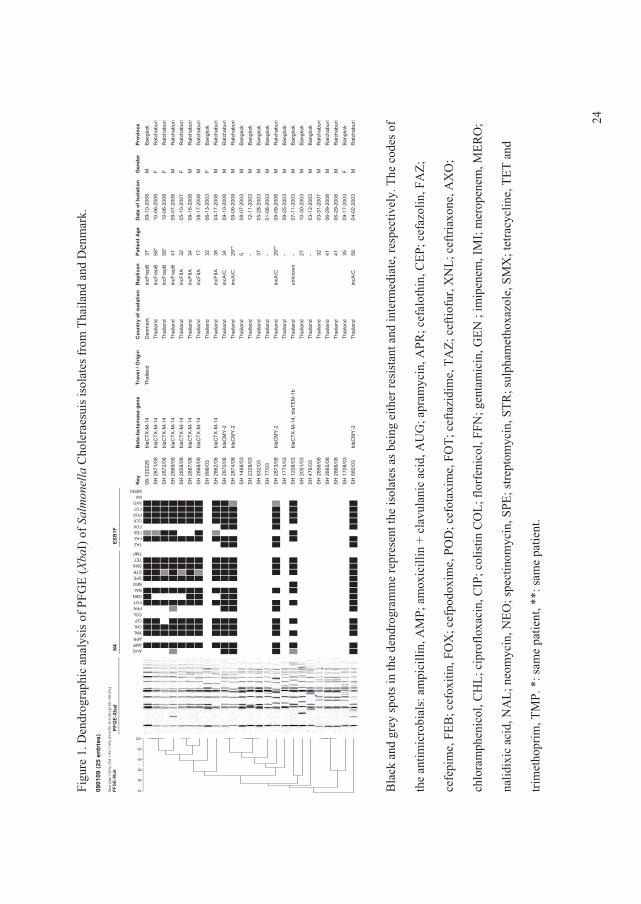
Figu
re 1
. Den
drog
raph
ic a
naly
sis o
f PFG
E (&
��I)
of �
��
���
��C
hole
raes
uis i
sola
tes f
rom
Tha
iland
and
Den
mar
k.
0901
09(2
5 en
trie
s)D
ice
(Opt
:1.0
0%) (
Tol 1
.5%
-1.5
%) (
H>0
.0%
S>0
.0%
) [0.
0%-1
00.0
%]
PFG
E-Xb
aI
100
95
90
85
80
75PF
GE-
XbaI
N4 AUG
AMPAPRXNLCHLCIPCOLFFNFOTGENNALNEOSPESTRSMXTETTMP
ESB
1F
TAZFAZFEBFOXCEPPODFOTAXOIMIMERO
Key
08-1
2022
6
SH
287
1/08
SH
287
2/08
SH
286
9/08
SH
285
8/08
SH
286
7/08
SH
286
8/08
SH
999
/03
SH
286
2/08
SH
287
0/08
SH
287
4/08
SH
146
8/03
SH
232
8/03
SH
832
/03
SH
77/
03
SH
287
3/08
SH
177
4/03
SH
120
8/03
SH
205
1/03
SH
476
/03
SH
285
6/08
SH
286
5/08
SH
286
6/08
SH
170
8/03
SH
580
/03
Bet
a-la
ctam
ase
gene
blaC
TX-M
-14
blaC
TX-M
-14
blaC
TX-M
-14
blaC
TX-M
-14
blaC
TX-M
-14
blaC
TX-M
-14
blaC
TX-M
-14
blaC
TX-M
-14
blaC
MY
-2
blaC
MY
-2
blaC
MY
-2
blaC
TX-M
-14,
bla
TEM
-1b
blaC
MY
-2
Trav
el /
Orig
in
Thai
land
Cou
ntry
of i
sola
tion
Den
mar
k
Thai
land
Thai
land
Thai
land
Thai
land
Thai
land
Thai
land
Thai
land
Thai
land
Thai
land
Thai
land
Thai
land
Thai
land
Thai
land
Thai
land
Thai
land
Thai
land
Thai
land
Thai
land
Thai
land
Thai
land
Thai
land
Thai
land
Thai
land
Thai
land
Rep
licon
incF
repB
incF
repB
incF
repB
incF
repB
incF
IIA
incF
IIA
incF
IIA
incF
IIA
incA
/C
incA
/C
incA
/C
unkn
own
incA
/C
Patie
nt A
ge
37 58*
58*
41 32 34 17 32 38 34 29**
5 - 37 - 29**
- - 27 - 32 41 41 35 58
Dat
e of
Isol
atio
n
09-1
0-20
08
10-0
6-20
08
10-0
6-20
08
09-0
7-20
08
05-1
0-20
07
08-1
6 -20
08
08-1
7-20
08
06-1
3-20
03
04-1
7-20
08
09-1
0-20
08
09-0
9-20
08
08-0
7-20
03
12-1
1-20
03
05-2
8-20
03
01-0
8-20
03
09-0
9-20
08
09-2
5-20
03
07-1
1-20
03
10-3
0-20
03
03-1
2-20
03
03-3
1-20
07
06-2
9-20
08
06-2
9-20
08
09-1
7-20
03
04-0
2-20
03
Gen
der
M F F M F M M F M M M M M M M M M M M M M M M F M
Prov
ince
Ban
gkok
Rat
chab
uri
Rat
chab
uri
Rat
chab
uri
Rat
chab
uri
Rat
chab
uri
Rat
chab
uri
Ban
gkok
Rat
chab
uri
Rat
chab
uri
Rat
chab
uri
Ban
gkok
Ban
gkok
Ban
gkok
Ban
gkok
Rat
chab
uri
Ban
gkok
Ban
gkok
Ban
gkok
Ban
gkok
Rat
chab
uri
Rat
chab
uri
Rat
chab
uri
Ban
gkok
Rat
chab
uri
Bla
ck a
nd g
rey
spot
s in
the
dend
rogr
amm
e re
pres
ent t
he is
olat
es a
s bei
ng e
ither
resi
stan
t and
inte
rmed
iate
, res
pect
ivel
y. T
he c
odes
of
the
antim
icro
bial
s: a
mpi
cilli
n, A
MP;
am
oxic
illin
+ c
lavu
lani
c ac
id, A
UG
; apr
amyc
in, A
PR; c
efal
othi
n, C
EP; c
efaz
olin
, FA
Z;
cefe
pim
e, F
EB; c
efox
itin,
FO
X; c
efpo
doxi
me,
PO
D; c
efot
axim
e, F
OT;
cef
tazi
dim
e, T
AZ;
cef
tiofu
r, X
NL;
cef
triax
one,
AX
O;
chlo
ram
phen
icol
, CH
L; c
ipro
floxa
cin,
CIP
; col
istin
CO
L; fl
orfe
nico
l, FF
N; g
enta
mic
in, G
EN ;
imip
enem
, IM
I; m
erop
enem
, MER
O;
nalid
ixic
aci
d, N
AL;
neo
myc
in, N
EO; s
pect
inom
ycin
, SPE
; stre
ptom
ycin
, STR
; sul
pham
etho
xazo
le, S
MX
; tet
racy
clin
e, T
ET a
nd
trim
etho
prim
, TM
P. *
: sam
e pa
tient
, **:
sam
e pa
tient
.
24
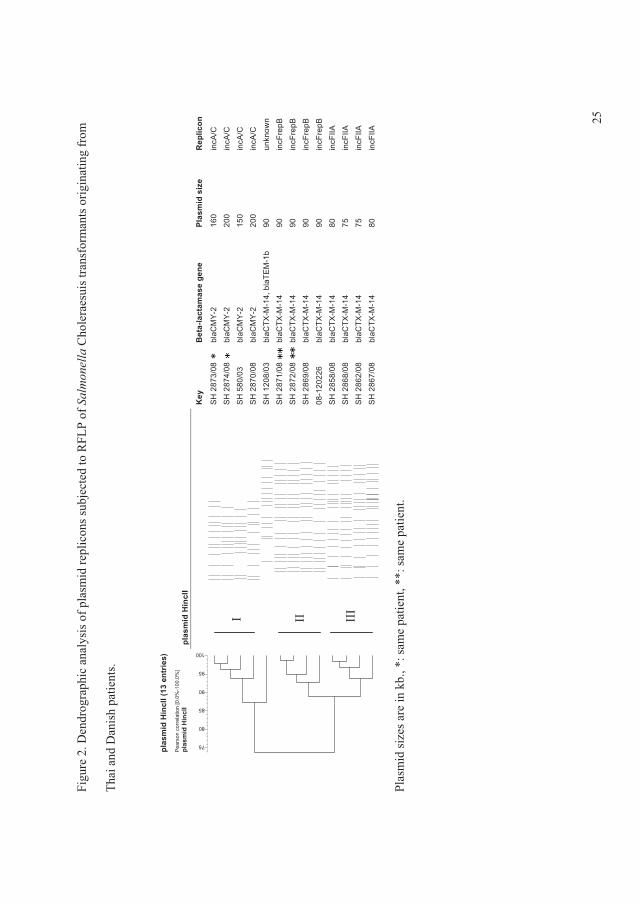
25
Key
SH
287
3/08
SH
287
4/08
SH
580
/03
SH
287
0/08
SH
120
8/03
SH
287
1/08
SH
287
2/08
SH
286
9/08
08-1
2022
6
SH
285
8/08
SH
286
8/08
SH
286
2/08
SH
286
7/08
Bet
a-la
ctam
ase
gene
blaC
MY
-2bl
aCM
Y-2
blaC
MY
-2bl
aCM
Y-2
blaC
TX-M
-14,
bla
TEM
-1b
blaC
TX-M
-14
blaC
TX-M
-14
blaC
TX-M
-14
blaC
TX-M
-14
blaC
TX-M
-14
blaC
TX-M
-14
blaC
TX-M
-14
blaC
TX-M
-14
Plas
mid
siz
e
160
200
150
200
90 90 90 90 90 80 75 75 80
Rep
licon
incA
/Cin
cA/C
incA
/Cin
cA/C
unkn
own
incF
repB
incF
repB
incF
repB
incF
repB
incF
IIAin
cFIIA
incF
IIA
incF
IIA
Figu
re 2
. Den
drog
raph
ic a
naly
sis o
f pla
smid
repl
icon
s sub
ject
ed to
RFL
P of
��
���
��
Cho
lera
esui
s tra
nsfo
rman
ts o
rigin
atin
g fr
om
Thai
and
Dan
ish
patie
nts.
Plas
mid
size
s are
in k
b., *
: sam
e pa
tient
, **:
sam
e pa
tient
.
plas
mid
Hin
cII
III
II I
plas
mid
Hin
cII (
13 e
ntrie
s)P
ears
on c
orre
latio
n [0
.0%
-100
.0%
]pl
asm
id H
incI
I
100
95
90
85
80
75

�
�
�
�
Article VI
Risk factors and epidemiology of the ten most common Salmonella serovars from
patients in Thailand; 2002 - 2007.
�
Rene S. Hendriksen�������"�� �������������&������.�����������������.������ �� ���
4�������)$$��$������%����;������3�,� ��������������������$��
�
�7��%+�&���,���� �&������-������(�,����������(�����'�,����.��� ������'�31�
&�����/���-����(����,����/�-������(�,����������(���)�������'�*���������
0�(��(���1�2����/�-����������"8���2�9��:����;�:<=�&$���� ��� ����������
�7��%+�*���������������������'�������&�������)������*��������-�%�������
��$��������-���'(����(��(���������/�-�.�,�(�%�������0�����'�
�
&����$�'� ������7� Rene S. Hendriksen,�
� ��� )���a���'�*���������0�(��(���1�2����/�-���������
� ��� "8l��2�9��:����;�:<=�&$���� ��� ����������
� �� � .��e7�>?@�:��!?�B=�==�
� ��C7�>?@�:��!?�B=�=��
� �� � 3;�a�7�����D-'�'���'��
�
Foodborne Pathog Dis. 2009 Oct; 6 (8): 1009-19.
AR
TIC
LE
VI
Original Article
Risk Factors and Epidemiology of the Ten Most CommonSalmonella Serovars from Patients in Thailand: 2002–2007
Rene S. Hendriksen,1 Aroon Bangtrakulnonth,2 Chaiwat Pulsrikarn,2 Srirat Pornruangwong,2
Gorrawan Noppornphan,2 Hanne-Dorthe Emborg,1 and Frank M. Aarestrup1
Abstract
We conducted a retrospective observational study to assess epidemiological trends and risk factors associatedwith the 10 most common Salmonella serovars isolated from humans in Thailand between 2002 and 2007. A totalof 11,656 Salmonella isolates covering all 6 years were included in the study. The top 10 Salmonella serovarsidentified during the course of this study were Enteritidis, Stanley, Weltevreden, Rissen, I [1],4,[5],12:i:�,Choleraesuis, Anatum, Typhimurium, Corvallis, and Panama, which accounted for 8108 (69.6%) of the isolates.Most isolates were from patients <5 years (33%), were isolated during June (13%), and were recovered from stool(82%) and from patients in Bangkok (27%). Statistical analysis revealed that S. Enteritidis and S. Choleraesuiswere recovered from blood with a higher frequency than other nontyphoidal serovars. While both serovarstended to be isolated from patients >5 years; S. Choleraesuis was recovered with a higher frequency frompatients in Bangkok and the central region, whereas S. Enteritidis was recovered predominantly from patients inthe southern region. This study also indicates a shift in prevalence of the most common Salmonella serovarsresponsible for human infections in Thailand compared to previous studies. Notably, there was an increase inhuman infections with S. Stanley, S. Corvallis, and S. Choleraesuis, three serovars that have previously beenassociated with swine, and a decrease in infections due to S. Weltevreden and S. Anatum. The study alsorevealed differences in the epidemiology among the different serovars, suggesting that serovar-specific inter-ventions are needed. We recommend initiating targeted interventions for the two serovars associated with a highodds ratio for submitted blood samples, S. Enteritidis and S. Choleraesuis. The authors also recommend addi-tional epidemiologic studies to investigate the observed increase in swine associated serovars (S. Stanley, S.Corvallis,and S. Choleraesuis) and determine interventions to reduce the burden of disease from these serovars.
Introduction
Salmonella enterica is a common cause of humangastroenteritis and bacteremia and a wide variety of ani-
mals, particularly food animals, have been identified asreservoirs for nontyphoidal Salmonella (Coyle et al., 1988;Humphrey et al., 1988; Humphrey, 2000). A limited number ofthe 2579 currently recognized serovars of Salmonella accountfor the vast majority of human infections. In developedcountries, S. Typhimurium and S. Enteritidis are the mostcommon causes of human salmonellosis, but other serovarshave been reported to be more prevalent in specific regions(Humphrey, 2000; Herikstad et al., 2002; Aarestrup et al., 2003;Bangtrakulnonth et al., 2004; Galanis et al., 2006).
Knowledge of the prevalence and epidemiology of differ-ent serovars in specific regions may facilitate the recognitionand control of new and emerging pathogens. Previous studieshave shown that Salmonella serovars Choleraesuis, Dublin,Virchow, Enteritidis, and Panama tend to cause invasivedisease and are associated with higher mortality rates. Thesestudies have reported mortality rates of 1.8% and 3.0% forS. Choleraesuis and S. Dublin, respectively, compared with0.5% for all nontyphoidal Salmonella and 0.6% for S. Typhi-murium (Helms et al., 2002; Chiu et al., 2004; Jones et al., 2008).The explanations for this observed increased virulence have notbeen fully elucidated and are most likely multifactoral.
The following retrospective observational cross-sectionalstudy was conducted to elucidate the epidemiological trends
1World Health Organization (WHO) Collaborating Centre for Antimicrobial Resistance in Foodborne Pathogens and EU CommunityReference Laboratory for Antimicrobial Resistance, National Food Institute, Technical University of Denmark, Copenhagen, Denmark.
2WHO International Salmonella and Shigella Centre, National Institute of Health, Department of Medical Sciences, Ministry of PublicHealth, Thailand.
FOODBORNE PATHOGENS AND DISEASEVolume 6, Number 8, 2009ª Mary Ann Liebert, Inc.DOI: 10.1089=fpd.2008.0245
1009
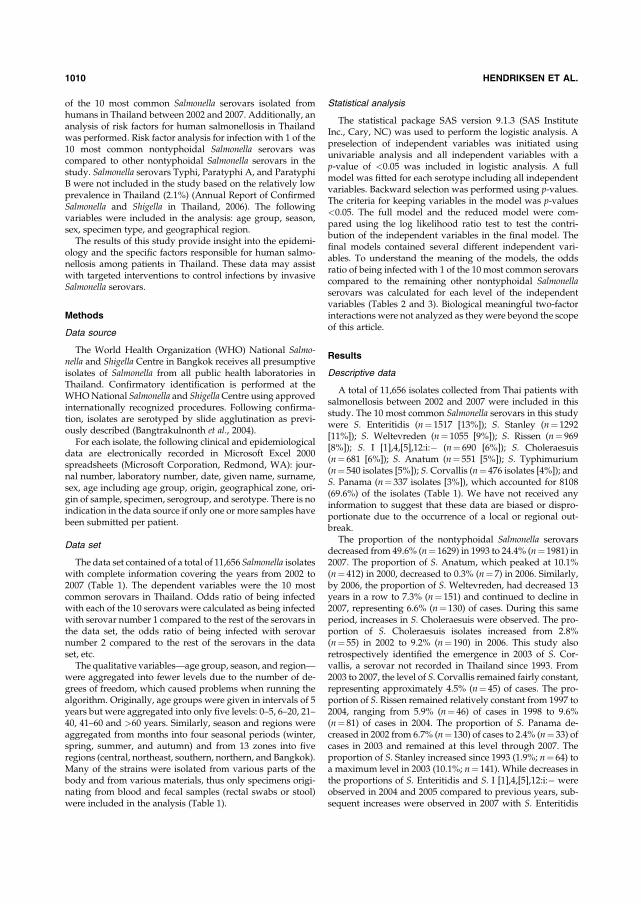
of the 10 most common Salmonella serovars isolated fromhumans in Thailand between 2002 and 2007. Additionally, ananalysis of risk factors for human salmonellosis in Thailandwas performed. Risk factor analysis for infection with 1 of the10 most common nontyphoidal Salmonella serovars wascompared to other nontyphoidal Salmonella serovars in thestudy. Salmonella serovars Typhi, Paratyphi A, and ParatyphiB were not included in the study based on the relatively lowprevalence in Thailand (2.1%) (Annual Report of ConfirmedSalmonella and Shigella in Thailand, 2006). The followingvariables were included in the analysis: age group, season,sex, specimen type, and geographical region.
The results of this study provide insight into the epidemi-ology and the specific factors responsible for human salmo-nellosis among patients in Thailand. These data may assistwith targeted interventions to control infections by invasiveSalmonella serovars.
Methods
Data source
The World Health Organization (WHO) National Salmo-nella and Shigella Centre in Bangkok receives all presumptiveisolates of Salmonella from all public health laboratories inThailand. Confirmatory identification is performed at theWHONational Salmonella and ShigellaCentre using approvedinternationally recognized procedures. Following confirma-tion, isolates are serotyped by slide agglutination as previ-ously described (Bangtrakulnonth et al., 2004).
For each isolate, the following clinical and epidemiologicaldata are electronically recorded in Microsoft Excel 2000spreadsheets (Microsoft Corporation, Redmond, WA): jour-nal number, laboratory number, date, given name, surname,sex, age including age group, origin, geographical zone, ori-gin of sample, specimen, serogroup, and serotype. There is noindication in the data source if only one or more samples havebeen submitted per patient.
Data set
The data set contained of a total of 11,656 Salmonella isolateswith complete information covering the years from 2002 to2007 (Table 1). The dependent variables were the 10 mostcommon serovars in Thailand. Odds ratio of being infectedwith each of the 10 serovars were calculated as being infectedwith serovar number 1 compared to the rest of the serovars inthe data set, the odds ratio of being infected with serovarnumber 2 compared to the rest of the serovars in the dataset, etc.
The qualitative variables—age group, season, and region—were aggregated into fewer levels due to the number of de-grees of freedom, which caused problems when running thealgorithm. Originally, age groups were given in intervals of 5years but were aggregated into only five levels: 0–5, 6–20, 21–40, 41–60 and >60 years. Similarly, season and regions wereaggregated from months into four seasonal periods (winter,spring, summer, and autumn) and from 13 zones into fiveregions (central, northeast, southern, northern, and Bangkok).Many of the strains were isolated from various parts of thebody and from various materials, thus only specimens origi-nating from blood and fecal samples (rectal swabs or stool)were included in the analysis (Table 1).
Statistical analysis
The statistical package SAS version 9.1.3 (SAS InstituteInc., Cary, NC) was used to perform the logistic analysis. Apreselection of independent variables was initiated usingunivariable analysis and all independent variables with ap-value of <0.05 was included in logistic analysis. A fullmodel was fitted for each serotype including all independentvariables. Backward selection was performed using p-values.The criteria for keeping variables in the model was p-values<0.05. The full model and the reduced model were com-pared using the log likelihood ratio test to test the contri-bution of the independent variables in the final model. Thefinal models contained several different independent vari-ables. To understand the meaning of the models, the oddsratio of being infected with 1 of the 10 most common serovarscompared to the remaining other nontyphoidal Salmonellaserovars was calculated for each level of the independentvariables (Tables 2 and 3). Biological meaningful two-factorinteractions were not analyzed as they were beyond the scopeof this article.
Results
Descriptive data
A total of 11,656 isolates collected from Thai patients withsalmonellosis between 2002 and 2007 were included in thisstudy. The 10 most common Salmonella serovars in this studywere S. Enteritidis (n¼ 1517 [13%]); S. Stanley (n¼ 1292[11%]); S. Weltevreden (n¼ 1055 [9%]); S. Rissen (n¼ 969[8%]); S. I [1],4,[5],12:i:� (n¼ 690 [6%]); S. Choleraesuis(n¼ 681 [6%]); S. Anatum (n¼ 551 [5%]); S. Typhimurium(n¼ 540 isolates [5%]); S. Corvallis (n¼ 476 isolates [4%]); andS. Panama (n¼ 337 isolates [3%]), which accounted for 8108(69.6%) of the isolates (Table 1). We have not received anyinformation to suggest that these data are biased or dispro-portionate due to the occurrence of a local or regional out-break.
The proportion of the nontyphoidal Salmonella serovarsdecreased from 49.6% (n¼ 1629) in 1993 to 24.4% (n¼ 1981) in2007. The proportion of S. Anatum, which peaked at 10.1%(n¼ 412) in 2000, decreased to 0.3% (n¼ 7) in 2006. Similarly,by 2006, the proportion of S. Weltevreden, had decreased 13years in a row to 7.3% (n¼ 151) and continued to decline in2007, representing 6.6% (n¼ 130) of cases. During this sameperiod, increases in S. Choleraesuis were observed. The pro-portion of S. Choleraesuis isolates increased from 2.8%(n¼ 55) in 2002 to 9.2% (n¼ 190) in 2006. This study alsoretrospectively identified the emergence in 2003 of S. Cor-vallis, a serovar not recorded in Thailand since 1993. From2003 to 2007, the level of S.Corvallis remained fairly constant,representing approximately 4.5% (n¼ 45) of cases. The pro-portion of S. Rissen remained relatively constant from 1997 to2004, ranging from 5.9% (n¼ 46) of cases in 1998 to 9.6%(n¼ 81) of cases in 2004. The proportion of S. Panama de-creased in 2002 from 6.7% (n¼ 130) of cases to 2.4% (n¼ 33) ofcases in 2003 and remained at this level through 2007. Theproportion of S. Stanley increased since 1993 (1.9%; n¼ 64) toa maximum level in 2003 (10.1%; n¼ 141). While decreases inthe proportions of S. Enteritidis and S. I [1],4,[5],12:i:� wereobserved in 2004 and 2005 compared to previous years, sub-sequent increases were observed in 2007 with S. Enteritidis
1010 HENDRIKSEN ET AL.
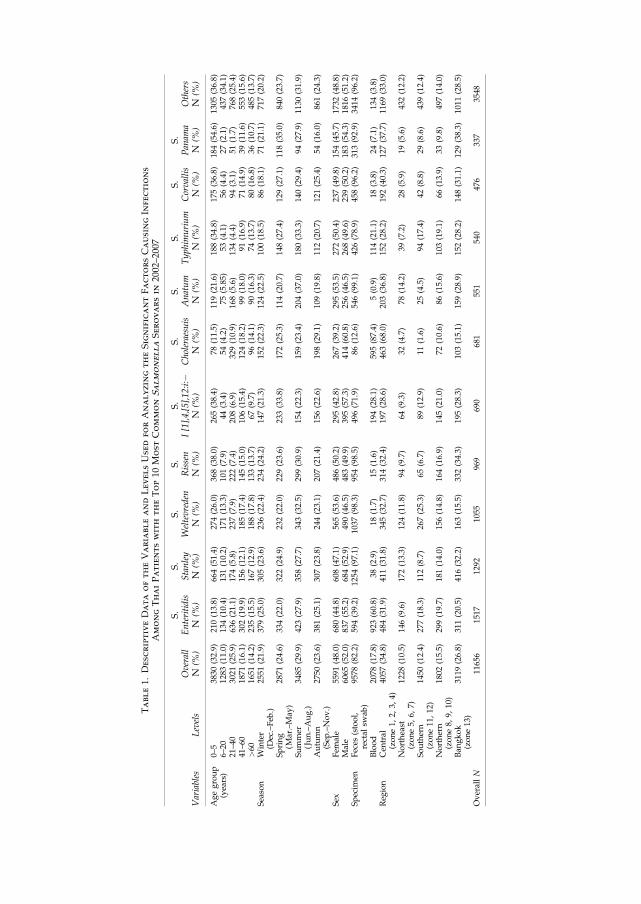
Table1.
DescriptiveDataoftheVariableandLevelsUsedforAnalyzingtheSignificantFactorsCausingInfections
AmongThaiPatientswith
theTop10
MostCommonSalmonellaSerovarsin
2002–2007
Variables
Levels
Overall
N(%
)
S.
Enteritidis
N(%
)
S.
Stanley
N(%
)
S.
Weltevreden
N(%
)
S.
Rissen
N(%
)
S.
I[1],4,[5],12:i:�
N(%
)
S.
Choleraesuis
N(%
)
S.
Anatum
N(%
)
S.
Typhim
urium
N(%
)
S.
Corvallis
N(%
)
S.
Panam
aN
(%)
Others
N(%
)
Agegroup
(years)
0–5
3830
(32.9)
210(13.8)
664(51.4)
274(26.0)
368(38.0)
265(38.4)
78(11.5)
119(21.6)
188(34.8)
175(36.8)
184(54.6)
1305
(36.8)
6–20
1283
(11.0)
134(10.4)
131(10.2)
171(13.3)
101(7.9)
44(3.4)
54(4.2)
75(5.85)
53(4.1)
56(4.4)
27(2.1)
437(34.1)
21–40
3021
(25.9)
636(21.1)
174(5.8)
237(7.9)
222(7.4)
208(6.9)
329(10.9)
168(5.6)
134(4.4)
94(3.1)
51(1.7)
768(25.4)
41–60
1871
(16.1)
302(19.9)
156(12.1)
185(17.4)
145(15.0)
106(15.4)
124(18.2)
99(18.0)
91(16.9)
71(14.9)
39(11.6)
553(15.6)
>60
1651
(14.2)
235(15.5)
167(12.9)
188(17.8)
133(13.7)
67(9.7)
96(14.1)
90(16.3)
74(13.7)
80(16.8)
36(10.7)
485(13.7)
Season
Winter
(Dec.–Feb
.)25
51(21.9)
379(25.0)
305(23.6)
236(22.4)
234(24.2)
147(21.3)
152(22.3)
124(22.5)
100(18.5)
86(18.1)
71(21.1)
717(20.2)
Spring
(Mar.–May
)28
71(24.6)
334(22.0)
322(24.9)
232(22.0)
229(23.6)
233(33.8)
172(25.3)
114(20.7)
148(27.4)
129(27.1)
118(35.0)
840(23.7)
Summer
(Jun.–Aug.)
3485
(29.9)
423(27.9)
358(27.7)
343(32.5)
299(30.9)
154(22.3)
159(23.4)
204(37.0)
180(33.3)
140(29.4)
94(27.9)
1130
(31.9)
Autumn
(Sep
.–Nov.)
2750
(23.6)
381(25.1)
307(23.8)
244(23.1)
207(21.4)
156(22.6)
198(29.1)
109(19.8)
112(20.7)
121(25.4)
54(16.0)
861(24.3)
Sex
Fem
ale
5591
(48.0)
680(44.8)
608(47.1)
565(53.6)
486(50.2)
295(42.8)
267(39.2)
295(53.5)
272(50.4)
237(49.8)
154(45.7)
1732
(48.8)
Male
6065
(52.0)
837(55.2)
684(52.9)
490(46.5)
483(49.9)
395(57.3)
414(60.8)
256(46.5)
268(49.6)
239(50.2)
183(54.3)
1816
(51.2)
Specim
enFeces
(stool,
rectal
swab
)95
78(82.2)
594(39.2)
1254
(97.1)
1037
(98.3)
954(98.5)
496(71.9)
86(12.6)
546(99.1)
426(78.9)
458(96.2)
313(92.9)
3414
(96.2)
Blood
2078
(17.8)
923(60.8)
38(2.9)
18(1.7)
15(1.6)
194(28.1)
595(87.4)
5(0.9)
114(21.1)
18(3.8)
24(7.1)
134(3.8)
Reg
ion
Cen
tral
(zone1,
2,3,
4)40
57(34.8)
484(31.9)
411(31.8)
345(32.7)
314(32.4)
197(28.6)
463(68.0)
203(36.8)
152(28.2)
192(40.3)
127(37.7)
1169
(33.0)
Northeast
(zone5,
6,7)
1228
(10.5)
146(9.6)
172(13.3)
124(11.8)
94(9.7)
64(9.3)
32(4.7)
78(14.2)
39(7.2)
28(5.9)
19(5.6)
432(12.2)
Southern
(zone11
,12
)14
50(12.4)
277(18.3)
112(8.7)
267(25.3)
65(6.7)
89(12.9)
11(1.6)
25(4.5)
94(17.4)
42(8.8)
29(8.6)
439(12.4)
Northern
(zone8,
9,10
)18
02(15.5)
299(19.7)
181(14.0)
156(14.8)
164(16.9)
145(21.0)
72(10.6)
86(15.6)
103(19.1)
66(13.9)
33(9.8)
497(14.0)
Ban
gkok
(zone13
)31
19(26.8)
311(20.5)
416(32.2)
163(15.5)
332(34.3)
195(28.3)
103(15.1)
159(28.9)
152(28.2)
148(31.1)
129(38.3)
1011
(28.5)
OverallN
1165
615
1712
9210
5596
969
068
155
154
047
633
735
48
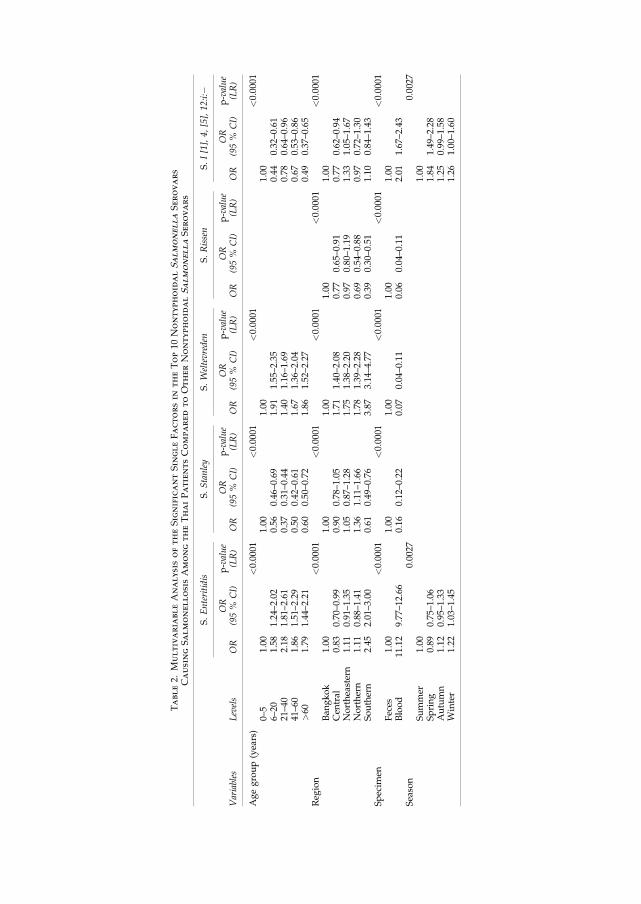
Table2.
MultivariableAnalysisoftheSignificantSingleFactorsin
theTop10
NontyphoidalSalmonellaSerovars
CausingSalmonellosisAmongtheThaiPatientsComparedtoOtherNontyphoidalSalmonellaSerovars
S.Enteritidis
S.Stanley
S.Weltevreden
S.Rissen
S.I[1],4,[5],12:i:�
Variables
Levels
OR
OR
(95%
CI)
p-value
(LR)
OR
OR
(95%
CI)
p-value
(LR)
OR
OR
(95%
CI)
p-value
(LR)
OR
OR
(95%
CI)
p-value
(LR)
OR
OR
(95%
CI)
p-value
(LR)
Agegroup(years)
<0.0001
<0.0001
<0.0001
<0.0001
0–5
1.00
1.00
1.00
1.00
6–20
1.58
1.24–2.02
0.56
0.46–0.69
1.91
1.55–2.35
0.44
0.32–0.61
21–40
2.18
1.81–2.61
0.37
0.31–0.44
1.40
1.16–1.69
0.78
0.64–0.96
41–60
1.86
1.51–2.29
0.50
0.42–0.61
1.67
1.36–2.04
0.67
0.53–0.86
>60
1.79
1.44–2.21
0.60
0.50–0.72
1.86
1.52–2.27
0.49
0.37–0.65
Reg
ion
<0.0001
<0.0001
<0.0001
<0.0001
<0.0001
Ban
gkok
1.00
1.00
1.00
1.00
1.00
Cen
tral
0.83
0.70–0.99
0.90
0.78–1.05
1.71
1.40–2.08
0.77
0.65–0.91
0.77
0.62–0.94
Northeastern
1.11
0.91–1.35
1.05
0.87–1.28
1.75
1.38–2.20
0.97
0.80–1.19
1.33
1.05–1.67
Northern
1.11
0.88–1.41
1.36
1.11–1.66
1.78
1.39–2.28
0.69
0.54–0.88
0.97
0.72–1.30
Southern
2.45
2.01–3.00
0.61
0.49–0.76
3.87
3.14–4.77
0.39
0.30–0.51
1.10
0.84–1.43
Specim
en<0.0001
<0.0001
<0.0001
<0.0001
<0.0001
Feces
1.00
1.00
1.00
1.00
1.00
Blood
11.12
9.77–12.66
0.16
0.12–0.22
0.07
0.04–0.11
0.06
0.04–0.11
2.01
1.67–2.43
Season
0.0027
0.0027
Summer
1.00
1.00
Spring
0.89
0.75–1.06
1.84
1.49–2.28
Autumn
1.12
0.95–1.33
1.25
0.99–1.58
Winter
1.22
1.03–1.45
1.26
1.00–1.60
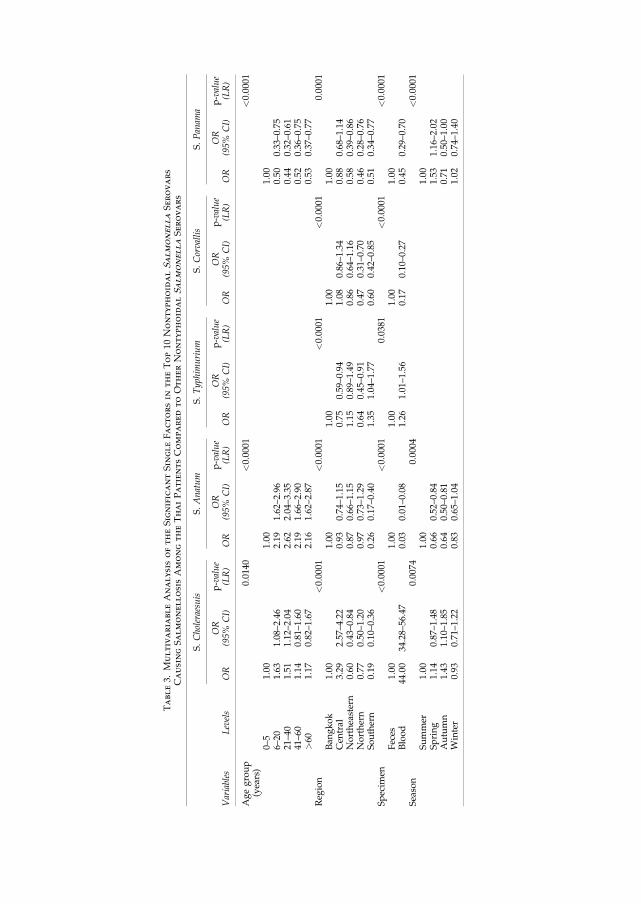
Table3.
MultivariableAnalysisoftheSignificantSingleFactorsin
theTop10
NontyphoidalSalmonellaSerovars
CausingSalmonellosisAmongtheThaiPatientsComparedtoOtherNontyphoidalSalmonellaSerovars
S.Choleraesuis
S.Anatum
S.Typhim
urium
S.Corvallis
S.Panam
a
Variables
Levels
OR
OR
(95%
CI)
p-value
(LR)
OR
OR
(95%
CI)
p-value
(LR)
OR
OR
(95%
CI)
p-value
(LR)
OR
OR
(95%
CI)
p-value
(LR)
OR
OR
(95%
CI)
p-value
(LR)
Agegroup
(years)
0.0140
<0.0001
<0.0001
0–5
1.00
1.00
1.00
6–20
1.63
1.08–2.46
2.19
1.62–2.96
0.50
0.33–0.75
21–40
1.51
1.12–2.04
2.62
2.04–3.35
0.44
0.32–0.61
41–60
1.14
0.81–1.60
2.19
1.66–2.90
0.52
0.36–0.75
>60
1.17
0.82–1.67
2.16
1.62–2.87
0.53
0.37–0.77
Reg
ion
<0.0001
<0.0001
<0.0001
<0.0001
0.0001
Ban
gkok
1.00
1.00
1.00
1.00
1.00
Cen
tral
3.29
2.57–4.22
0.93
0.74–1.15
0.75
0.59–0.94
1.08
0.86–1.34
0.88
0.68–1.14
Northeastern
0.60
0.43–0.84
0.87
0.66–1.15
1.15
0.89–1.49
0.86
0.64–1.16
0.58
0.39–0.86
Northern
0.77
0.50–1.20
0.97
0.73–1.29
0.64
0.45–0.91
0.47
0.31–0.70
0.46
0.28–0.76
Southern
0.19
0.10–0.36
0.26
0.17–0.40
1.35
1.04–1.77
0.60
0.42–0.85
0.51
0.34–0.77
Specim
en<0.0001
<0.0001
0.0381
<0.0001
<0.0001
Feces
1.00
1.00
1.00
1.00
1.00
Blood
44.00
34.28–56.47
0.03
0.01–0.08
1.26
1.01–1.56
0.17
0.10–0.27
0.45
0.29–0.70
Season
0.0074
0.0004
<0.0001
Summer
1.00
1.00
1.00
Spring
1.14
0.87–1.48
0.66
0.52–0.84
1.53
1.16–2.02
Autumn
1.43
1.10–1.85
0.64
0.50–0.81
0.71
0.50–1.00
Winter
0.93
0.71–1.22
0.83
0.65–1.04
1.02
0.74–1.40

and S. I [1],4,[5],12:i:� comprising 16.0% (n¼ 316) and 4.5%(n¼ 90), of the cases for 2007, respectively (Fig. 1).
Age distribution
The patients’ ages ranged from 1 day to 96 years. The ma-jority of infections (n¼ 640, 32.6%) were observed in patientsbetween 0 and 5 years (Fig. 1). The frequency of infectionsamong the patients rapidly decreased after the fifth year of lifeto an average annual level of 3.2–4.4% (n¼ 63–86) among pa-tients from 6 to 20 years. A higher frequency of infection wasalso observed among patients in the second and third decadesof life. This age group on average represented 144 cases (7.5%)per year. The frequency of infection plateaued through thesixth decade to an average of 60 cases per year (3.1%) at age 60.The frequency of infection peaked for the third time amongpatients older than 60 years. This age group accounted for anaverage of 280 cases (14.0%) per year (Table 1, Fig. 2).
Sex
No differences were observed based on patients’ sex. Overthe 6-year period, 52.1% of patients were female and 47.9%were male.
Seasonal trends
Infections peaked in June with an average of 1456 cases(12.5%). Overall, the fewest cases (n¼ 745) were reportedduring the month of April. However, S. I [1],4,[5],12:i:�peaked in April with an average 113 cases compared to 65cases in June (Table 1, Fig. 3).
Specimen source
The majority of isolates (82.2%) were recovered from stoolor rectal swabs whereas the remaining 17.8% of samples wererecovered from blood. Between 2002 and 2005, the percentageof isolates recovered from blood decreased from 15.2% in 2002to 8.4% in 2005. However, the percentage of blood isolatesmore than doubled in 2006 to 29.3% and remained relativelyunchanged (25.2%) in 2007.
Regional variation
The majority (n¼ 3119) of infections were reported from theBangkok region (Table 1). The 10 most common serovars de-scribed in this study were present in Bangkok; however, theproportion of S. Enteritidis was the lowest (10%) when com-pared to the other four regions (Fig. 4). A large number of cases(n¼ 4057) were also reported in the central region. Similar toBangkok, all of the serovars described in the study were pres-ent in the central region. In addition, the central region had thehighest proportion of S. Choleraesuis (11%), which ranked asthe sixth most common serovar in that region (Fig. 4).
A large number of infections were also observed in thenorthern region, specifically within zones 8 and 10. SalmonellaKedougou accounted for 5% of the cases in the northern re-gion. In contrast to other regions, S. Panama was not listedamong the 10 most commonly reported serovars, having beensurpassed by S. Kedougou.
The southern region, which includes both the eastern andthe western peninsulas, accounted for the greatest number ofsalmonellosis cases due to S. Enteritidis (19%) and S. Wel-
tevreden (18%) compared to the other regions. A small per-centage of cases in the southern region were due to swine-associated serovars: S. Stanley (8%), S. Rissen (4%), and S.Corvallis (3%). S. Choleraesuis was not among the 10 mostcommonly reported serovars in the southern region. How-ever, in contrast to other regions, SalmonellaAlbany accountedfor 3% of cases and was ranked as the 10th most commonserovar in the southern region (Fig. 4).
Only 1228 cases were observed in the northeastern region(zones 5, 6, and 7) and were atypical in comparison with theother regions because neither S.Choleraesuis, S.Corvallis, norS. Panama were among the top 10 most common serovars(Table 1). These serovars were displaced by S. Hvittingfoss(6%), S. Derby (4%), and S. Virchow (3%) which rankedeighth, ninth, and tenth, respectively, among the top 10 mostcommon serovars in the region (Fig. 4).
Risk factors
Blood invasive Salmonella serovars. The statistical anal-ysis revealed that S. Enteritidis, S. Choleraesuis, and to alesser extent S. I [1],4,[5],12:i:� and S. Typhimurium wererecovered from blood at a significantly increased odds ratiowhen compared to other nontyphoidal Salmonella serovars.The highest odds ratio for isolation of S. Choleraesuis orS. Enteritidis from blood was observed among patients olderthan 5 years, whereas with S. I [1],4,[5],12:i:� the highest oddsratio was observed among patients younger than 6 years.S. Typhimurium was isolated from blood with a higher oddsratio in the southern region (zones 1, 2, 3, and 4); however, agedid not appear to be a significant predisposing factor forS. Typhimurium infection.
Seasonal variations were observed among several serovars.The odds ratio for infection with S. Choleraesuis appeared tobe higher during autumn (Tables 2 and 3, Fig. 3), whileS. Enteritidis cases peaked in winter and S. I [1],4,[5],12:i:�cases increased in spring. Odds ratios for infection withS. Enteritidis and S. I [1],4,[5],12:i:� typically declined duringthe summer. S. Anatum cases typically increased duringsummer with a lower odds ratio in the remaining part of theyear (Tables 2 and 3, Fig. 3).
In comparison to the other regions, the highest odds ratiofor S. Choleraesuis infection was observed among patientsin Bangkok and the central region. Patients in Bangkok andthe central region also had the lowest odds ratio of S. I [1],4,[5],12:i:� infections. The highest odds ratio of infection withS. Enteritidis was identified in the southern region. Thenortheastern region had the lowest rate of S. Panama andS. Corvallis infections (Table 2, Fig. 4).
Diarrhea-associatedSalmonella serovars. Themost com-mon Salmonella serovars associated with gastrointestinalinfections in Thai patients were S. Stanley, S. Weltevreden, S.Rissen, S. Anatum, and S. Corvallis (Table 2). The majority ofS. Stanley infections were among patients between 0 and 5years while S.Weltevreden and S.Anatum primarily infectedpatients older than 5 years. S. Panama showed a clear asso-ciation with patients between 0 and 5 years and was typicallyrecovered from stool samples.
Geographic trends were also observed among these ser-ovars. S. Weltevreden cases were reported predominantlyfrom the southern region and the majority of S. Rissencases were reported from the northern region and Bangkok
1014 HENDRIKSEN ET AL.

0%
20%
40%
60%
80%
100%
1993
*
1994
*
1995
*
1996
*
1997
*
1998
*
1999
*
2000
*
2001
*20
0220
0320
0420
0520
0620
07
Years
Cas
es i
n p
erce
nta
ges
S. Weltevreden
S. Typhimurium
S. Stanley
S. Rissen
S. Panama
S. I [1],4,[5],12:i:-
S. Enteritidis
S. Corvallis
S. Choleraesuis
S. Anatum
Others
FIG. 1. Distribution of the top 10 nontyphoidal Salmonella serovars among Thai patients from 1993 to 2007. The top 10nontyphoidal Salmonella serovars as used in the logistic regression analysis. The chart legend lists the different serotypes onthe right, which are represented in sequential order in the chart. The percentage of cases for each serovar is represented by thedifference in thickness. *Data include all clinical Salmonella isolates.
0,0
5,0
10,0
15,0
20,0
25,0
30,0
35,0
0-5
6-10
11-1
5
16-2
0
21-2
5
26-3
0
31-3
5
36-4
0
41-4
5
46-5
0
51-5
5
56-6
0
>60
Age groups
Cas
es in
per
cen
tag
es
FIG. 2. Distribution of age among Thai patients with salmonellosis from 2002 to 2007.
0
200
400
600
800
1000
1200
1400
1600
Janu
ary
Febru
ary
Mar
chApr
ilM
ayJu
ne July
Augus
t
Septe
mbe
r
Octobe
r
Novem
ber
Decem
ber
Months
no
. of
case
s
S.Enteritidis
S.Stanley
S.Weltevreden
S.Rissen
S I.[1],4,[5],12:i:-
S.Choleraesuis
S.Anatum
S.Typhimurium
S.Corvallis
S.Panama
Others
FIG. 3. Seasonal variation of Salmonella cases from Thai patients between 2002 and 2007. The chart legend lists the differentserotypes on the right, which are represented in sequential order in the chart. The percentage of cases for each serovar isrepresented by the difference in thickness. The top 10 nontyphoidal Salmonella serovars as used in the logistic regression analysis.
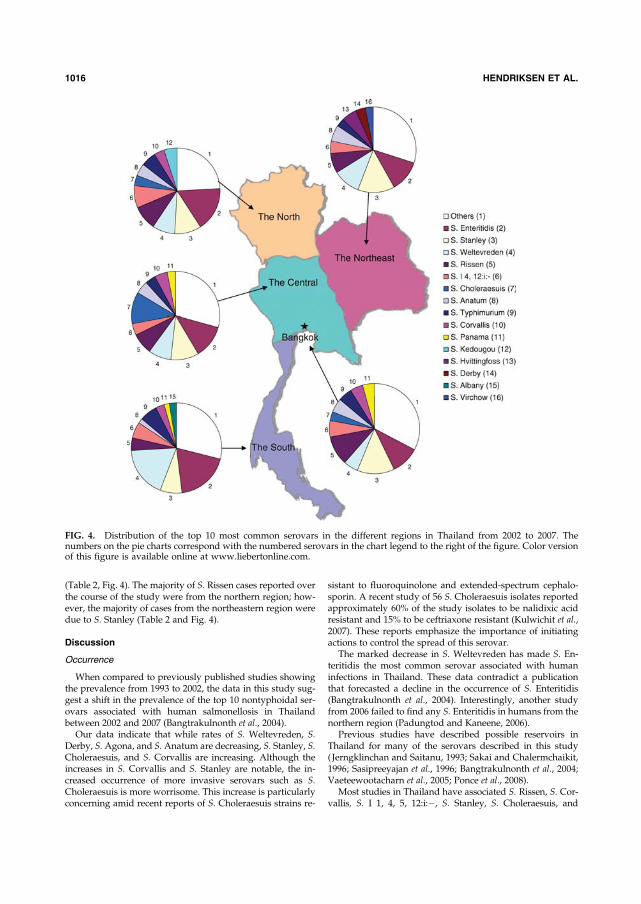
(Table 2, Fig. 4). The majority of S. Rissen cases reported overthe course of the study were from the northern region; how-ever, the majority of cases from the northeastern region weredue to S. Stanley (Table 2 and Fig. 4).
Discussion
Occurrence
When compared to previously published studies showingthe prevalence from 1993 to 2002, the data in this study sug-gest a shift in the prevalence of the top 10 nontyphoidal ser-ovars associated with human salmonellosis in Thailandbetween 2002 and 2007 (Bangtrakulnonth et al., 2004).
Our data indicate that while rates of S. Weltevreden, S.Derby, S.Agona, and S.Anatum are decreasing, S. Stanley, S.Choleraesuis, and S. Corvallis are increasing. Although theincreases in S. Corvallis and S. Stanley are notable, the in-creased occurrence of more invasive serovars such as S.Choleraesuis is more worrisome. This increase is particularlyconcerning amid recent reports of S. Choleraesuis strains re-
sistant to fluoroquinolone and extended-spectrum cephalo-sporin. A recent study of 56 S. Choleraesuis isolates reportedapproximately 60% of the study isolates to be nalidixic acidresistant and 15% to be ceftriaxone resistant (Kulwichit et al.,2007). These reports emphasize the importance of initiatingactions to control the spread of this serovar.
The marked decrease in S. Weltevreden has made S. En-teritidis the most common serovar associated with humaninfections in Thailand. These data contradict a publicationthat forecasted a decline in the occurrence of S. Enteritidis(Bangtrakulnonth et al., 2004). Interestingly, another studyfrom 2006 failed to find any S. Enteritidis in humans from thenorthern region (Padungtod and Kaneene, 2006).
Previous studies have described possible reservoirs inThailand for many of the serovars described in this study( Jerngklinchan and Saitanu, 1993; Sakai and Chalermchaikit,1996; Sasipreeyajan et al., 1996; Bangtrakulnonth et al., 2004;Vaeteewootacharn et al., 2005; Ponce et al., 2008).
Most studies in Thailand have associated S. Rissen, S. Cor-vallis, S. I 1, 4, 5, 12:i:�, S. Stanley, S. Choleraesuis, and
FIG. 4. Distribution of the top 10 most common serovars in the different regions in Thailand from 2002 to 2007. Thenumbers on the pie charts correspond with the numbered serovars in the chart legend to the right of the figure. Color versionof this figure is available online at www.liebertonline.com.
1016 HENDRIKSEN ET AL.
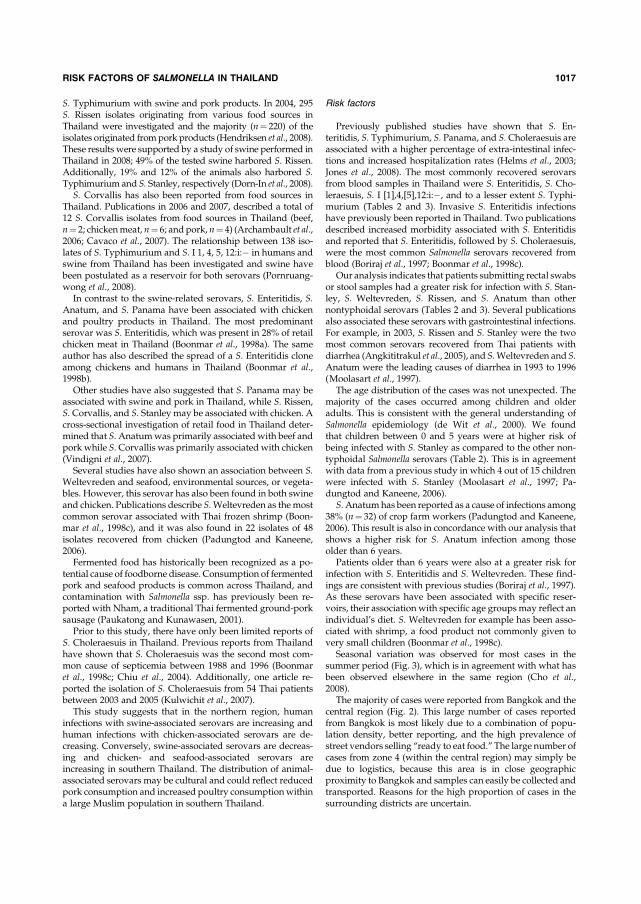
S. Typhimurium with swine and pork products. In 2004, 295S. Rissen isolates originating from various food sources inThailand were investigated and the majority (n¼ 220) of theisolates originated frompork products (Hendriksen et al., 2008).These results were supported by a study of swine performed inThailand in 2008; 49% of the tested swine harbored S. Rissen.Additionally, 19% and 12% of the animals also harbored S.Typhimurium and S. Stanley, respectively (Dorn-In et al., 2008).
S. Corvallis has also been reported from food sources inThailand. Publications in 2006 and 2007, described a total of12 S. Corvallis isolates from food sources in Thailand (beef,n¼ 2; chickenmeat, n¼ 6; and pork, n¼ 4) (Archambault et al.,2006; Cavaco et al., 2007). The relationship between 138 iso-lates of S. Typhimurium and S. I 1, 4, 5, 12:i:� in humans andswine from Thailand has been investigated and swine havebeen postulated as a reservoir for both serovars (Pornruang-wong et al., 2008).
In contrast to the swine-related serovars, S. Enteritidis, S.Anatum, and S. Panama have been associated with chickenand poultry products in Thailand. The most predominantserovar was S. Enteritidis, which was present in 28% of retailchicken meat in Thailand (Boonmar et al., 1998a). The sameauthor has also described the spread of a S. Enteritidis cloneamong chickens and humans in Thailand (Boonmar et al.,1998b).
Other studies have also suggested that S. Panama may beassociated with swine and pork in Thailand, while S. Rissen,S. Corvallis, and S. Stanley may be associated with chicken. Across-sectional investigation of retail food in Thailand deter-mined that S.Anatumwas primarily associated with beef andpork while S.Corvallis was primarily associated with chicken(Vindigni et al., 2007).
Several studies have also shown an association between S.Weltevreden and seafood, environmental sources, or vegeta-bles. However, this serovar has also been found in both swineand chicken. Publications describe S.Weltevreden as themostcommon serovar associated with Thai frozen shrimp (Boon-mar et al., 1998c), and it was also found in 22 isolates of 48isolates recovered from chicken (Padungtod and Kaneene,2006).
Fermented food has historically been recognized as a po-tential cause of foodborne disease. Consumption of fermentedpork and seafood products is common across Thailand, andcontamination with Salmonella ssp. has previously been re-ported with Nham, a traditional Thai fermented ground-porksausage (Paukatong and Kunawasen, 2001).
Prior to this study, there have only been limited reports ofS. Choleraesuis in Thailand. Previous reports from Thailandhave shown that S. Choleraesuis was the second most com-mon cause of septicemia between 1988 and 1996 (Boonmaret al., 1998c; Chiu et al., 2004). Additionally, one article re-ported the isolation of S. Choleraesuis from 54 Thai patientsbetween 2003 and 2005 (Kulwichit et al., 2007).
This study suggests that in the northern region, humaninfections with swine-associated serovars are increasing andhuman infections with chicken-associated serovars are de-creasing. Conversely, swine-associated serovars are decreas-ing and chicken- and seafood-associated serovars areincreasing in southern Thailand. The distribution of animal-associated serovars may be cultural and could reflect reducedpork consumption and increased poultry consumptionwithina large Muslim population in southern Thailand.
Risk factors
Previously published studies have shown that S. En-teritidis, S. Typhimurium, S. Panama, and S. Choleraesuis areassociated with a higher percentage of extra-intestinal infec-tions and increased hospitalization rates (Helms et al., 2003;Jones et al., 2008). The most commonly recovered serovarsfrom blood samples in Thailand were S. Enteritidis, S. Cho-leraesuis, S. I [1],4,[5],12:i:�, and to a lesser extent S. Typhi-murium (Tables 2 and 3). Invasive S. Enteritidis infectionshave previously been reported in Thailand. Two publicationsdescribed increased morbidity associated with S. Enteritidisand reported that S. Enteritidis, followed by S. Choleraesuis,were the most common Salmonella serovars recovered fromblood (Boriraj et al., 1997; Boonmar et al., 1998c).
Our analysis indicates that patients submitting rectal swabsor stool samples had a greater risk for infection with S. Stan-ley, S. Weltevreden, S. Rissen, and S. Anatum than othernontyphoidal serovars (Tables 2 and 3). Several publicationsalso associated these serovars with gastrointestinal infections.For example, in 2003, S. Rissen and S. Stanley were the twomost common serovars recovered from Thai patients withdiarrhea (Angkititrakul et al., 2005), and S.Weltevreden and S.Anatum were the leading causes of diarrhea in 1993 to 1996(Moolasart et al., 1997).
The age distribution of the cases was not unexpected. Themajority of the cases occurred among children and olderadults. This is consistent with the general understanding ofSalmonella epidemiology (de Wit et al., 2000). We foundthat children between 0 and 5 years were at higher risk ofbeing infected with S. Stanley as compared to the other non-typhoidal Salmonella serovars (Table 2). This is in agreementwith data from a previous study in which 4 out of 15 childrenwere infected with S. Stanley (Moolasart et al., 1997; Pa-dungtod and Kaneene, 2006).
S.Anatumhas been reported as a cause of infections among38% (n¼ 32) of crop farm workers (Padungtod and Kaneene,2006). This result is also in concordance with our analysis thatshows a higher risk for S. Anatum infection among thoseolder than 6 years.
Patients older than 6 years were also at a greater risk forinfection with S. Enteritidis and S. Weltevreden. These find-ings are consistent with previous studies (Boriraj et al., 1997).As these serovars have been associated with specific reser-voirs, their association with specific age groups may reflect anindividual’s diet. S. Weltevreden for example has been asso-ciated with shrimp, a food product not commonly given tovery small children (Boonmar et al., 1998c).
Seasonal variation was observed for most cases in thesummer period (Fig. 3), which is in agreement with what hasbeen observed elsewhere in the same region (Cho et al.,2008).
The majority of cases were reported from Bangkok and thecentral region (Fig. 2). This large number of cases reportedfrom Bangkok is most likely due to a combination of popu-lation density, better reporting, and the high prevalence ofstreet vendors selling ‘‘ready to eat food.’’ The large number ofcases from zone 4 (within the central region) may simply bedue to logistics, because this area is in close geographicproximity to Bangkok and samples can easily be collected andtransported. Reasons for the high proportion of cases in thesurrounding districts are uncertain.
RISK FACTORS OF SALMONELLA IN THAILAND 1017
We expected to find more human cases in the northernregion based on previous studies where 19% of a total of 403people sampled tested positive for Salmonella ssp. among thehealthy population in the northeastern region (Vaeteewoo-tacharn et al., 2005). In another study from the northern regionthe prevalence in livestock farmers and slaughterhouseworkers was 36% and 25%, respectively (Padungtod andKaneene, 2006). It could be speculated that high prevalence isassociated with working with animals and that the generalpopulation has a much lower prevalence.
The data in this study reveal a high number of infectionscaused by nontyphoidal Salmonella serovars in Thailand,which are potentially preventable. In order to address theproblem, the responsible authorities in Thailand need to takeaction to diminish the level of this burden. It is suggested thata source attribution program be created to reveal the true linkbetween the different Salmonella serovars. The informationobtained from this attribution study can then be used to con-trol these infections by launching targeted, serovar-specificinterventions against the true reservoirs.
Limitations
The epidemiological data from Thailand were based on apassive monitoring of samples submitted to the WHO Inter-national Salmonella and Shigella Centre, National Institute ofHealth.
Throughout the course of the study, three zones (7, 9, and11) consistently reported low numbers of cases (data notshown). It is not known whether this reflects actual numbersor possible data gaps. The authors do not have specificknowledge of the capacity for clinical laboratories in thesezones to isolate Salmonella spp. nor do we have any infor-mation on the local infrastructure needed for a laboratory-based surveillance system. In addition, habits and local rou-tines may differ from one part of a country to another withregard to how often a doctor is consulted.
Conclusion
The outcome of this study indicates a shift in prevalence ofthe most common Salmonella serovars responsible for humaninfections in Thailand compared to previous studies. Swine-related serovars in Thailand such as S. Stanley, S. Corvallis,and S. Choleraesuis are increasing while S. Weltevreden andS. Anatum are decreasing. Most infections among Thai pa-tients occur in the age groups 0–5, 31–35, and >60 years. Themajority of cases are reported from Bangkok and surroundingareas with a peak in reported infections during the summermonths.
Multiple risk factors, which varied by region and serovar,were identified in this study. Based on the variability of theserisk factors, the authors recommend initiating interventionstargeted to specific serovars taking regional, age group, andseasonal variation into account. We strongly encourage theThai authorities to initiate interventions against the two maininvasive serovars, S. Enteritidis and S. Choleraesuis. Inter-ventions for S. Enteritidis should be focused on patients olderthan 5 years in the southern region and interventions forS. Choleraesuis should be directed towards people older than5 years in the central region. In addition, studies can be un-dertaken to elucidate the reasons for the increase in swine-
associated serovars and identify control methods to reducethe burden of disease associated with these organisms. Wealso suggest initiating longer term prevention and controlmeasures by exploring possibilities to collect data for sourceattribution focusing on the reservoirs contributing to salmo-nellosis among the Thai population.
Acknowledgments
We are grateful to Dr. Mikoleit Matthew (WHO Collabor-ating Centre for Surveillance, Epidemiology and Control ofSalmonella and other Foodborne Diseases, Centers for Dis-ease Control and Prevention, Atlanta, GA) for performing anoutstanding review of the final version of the manuscript andimproving the English. This work was supported by theWorld Health Organization Global Salm-Surv (www.who.int=salmsurv).
Disclosure Statement
No competing financial interests exist.
References
Aarestrup FM, Lertworapreecha M, Evans MC, et al. Anti-microbial susceptibility and occurrence of resistance genesamong Salmonella enterica serovar Weltevreden from differentcountries. J Antimicrob Chemother 2003;52:715–718.
Angkititrakul S, Chomvarin C, Chaita T, et al. Epidemiology ofantimicrobial resistance in Salmonella isolated from pork,chicken meat and humans in Thailand. Southeast Asian J TropMed Public Health 2005; 36:1510–1515.
Archambault M, Petrov P, Hendriksen RS, et al. Molecularcharacterization and occurrence of extended-spectrum beta-lactamase resistance genes among Salmonella enterica serovarCorvallis from Thailand, Bulgaria, and Denmark. MicrobDrug Resist 2006;12:192–198.
Bangtrakulnonth A, Pornruangwong S, Pulsrikarn C, et al. Sal-monella serovars from humans and other sources in Thailand,1993–2002. Emerg Infect Dis 2004;10:131–136.
Bangtrakulnonth A and Tishyadhigama P. Annual Report ofConfirmed Salmonella and Shigella in Thailand, 2006. http:==webdb.dmsc.moph.go.th=ifc_nih=applications=files=Annual_report_2006.pdf.
Boonmar S, Bangtrakulnonth A, Pornruangwong S, et al. Sal-monella in broiler chickens in Thailand with special referenceto contamination of retail meat with Salmonella enteritidis. J VetMed Sci 1998a;60:1233–1236.
Boonmar S, Bangtrakulnonth A, Pornruangwong S, et al. Epide-miological analysis ofSalmonella enteritidis isolates fromhumansand broiler chickens in Thailand by phage typing and pulsed-field gel electrophoresis. J Clin Microbiol 1998b;36:971–974.
Boonmar S, Bangtrakulnonth A, Pornruangwong S, et al. Pre-dominant serovars of Salmonella in humans and foods fromThailand. J Vet Med Sci 1998c;60:877–880.
Boriraj V, Bangtrakulnonth A, Pornruangwong S, et al. Demo-graphic data on Salmonella enteritidis infection in Thailand,1990–1995. Southeast Asian J Trop Med Public Health 1997;28:774–780.
Cavaco LM, Hendriksen RS, and Aarestrup FM. Plasmid-mediated quinolone resistance determinant qnrS1 detected inSalmonella enterica serovar Corvallis strains isolated in Denmarkand Thailand. J Antimicrob Chemother 2007;60:704–706.
1018 HENDRIKSEN ET AL.
Chiu CH, Su LH, and Chu C. Salmonella enterica serotype Cho-leraesuis: epidemiology, pathogenesis, clinical disease, andtreatment. Clin Microbiol Rev 2004;17:311–322.
Cho SH, Shin HH, Choi YH, et al. Enteric bacteria isolated fromacute diarrheal patients in the Republic of Korea between theyear 2004 and 2006. J Microbiol 2008;46:325–330.
Coyle EF, Palmer SR, Ribeiro CD, et al. Salmonella enteritidisphage type 4 infection: association with hen’s eggs. Lancet1988;2:1295–1297.
Dorn-In S, Fries R, Padungtod P, et al. A cross-sectional study ofSalmonella in pre-slaughter pigs in a production compartmentof northern Thailand. Prev Vet Med 2009;88:15–23.
de Wit MA, Hoogenboom-Verdegaal AM, Goosen ES, et al. Apopulation-based longitudinal study on the incidence anddisease burden of gastroenteritis and Campylobacter and Sal-monella infection in four regions of The Netherlands. EurJ Epidemiol 2000;16:713–718.
Galanis E, Lo Fo Wong DM, Patrick ME, et al. Web-based sur-veillance and global Salmonella distribution, 2000–2002. EmergInfect Dis 2006;12:381–388.
Helms M, Vastrup P, Gerner-Smidt P, et al. Excess mortalityassociated with antimicrobial drug-resistant Salmonella Ty-phimurium. Emerg Infect Dis 2002;8:490–495.
Helms M, Vastrup P, Gerner-Smidt P, et al. Short and long termmortality associated with foodborne bacterial gastrointestinalinfections: registry based study. BMJ 2003;326:357.
Hendriksen RS, Bangtrakulnonth A, Pulsrikarn C, et al. Anti-microbial resistance and molecular epidemiology of SalmonellaRissen from animals, food products, and patients in Thailandand Denmark. Foodborne Pathog Dis 2008;5:605–619.
Herikstad H, Motarjemi Y, and Tauxe RV. Salmonella surveil-lance: a global survey of public health serotyping. EpidemiolInfect 2002;129:1–8
Humphrey TJ. Public-health aspects of Salmonella infections. In:Salmonella in Domestic Animals. Wray C, Wray A (eds).Wallingford, England: CABI Publishing, 2000, Chap. 15.
Humphrey TJ, Mead GC, and Rowe B. Poultry meat as a sourceof human salmonellosis in England and Wales. Epidemiolo-gical overview. Epidemiol Infect 1988;100:175–184.
Jerngklinchan J and Saitanu K. The occurrence of salmonellae inbean sprouts in Thailand. Southeast Asian J Trop Med PublicHealth 1993;24:114–118.
Jones TF, Ingram LA, Cieslak PR, et al. Salmonellosis outcomesdiffer substantially by serotype. J Infect Dis 2008;198:109–114.
Kulwichit W, Chatsuwan T, Unhasuta C, et al. Drug-resistantnon-typhoidal Salmonella bacteremia, Thailand. Emerg InfectDis 2007;13:501–502.
Moolasart P, Sangsujja J, Eampokalap B, et al. NontyphoidalSalmonella diarrhea in Thai children: a study at Bamrasnar-adura Hospital, Nonthaburi, Thailand. J Med Assoc Thailand1997;80:613–618.
Padungtod P and Kaneene JB. Salmonella in food animals andhumans in northern Thailand. Int J Food Microbiol 2006;108:346–354.
Paukatong KV and Kunawasen S. The Hazard Analysis andCritical Control Points (HACCP) generic model for the pro-duction of Thai fermented pork sausage (Nham). Berl MunchTierarztl Wochenschr 2001;114:327–330.
Ponce E, Khan AA, Cheng CM, et al. Prevalence and character-ization of Salmonella enterica serovar Weltevreden from im-ported seafood. Food Microbiol 2008;25:29–35.
Pornruangwong S, Sriyapai T, Pulsrikarn C, et al. The epidemi-ological relationship between Salmonella enterica serovar ty-phimurium and Salmonella enterica serovar 4,[5],12:i:� isolatesfrom humans and swine in Thailand. Southeast Asian J TropMed Public Health 2008;39:288–296.
Sakai T and Chalermchaikit T. The major sources of Salmonellaenteritidis in Thailand. Int J Food Microbiol 1996;31:173–180.
Sasipreeyajan J, Jerngklinchan J, Koowatananukul C, et al. Pre-valence of salmonellae in broiler, layer and breeder flocks inThailand. Trop Anim Health Prod 1996;28:174–180.
Vaeteewootacharn K, Sutra S, Vaeteewootacharn S, et al. Sal-monellosis and the food chain in Khon Kaen, northeasternThailand. Southeast Asian J Trop Med Public Health 2005;36:123–129.
Vindigni SM, Srijan A, Wongstitwilairoong B, et al. Prevalence offoodborne microorganisms in retail foods in Thailand. Food-borne Pathog Dis 2007;4:208–215.
Address correspondence to:Rene S. Hendriksen
National Food InstituteTechnical University of Denmark
Bulowsvej 27DK-1790 Copenhagen V
Denmark
E-mail: [email protected]
RISK FACTORS OF SALMONELLA IN THAILAND 1019