global electricity network cigre feasibility study
TRANSCRIPT

1
GLOBAL ELECTRICITY NETWORK CIGRE FEASIBILITY STUDY
Gérald Sanchis CIGRE C1.35
15 November 2018

2MedPower 2018 – 15 November 2018 - Dubrovnik
Scope of CIGRE C1.35 feasibility study
The study has to adopt one reference long term scenario for consumption and supply volumes, covering now and the year 2050.
Data and scenario 2050
(External sources)
Simulations(CIGRE C1.35)
Which Global Grid?
(CIGRE C1.35)
To carry out the first known feasibility study for the concept of a globalelectricity network.
• Supports a balanced coordination of power supply of all interconnected countries.
• Enables clean energy transmission.• Take advantage of diversity of clean energy.
Priority to clean energy consumption
INTERCONNECTION
3MedPower 2018 – 15 November 2018 - Dubrovnik
91
2
13
11
12
10
4
5
6
7
8
3
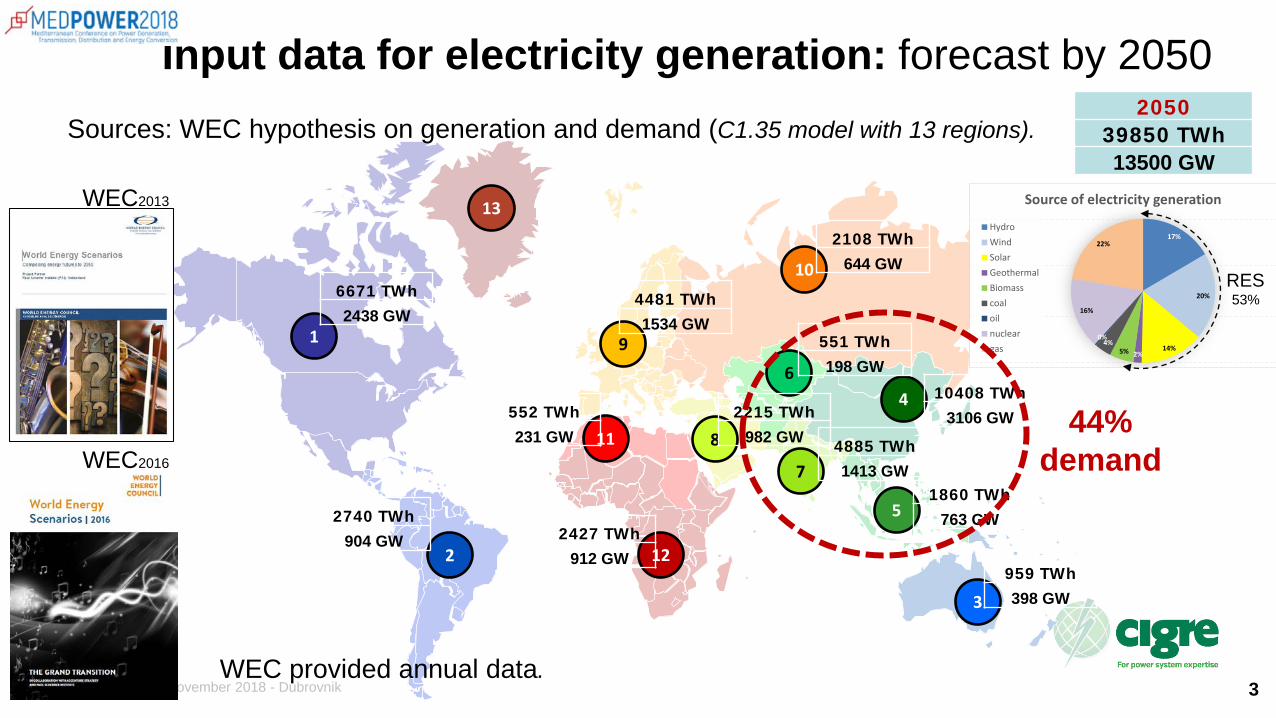
Input data for electricity generation: forecast by 2050Sources: WEC hypothesis on generation and demand (C1.35 model with 13 regions).
6671 TWh2438 GW
2740 TWh904 GW 2427 TWh
912 GW
552 TWh231 GW
4481 TWh1534 GW
2108 TWh644 GW
10408 TWh3106 GW
959 TWh398 GW
1860 TWh763 GW
551 TWh198 GW
2215 TWh982 GW 4885 TWh
1413 GW
205039850 TWh13500 GW
WEC2013
WEC2016
44%demand
17%
20%
14%2%5%
4%0%
16%
22%
Source of electricity generation
HydroWindSolarGeothermalBiomasscoaloilnucleargas
RES53%
WEC provided annual data.
4MedPower 2018 – 15 November 2018 - Dubrovnik
13
11
5
6
7
8
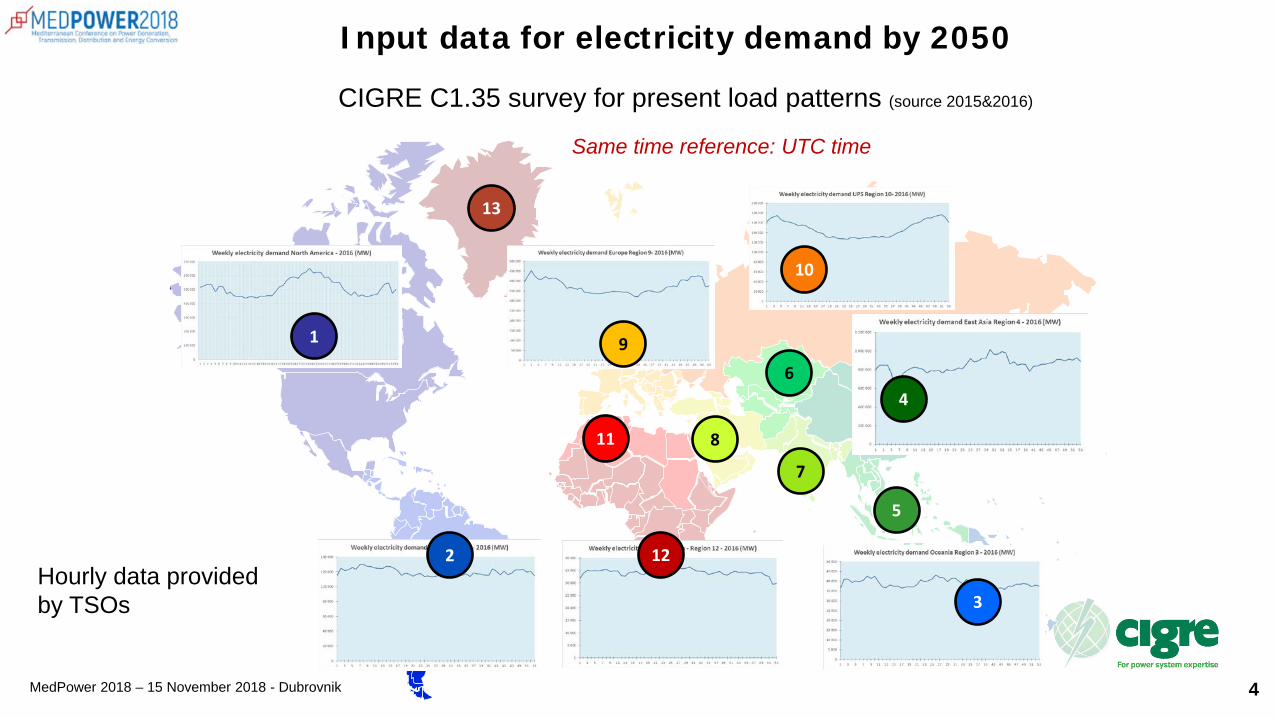
Input data for electricity demand by 2050
CIGRE C1.35 survey for present load patterns (source 2015&2016)
3
10
91
2 12
4
Same time reference: UTC time
Hourly data providedby TSOs

5MedPower 2018 – 15 November 2018 - Dubrovnik
91
2
13
11
12
10
4
5
6
7
8
3
34%16%
47%10%
38%19%
27%14%
25%12%
38%19%
38%18%
20%16%
22%19%
29%17%
37%20%
40%15%
33%18%
Wind
Solar
RES potential: capacity factors for wind & PV
World weatherdatabase developedand maintained by NASA at 0.5x0.625 latitude/longitude spatial resolution
Taking into accountconstructive parameters (PV panel and windturbine).
6MedPower 2018 – 15 November 2018 - Dubrovnik
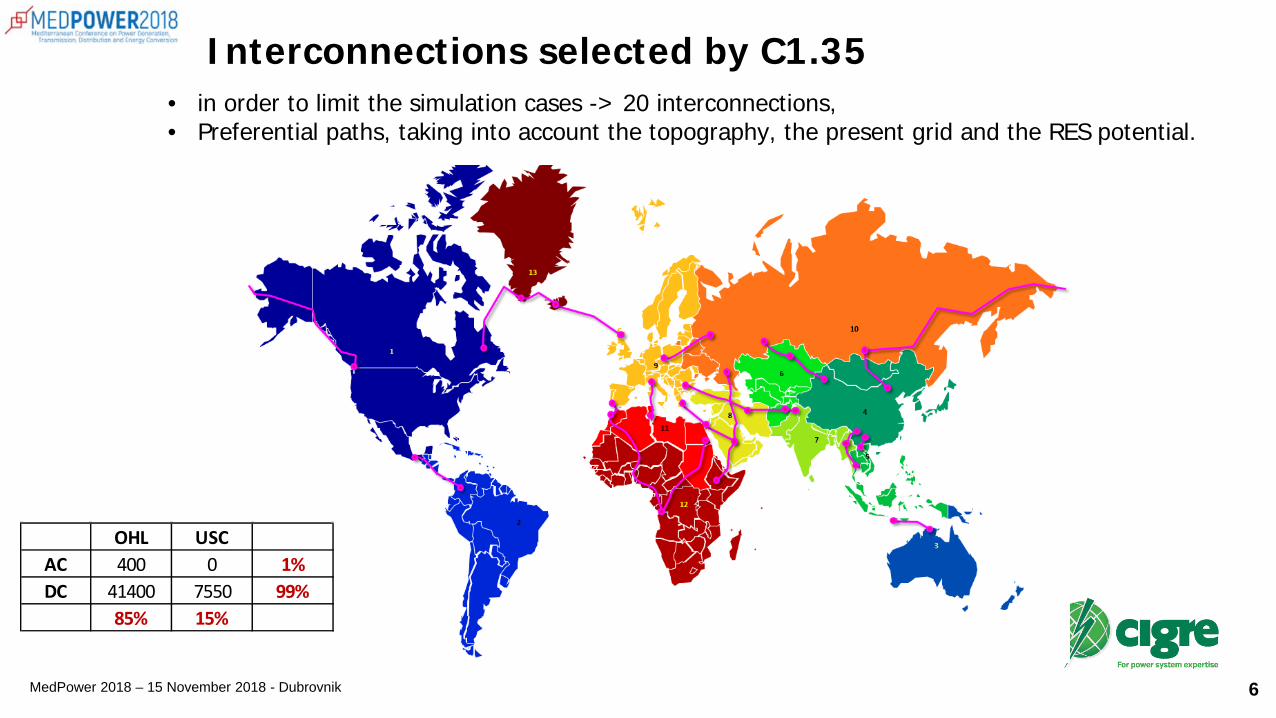
Interconnections selected by C1.35• in order to limit the simulation cases -> 20 interconnections,• Preferential paths, taking into account the topography, the present grid and the RES potential.
OHL USCAC 400 0 1%DC 41400 7550 99%
85% 15%

7MedPower 2018 – 15 November 2018 - Dubrovnik
91
2
13
11
12
10
4
5
6
7
8
3
110
486
Interconnection costs: option min cost M€/GW
1, North America2, South America3, Oceania4, North East Asia5, South East Asia6, Central Asia7, South Asia8, Middle East9, Europe10, UPS11, North Africa12, Africa13, Atlantic North
OHL USCAC 400 0 1%DC 41400 7550 99%
85% 15%

8MedPower 2018 – 15 November 2018 - Dubrovnik
Production capacity case #
Interco Wind & Solar CF storage CO2
(€/t) Comment/rationaleimposed optimized costs losses
According to WEC :
- Nuclear- Coal + CCS- Hydro- Biomass
Existing wind & PV
CCGT+CCSCCGTOCGT
New Wind & PV
0 No interco Nominal None 110 Base case1 Ref Y Nominal None 110 value of interco
1 bis Ref Y Modified 4&6 None 110 influence of CF
2 Ref No Nominal None 110 influence of losses3 Max Y Nominal None 110 Influence of grid cost
4 Ref Y Nominal Daily - low power 110
influence of storage5 Ref Y Nominal Daily - high power 110
6 Ref Y Nominal Seasonal 1107 Ref Y Nominal None 30 influence of CO2 price
NonePV only 8 Ref Y Nominal None -
Would it even be possible ?PV + Wind 9 Ref Y Nominal None -
11 case studies: to analyse the value of interconnections and the sensitivity to different factors
9MedPower 2018 – 15 November 2018 - Dubrovnik
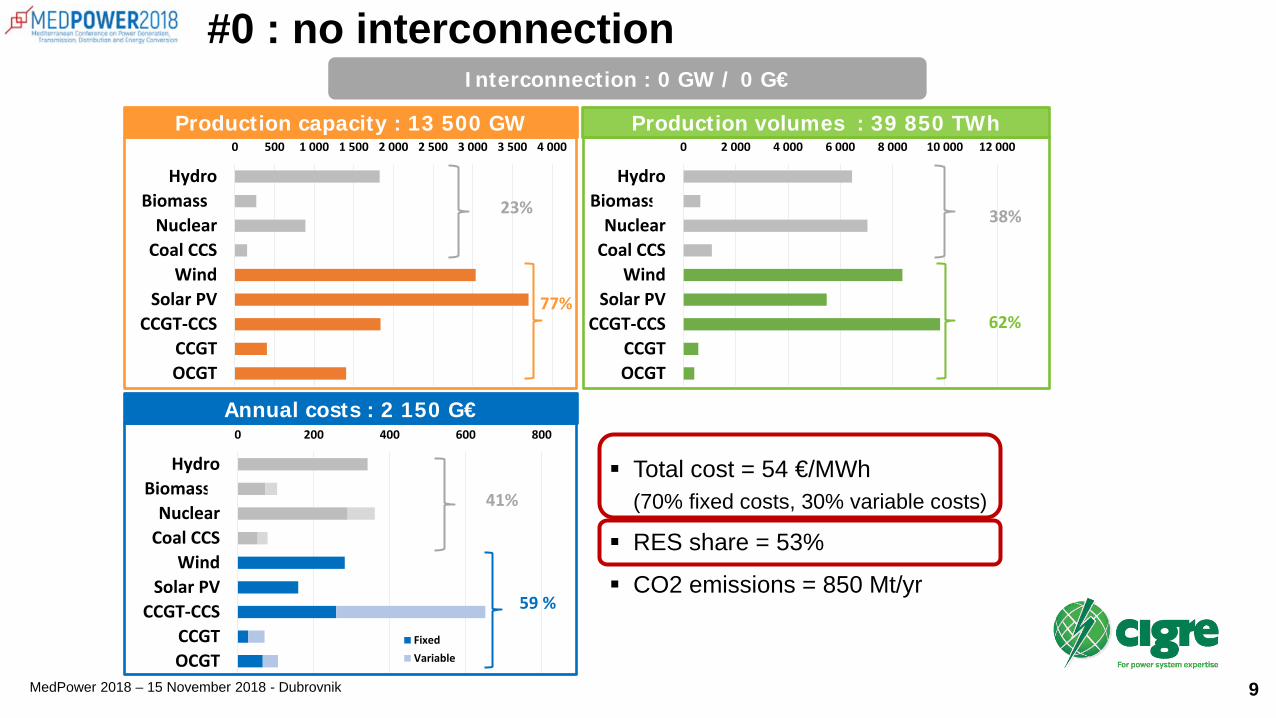
#0 : no interconnection
0 2 000 4 000 6 000 8 000 10 000 12 000
HydroBiomasse
NuclearCoal CCS
WindSolar PV
CCGT-CCSCCGTOCGT
Production (TWh)0 500 1 000 1 500 2 000 2 500 3 000 3 500 4 000
HydroBiomasse
NuclearCoal CCS
WindSolar PV
CCGT-CCSCCGTOCGT
Installed capacity (GW)
Total cost = 54 €/MWh (70% fixed costs, 30% variable costs)
RES share = 53%
CO2 emissions = 850 Mt/yr
23% 38%
77%62%
Production capacity : 13 500 GW Production volumes : 39 850 TWh
0 200 400 600 800
HydroBiomasse
NuclearCoal CCS
WindSolar PV
CCGT-CCSCCGTOCGT
Costs/yr (G€)
FixedVariable
Annual costs : 2 150 G€
41%
59 %
Interconnection : 0 GW / 0 G€
10MedPower 2018 – 15 November 2018 - Dubrovnik
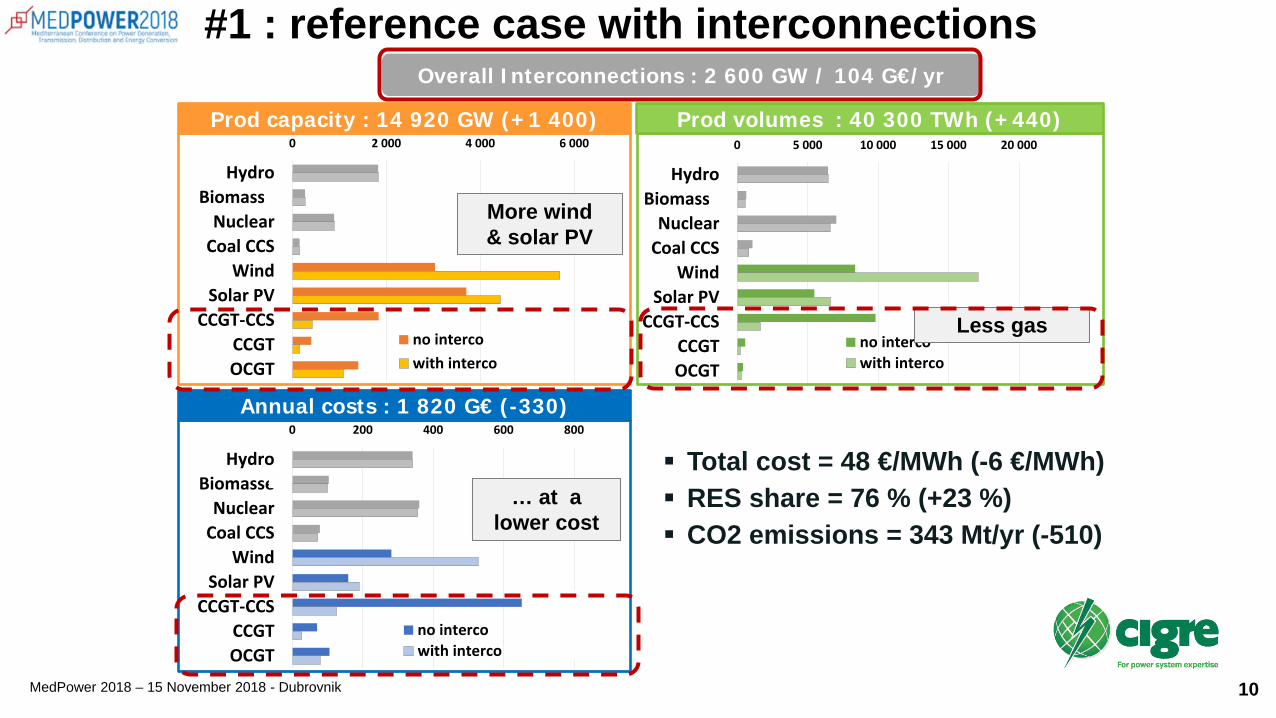
#1 : reference case with interconnections
0 200 400 600 800
HydroBiomasse
NuclearCoal CCS
WindSolar PV
CCGT-CCSCCGTOCGT
costs (G€)
no intercowith interco
0 5 000 10 000 15 000 20 000
HydroBiomasse
NuclearCoal CCS
WindSolar PV
CCGT-CCSCCGTOCGT
Production (TWh)
no intercowith interco
0 2 000 4 000 6 000
HydroBiomasse
NuclearCoal CCS
WindSolar PV
CCGT-CCSCCGTOCGT
Installed capacity (GW)
no intercowith interco
Total cost = 48 €/MWh (-6 €/MWh) RES share = 76 % (+23 %) CO2 emissions = 343 Mt/yr (-510)
Prod capacity : 14 920 GW (+1 400) Prod volumes : 40 300 TWh (+440)
Annual costs : 1 820 G€ (-330)
Overall Interconnections : 2 600 GW / 104 G€/yr
More wind& solar PV
Less gas
… at a lower cost

11MedPower 2018 – 15 November 2018 - Dubrovnik
#1 : reference case with interconnections
91
2
13
11
12
4
5
6
7
8
3
110
49
Installed capacities (GW)
964513393
38622851
14911486
166581739
57944466
142600
371121595
73310321
405681128
6410
1291369
32041676
000
WindSolarGas
10
Increase of wind capacity:
69 GW 1426 GWdue to CP
(40%)
47%
34%
27%
40%
25%
20%
33%
29%22%

12MedPower 2018 – 15 November 2018 - Dubrovnik
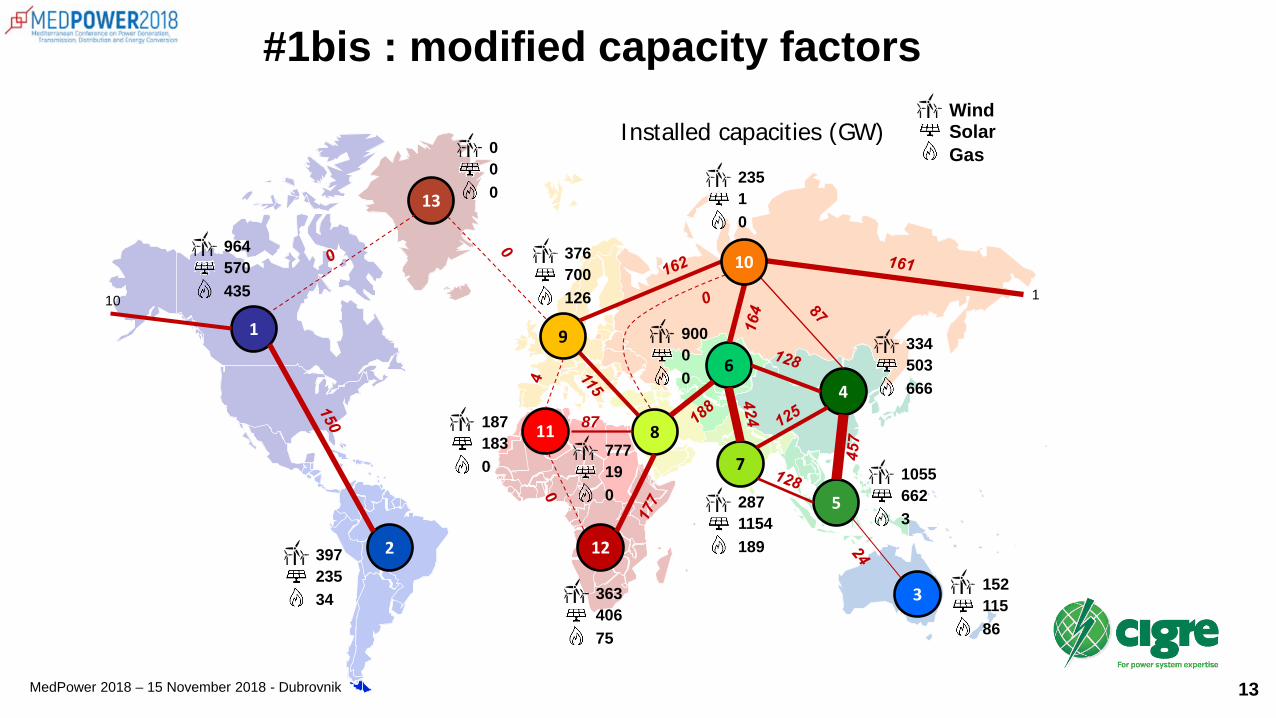
#1bis : modified capacity factors
0 200 400 600
HydroBiomasse
NuclearCoal CCS
WindSolar PV
CCGT-CCSCCGTOCGT
costs (G€)
reference #1Modified wind CF
0 5 000 10 000 15 000 20 000
HydroBiomasse
NuclearCoal CCS
WindSolar PV
CCGT-CCSCCGTOCGT
Production (TWh)
reference #1Modified wind CF
0 2 000 4 000 6 000 8 000
HydroBiomasse
NuclearCoal CCS
WindSolar PV
CCGT-CCSCCGTOCGT
Installed capacity (GW)
reference #1Modified wind CF
Total cost = 49 €/MWh (+1 €/MWh) RES share = 75 % (-1 %) CO2 emissions = 330 Mt/yr (-23)
Prod capacity : 15 300 GW (+ 400) Prod volumes : 40 220 TWh (-80)
Annual costs : 1 860 G€ (+40)
Overall Interconnections : 2 560 GW (-40) / 96 G€/yr (-8)
More windcapacity
For a lowerproduction
And an increased
cost
13MedPower 2018 – 15 November 2018 - Dubrovnik
#1bis : modified capacity factors
91
2
13
11
12
4
5
6
7
8
3
110
87
964570435
39723534
15211586
334503666
10556623
90000
2871154189
777190
376700126
23510
1871830
36340675
000
WindSolarGas
10
Installed capacities (GW)

14MedPower 2018 – 15 November 2018 - Dubrovnik
#9 : Solar PV + wind Only
9
13
11
12
5
6
7
8
3
110
849
1 5301 017
833987 337
384
5121 791
1 644515
1 6160
1 0071 341
2 0530
1 2601 529
1 7600
1 4801 187
601852
1 3340
WindSolarGas
10
2
1
4
Installed capacities (GW)
Total cost = 58 €/MWh (+10 €/MWh)
RES share = 100 % (+24%)
CO2 emissions = 0 Mt/yr

15MedPower 2018 – 15 November 2018 - Dubrovnik
All details on the CIGRE C1.35 feasibility study, soon in the CIGRE Technical Brochure and in the CIGRE website.
16MedPower 2018 – 15 November 2018 - Dubrovnik
Thank you for your attention.

17MedPower 2018 – 15 November 2018 - Dubrovnik
Production capacity case #
Interco Wind & Solar CF storage CO2
(€/t) Comment/rationaleimposed optimized costs losses
According to WEC :
- Nuclear- Coal + CCS- Hydro- Biomass
Existing wind & PV
CCGT+CCSCCGTOCGT
New Wind & PV
0 No interco Nominal None 110 Base case1 Ref Y Nominal None 110 value of interco
1 bis Ref Y Modified 4&6 None 110 influence of CF
2 Ref No Nominal None 110 influence of losses3 Max Y Nominal None 110 Influence of grid cost
4 Ref Y Nominal Daily - low power 110
influence of storage5 Ref Y Nominal Daily - high power 110
6 Ref Y Nominal Seasonal 1107 Ref Y Nominal None 30 influence of CO2 price
NonePV only 8 Ref Y Nominal None -
Would it even be possible ?PV + Wind 9 Ref Y Nominal None -
11 case studies: to analyse the value of interconnections and the sensitivity to different factors