global education census report - cambridgeinternational.org
TRANSCRIPT

Global EducationCensus Report
2018

Global Education Census Report 2018b

Global Education Census Report 2018 1
Contents
Foreword .................................................................................................. 3
Executive summary ................................................................................. 4
Introduction ............................................................................................. 7
Chapter one: In the classroom ............................................................... 9
Chapter two: Beyond the classroom ....................................................17
Chapter three: Being a teacher ............................................................ 27
Chapter four: Measuring success .........................................................33
Chapter five: Supporting students .......................................................39
Conclusion .............................................................................................43
Notes ......................................................................................................44
Contents

Global Education Census Report 20182
The Global Education Census
asked close to 20000 teachers and students around the world what
education is like where they are.

Global Education Census Report 2018 3
Foreword
This rapid pace of change is raising new questions for governments, schools and education organisations. What skills and knowledge do young people have and need in the 21st century? Are their classrooms preparing them for the world of work? How are schools embracing technology? What do teachers go into the profession for, and how do they judge their own success?
And in a world where competition for the best university places is global, how much should students prioritise extracurricular activities?
Cambridge Assessment International Education is the world’s largest provider of international education programmes and qualifications for 5 to 19-year-olds. We offer Cambridge programmes and qualifications to over 10000 schools in more than 160 countries. We also work with governments in over 30 countries as a trusted education partner in the design of their national education systems and curricula.
To help the nearly one million students around the world who are taking Cambridge programmes prepare for the future, we wanted to understand what education is like across the world today.
We wanted to understand not only what students learn, but how, and in what context, and to share these insights with the wider education community as we explore how we evolve educational programmes to meet the changing needs of students, parents and teachers. We believe there is no other organisation better placed than us to do so.
This research is a snapshot of the lives of almost 20000 respondents both inside and outside the classroom. From the use of technology in the classroom, to teacher demographics. From favourite subjects to career aspirations, this new research shines a light on the building blocks that currently make up the educational experience for students and teachers across the world.
Andrew Coombe Director, International Network,Cambridge Assessment International Education
Education is a fundamental part of young people’s preparation for life. Wherever a student lives, their education must equip them for the world they will face as they progress to adulthood.They must be ready for the exams they will sit, and able to demonstrate deep subject knowledge with conceptual understanding. They must be ready for university, primed with the analytical and critical thinking skills that will help them succeed in higher education.
They must be ready for a changing world of work, where new jobs will require flexibility, a range of skills and an independent mindset to explore new opportunities.
In short, they must be ready for the world.
Yet the task of preparing students for their future is becoming ever more difficult in a world of unprecedented change, where the shape of that future is increasingly hard to define.
Foreword

Global Education Census Report 20184
The Global Education Census explores what the education experience is like for teachers and students around the world. We explore their experiences and aspirations, the similarities and differences. Survey responses were collected from more than 100 countries. This report focuses on ten in detail, showing how education is delivered in Argentina, China, India, Indonesia, Malaysia, Pakistan, Saudi Arabia, South Africa, Spain and the US.
The report presents findings in five key areas of education – in the classroom, outside the classroom, the teacher’s role, measuring success and supporting students.
We also put this data into context and illustrate it with examples and pen portraits. Drawing on our perspective and educational expertise as the world’s leading international education organisation, we are able to offer further insight and commentary on the survey findings, based on our understanding of the global education landscape.
The result is a snapshot of the lives of students and teachers across the world in 2018.
In the classroomStudents and teachers are using multiple platforms to help their learning and teaching. New technologies are seeing widespread use in the classroom, but they haven’t replaced traditional tools. While it is interesting to see how popular these
Executive summary
devices now are, the challenge for schools is to look at how technology can support learning, rather than lead or replace it.
Half of students in our survey worldwide now use a desktop computer during lessons – but more than a third say blackboards are still used in their classrooms.
Students from China lead the world on tablet use, with one in two students using these versus the one in five global average.
The subjects studied by students are consistent around the world, with Science, Technology, Engineering and Mathematics (STEM) subjects and English language the most popular subjects globally. Mathematics is the most commonly studied subject in every one of the ten countries surveyed, followed by English language.
Outside the classroomEducation is not confined to the classroom – the pastimes and pursuits of students outside school also play an important role in supporting their learning.
Private tuition outside school is now common across the world: four in ten students (43%) say they have a private tutor or coach outside of school hours, rising to more than five in ten in China (57%) and India (55%) – but falling to just one in ten in the US.
The technology trends seen in the classroom are reflected in how students do homework. While
two-thirds of students (65%) do homework on a laptop, almost all students (98%) say they still use pen and paper. Students across the world spend an average of two hours on homework every school day.
Outside lessons, students around the world engage in extracurricular clubs and activities and play sport at school. Almost two-thirds of students globally (63%) said they play sport, preferring football (24%), badminton (23%) and basketball (22%). Almost four in ten students (37%), however, do not play any sport at school – rising to six in ten in Spain (62%) and the US (60%).
The most popular non-sporting club or activity among students globally is debate club or Model United Nations, with a quarter of students (24%) participating.
The teacher’s roleWhat motivates teachers to do their job?
Seven in ten teachers globally (71%) say teaching is a rewarding career, and more than two-thirds of teachers globally (67%) say they like working with young people – rising to eight in ten in the US. Argentina has the highest proportion of teachers who say it is a rewarding career, but the lowest proportion of teachers who say they are well paid.
Teachers spend an average of five hours per day teaching lessons, with little variation between the ten countries analysed. They typically spend another three hours per day on other related tasks such as marking or lesson planning.

Global Education Census Report 2018 5
More than half of teachers (52%) feel under pressure to ensure their students perform well in exams. One in five teachers (21%) say they feel ‘a lot of pressure’. This proportion is highest in the US and South Africa, where 37% of teachers said this.
Measuring successExams are an intrinsic feature of the education landscape across the world – but there is variation in the form and frequency of such tests. Almost three in ten teachers worldwide (28%) say students take multiple mock exams throughout the year, followed by one set of full exams at the end of the year, while a quarter (25%) say there are several full exams throughout the year.
How do teachers help students prepare for exams? Across the world, seven in 10 teachers in our research (71%) help students prepare for
MethodologyThe Cambridge International Global Education Census was carried out as an online self-completion survey for teachers and students using SnapSurveys and scripted in-house by Cambridge International.
The Census survey links were promoted and shared via social media platforms, through Cambridge International’s schools networks and channels, on the Cambridge International website and at international schools events.
Fieldwork took place between March and May 2018. Responses were received from almost 20000 teachers and students (aged 12-19 years) around the world. The survey was conducted in English.
exams by showing them how to respond to different kinds of questions. Almost six in ten (57%) say they show their students how to structure written responses such as essays, while 54% show them how to plan time in the exam. Almost half – 48% – offer extra classes to help their students prepare for exams.
Teachers across the world measure their own professional performance in a variety of ways. The majority (68%) measure their performance on the exam results of their students, while four in ten (37%) cite the proportion of students who go into higher education as a key metric.
Supporting studentsThe pastoral support schools provide takes many forms, from supporting students’ future learning, to supporting their wider needs. Careers counselling is the most commonly offered support
service, with more than half of teachers (55%) saying their school offers this, while four in ten teachers (41%) reference university and college advice. A third of teachers (33%) say their school provides healthcare services.
ConclusionWe conclude by highlighting three key areas for further discussion and development in the future:
• Why so many students use outside tutors and how it affects them.
• How schools can best help students to be digitally literate in the information age.
• When students’ aspirations for university and career are high, how education providers can support them to achieve their goals.
Executive summary

Global Education Census Report 20186 Global Education Census Report 20186

Global Education Census Report 2018 7
Introduction
Through our programmes and qualifications, we help students become confident, responsible, reflective, innovative and engaged – ready to tackle the demands of tomorrow’s world, capable of shaping a better world for the future.
However, to prepare students for a rapidly changing future, we need to understand the worlds of teaching and learning today.
What and how are students learning? What does their school day look like? What are their future aspirations and how are they preparing to realise these dreams? What motivates teachers to do their job?
This report details the findings of our Global Education Census, a survey of 10209 teachers and 9397 students across the world.
What goes on in the classroom is an essential part of the learning process, but students’ readiness and capacity to learn is affected by many other factors as well.
The higher-order skills that students need to master can be developed in a mathematics lesson, but also at their debating club or book group. Their health and wellbeing, reinforced by sports activities and support services at school, have an impact on their engagement and ability to learn. At the same time, the psychological motivation provided by dedicated, encouraging teachers and a school community that celebrates success can be an important driver for a young person.
The Census explores student and teacher experiences in all these areas, providing a broad picture of the educational environment.
Building future-ready education systems requires
designing curricula fit for the 21st century, coupled with the
consistent delivery of a basic education for everyone that builds a solid
foundation for a lifetime of adapting and developing new abilities.1
World Economic Forum 2018 report
1. https://toplink.weforum.org/knowledge/insight/a1Gb0000000LPFfEAO/explore/summary
Introduction
Cambridge Assessment International Education prepares students for life – helping them develop an informed curiosity and a lasting passion for learning.

Global Education Census Report 20188

Students across every part of the world spend most of their day in the same place: the classroom. However, their experiences of it can be very different.
In this section, we explore different aspects of the classroom experience to identify the similarities, differences and potential future trends.
Key questions included: To what extent does the experience in the classroom vary around the world? How do aspects of this experience – such as technology, subjects studied and class size – differ from country to country? And what are the areas of commonality?
In the classroom
Chapter one: In the classroom
CHAPTER ONE
9
Global Education Census Report 20181010
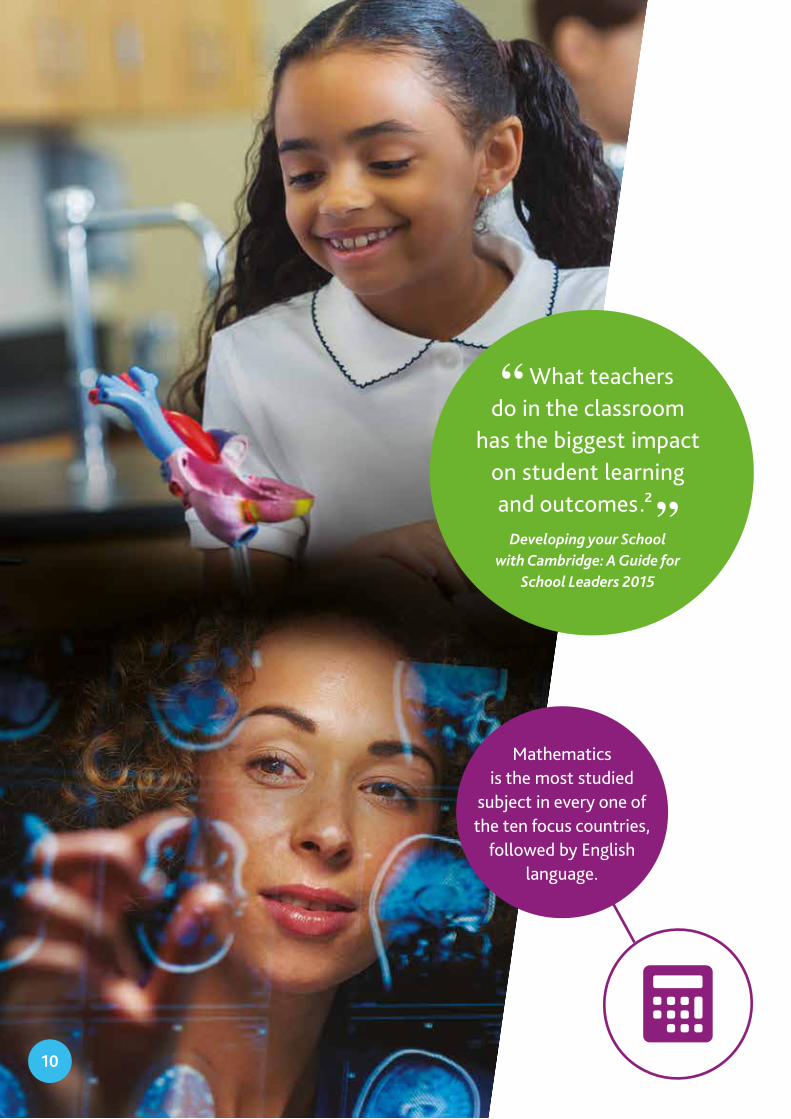
What teachers do in the classroom
has the biggest impact on student learning and outcomes.²
Developing your School with Cambridge: A Guide for
School Leaders 2015
Mathematics is the most studied
subject in every one of the ten focus countries,
followed by English language.

11
84% ENGLISH LANGUAGE
63% PHYSICS
59% BIOLOGY
88% MATHS
65% CHEMISTRY
Next, we asked students about their favourite subjects. In many cases, these reflect the most commonly studied: at a global level, the highest proportion of students (38%) say their favourite subject is maths, while an almost-equal proportion say they most enjoy studying English language (37%). Biology is the next favourite, cited by 29% of students globally in our survey.
Many students do not study the subjects they loveHowever, a high proportion of students do not currently study their favourite subjects – typically arts and humanities courses. Of the students who do not study their favourite subjects at school, 22% say music is their favourite subject, 21% say art and design, 17% say drama, 13% say English literature, 12% say history, and one in ten (11%) say computer science.
The school week – five or six days?Most students globally have a five-day school week (81%), while 14% of students say they have a six-day week. Eight in ten students (79%) attend a co-educational school with mixed classes, while just 15% attend a single-sex school. A further 6% attend a co-educational school where boys and girls have lessons separately.
What subjects do students across the world study? STEM takes centre stage in the global pictureIn a 2012 report, the UK’s House of Lords noted that: ‘the jobs of the future will increasingly require people with the capabilities and skills that a STEM education provides.3’
According to our sample, the students of today are focusing on Science, Technology, Engineering and Mathematics (STEM) subjects, sometimes at the expense of other subjects students prefer, including humanities.
The most commonly studied subjects across the world are consistent: mathematics (cited by 88%) ranks highest, closely followed by English language (84%), in every one of the ten countries surveyed.
Following mathematics and English, the next most studied subjects are sciences – chemistry (cited by 65%) and physics (63%). However, there is some regional variation.
In Argentina and the US, history is the third most studied subject after mathematics and English. In China, Spain and South Africa, the focus tends to be on humanities, with languages other than English representing the third most studied subject.
Most studiedsubjects
112. http://www.cambridgeinternational.org/Images/271309-teaching-cambridge-programmes.pdf3. https://publications.parliament.uk/pa/ld201213/ldselect/ldsctech/37/37.pdf
Chapter one: In the classroom
The Cambridge viewIn general, Cambridge International encourages schools to offer a rich and varied curriculum that allows students to pursue their passions, while recognising that a degree of specialisation is inevitable as students prepare for higher education. One option for schools for instance, could be to offer students access to additional subjects as extracurricular activities.

Global Education Census Report 201812
Class sizes around the world – more than 50 pupils in some classesWhen it comes to class sizes, globally, four in ten teachers (43%) say there are between 21 and 30 students in each class at their school, while another quarter – 25% – say they have smaller classes of 11–20 students. Less than one in ten (8%) have ten or fewer students in each class.
Larger classes of 31–40 students are reported by 17% of teachers across the world, increasing to more than a quarter of teachers in South Africa (28%), Malaysia and India (both 26%).
Larger classes are rare: just 7% of teachers report a typical class size of 41 or more. This is more common in India, with 13% of teachers in India reporting class sizes of 41–50 (compared to the global trend of 4%), and one in ten teachers (10%) referencing classes with more than 50 students, compared to 3% globally.
21–30students
The average global classroom size is: Desktop
48%
Tablet
20%
Smartboard
33%
IT suite
30%
Smartphone
42%
Whiteboard
73%
Blackboard
35%
Global percentage of students that use tech in the classroom
Student, 16, India“ I study chemistry, English language, English literature, physics and maths at school in Surat. I use pen and paper during classes, and there are blackboards in the classroom at school – but at home, I use a smartphone with pen and paper to complete my homework, which takes about an hour each day and 1–2 hours at the weekend. I attend school six days each week.
I also play basketball and cricket at school, and am in a book club and a music club – playing sport teaches me the importance of teamwork, as well as supporting my overall health. I have private tuition outside of school hours in maths, chemistry and physics – which improves my understanding of these subjects.”

134. https://go.forrester.com/blogs/the-data-digest-forrester-forecasts-single-digit-growth-for-global-smartphone-unique-subscribers-for-the-first-time-in-2018 5. https://www.theguardian.com/education/2017/dec/15/schools-approach-to-mobile-phones-varies-widely-in-uk
Chapter one: In the classroom
The Cambridge viewIt is clear that schools across the world are managing the use of multiple tools and platforms at the same time. For education providers, investing heavily in IT and related technology does not, by itself, lead to improvements in student learning outcomes and performance.
Research suggests that technology improves learning when there is a diversity of teaching practices in place; teachers are pre-trained in its use; there are many opportunities for learning through using technology – for example, deliberate practice, tutorials and problem-solving examples; and when the student, not the teacher, is in control of the learning process (for example, the pacing and choice of practice questions). Technology can also be valuable in helping students to work together.
Technology is best used to support learning, rather than try and lead it. Teachers and school leaders, with limited budgets, must invest wisely; decision-making in this area, based on research evidence, will be key to success. That is why Cambridge International offers its teachers and school leaders a range of resources and professional development qualifications in teaching with digital technologies.
In the future, we expect that students will increasingly develop their autonomy in technology selection and use, rather than it being imposed on them by the school.
Technology in the classroomAccording to analyst house Forrester, global smartphone penetration will reach 55% in 2018, with mobile technologies now an established part of people’s lives across the world.4
New technologies are clearly raising challenges for schools and education authorities around the world. The French government, for instance, imposed a ban on mobile phones in state middle schools from September 2018, while the mayor of New York lifted a ten-year ban on phones in schools in 2015.5
Our survey results show, however, that new technologies have become an established feature of school life: in many countries, students are using computers, tablets and smartboards (technology-enabled interactive boards) in the classroom.
Yet new technologies have not superseded traditional tools, and most schools use a blend of different teaching tools, with pens, paper and blackboards being used alongside interactive smartboards or tablets.
In our survey, almost half (48%) of students globally said they use a desktop computer during lessons at school, while 42% use a smartphone, a third (33%) say smartboards are used and one in five (20%) use a tablet.
While these figures show that new technologies are now firmly embedded in the modern classroom, they are supplementing rather than replacing traditional tools. Nine in ten students (90%) use a pen and paper during lessons, while almost three-quarters (73%) say a whiteboard, which is used with marker pens, is used in their lessons and 35% a blackboard. Chinese respondents lead the world on tablet use, with one in two students using these versus the one in five global average.

Global Education Census Report 201814
Student, 17, USA“ I study art, biology, computer science, history, physics and maths at school in Dallas, as well as my favourite subjects: chemistry, english literature and Spanish.
At school, I regularly use the desktop computers in the IT suite; there are whiteboards in lessons and I also use my smartphone and a pen and paper during class. I don’t have homework to complete every day, but when I do, I use a laptop or desktop computer, my smartphone and a pen and paper.
I don’t play any sport at school, or participate in any clubs or extracurricular activities but play volleyball through an external sports club at the weekends. I’m a keen member of the school’s Model UN.”
DesktopUS
75%
TabletChina
50%
SmartboardUS
59%
IT suiteIndonesia
40%
SmartphoneUS
74%
WhiteboardIndonesia
92%
Country with highest use of tech in the classroom
BlackboardIndia
67%
Stark differences between countries surveyed
There are some stark differences between countries when it comes to the uptake of specific technologies today. According to our sample, China leads the rest of the world on using tablets in the classroom, with 50% of students saying they use these. At the other end of the scale, however, in India just 8% of students use tablets in the classroom.
Other countries show above-average preferences for different tools: the US leads on smartboards, with six in ten students (59%) using these, versus the 33% global average. The US also lead on smartphone use (74%) and whiteboards are most popular in Indonesia (92%) and Malaysia (90%).
India stands out among the countries surveyed for its low adoption of new technologies and the continued dominance of traditional materials in the classroom. Students in India are least likely to use smartphones in lessons (16%, versus the 42% global average) or to reference use of whiteboards in their classroom (52%, versus a global average of 73%).
While just over a third (35%) of students worldwide say blackboards and chalk are used during lessons, this rises to 67% in India – higher than any other country. Spain and China also record widespread use of blackboards and chalk, at 64% and 57% respectively, while students are least likely to reference these tools in Indonesia (7%) and Saudi Arabia (10%).

Global Education Census Report 2018 15
The real power of mobile technology will only be realised by the power of highly skilled human
communication. For us to unleash that human power, to empower our learners, we should put communication at the centre of education. We should give teachers the skills to support the
learning of communication and language. And we should let children spend at least some of their school day in the digital space they will
spend their lives in.
Saul Nassé, Group Chief Executive Cambridge Assessment,
Education World Forum, 2016
Chapter one: In the classroom
15

16

»
Learning is not confined to the classroom. The pastimes and pursuits of students outside of the classroom also play an important role in supporting their development. The students we surveyed take part in a wide range of activities – from playing volleyball to debating at the Model United Nations. However, one finding that really stands out is the prevalence of students having private tuition across the world – standing at 43% of those surveyed.
The survey also asked students about homework, finding that it is a common factor in the lives of students everywhere.
Beyond the classroom
Chapter two: Beyond the classroom
CHAPTER TWO
Global Education Census Report 2018 17

Global Education Census Report 201818
Providing students with high-quality learning activities
in relevant situations beyond the walls of the classroom is vital for helping
students appreciate their first-hand experiences from a variety of different perspectives. Experiences outside the classroom also enhance learning by
providing students with opportunities to practice skills of enquiry, values analysis and clarification and problem solving in
everyday situations.
UNESCO
18
Almost four in ten students do not play any
sport at school – rising to six in ten
in Spain and the US.
Global Education Census Report 2018 19
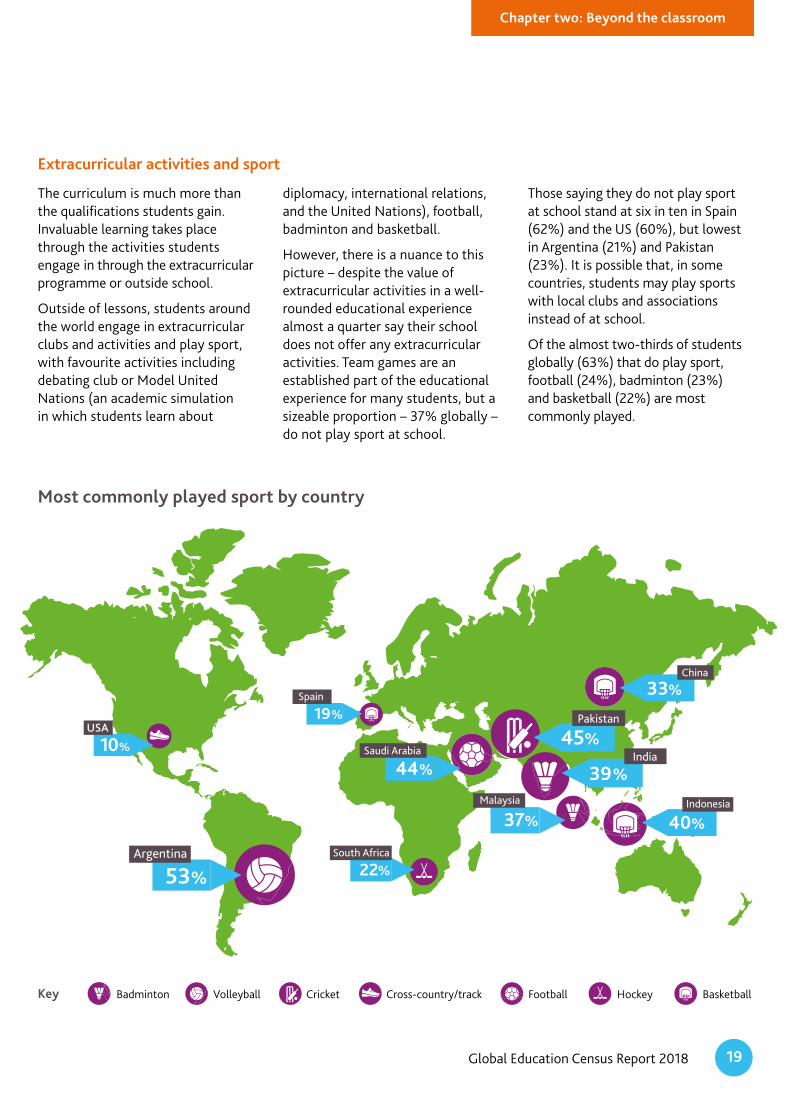
diplomacy, international relations, and the United Nations), football, badminton and basketball.
However, there is a nuance to this picture – despite the value of extracurricular activities in a well-rounded educational experience almost a quarter say their school does not offer any extracurricular activities. Team games are an established part of the educational experience for many students, but a sizeable proportion – 37% globally – do not play sport at school.
Those saying they do not play sport at school stand at six in ten in Spain (62%) and the US (60%), but lowest in Argentina (21%) and Pakistan (23%). It is possible that, in some countries, students may play sports with local clubs and associations instead of at school.
Of the almost two-thirds of students globally (63%) that do play sport, football (24%), badminton (23%) and basketball (22%) are most commonly played.
The curriculum is much more than the qualifications students gain. Invaluable learning takes place through the activities students engage in through the extracurricular programme or outside school.
Outside of lessons, students around the world engage in extracurricular clubs and activities and play sport, with favourite activities including debating club or Model United Nations (an academic simulation in which students learn about
Chapter two: Beyond the classroom
Cross-country/track FootballVolleyball BasketballKey HockeyBadminton Cricket
Most commonly played sport by country
Extracurricular activities and sport
Malaysia
37%
Pakistan
45%India
%
33%
Indonesia
40%
Saudi Arabia
44%
53%Argentina
22%South Africa
China
19%Spain
39

20
On average, students who play sport say they spend two hours per week on it – this is consistent in most of the countries surveyed, but is highest in the US. In fact, 50% of students in the US say they spend more than six hours per week playing sport. This suggests that while a lower proportion of students in the US play sport at school, those who play sport outside school devote significant time to this.
Students in South Africa also spend more time playing sport than the global average – three hours per week – while in Saudi Arabia, the average drops to one hour per week.
Most popular clubs globally
The most popular non-sporting club or activity among students globally is debate club or Model UN, with a quarter of students (24%) participating. Science clubs are also popular, with 17% of students across the world belonging to one; while 15% play a musical instrument and one in ten (11%) attend a book club.
However, almost a quarter of students (23%) across the world say their school does not offer any extracurricular activities. This is highest in Argentina, where almost six in ten students (58%) do not have access to extracurricular activities at school, and lowest in China, where only 1% say this.
24% DEBATING / MODEL UN
17% SCIENCE
15% LANGUAGES
15% MUSIC
14% ART
Most popular non-sporting school clubs by country
33% USA
38% PAKISTAN
29% CHINA
28% INDONESIA
26% MALAYSIA36%
INDIA13% ARGENTINA
23% SAUDIA ARABIA
9% SPAIN
21% SOUTH AFRICA

Global Education Census Report 2018 21
Out-of-hours lessons: private tuition is now common Private tuition outside school is now common across the world, with students in Asia most likely to receive extra lessons.
Students in China were most likely to say they have lessons outside school, but India is close behind: 55% of students there have a private tutor or coach outside school hours.
In fact, more than four in ten students say they receive private tuition in almost all the countries surveyed – the exceptions are Saudi Arabia, Argentina and the US, where just one in ten students (12%) have additional lessons. Additionally, three in ten students (31%) globally have taken an online course that was not part of their schoolwork in the past 12 months – a trend we might expect to grow over time.
The most common subject privately tutored in is maths, with two-thirds of students (66%) taking it, followed by physics (43%).
Four in 10 students (43%) say
they have a private tutor or coach outside of school
hours, rising to over five in 10 in India (55%) and China (57%) – but
just one in 10 in the US.
Chapter two: Beyond the classroom
The Cambridge view
The prevalence of private tuition may relate to the perceived importance of the subjects studied at school, i.e. maths and the sciences. Private tuition may be popular, but we believe schools remain the best place for students to learn everything they need to – and in the appropriate way. If a private tutor teaches a student different or conflicting approaches in the same subjects they study at school, it may prove counter-productive and confusing, especially when it comes to exams.
Effective schools provide all the support learners need and help students to manage their own learning. When teachers focus on helping students become effective learners, the need for additional tutoring is removed and students’ performance in high-stakes assessments improves.
It is also worth noting that, if students are not relying too heavily on tutors, they are likely to become better equipped for higher education, the workplace and life – in other words, to manage their own learning when tutors will not be available to help.
Student, 17, Malaysia“ I study at school in Kuala Lumpur. I want to go to university in the UK and have ambitions to become a psychologist. I receive private tuition outside of school hours, studying physics, additional mathematics and Islamic studies in these extra lessons.
At school, I play badminton and volleyball for 1–2 hours each week and take part in my school’s languages society. I find that playing sport helps release stress, and also helps me make new friends from my school.”

Global Education Census Report 201822
Two-thirds of students (65%) do homework on a laptop, but almost all students (98%) say they still use pen and paper.
Students across the world spend an
average of two hours on homework every
school day.

Global Education Census Report 2018 23
HomeworkHomework is a common factor in the lives of all the students we surveyed. The amount of time students typically spend on homework is consistent across the 10 countries surveyed – an average of two hours per school day.
At weekends, students spend an average of three hours on homework, with the average rising only in China and Spain, where student respondents report spending an average of four hours every weekend on their homework.
Over half of teachers – 52% globally – say they set 1–2 hours of homework per student, per week, and a further 22% set 2–3 hours of homework per week.
Chapter two: Beyond the classroom
The Cambridge view
Homework plays an important role in consolidating and progressing learning – but we consider that the quality of time spent doing homework is far more important than the quantity of time spent on it.
Studies imply that there is an optimum amount of homework of between one and two hours per school day (increasing slightly for older pupils), with effects diminishing as the time that students spend on homework increases. Students who have effective study habits, and who have learned ‘how to learn’, will gain far more from homework than those who do not.
There is some evidence that homework is most effective when used as a short and focused intervention – for example, in the form of a project. To maximise impact, it also appears to be important that students are provided with high-quality feedback on their work.
Technology and homeworkThe technology trends seen in the classroom are reflected in how students do their homework.
Two-thirds of students (65%) do their homework on a laptop, but almost all students (98%) still use pen and paper. Nearly two-thirds of students (64%) say they use a smartphone to do their homework, with students in Argentina using smartphones the most (84%). Students in the US are most likely to use a laptop when doing their homework (85%).
52%of teachers set1 to 2 hours of homework per week.

Global Education Census Report 201824
Student aspirationsThe aspirations of students around the world are high, with the overwhelming majority (91%) saying they would like to continue their studies at university after finishing school.
According to research from The Economist, however, just 32% of the student-age population were enrolled in further education in the two decades to 2012. This suggests many young people face barriers to attending university.
Just 3% of students globally say they want to go straight into a job or an apprenticeship scheme, and the same proportion want to take a year off.
Globally, a quarter of students (23%) say their ideal career is to be a doctor or dentist, while almost one in five (18%) want to be an engineer. The next most popular careers are in science (cited by 8%) and law (7%).
In most countries, students say their ideal career is medicine or dentistry – just Argentina and the US buck this trend, with engineering emerging as the most desired career in these countries.
Over 90%of students surveyed
would like tocontinue their studies
at university.
Global Education Census Report 201824

Global Education Census Report 2018 25
Chapter two: Beyond the classroom
Student, 16, Saudi Arabia“ I study at a school in Jeddah. I want to go to university in India, and hope to become an aeronautical engineer.
I play badminton, football and cricket at school, but only spend about an hour a week doing so. I enjoy many other extracurricular activities, however: I also participate in debating, art, science and gaming clubs, as well as the school orchestra.”
We asked students around the world: What is your ideal job?
A chef in a very well-known, high-quality restaurant, or owning a restaurant of my own.
My ideal job would be to be able to build various things and use my creativity to construct new inventions to change the world. I would also like to study theoretical physics to understand the universe better and be able to use what I have learned to try and explain why and how certain things work.
I would like to be a filmmaker or a journalist.
A job involving research on outer space.
I really like teaching, explaining things to people and interacting with people and to help them in some way. So I would really love to be a professor in a prestigious college.

In this section, we look at the teaching profession, asking what the teacher’s role looks like around the world. How long do they spend at the front of a class each day, and how much time do they devote to lesson planning and marking? What motivates them in their career?
Being a teacher
CHAPTER THREE
Global Education Census Report 201826

Chapter three: Being a teacher
Global Education Census Report 2018 27

Global Education Census Report 201828
Teachers love their job but do not think they are well paidNo school can be better than the quality of its teachers, so teacher motivation is critical.
We asked the teachers we surveyed what motivated them in their job.
The most popular response – from 71% of the teachers we asked – is that teaching is a rewarding career. This figure is highest in Argentina, where 79% of teachers gave this response.
The second most popular response is that they like working with young people – more than two-thirds of teachers say this globally (67%) and this rises to eight in ten (81%) in the US.
Just over a third of teachers globally (34%) say they have a good work–life balance; this is more common than average among teachers in Indonesia (42%) and Spain (40%).
Teacher pay is a different story: just 11% of teachers globally say they are well paid. They are much more likely to say this in China (28%), and least likely in Argentina, where just 2% consider themselves well paid.
Argentina stands out from this analysis as a country where teachers find their jobs fulfilling for altruistic reasons: there is a strong contrast between the high positive perception of their profession, and the low expectations around pay.
The Cambridge viewBecause the quality of teaching is so critical to student outcomes, it is important that schools allow teachers time for planning, their own professional development and collaboration with colleagues through professional learning communities, mentoring and coaching.
Teacher, 40, South Africa“ I teach history to secondary-level students at a school in South Africa. I typically teach for more than six hours every day, and complete an extra 2–3 hours of lesson planning and marking daily.
I believe that education is a rewarding career, but has its challenges: many of my students come from difficult home environments, with parents who are overworked and find it difficult to devote time to their children’s education; some parents are illiterate.
My professional performance is measured via exam results and the proportion of students who enter higher education or university. My students sit multiple sets of full exams throughout the year, and I feel a lot of pressure to ensure my students perform well in these. I help my students prepare by asking them to present a revision class themselves, choosing a topic they’ve studied over the previous year and explaining it to the rest of the class. I believe my students retain information better when they explain it to others, and they enjoy this process.”
Teacher workload Globally, teachers spend five hours per day teaching lessons, with little variation in this between the ten countries surveyed. A significant minority, however, (16%) say they teach for more than six hours per day. This proportion is highest in the US, where 30% of teachers teach for more than six hours per day; Argentina (28%); and South Africa (25%).
When it comes to time spent on work-related tasks, such as marking or lesson planning, teachers across the world spend an average of three hours per day on these duties – taking the average global workload to 7.4 hours per day.

Global Education Census Report 2018 29
34% GOOD
PROFESSIONAL DEVELOPMENT
67% ENJOY WORKING
WITH YOUNG PEOPLE
71% A REWARDING
CAREER
36% WORKING WITH
OTHER TEACHERS
34% A GOOD
WORK–LIFE BALANCE
The greatest proportion of teachers
responding to our survey
39% are aged 25–34;32% are aged 35–44;19% are aged 45–54,
8% are aged 55 or over.Just 2% are aged
under 25.
20% GOOD CAREER PROGRESSION
11% A GOOD SALARY
Chapter three: Being a teacher
What do teachers think of their job?
29

Global Education Census Report 201830
Teacher, 54, Argentina“ I teach primary-age children at a school in Mendoza, but I haven’t always been a teacher – I previously worked in a bank.
I spend 4–5 hours teaching every day, and 2–3 hours on other related tasks. I live about 20 minutes’ walk from the school I teach in. I find teaching rewarding, and think my job offers me a good work-life balance.“
Argentina has the highest proportion
of teachers who say teaching is a rewarding career, but the lowest proportion of teachers
who say they are well paid.
The pressure to performTeachers also say they feel the weight of responsibility at times: more than half (52%) of teachers say they feel pressure to ensure students perform well in their exams. One in five teachers (21%) say they feel ‘a lot of pressure’, with this proportion highest in the US (37%) and South Africa (37%).
Teacher demographics76% of teachers in our sample are women; 23% are men. Teaching is the first career for three-quarters (76%) of those surveyed, while almost a quarter (24%) have had a previous career. Those who have switched to teaching previously had careers in a wide range of fields – everything from working as a journalist; to civil engineering; marketing; fashion design; nursing; as a lab technician; an archaeologist; a banker; zoologist and psychologist.

31
Chapter three: Being a teacher

32
A young person’s educational progress is typically measured around the world by exams. Whether once a year, or more frequently, exams play a prominent role in assessing student achievement.
Exams are also an important metric for teachers – a large proportion use their students’ exam results to gauge their own performance. Increasingly, schools are judged on their students’ exam results, so teachers invest a great deal of effort in helping them prepare for exams.
Measuring success
CHAPTER FOUR
Chapter four: Measuring success
Global Education Census Report 2018 33

Global Education Census Report 201834
Exams: the traditional benchmark of success Exams are an intrinsic feature of the education landscape across the world – but there is variation in the form and frequency of them.
Today, just 6% of teachers say there is a strictly linear approach to exams for the subject they teach, with a single full set of exams at the end of the year. The results showed little variation across age groups taught. Some students take no exams in certain subjects: 7% of teachers globally said this is the case for the subject they teach, this proportion rises to 13% in South Africa and 12% in the US.
Teachers also help their students prepare for exams. Across the world, the most popular way of helping students prepare for exams is showing them how to respond to different kinds of questions. Almost six in ten (57%) say they show their students how to structure written responses such as essays, while 54% show them how to plan time in the exam. Almost half (48%) offer extra classes to help their students prepare for exams.
Global frequency of exams
One in ten take a set of mocks, and one full set of
exams at the end of the year
of students take several full exams throughout
the year
¼
Three in ten students take multiple mock exams throughout the year
of students take two full sets of exams per year
¼
The Cambridge viewGood assessment is at the heart of a good education. At Cambridge International, we recognise that assessment has two important roles: to prove and improve – to prove what students are learning, and to suggest how they can improve their understanding and skills.
By far the most important form of assessment that helps students to learn is assessment that makes learning and thinking visible. This is sometimes called ‘assessment for learning’ or ‘formative assessment’. It is aimed at providing rich and accurate data to teachers and students about what students understand, and therefore what they need to work on next, in the process of the learning journey, rather than at the end
of a stage of learning. Formative assessment also helps students understand what excellence looks like and their performance in relation to it, helping them learn how to learn.
Summative, high-stakes assessment at the end of a programme of study can provide valuable evidence of a student’s achievement. Summative assessment should be occasional. We believe that putting students’ learning first leads to improved performance in final exams. By taking exams when students’ understanding is deepest, they will not face assessment before they are ready. If learning is maximised and supported, performance in examinations will inevitably improve.

Global Education Census Report 2018 35
Celebrating achievement
26% SPECIAL NOTE
26% HONOUR ROLL
18% LETTER HOME
18% DURING REGULAR
ASSEMBLY
Other ways of celebrating success
Most popular ways of celebrating success
30% PRIZES
30% SPECIAL
ASSEMBLY
52% TROPHIES
Preparing for exams and equipping
students to sit these is a key part of many teachers’ time – but so, too, is celebrating
academic achievements once students receive
their results.
Chapter four: Measuring success
71% of teachers
prepare students by showing them how to respond to different
questions.
Global Education Census Report 2018 35

Global Education Census Report 201836
Measuring teacher performanceTeachers across the world measure their own professional performance in a variety of ways. While the majority (68%) measure their performance on the exam results of their students, almost four in ten (37%) use the proportion of students who go into higher education as a key metric for themselves. This is most popular in Pakistan, where 45% of teachers use the number of students entering higher education as a benchmark.
A much smaller proportion of teachers globally – 15% – use the number of students who go into employment as a measure of success. This is highest in India, at 19%, and lowest in China, where just one in ten (11%) rate their own achievement on this measure.
Some schools and teachers use broader measures of effectiveness. One in five teachers (21%) say they measure their own success by ‘student satisfaction’, ‘how much a student has improved over the course of their tutelage’, ‘when students apply given knowledge in the real world’, ‘the happiness of students’ and ‘students’ personal, emotional and creative development’.
Teacher, 46, Pakistan“ I teach mathematics for 4–6 hours each day at a school in Karachi. I like working with the other teachers in my school, and have good professional development opportunities; I expect to move up the career ladder.
I measure my own professional performance on the grades my students receive in their exams. Accordingly, I give them a great deal of support in preparation for their exams – both the full set at the end of the year, and the preparatory mock exams they sit at multiple points in the calendar. I feel a moderate amount of pressure to make sure my students succeed by showing them how to plan time in exams, giving them study periods for their own revision, and running extra classes and after-school practice exams.
To mark the achievements of students, my school adds special notes to report cards and celebrates success as part of the school’s regular assembly.”
Teacher, 33, China“ I teach English at a school in Hong Kong. My students sit several full sets of exams throughout the year, and I gauge my own performance on the outcome of these exams, as well as my students’ attention and attendance.
In the run-up to exam periods, I show my students how to plan time in an exam, and how to respond to different types of questions. I also run extra classes, after-school practice exams, and share past papers for students to practise themselves. I don’t just provide exam support, however: I also take time to hold after-class conversations with my students on topics like future academic goals and subject choices.
My school celebrates academic achievements in many different ways: not only are these highlighted as part of the school’s regular assembly, the school also provides trophies, certificates and prizes to recognise success. The school also has an honours board, recording the names of its highest achievers.”
The Cambridge viewA good measure of school effectiveness is the extent to which a school progresses the learning of all of its students – regardless of background – beyond their normal expected developmental rate of growth. Learning must be broadly defined to include student health and wellbeing as well as academic performance.

68% EXAM
RESULTS
37% STUDENTS WHO GO INTO HIGHER
EDUCATION / UNIVERSITY
15% STUDENTS WHO
GO INTO EMPLOYMENT
How teachers measure
their success
Chapter four: Measuring success
Global Education Census Report 2018 37
Recognising success is not a standard priority: more than one in ten teachers (14%) across the world say their school does not celebrate academic
achievement.

In the previous section, we looked at how teachers and schools help students prepare for exams. Support provided by schools extends further, to cover pastoral care and non-academic support.
Supportingstudents
CHAPTER FIVE
38

Chapter five: Supporting students
Global Education Census Report 2018 39

41% UNIVERSITY /
COLLEGE ADVICE
55% CAREERS ADVICE /
COUNSELLING
23% MENTAL
HEALTHCARE
27% RELATIONSHIP/ SEX EDUCATION
18% VOCATIONAL
TRAINING
Non-academic support provided to students at school
around the world
33% HEALTHCARE
A third of teachers (33%) say their school
provides healthcare services, rising to half of teachers (52%) in India and four in ten (43%)
in Malaysia and Indonesia
40 Global Education Census Report 2018

Global Education Census Report 2018 41
The pastoral support the school provides takes many forms, from careers counselling or advice on university or college applications, to those that support wider needs, such as healthcare and relationship education.
Careers advice or counselling is the most offered support service, with more than half of teachers (55%) saying their school offers this. This is highest in India (72%), Malaysia (70%) and Pakistan (65%), while in Argentina, just three in ten teachers (30%) say this is something their school provides.
University and college advice or counselling is also popular, with four in ten teachers (41%) saying their school offers this – rising to approximately half of teachers in Malaysia (53%), the US (50%) and China (48%). Almost one in five teachers worldwide (18%) say their school provides vocational training – in other words, training that prepares students with the practical skills for specific jobs and industries.
Healthcare is another common support service offered by schools. A third of teachers (33%) globally say their school provides healthcare services, rising to half of teachers (52%) in India and four in ten (43%) in both Malaysia and Indonesia, while almost a quarter of teachers globally (23%) say their school provides mental health care. More than a quarter of teachers (27%) reference relationship or sex education in their school; this is highest in South Africa, where more than four in ten teachers (43%) mention this.
It is worth noting, that almost one in five teachers (18%) say their school does not provide any of the support services mentioned above – suggesting that while non-academic support is now widespread in schools, it is not a universally established feature of education.
Chapter five: Supporting students
A variety of services: from healthcare to careers counselling
Teacher, 60, Spain“I teach English language at a secondary-level school in Seville. I measure my own performance on the exam results my students achieve, as well as the proportion who go into higher education and the proportion who go into employment. To this end, I provide my students with extra support ahead of their exams: I show them how to structure written answers, how to plan time in an exam, how to respond to different kinds of questions, and how to create a personal revision schedule. My students not only receive extensive support in preparing for exams, they also benefit from a wide range of pastoral services, including careers counselling, advice on universities, vocational training for work, healthcare, mental healthcare and relationship education.”
Teacher, 32, Indonesia“I teach 14–18-year-olds at a school in Jakarta. I like working with young people and find teaching a rewarding career.My school provides a number of different services to students. It’s particularly strong for services relating to students’ future aspirations, offering careers advice, guidance on universities and vocational training – but it also offers healthcare services to our young people.”

Global Education Census Report 201842

Global Education Census Report 2018 43
Conclusion
Conclusion
The impact of technology on classroom learning and homework is another area of interest. The main finding from the survey is that both students and teachers are using technology to add value to and enhance their teaching and learning. However, technology is not an end in itself and its use should be blended with other tools. How do schools choose which platforms to use and how are teachers managing them?
How are education providers and other authorities supporting schools to ensure that students are digitally literate and able to skilfully navigate a technologically driven world?
Finally, students have high aspirations. Across all countries surveyed, the vast majority of young people want to go to university, and they are ambitious for careers in prestigious and rewarding professions: they aspire to become doctors, dentists, lawyers or engineers.
The dominating focus of STEM subjects among the topics students study and prefer suggests that they are laying the foundations for the careers they aspire to. The question is, how will their expectations evolve as new types of jobs and career structures evolve in the future?
To deliver on the high expectations of today’s students, their education needs to be fit for the future, encompassing deep subject knowledge with conceptual understanding. Their curriculum must open up new ways of thinking about, understanding and interpreting information, so they develop the skills that will enable them to be flexible and adaptable in a world of increasing uncertainty.
As an education provider, we believe it is vital to understand the educational lives of students and teachers. The findings will help to inform our policy and programme development as we strive to ensure our qualifications prepare students for a competitive and global world.
The purpose of conducting the Global Education Census 2018 was to provide detailed insights into the world of education today – both inside and outside the classroom – from the viewpoints of almost 20000 respondents. While some of the findings were in line with our expectations – the amount of homework given, the length of the school day, or how schools measure success – others provide more food for thought and for further research.
For instance, why do so many students find it necessary to get help from outside tutors? And how does it impact their ability to manage their studies independently?
We believe effective schools provide all the support learners need and help students to manage their own learning. If students are able to manage their own studies, they are likely to become better equipped for higher education, the workplace and life.

Global Education Census Report 201844
Cambridge Assessment International Education prepares school students for life, helping them develop an informed curiosity and a lasting passion for learning. We are part of the University of Cambridge.
Our global community – nearly a million students in over 10000 Cambridge schools in 160 countries – benefits from qualifications internationally recognised by employers and over 1400 universities worldwide, including over 500 in the US (including the Ivy League) and all UK universities.
We have been providing international exams for more than 150 years. We are a not-for-profit organisation and
Notes
the only exam board wholly owned by a world-leading university.
Our Cambridge Pathway gives students a clear path for educational success from age 5 to 19. Schools can shape the curriculum around how they want students to learn – with a wide range of subjects and flexible ways to offer them. It helps students discover new abilities and a wider world, and gives them the skills they need for life, so they can achieve at school, university and work.
The four stages of the Cambridge Pathway lead seamlessly from primary to secondary and pre-university years. Each stage builds on the learners’ development from the previous one
or from other educational systems. Schools can adopt one stage or several stages.
Five elements lie at the heart of a Cambridge education: international curriculum, teaching and learning, assessment, international recognition and global community.
We believe education works best when curriculum, teaching, learning and assessment are closely aligned. Our programmes develop deep knowledge, conceptual understanding and higher-order thinking skills, to prepare our students for their future. We encourage teaching practice that engages students in their own learning, and we support our programmes with
The Global Education Census explores classrooms around the world today from the perspective of students and teachers.
The Global Education Census was carried out as an online self-completion survey for teachers and students using Snap Surveys and scripted in-house by Cambridge International. The survey links were shared via social media platforms, through Cambridge International’s schools networks and channels, on the Cambridge International website and at international schools events. Fieldwork took place between March and May 2018. Fieldwork took place between March and May 2018, and responses from almost 20000 teachers and students (aged 12-19) around the world were received.
Global total Argentina China inc.
HK/Macau India Indonesia Malaysia Pakistan Saudi Arabia
South Africa Spain USA Rest of
World
10209 636 426 4453 637 529 624 555 609 528 742 470
Teachers
Global total Argentina China inc.
HK/Macau India Indonesia Malaysia Pakistan Saudi Arabia
South Africa Spain USA Rest of
World
9,397 597 473 3927 502 556 696 496 599 698 636 217
Students
The number of respondents globally and per country breaks down as follows:
About Cambridge Assessment International Education

Global Education Census Report 2018 4545
Notes
high-quality resources. Our view is that assessment should both prove and improve students’ learning, giving them focus, pace and challenge.
We organise our assessment in a way that maximises time for teaching and learning.
Cambridge Assessment, our parent organisation, has deep experience and expertise in English language learning, developing education on a national level and international education. It provides leading academic and assessment research, and has the largest assessment research team in Europe.
Pen portraitsPlease note that, while the pen portraits in this report are informed by the survey data and supplemented by written interviews with teachers and students, some details have been changed to protect the anonymity of participants.
The Global Education Census
explores classrooms around the world today
from the perspective of students and
teachers.

Cambridge Assessment International Education Shaftesbury Road, Cambridge CB2 8EA, United Kingdom t: +44 1223 553554
www.cambridgeinternational.org
Copyright © UCLES November 2018 *2651682666*