global economic crisis and margins of trade-an …
TRANSCRIPT

GLOBAL ECONOMIC CRISIS AND MARGINS OF TRADE-AN
EXPLORATION
PRITAM CHATTERJEE1
1 Guest Lecturer,Sarojini Naidu College For Women
30, Jessore Road, Kolkata, West Bengal 700028, [email protected]
Abstract- In terms of economic development, it makes a difference whether export increases at
the extensive (new trade flows) or intensive margin (traditional, well-established trade
flows).Global Economic Crisis,starting from US, then Europe,really started to showing its effect
on 2008.Not only the GDP declines,but also world trade declines rapidly.There are two types of
trade margins-1)Extensive and 2)Intensive . This paper seeks to determine whether the recent
decline in international trade has affected relatively more trade at the extensive margin or at the
intensive margin..Time period is 2003-2012,from these,2003-2007 is the pre crisis period and
2008-2012 is the crisis and post crisis period. The overall results indicate that the economic crisis
of 2008 and 2009 has had more severe implications for those bilateral trade flows that did not
exist before 2006. The analysis is done for Emerging Market Economies as EMEs are fastest
growing economy.
JEL CLASSIFICATIONS-C1,F1
Keywords-Crisis,Intensive Margin,Extensive Margin,Bilateral Trade,Emerging Market
Economy
1. INTRODUCTION-
The world economy started slowing down since the third quarter of 2008 leading to an economic
crises worldwide. GDP declined from an average growth of 3 per cent during 2003-2007 to 1.5
per cent during 2008-2012. The decline of world GDP growth was the sharpest at 42 per cent
during the third quarter of 2008 to the second quarter of 2009. Not only capital inflows to
developing and emerging market economies declined during this period, there has been
significant shrinking of markets for developing country exports. World trade declined rapidly
beginning in the third quarter of 2008 through the second quarter of 2009 . World trade declined
in real terms by 12.2 per cent during 2008-2010, with a larger decline of 30 per cent in world
trade between the third quarter of 2008 and the last quarter of 2009 (UNCTAD, 2009). This
recent global economic slowdown originated in the financial sector of the United States, where
the housing market sold sub-prime mortgages to large number of consumers with inadequate
income.The financial crisis very rapidly spreaded to real sector in the US economy. The
economic crises spreaded to Europe and then to rest of the world. There was a short-lived
recovery in 2010, but the global economoy slipped into deep recession in the latter half of 2011.
During the crises since 2008, there is a change in trade pattern as well. While it is
important to understand that there might have been loss of trading partners, trade intensity with
respect to traditional trading partner fell substantially as well. Further, trade in new products
might have been adversely affected during crises, trade in traditional products, even though
survived, could have declined. The adverse impact of crises could have been larger in Emerging
1 Guest Lecturer,Sarojini Naidu College For [email protected]
Pritam Chatterjee, Int.J.Eco.Res, 2016, v7i1, 27 - 43 ISSN: 2229-6158
IJER - JAN - FEB 2016 Available [email protected]
27

Market Economies(EMEs), who have transformed through rapid increase in trade and capital
flows during globalization. This dissertation investigates into the extent to which the recent
global economic crises has impacted on trade in emerging market economies. The issues relating
to global economic crises and its impact on emerging market economies trade can be arrived at
from a review of the existing literature.
2. Review of Literature
The literature on global economic crisis and its impact on trade is large and also growing.
Even though Rakshit (2002) argues that the impact of decelerating exports on GDP growth was
large during the East Asian crises, Duttagupta and Spillimbergo (2004) show that export volumes
from East Asian countries responded with a notable lag to large exchange rate depreciations
following the 1997 East Asian crisis. Two main explanations have been proposed on this
observed lag: that contraction in domestic credit affected supply of exports and that “competitive
depreciation” by other countries neutralized the effects on demand for exports. The main results
are that demand for East Asian exports is very sensitive to prices – both their own and
competitors’ – and to world import demand. Export supply prices are very sensitive to
depreciation and domestic input prices. These results indicate that competitive depreciation
played a key role in exacerbating the real effects of the crisis by working through a trade channel
and that these effects occur relatively quickly between 4 months and 16 months.
Most studies show a large decline in trade across countries, especially emerging market
and developing economies. Shelbourne (2010) shows that the global financial crisis of 2007-
2010 impacted trade both globally and more severely for the European emerging market
economies, as compared to other regions of the world. It is found that exports for over one half
of these European economies declined by more than 50 per cent between the third quarter of
2008 and the first quarter of 2009. The terms of trade also deteriorated significantly. Meyn and
Kennan (2009) show the impact on LDC exports was extensive though varying across sectors.
Demand for exports contracted during ther period. In addition to declining prices and lower
demand for some goods, the global financial crisis has also affected developing countries by
aggravating the price volatility for some commodities, increasing revenue uncertainty for
commodity-dependent countries. On the other hand, Liu (2011 shows that “overshooting effect”
on exports during crises cannot be explained by demand or volatility in exchange rates. Because
of the adjustment in inventory and overcorrection in demand forecast by every entity of the
supply chain when facing an economic crisis, exporting countries, which were at the upstream
end of the supply chain, faced a much greater demand oscillation than the demand at the retailer
end. A longer supply chain implies larger demand variability and bigger export fluctuations
when economic crisis occurs.
Rakshit (2010) explains decline in trade in emerging market economies during crises in
terms of demand and income elasticity of demand and disinvestment in inventories, he also
provides with a supply side view of trade contraction during crises by relating it to credit
constraints. The study argues that with EME exporters and importers experiencing credit
stringency during crises, volume of trade fell and this had considerable contractionary
consequences. The credit-constrained fall in exports led to a decline in domestic production and
demand. However, such disruptions in EME trade forming part of the global value chain tended
to have a disproportionately large impact on total trade relatively to the cutback in credit or fall
in world income. Thus, demand-side explanations to contraction in trade during crises do not
deny the role of credit constraints faced by exporters. In addition to declining demand for trade
Pritam Chatterjee, Int.J.Eco.Res, 2016, v7i1, 27 - 43 ISSN: 2229-6158
IJER - JAN - FEB 2016 Available [email protected]
28

in emerging market economies during crises, evidence from IMF Trade Finance Survey 2008-09
shows that cost of trade finance increased leading to lower availability of trade finance during
crisis (Dorsey 2009).
Milan (2010) finds that world trade declined dramatically in 2009, which was on account
of a fall in the intensive margin rather than extensive margin. Further, the fall in demand for
tradable goods, in particular durables and intermediate goods, is the most important explanation
for the decline in the intensive margin. In addition, trade finance and involvement in global value
chains do explain downturn in trade to some extent. Nicita and Klok (2006) show that the
magnitude of economic crisis had severe implications on bilateral trade flows with the economic
crisis likely to affect the global economy and global trade by producing delays in the
international product cycle. The recent decline in international trade, as argued in the paper, is on
account of traditional and larger exporters lesser likelihood of new entrants surviving the crises.
The study shows that, within each HS six-digit product, small trade flows are less likely to
survive the crises, while traditional and larger trade flows having a higher probability of survival.
Berman, Sousa, Martin and Mayer ( 2012) show that the effect of crises in destination countries
is magnified at both the intensive (export volumes and values) and the extensive margin (exit
probability) of firms levels.
Bricongne, Fontagn, Gaulier-Taglioni and Vicard (2011) show that global trade
contracted during the recent global crisis, which is largely on account of unprecedented demand
shock and product characteristics. While all firms have been affected by the crisis, the effect on
large firms has been mainly at the intensive margin and has resulted in a smaller portfolio of
products being offered to export destinations. Bergeijk (2015) explains trade collapse during the
1930s and 2000s in terms of demand shock, manufacturing share in imports and the political
system, with demand shock being the most significant factor explaining trade downturn globally.
It is also evident that heterogeneity is important for understanding the drivers of global trade
collapse.
On the whole, based on some recent literature on global economic crises and trade, it is
evident trade, growth and intensities, declined during crises. However, it remains inconclusive
whether such declines occur at the intensive or/and the extensive margins. Moreover, some these
exisiting studies only provide conjectures on the margins of trade. Further, the studies do not
provide any explanation on observed trade patterns in terms bilateral intensities except for an
explanation in terms of demand shock. This study attempts to fill in these gaps and add to the
existing literature.
3. The Methods and the Data
In this study, trade performance during economic crises is primarily measured in terms of
Intensive and Extensive Margins. An analysis of trade margins helps understanding of trade
patterns and the relative efficiency with which economies allocate resources. Intensive margin
refers to the same firm or country exporting the same product to the same trading partner. The
extensive margin, in contrast, tracks changes in trade on account of entry and exit, such as a new
firm/country entering or an existing firm/country exiting a market. In this section, studies that
have used the concepts of intensive and extensive margins of trade in analyzing trade
performance are reviewed.
Besedes and Prusa (2007), based on countries performance at the extensive and intensive
export margins, show that even though both developing and developed countries have a large
number of new exporting relationships. For developing countries, export growth could have
Pritam Chatterjee, Int.J.Eco.Res, 2016, v7i1, 27 - 43 ISSN: 2229-6158
IJER - JAN - FEB 2016 Available [email protected]
29

better had there been an improvement in performance with respect to the two key components of
the intensive margin: survival and deepening. Amurgo and Pierola (2007) show that exports at
the intensive margin explaining differences in overall export growth across nations, even though
diversification on the rise among developing countries. Scherer and Bittencourt (2011), based
on the calculation of intensive and extensive margin, show that Brazil is gaining importance in
international trade since the early 2000s in terms of bigger and deeper trade relationships.
Türkcan (2011) investigates into intensive and extensive margins to find the sources of export
growth in Turkey and finds export growth across each product category is mainly at the intensive
margin. In addition, extensive margin has also performed well. Veeramani and Gupta (2014)
also uses the concepts of the margins of trade to compare and contrast export performance in
India and China. The study shows Indias exports lags significantly behind China in terms of
intensive margin due to an abysmally low and stagnant quantity margin rather than lower
extensive margin. Further, in a multilateral framework, Dutt, Mihov and van Zandt (2012) show
the impact of WTO on trade performance in terms of intensive and extensive margins of trade. It
is found WTO has positive impact on extensive margin and negative impact on intensive margin
with WTO reducing the fixed rather than variable costs of trade.
Further, the margins of trade are increasingly explained in terms of factors used in the
gravity framework. For instance, Lawless (2010), using gravity model specification, finds that
trade costs play a significant role in understanding extensive and intensive margins in US exports
across 156 countries. Most of the variables relating to trade costs affect US exports only through
their influence on the extensive margin. Coughlin (2012) examines the relationship between
margins of exports of a particular country and their relationship with country size and distance
with trade partners. The study, using gravity models, finds a positive and statistically significant
effect of size on both margins, with the magnitude larger for extensive margin.
A review of the above studies thus shows that concepts of margins of trade is
increasingly used in the literature to understand trade performance. This growing body of
empirical work in international trade suggests that as trade costs fall, the least productive firms
exit and the most productive firms expand, while surviving firms shift to more productive lines
of production. The use of productivity and trade costs in explaining margins of trade is more
often done in the gravity framework. In this study, trade performance of emerging market
economies during global economic crises is analysed in terms of trade margins. Such margins of
trade are attempted to be explained using a gravity model framework. The method of calculating
margins of trade and the gravity model will be detailed out in the Chapters 3 and 4 respectively.
Based on IMF, thirty two countries are classified as emerging market economies. These
are as follows, as presented in Table a
Pritam Chatterjee, Int.J.Eco.Res, 2016, v7i1, 27 - 43 ISSN: 2229-6158
IJER - JAN - FEB 2016 Available [email protected]
30

Table a: List of all Emerging Market Economies
Sl. No. Name of the countries Sl. No. Name of the countries
1 Argentina 17 Nigeria
2 Brazil 18 Oman
3 Bulgaria 19 Pakistan
4 China 20 Peru
5 Colombia 21 Poland
6 Egypt 22 Qatar
7 Hungary 23 Russia
8 Jordan 24 Romania
9 Indonesia 25 South Africa
10 India 26 Turkey
11 Kazakhstan 27 Tunisia
12 Latvia 28 Thailand
13 Lithuania 29 UAE
14 Mauritius 30 Ukraine
15 Malaysia 31 Venezuela
16 Mexico 32 Vietnam
Source: IMF World Economic Outlook Database
Data on total trade, total exports amd export partner share etc. for these emerging market
economies are collected from collected from the WITS (wits.worldbank.org). Using these data,
intensive and extensive margins are calculated. IMF World Economic Outlook database is used
to calculate growth of global GDP and exports as well as for the emerging market economies.
Further, for data on savings and investment rates, employment growth rates, and current account
as percentage of GDP for emerging market, the World Economic Outlook database is used.
Geographic distance data in kilometre among country pairs are extracted from Centre D’Etedes
Prospective Et D’Informations Internationales (CEPII) GeoDist database. Distances, in this
database, are calculated using the great circle formula, which uses latitude and longitudes of
most important and populated cities or official capital of the countries. In most cases the main
city is the capital of the country, but for very few countries the capital is not populated enough to
represent the economic center of the country. This information on distance is used in gravity
model estimation.
4. Results
A snapshot analysis of merchandise export performance in emerging market economies is
done using two indicators: average export growth and average export intensity across countries
for the pre- and post crisis periods. Mean difference test is used to observe the significance in the
difference between the rates during the post crises period as compared to the pre-crises period.
Table 3.1 presents the results. It can be observed from from Table 3.1 that there has been large
decline in average annual export growh rates across emerging market economies during the post
crisis period from that in pre crisis period. It can be observed that during 2003-2007, export
growth rates of most emerging market economies were moderate to high, with China registering
the highest at above 21 percent. The countries which registered low or negative export growth
Pritam Chatterjee, Int.J.Eco.Res, 2016, v7i1, 27 - 43 ISSN: 2229-6158
IJER - JAN - FEB 2016 Available [email protected]
31

during the pre-crisis period are fewer, which includes Indonesia, Mauritius, Oman and
Venezuela. Export growth declined in most emerging market economies with negative in some
countries, with the exception in Colombia, Peru and Vitenam. Even though the export growth
rates have been found to decline, only in 12 out of 32 countries the decline is found to be
significant.
In sharp contrast, as Table 1 shows, export intensity (share in global trade) is found to
have increased in the post crises period across emerging market economies despite fall in export
growth rates. The observed increase in average intensity can explained in terms of sharper
decline in world exports as compared to that of individual emerging market economy during the
post crises period. These observations calls for deeper analysis in terms of margins of trade.
Table 1: Export Performance of Emerging Market Economies in Pre and Post Crisis
Periods
Country Export Intensity Export Growth (%)
Pre crisis Post crisis Difference Pre crisis Post crisis Difference
Argentina 0.0024 0.00418 0.00178*** 5.3324 -0.1516 - 5.48
Brazil 0.01114 0.01344 0.0023*** 10.5956 -0.2262 -10.82**
Bulgaria 0.00074 0.00134 0.006*** 10.0218 2.4064 -7.62***
China 0.04646 0.09514 0.04868*** 21.2412 8.8674 -12.37**
Colombia 0.00122 0.00264 0.00142*** 6.846 8.7394 1.89
Egypt 0.00062 0.00158 0.00096*** 12.6236 -1.937 -14.56**
Hungary 0.00382 0.00582 0.002*** 13.3024 3.3706 -9.93**
India 0.00946 0.01502 0.00556*** 19.1836 8.2306 -10.95**
Indonesia 0.00508 0.0094 0.00432*** 0.457 3.4566 3.00
Jordan 0.00024 0.00046 0.00022*** 7.5826 4.7736 -2.81
Kazakhstan 0.00172 0.0041 0.00238*** 21.7734 9.9704 -11.80
Latvia 0.00032 0.00056 0.00024*** 8.9832 8.418 -0.57
Lithuania 0.00068 0.00138 0.0007*** 7.6074 -2.0398 -9.65***
Malaysia 0.0083 0.01178 0.00348*** 2.6858 3.961 1.28
Mauritius 0.0001 0.0001 NA 7.3284 3.9268 -3.40
Mexico 0.01272 0.01796 0.00524** 5.5288 -0.1826 -5.71
Nigeria 0.0016 0.00566 0.00406*** -0.8092 8.6376 9.45
Oman 0.00106 0.00232 0.00126*** 7.6932 1.7414 -5.95**
Pakistan 0.00088 0.00126 0.00038*** 7.625 3.3178 -4.31***
Peru 0.00104 0.00218 0.00114*** 9.0776 15.7762 6.70
Poland 0.00542 0.00974 0.00432*** 9.8388 5.033 -4.81
Qatar 0.00158 0.00322 0.00164 9.6676 1.4966 -8.17**
Romania 0.00164 0.00306 0.00142*** 5.105 -0.3238 -5.43
Russia 0.01412 0.02578 0.01166*** 9.2202 3.9708 -5.25**
South africa 0.00272 0.00442 0.0017*** 9.0738 0.857 -8.22**
Tunisia 0.00666 0.01146 0.0048*** 13.1804 5.3802 -7.80
Pritam Chatterjee, Int.J.Eco.Res, 2016, v7i1, 27 - 43 ISSN: 2229-6158
IJER - JAN - FEB 2016 Available [email protected]
32

Turkey 0.00056 0.00096 0.0004*** 5.9346 -0.8942 -6.83
Thailand 0.00714 0.00824 0.0011*** 14.7024 8.8474 -5.86
UAE 0.00544 0.01156 0.00612*** -0.6994 -4.2566 -3.56
Ukraine 0.00206 0.00344 0.00138*** 11.6682 12.0856 0.42
Venezuela 0.0024 0.00348 0.00108 10.5812 4.6982 -5.88
Vietnam 0.00194 0.00472 0.00278*** 5.9803 6.132 0.15
Note:* implies significance at 1% level,** implies significance at 5% level,*** implies
significance at 10% level. Source: WITS database
In this section, the results on extensive and intensive margins of trade are based on simple
method described in the earlier section are presented and analysed. This is done for bilateral
exports for the 32 emerging market economies during the pre- and post crises periods. While
arriving at extensive margins, the share of bilateral exports in total above 1 per cent is
considered. Based on the count method, it can be observed from Table 3.2 that in most emerging
market economies, the common set of partners declined in the post crises period. In case of
Venezuela, UAE, Tunisia, Poland, Nigeria and Hungary, no common set of partner countries
exist in both the time periods. This is despite the fact the number of trade partners did not decline
in the post crises period, or might have increased in case of some countries. This shows that there
has been emergence of new trade partners during the crises. Based on this observations, it may
not be correct to say that trade declined in the emerging market economies at the extensive
margin
.
Exports at the intensive for most emerging market economies, as observed in Table 3.3,
declined. It has remained low for those countries who intensive margin was low during the pre-
crises period. The decline in intensive margin can be explained by decline in bilateral trade with
most of the existing trade partners and low intensities with new partners. Based on this results, it
can be observed that the observed decline in trade across countries during the post crises period
is largely on account of fall at the intensive margin. On the other hand, there has been observed
changes at the extensive margin with emergence of new trade partners in emerging market
economies. The results could have been better had the commodity-country combinations were
taken into account while considering bilateral trade.
Pritam Chatterjee, Int.J.Eco.Res, 2016, v7i1, 27 - 43 ISSN: 2229-6158
IJER - JAN - FEB 2016 Available [email protected]
33

Table 2: Extensive Margins of Exports in Emerging Market Economies
Country Number of Export
Partners in Pre-
Crises Period
(2003-2007)
Number of Export
Partners in Post
Crisis Period
(2008-2012)
Common Export
Partners During
Two Periods
Argentina 20 20 5
Brazil 17 20 3
Bulgaria 14 20 5
China 24 18 2
Colombia 19 17 2
Egypt 17 22 3
Hungary 15 21 0
India 21 22 6
Indonesia 16 20 1
Jordan 11 16 1
Kazakhstan 16 15 4
Latvia 9 19 2
Lithuania 17 18 1
Malaysia 14 19 1
Mauritius 18 11 3
Mexico 3 8 1
Nigeria 9 17 0
Oman 7 7 1
Pakistan 19 23 3
Peru 17 17 2
Poland 22 16 0
Qatar 10 13 1
Romania 13 23 3
Russia 16 22 2
South Africa 21 13 3
Tunisia 14 25 1
Turkey 12 10 0
Thailand 15 22 2
Uae 3 8 0
Ukraine 21 16 1
Venezuela 3 0 0
Vietnam 18 28 4
Source: Based on WITS UN-COMTRADE database
Pritam Chatterjee, Int.J.Eco.Res, 2016, v7i1, 27 - 43 ISSN: 2229-6158
IJER - JAN - FEB 2016 Available [email protected]
34

Table 3: Average of Intensive Margin in Pre- and Post Crisis Period
Country Average of Intensive
Margin in Pre-Crisis Period
(2003-2007)
Average of Intensive Margin
in Post Crisis Period
(2008-2012)
Argentina 0.02 0.01
Brazil 0.05 0.05
Bulgaria 0.02 0.01
China 0.50 0.44
Colombia 0.01 0.01
Egypt 0.05 0.04
Hungary 0.01 0.03
India 0.02 0.03
Indonesia 0.05 0.04
Jordan 0.03 0.04
Kazakhstan 0.00 0.00
Latvia 0.01 0.01
Lithuania 0.00 0.00
Malaysia 0.00 0.00
Mauritius 0.04 0.06
Mexico 0.00 0.00
Nigeria 0.07 0.10
Oman 0.02 0.01
Pakistan 0.01 0.01
Peru 0.00 0.01
Poland 0.01 0.01
Qatar 0.04 0.04
Romania 0.01 0.01
Russia 0.01 0.01
South Africa 0.10 0.10
Tunisia 0.02 0.02
Turkey 0.04 0.05
Thailand 0.00 0.00
Uae 0.03 0.03
Ukraine 0.04 0.04
Venezuela 0.01 0.01
Vietnam 0.01 0.02
Source: Based on WITS UN-COMTRADE database
GRAVITY MODEL-
gravity model is used in its simplest form. Here bilateral export is made to depend on
GDP of both the trading countries and bilateral distance. The model is improved by including per
capital GDP of the trade partners. While estimating the gravity model, estimations are done
Pritam Chatterjee, Int.J.Eco.Res, 2016, v7i1, 27 - 43 ISSN: 2229-6158
IJER - JAN - FEB 2016 Available [email protected]
35

separately for the pre crises and post crises periods. The basic equations of this used can be
written as-
……………………….(1)
…………….(2)
where
BE=Bilateral Export
GDPi=GDP of Export Country
GDPj=Partner countries GDP
PCGDPi=Per Capita GDP of Export Country
PCGDPj=Partner countries Per Capita GDP
BTD=Bilateral Trade Distance
µit =Error term
The above two equations will be used for estimation.
The Method and the Data
While estimating, only the Pooled OLS estimator is used. The two other most frequently
used panel estimators for continuous dependent variables, the random effects estimator and the
fixed effects estimator, can be used and hence, are outlined. Followingly, the Hausman-test is
performed. which can be considered to be an estimator in between the fixed andrandom effects
approach. The presentation of the estimators is followed by the outline of two statistical tests that
can be used to decide on which estimator is the appropriate one to base the findings upon. In
particular, both the Breusch-Pagan test tests for random effects and the Hausman test are
presented, the latter being useful for the choice of either the random effects model, the fixed
effects model .
The equation for the fixed effects model becomes: Yit = β1Xit + αi + uit
where αi (i=1….n) is the unknown intercept for each entity ( n entity-specific intercepts)
and
Yit is the dependent variable (DV) with i = entity and t = time,
Xit represents one independent variable,
uit is the error term
The random effects model is: Yit = βXit + α + uit + εit
Random effects assume that the entity’s error term is not correlated with the predictors
which allows for time-invariant variables to play a role as explanatory variables. In random-
effects you need to specify those individual characteristics that may or may not influence the
predictor variables. The problem with this is that some variables may not be available therefore
leading to omitted variable bias in the model.
To decide between fixed or random effects, run a Hausman test where the null hypothesis
is that the preferred model is random effects vs. the alternative the fixed effects It basically tests
whether the unique errors (ui) are correlated with the regressors, the null hypothesis is they are
Pritam Chatterjee, Int.J.Eco.Res, 2016, v7i1, 27 - 43 ISSN: 2229-6158
IJER - JAN - FEB 2016 Available [email protected]
36

not. The Breusch-Pagan test helps to decide between a random effects regression and a simple
OLS regression.
The data that are being used in the estimation exercise and their source are as follows:
BILATERAL EXPORT – WITS Database.
GDPi and GDPj (PCGDPI and PCGDPj) – WITS Database.
DISTANCE – CEPII Database. As observed in Chapter 1, this database is used to measure
geographical distance between two countries (www.cepii.fr/cepii/en/bdd_modele/bdd.asp).
The Results
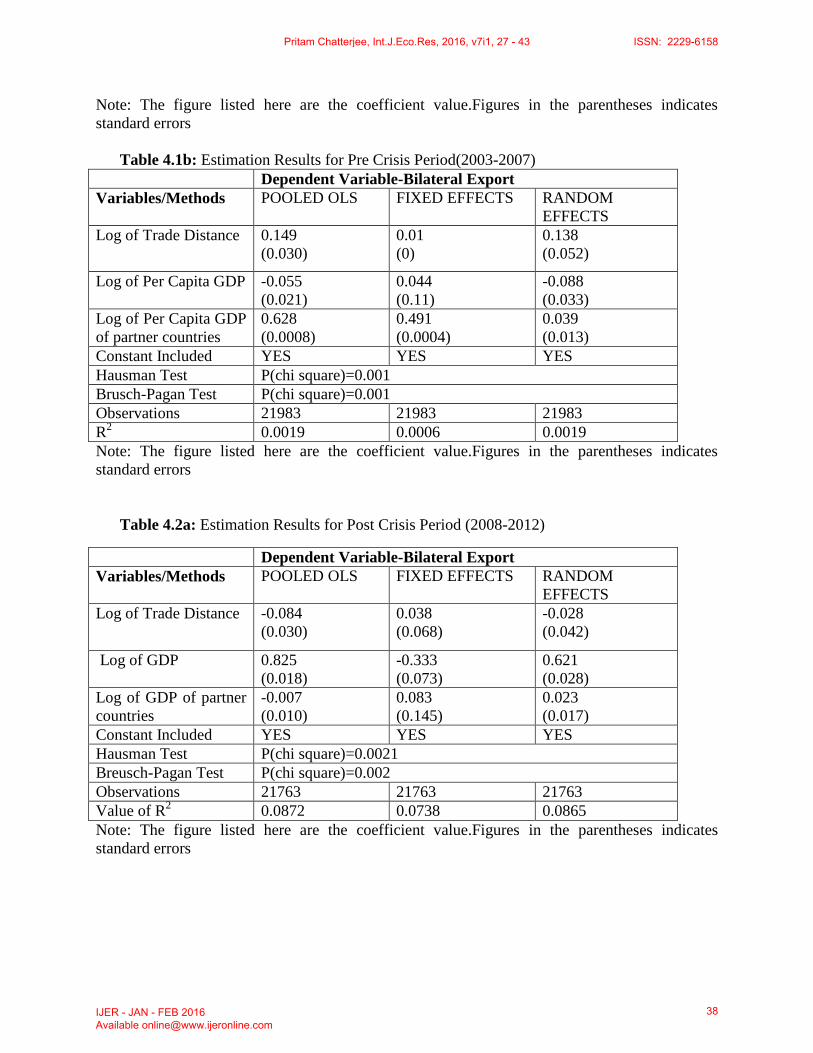
The estimations give very confusing results both for the pre- and post crises periods (see
Tables 4.1 to 4.2). The Tables 4.1a and b and Tables 4.2 a and b are different, the differences
being based on Equations 1 and 2. The model does not explain the variations in the data well
where pooled OLS method or panel data estimation methods are used. The results do not seem to
improve significantly different in the post crises period. It can be said from the tables that
Random effects model in all cases are rejected. In all cases, fixed effects model is found to be
appropriate. The coefficients of the independent variables vary from one model to the other and
also between alternate methods of estimation. The results hint at the inappropriateness of the
simple gravity model in explaining differences in bilateral trade across countries between the pre
and post crises periods.
Summary of Findings
The above results based gravity model estimation does not prove anything conclusive in
explaining the differences in bilateral exports between the pre- and post crises periods. The
simple gravity model is thus inappropriate in explaining differences in bilateral trade across
countries. The inappropriateness of the results across specifications is largely on account large
number of omitted variables that are present in augmented gravity specification. The other
source of inappropriateness of the results could be the short period covered in each regression.
Table 4.1a: Estimation Results for Pre Crisis Period(2003-2007)
Dependent Variable-Bilateral Export
Variables/Methods POOLED OLS FIXED EFFECTS RANDOM
EFFECTS
Log of Trade Distance -0.031
(0.029)
0.01
(0)
-0.020
(0.049)
Log of GDP 0.822
(0.017)
0.134
(0.133)
0.787
(0.028)
Log of GDP of partner
countries
0.007
(0.010)
0.533
(0.089)
0.034
(0.016)
Constant Included YES YES YES
Hausman Test P (chi square)=0.002
Breusch-Pagan Test P(chi square)=0
Observations 21983 21983 21983
R2 0.0936 0.0022 0.0933
Pritam Chatterjee, Int.J.Eco.Res, 2016, v7i1, 27 - 43 ISSN: 2229-6158
IJER - JAN - FEB 2016 Available [email protected]
37
Note: The figure listed here are the coefficient value.Figures in the parentheses indicates
standard errors
Table 4.1b: Estimation Results for Pre Crisis Period(2003-2007)
Dependent Variable-Bilateral Export
Variables/Methods POOLED OLS FIXED EFFECTS RANDOM
EFFECTS
Log of Trade Distance 0.149
(0.030)
0.01
(0)
0.138
(0.052)
Log of Per Capita GDP -0.055
(0.021)
0.044
(0.11)
-0.088
(0.033)
Log of Per Capita GDP
of partner countries
0.628
(0.0008)
0.491
(0.0004)
0.039
(0.013)
Constant Included YES YES YES
Hausman Test P(chi square)=0.001
Brusch-Pagan Test P(chi square)=0.001
Observations 21983 21983 21983
R2 0.0019 0.0006 0.0019
Note: The figure listed here are the coefficient value.Figures in the parentheses indicates
standard errors
Table 4.2a: Estimation Results for Post Crisis Period (2008-2012)
Dependent Variable-Bilateral Export
Variables/Methods POOLED OLS FIXED EFFECTS RANDOM
EFFECTS
Log of Trade Distance -0.084
(0.030)
0.038
(0.068)
-0.028
(0.042)
Log of GDP 0.825
(0.018)
-0.333
(0.073)
0.621
(0.028)
Log of GDP of partner
countries
-0.007
(0.010)
0.083
(0.145)
0.023
(0.017)
Constant Included YES YES YES
Hausman Test P(chi square)=0.0021
Breusch-Pagan Test P(chi square)=0.002
Observations 21763 21763 21763
Value of R2 0.0872 0.0738 0.0865
Note: The figure listed here are the coefficient value.Figures in the parentheses indicates
standard errors
Pritam Chatterjee, Int.J.Eco.Res, 2016, v7i1, 27 - 43 ISSN: 2229-6158
IJER - JAN - FEB 2016 Available [email protected]
38

Table 4.2b: Estimation Results for Post Crisis Period (2008-2012)
Dependent Variable-Bilateral Export
Variables/Methods POOLED OLS FIXED EFFECTS RANDOM
EFFECTS
Log of Trade Distance 0.063
(0.031)
0.038
(0.068)
0.039
(0.043)
Log of Per Capita GDP -0.121
(0.031)
-0.346
(0.057)
-0.165
(0.031)
Log of Per Capita GDP
of partner countries
0.006
(0.008)
0.006
(0.011)
0.0095
(0.0093)
Constant Included YES YES YES
Observations 21763 21763 21763
Hausman Test P(chi square)=0.0021
Breusch-Pagan Test P(chi square)=0
R2 0.0020 0.0018 0.0019
Note: The figure listed here are the coefficient value.Figures in the parentheses indicates
standard errors
5. CONCLUSION AND FUTURE SCOPE-
cent during 2008-2012. The decline of world GDP growth was the sharpest at 42 per cent during
the third quarter of 2008 to the second quarter of 2009. Not only capital inflows to developing
and emerging market economies declined during this period, there has been significant shrinking
of markets for developing country exports. World trade declined rapidly beginning in the third
quarter of 2008 through the second quarter of 2009. World trade declined in real terms by 12.2
per cent during 2008-2010, with a larger decline of 30 per cent in world trade between the third
quarter of 2008 and the last quarter of 2009 (UNCTAD, 2009). This recent global economic
slowdown originated in the financial sector of the United States, where the housing market sold
sub-prime mortgages to large number of consumers with inadequate income. The financial crisis
very rapidly spreaded to real sector in the US economy. The economic crises spreaded to Europe
and then to rest of the world. There was a short-lived recovery in 2010, but the global economy
slipped into deep recession in the latter half of 2011.
The aim of this study was to find whether the recent economic crisis has adversely
affected trade in emerging market economies. In specific, the study investigates into whether
economic slowdown consequent upon recent global economic crises has impacted trade
performance of these economies at the intensive and extensive margins. Further, it is important
to gauge the factors that explain bilateral trade intensities during crises.
On the whole, with economic crises since 2008 and deepening of recession, GDP growth
declined worldwide, with larger fall in emerging market and developing countries. The current
position worsened across emerging market and developing economies, except China and some
ASEAN countries. Further evidence points to declining growth of export of goods and services,
merchandise exports in particular. This evidence leads to a further probe of what accounts for
such declining export growth during crises.
Pritam Chatterjee, Int.J.Eco.Res, 2016, v7i1, 27 - 43 ISSN: 2229-6158
IJER - JAN - FEB 2016 Available [email protected]
39

During economic crises, a fall in international trade can affect new flows as well as
traditional ones. Using simple measures of extensive and intensive margins, the analysis in this
chapter shows that decline in exports from emerging market economies is largely on account of
decline in intensive margins with traditional trading partners. Even if new trading partners have
emerged during the crises period, the bilateral intensities new partners are low. The results could
have been better had the commodity-country combinations were taken into account while
considering bilateral trade. Nonetheless, the results imply that such decline in trade margins is
largely on account of trade contraction that happened during crises.
The results based gravity model estimation does not prove anything conclusive in
explaining the differences in bilateral exports between the pre- and post crises periods. The
simple gravity model is thus inappropriate in explaining differences in bilateral trade across
countries. The inappropriateness of the results across specifications is largely on account large
number of omitted variables that are present in augmented gravity specification. The other
source of inappropriateness of the results could be the short period covered in each regression.
REFERENCES
Anderson, J. E. (1979), ‘A Theoretical Foundation for the Gravity Equation’, American
Economic Review, 69 (1) 106-116.
Anderson, J. E. and E. van Wincoop (2003), ‘Gravity with Gravitas: A Solution to the Border
Puzzle’, American Economic Review, 93 (1) 170-92.
Bergstrand, J. (1985), ‘The Gravity Equation in International Trade: Some Microeconomic
Foundations and Empirical Evidence’, The Review of Economics and Statistics, 67 (3) 474-
481.
Bergeijk, A. G. (2015), ‘The Heterogeneity of World Trade Collapses’, ISS Working Paper No.
606, International Institute of Social Studies, University in The Hague, Netherlands.
Berman, N. (2009), ‘Financial Crises and International Trade: The Long Way to Recovery’, EUI
Working Paper MWP 2009/04, European University Institute, Italy.
Berman, N. et al. (2012), ‘Time to Ship during Financial Crisis’, NBER Working Paper 18274,
National Bureau of Economic Research, Cambridge.
Besedes, T. and T. Prusa (2003), ‘On the Duration of Trade’, NBER Working Paper 9936,
National Bureau of Economic Research, Cambridge.
Besedes, T. and T. J. Prusa (2007), ‘The Role of Extensive and Intensive Margins and Export
Growth’, National Bureau of Economic Research Working Paper 13628, National Bureau
of Economic Research, Cambridge.
Brincogne, J. C. et al. (2009), ‘Firms and the Global Crisis: French Exports in the Turmoil’,
Journal of International Economics, 87 (1) 134-146.
Breuss, F. and Egger, P. (1999), ‘How Reliable are Estimations of East-West Trade Potentials
Based on Cross-Section Gravity Analyses?’, Empirica, 26 (2) 81-95.
Bougheas, S. et al. (1999), ‘Infrastructure, Transport Costs and Trade’, Journal of International
Economics, 47 169-189.
Chaney (2008), ‘Intranational versus International Trade in the European Union: Why Do
National Borders Matter?’, CEPR Discussion Papers 3402, Center for Economics and
Policy Research, USA.
Pritam Chatterjee, Int.J.Eco.Res, 2016, v7i1, 27 - 43 ISSN: 2229-6158
IJER - JAN - FEB 2016 Available [email protected]
40

Cheng, C. and J. Wall (1999), ‘Controlling for Heterogeneity in Gravity Models of Trade and
Integration’, Federal Reserve Bank of St. Louis Review, 87 (1) 49-63.
Christie, E. ( 2002), ‘Potential Trade in Southeast Europe: A Gravity Model Approach’, Working
Paper, The Vienna Institute for International Economic Studies 32 (2) 205-219.
Coughlin, C. (2012), ‘Extensive and Intensive Trade Margins: A State-by-State View’, Working
Paper Series 2012-002A, Research Division, Federal Reserve Bank of St Louis.
Deardorff, A. V. (1998), ‘Determinants of Bilateral Trade: Does Gravity Work in a Neoclassical
World?’, University of Chicago Press, Chicago 7-22.
Dorsey, T. 2009, ‘Trade Finance Stumbles’, Finance and Development, 46(1): 18-19.
Duttagupta, R. and A. Spilimburo (2004), ‘What Happens to Asian Export during Crisis?’, IMF
Staff Papers, 51 (1), International Monetary Fund, Washington D. C.
Dutta, P. et al. (2012), ‘The Effect of WTO on the Extensive and the Intensive Margins of
Trade’, Journal of International Economic, 91 (13) 204-219.
Eaton, J. and S. Kortum (2002) ,‘Technology, Geography and Trade’, Econometrica, 70 (5)
1741-79.
Egger, P. (2000), ‘A Note on the Proper Econometric Specification of the Gravity Equation’,
Economics Letters, 66 (2) 25-31.
Feenstra, R. (1994), ‘New Product Varieties and the Measurement of International Prices’,
American Economic Review, 84 (3) 157-177.
Feenstra, R. C. and H. Kee ( 2004), ‘Export Variety and Country Productivity’, NBER Working
Paper 10830, National Bureau of Economic Research, Cambridge.
Felbemayr, G. and W. Kohler (2006), ‘Exploring the Intensive and Extensive Margins of World
Trade’, Review of World Economics, 127 (4) 642-674.
Hassan, M. K. (2000), ‘Trade Relations with SAARC Countries and Trade Policies of
Bangladesh’, Journal of Economic Cooperation among Islamic Countries, 21 (3) 99-151.
Helpman, E. (1987), ‘Imperfect Competition and International Trade: Evidence from Fourteen
Industrial Countries’, Journal of the Japanese and International Economies, 1 (1) 62-81.
Helpman, E., M. Melitz, and Y. Rubinstein. (2004), ‘Trading Partners and Trading Volumes’,
Journal of Political Economy, 92 (3) 451-471
Helpman et al. (2008), ‘The Structure of Foreign Trade,’ Quarterly Journal of Economics,
CXXIII (2) 441-487.
Hoekman, B. and Nicita, A. (2010), ‘Assessing the Doha Round-Market Access, Transaction
Cost and aid for Trade Facilitation’, Journal of International Trade & Economic
Development, Taylor and Francis Journals,19 (1) 65-79.
Hummels, D. and P. Klenow (2005), ‘The Variety and Quality of a Nation’s Exports’, American
Economic Review 95 (2) 704-723.
IMF Trade Finance Survey 2008-2009.
IMF World Economic Outlook Database.
Kalbasi, H. ( 2001),‘The Gravity Model and Global Trade Flows’. Paper presented at the75th
International Conference on Policy Modeling for European and Global Issues, Brussels,
July 5-7.
Kang, K. (2004), ‘The Path of the Extensive Margin (Export Variety): Theory and Evidence’,
Korean Economic Review 22 (2).
Krugman, P. (1980), ‘Scale Economies, Product Differentiation and the Pattern of Trade’,
American Economic Review, 70 (5) 950-959.
Pritam Chatterjee, Int.J.Eco.Res, 2016, v7i1, 27 - 43 ISSN: 2229-6158
IJER - JAN - FEB 2016 Available [email protected]
41

Lawless, M. (2008), ‘Deconstructing Gravity: Trade Costs and Extensive and Intensive
Margins’, CBFSAI Technical Paper 5/RT/08, August 2008, Central Bank of Financial
Services Authority, Ireland.
Limao, N. and A. J. Venables (1999), ‘Infrastructure, Geographical Disadvantage and Transport
Costs’, Policy Research Working Paper 2257, World Bank Development Research Group.
Liu, B. J., 2011, ‘Why World Exports are so susceptible to the Economic Crisis: The Prevailing
Export “Overshooting” Phenomenon’, Working Paper 16837, National Bureau of Economic
Research, Cambridge MA.
Matyas, L. (1998), ‘Proper Econometric Specification of the Gravity Model’, The World
Economy, 20 (3) 363-68.
Mccallum, G. (1995), ‘National Borders Matter: Canada-U.S. Regional Trade Patterns’, The
American Economic Review, 85 (3) 615-62.
Meyn, M. and J. Kennan (2003), ‘The Implications of the Global Financial Crisis for Developing
Countries Export Volumes and Values’, Overseas Development Institute Working Paper
305, Overseas Development Institute, London, United Kingdom.
Nicita, A. and B. T. Klok (2006), ‘New and Traditional Trade Flows and the Economic Crisis’
Policy Issues in International Trade Study Series No. 49, United Nation Conference on
Trade and Development, Geneva.
Pacheco, A. A. and D. Pierola (2007), ‘Patterns of Export Diversification in Developing and
Productivity in International Trade’ American Economic Review, 93 (4) 1268-90.
Pacheco, A. A. and M. D. Pierola (2008), ‘Pattern of Export Diversification in Developing
Countries-Intensive and Extensive Margins’, World Bank Policy Research Working Paper
4750, World Bank International Trade Department.
Rakshit, M. (2002), ‘The East Asian Currency Crisis’, Oxford University Press, New Delhi,
India.
Rakshit, M. (2010), ‘Global Downturn and Cross-Border Trade: Some Theoretical and Policy
Perspectives’, Economic and Political Weekly, XLV (18) 43-56.
Reinhart, C. and K. S. Rogoff (2011), ‘From Financial Crash to Debt Crisis: Dataset’, American
Economic Review, 101 (5) 1676-1706.
Scherer, C. and M. Bittencourt (2011), ‘Intensive and Extensive Margins for the Brazilian
International Trade’, Ohio State University Working Paper 2011(03), Ohio State University,
University in Columbus, Ohio.
Shelburne, R. (2010), ‘The Global Financial Crisis and Its Impact On Trade: The World and The
European Emerging Economies’, Discussion Paper Series Number 2010.2, United Nation
Economic Commission for Europe, Switzerland.
Turkcan, C. (2011), ‘Investigating the Role of Extensive Margin, Intensive M<argin, Price and
Quantity Components of Turkey’s Export Growth during 1998-2011, Munich Personal
Repec Archive.
Turkson, F. E. (2011), ‘Logistics and Bilateral Exports in Developing Countries: A
Multiplicative Form Estimation of the Logistics Augmented Gravity Equation’, CREDIT
Research Paper No 11/06, Center for Research in Economic Development and International
Trade, Nottingham.
UNCTAD (2009), ‘Global Economic Crisis-Implications of Trade and Development’, Report by
the UNCTAD Secretariat-Geneva 2009, United Nation Conference on Trade and
Development.
Pritam Chatterjee, Int.J.Eco.Res, 2016, v7i1, 27 - 43 ISSN: 2229-6158
IJER - JAN - FEB 2016 Available [email protected]
42

Veeramani, C. and P. Gupta (2014), ‘Extensive and Intensive Margins of India's Exports:
Comparison with China’, IGIDR Working Paper 011/2014, Indira Gandhi Institute of
Development and Research, Mumbai, India.
Venables, E. and B. Events (2002), ‘Geographical Disadvantage: A Heckscher-Ohlin-von
Thunen Model of International Specialization’, Journal of International Economics, 58
239-263.
Wei, S. J. (1996), ‘Intra-national versus International Trade: How Stubborn are Nations in
Global Integration?’, NBER Working Paper 5531, National Bureau of Economic Research,
Cambridge.
Winters, A. (1999), ‘Regionalism in the Nineties: What Effects on Trade and Development’,
Economic Group of the World Bank, Mimeo.
Wooldridge. M (2002), ‘Econometric Analysis of Cross Section and Panel Data’, MIT Press,
November 2002, MIT Press, Cambridge.
Yi, K. (2003), ‘Can Vertical Specialization Explain the Growth of World Trade?’, Journal of
International Economics, 53(1) 1-27.
Zdzienicka, D. (2012), ‘How Costly are Debt Crises?’, Journal of International Money and
Finance’, 31(4) 726-742.
Pritam Chatterjee, Int.J.Eco.Res, 2016, v7i1, 27 - 43 ISSN: 2229-6158
IJER - JAN - FEB 2016 Available [email protected]
43