global economic crisis and brazil: what are the...
TRANSCRIPT

Global Economic Crisis
and Brazil: What Are the
Questions?
Yoshiaki Nakano
Escola de Economia de São Paulo
Fundação Getulio Vargas
Global Economic Crisis
• Global Financial Crises
– Centered in US and Europe
• Is a collapse of paradigm/west model and governability?
• What will be the social and political consequences of the
financial crises?
– Nature of the crises: burst of super-bubble?
• Solution for each bubble was another bubble
• Solving problems of liquidity to mask solvency problem?
• Demand of financial assets is function of their prices
during crises increasing the instability
• Euro crises
Global Economic Crises
– Financial crises vs Balance sheet recession
• Lenders problems: monetary policy can help
– Another bubble?
– It will take at least a decade of very low interest rate
(subsidies) to save the financial system.
• Borrowers problem: only fiscal policy can help
– Families and business sectors are adjusting their balance sheet,
deleveraging and increasing the excess savings (Richard Koo).
– Prolonged slump
• Crisis of governability of US and Europe: economic
and political vigor passing to developing countries?
real-world economics review, issue no. 58
The world in balance sheet recession: causes, cure, and politics Richard C. Koo (Nomura Research Institute, Tokyo)
Copyright: Richard C. Koo, 2011
You may post comments on this paper at http://rwer.wordpress.com/2011/12/12/rwer-issue-58-richard-koo/
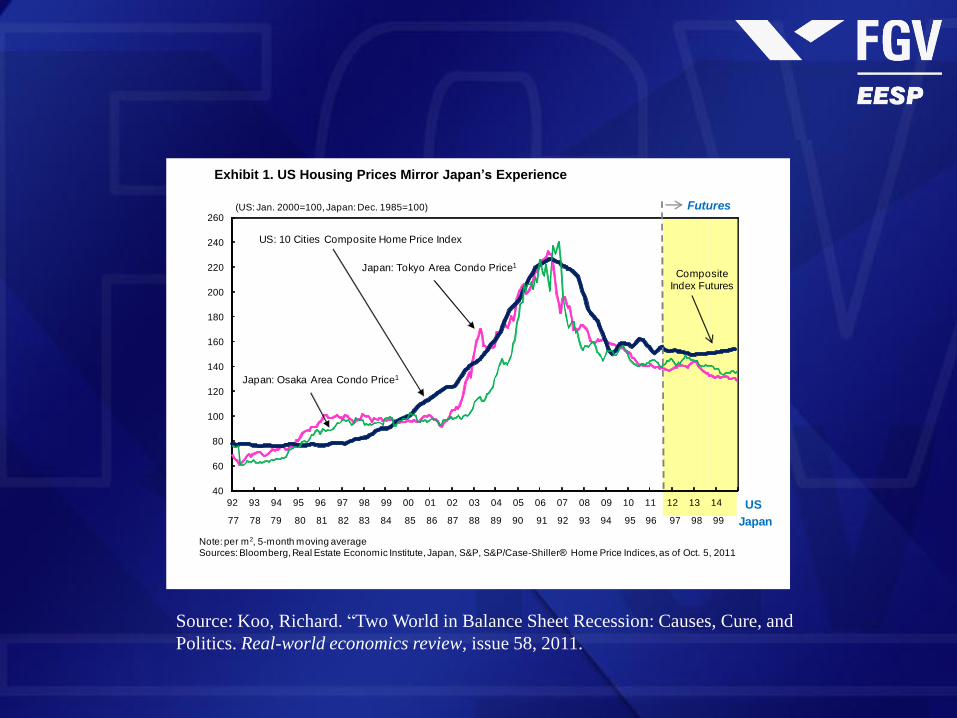
A recurring concern in the Western economies today is that they may be headed
toward a Japan-like lost decade. Remarkable similarities between house price movements in
the U.S. this time and in Japan 15 years ago, illustrated in Exhibit 1, suggest that the two
countries have indeed contracted a similar disease. The post-1990 Japanese experience,
however, also demonstrated that the nation’s recession was no ordinary recession.
Exhibit 1. US Housing Prices Mirror Japan’s Experience
40
60
80
100
120
140
160
180
200
220
240
260
92 93 94 95 96 97 98 99 00 01 02 03 04 05 06 07 08 09 10 11 12 13 14
US: 10 Cities Composite Home Price Index
(US: Jan. 2000=100, Japan: Dec. 1985=100)
Note: per m2, 5-month moving averageSources: Bloomberg, Real Estate Economic Institute, Japan, S&P, S&P/Case-Shiller® Home Price Indices, as of Oct. 5, 2011
Composite Index Futures
Japan: Tokyo Area Condo Price1
77 78 79 80 81 82 83 84 85 86 87 88 89 90 91 92 93 94 95 96 97 98 99
Japan: Osaka Area Condo Price1
Futures
US
Japan
Recession driven by deleveraging leads to prolonged slump
The key difference between an ordinary recession and one that can produce a lost
decade is that in the latter, a large portion of the private sector is actually minimizing debt
instead of maximizing profits following the bursting of a nation-wide asset price bubble. When
a debt-financed bubble bursts, asset prices collapse while liabilities remain, leaving millions of
private sector balance sheets underwater. In order to regain their financial health and credit
ratings, households and businesses are forced to repair their balance sheets by increasing
savings or paying down debt. This act of deleveraging reduces aggregate demand and
throws the economy into a very special type of recession.
19
Source: Koo, Richard. “Two World in Balance Sheet Recession: Causes, Cure, and
Politics. Real-world economics review, issue 58, 2011.
real-world economics review, issue no. 58
The first casualty of this shift to debt minimization is monetary policy, the traditional
remedy for recessions, because people with negative equity are not interested in increasing
borrowing at any interest rate. Nor will there be many willing lenders for those with impaired
balance sheets, especially when the lenders themselves have balance sheet problems.
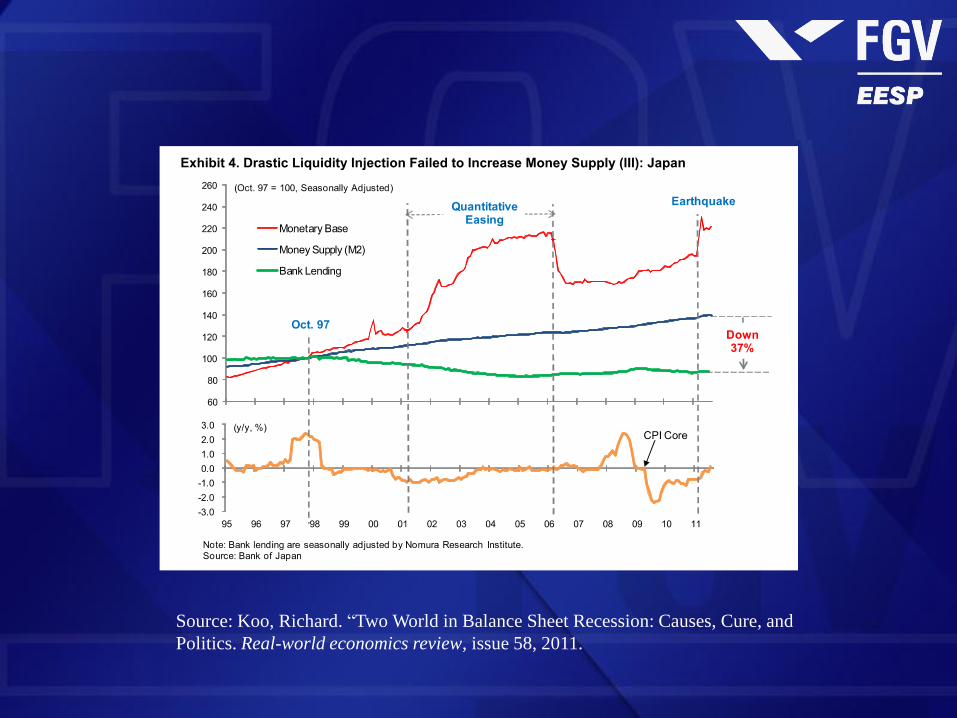
Moreover, the money supply, which consists mostly of bank deposits, contracts when the
private sector collectively draws down bank deposits to repay debt. Although the central bank
can inject liquidity into the banking system, it will be hard-pressed to reverse the shrinkage of
bank deposits when there are no borrowers and the money multiplier is zero or negative at
the margin.
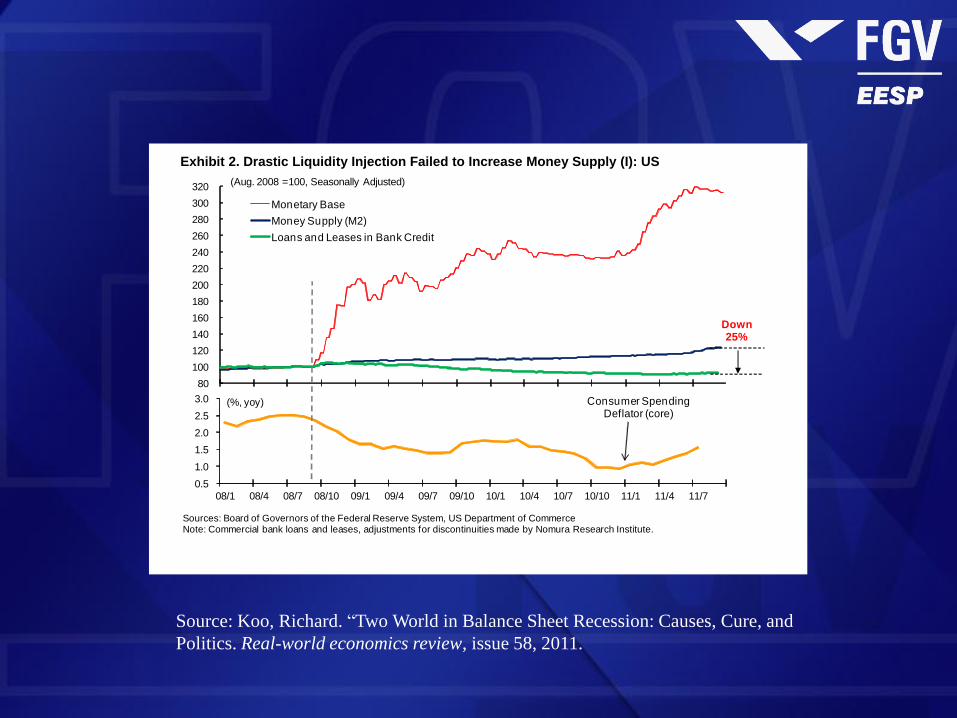
As shown in Exhibits 2 and 3, massive injections of liquidity by both the Federal
Reserve in the US and the Bank of England in the UK not only failed to prevent contractions
in credit available to the private sector, but also produced only miniscule increases in the
money supply. This is exactly what happened to Japan after the bursting of its bubble in
1990, as shown in Exhibit 4.
Nor is there any reason why bringing back inflation or inflation targeting should work,
because people are paying down debt in response to the fall in asset prices, not consumer
prices. And with the money multiplier negative at the margin, the central bank does not have
the means to produce the money supply growth needed to increase the inflation rate.
Exhibit 2. Drastic Liquidity Injection Failed to Increase Money Supply (I): US
80
100
120
140
160
180
200
220
240
260
280
300
320
Monetary Base
Money Supply (M2)
Loans and Leases in Bank Credit
(Aug. 2008 =100, Seasonally Adjusted)
Down 25%
0.5
1.0
1.5
2.0
2.5
3.0
08/1 08/4 08/7 08/10 09/1 09/4 09/7 09/10 10/1 10/4 10/7 10/10 11/1 11/4 11/7
(%, yoy) Consumer SpendingDeflator (core)
Sources: Board of Governors of the Federal Reserve System, US Department of CommerceNote: Commercial bank loans and leases, adjustments for discontinuities made by Nomura Research Institute.
20
Source: Koo, Richard. “Two World in Balance Sheet Recession: Causes, Cure, and
Politics. Real-world economics review, issue 58, 2011.
Source: Koo, Richard. “Two World in Balance Sheet Recession: Causes, Cure, and
Politics. Real-world economics review, issue 58, 2011.
real-world economics review, issue no. 58
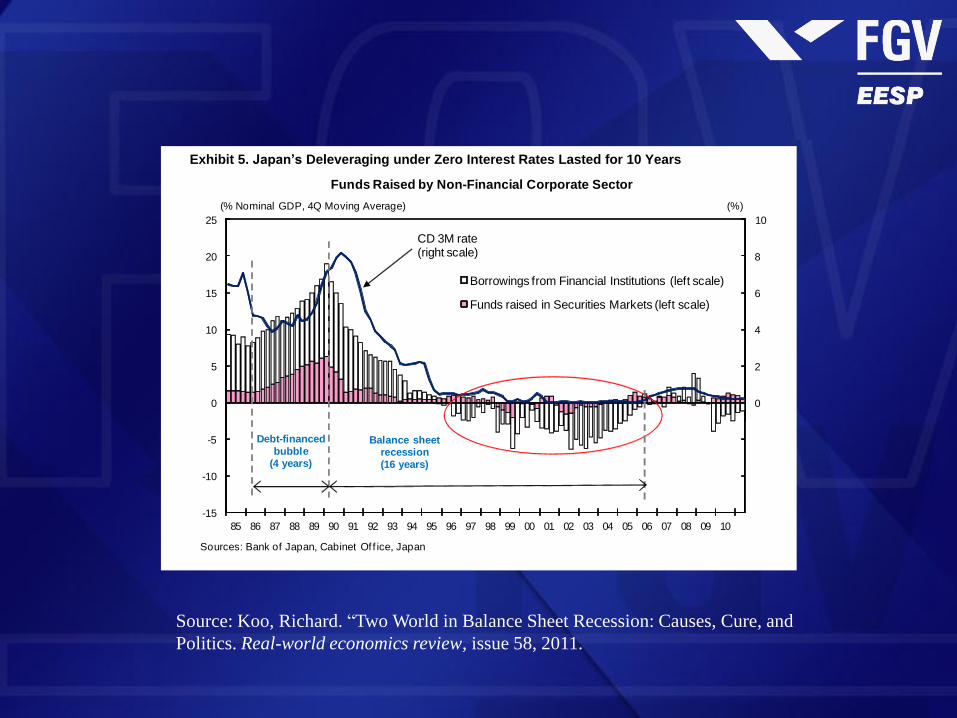
Exhibit 5. Japan’s Deleveraging under Zero Interest Rates Lasted for 10 Years
-6
-4
-2
0
2
4
6
8
10
-15
-10
-5
0
5
10
15
20
25
85 86 87 88 89 90 91 92 93 94 95 96 97 98 99 00 01 02 03 04 05 06 07 08 09 10
Borrowings from Financial Institutions (left scale)
Funds raised in Securities Markets (left scale)
CD 3M rate (right scale)
(% Nominal GDP, 4Q Moving Average) (%)
Sources: Bank of Japan, Cabinet Of f ice, Japan
Debt-financed
bubble(4 years)
Balance sheetrecession(16 years)
Funds Raised by Non-Financial Corporate Sector
Japan managed to avoid a depression, however, because the government borrowed
and spent the aforementioned $100 every year, thereby keeping the economy’s expenditures
at $1,000 ($900 in household spending plus $100 in government spending). In spite of a
massive loss of wealth and private sector deleveraging reaching over 10 percent of GDP per
year, Japan managed to keep its GDP above the bubble peak throughout the post-1990 era
(Exhibit 6), and the unemployment rate never climbed above 5.5 percent.
This government action maintained incomes in the private sector and allowed
businesses and households to pay down debt. By 2005 the private sector had completed its
balance sheet repairs.
Although this fiscal action increased government debt by 460 trillion yen or 92 percent
of GDP during the 1990–2005 period, the amount of GDP preserved by fiscal action
compared with a depression scenario was far greater. For example, if we assume, rather
optimistically, that without government action Japanese GDP would have returned to the pre-
bubble level of 1985, the difference between this hypothetical GDP and actual GDP would be
over 2,000 trillion yen for the 15-year period. In other words, Japan spent 460 trillion yen to
buy 2,000 trillion yen of GDP, making it a tremendous bargain. And because the private
sector was deleveraging, the government’s fiscal actions did not lead to crowding out,
inflation, or skyrocketing interest rates.
23
Source: Koo, Richard. “Two World in Balance Sheet Recession: Causes, Cure, and
Politics. Real-world economics review, issue 58, 2011.

real-world economics review, issue no. 58
Exhibit 9. U.S. in Balance Sheet Recession: U.S. Private Sector Increased Savings
Massively after the Bubble
Shift from 3Q 2007 in
private sector:9.30% of GDP
Corporate: 1.40%Households:
8.22%
Shift from 4Q 2006 in
public sector: 5.80% of GDP
-12
-10
-8
-6
-4
-2
0
2
4
6
8
85 86 87 88 89 90 91 92 93 94 95 96 97 98 99 00 01 02 03 04 05 06 07 08 09 10 11
Housing Bubble
IT Bubble
(Financial Surplus)
(Financial Deficit)
(as a ratio to nominal GDP, %, quarterly)
Rest of the World
Households
General Government
Corporate Sector(Non-Financial Sector +
Financial Sector)
Financial Surplus or Deficit by Sector
Note: For f igures, 4 quarter averages ending with 2Q/11' are used.Sources: FRB, US Department of Commerce
Flow of funds data for the U.K. (Exhibit 10) tell the same story, with the growth in
private savings (7.7 percent of GDP) exceeding the increase in government deficit (7.0
percent of GDP). Once again, this means the UK government is not doing enough to stabilize
the economy by offsetting private sector deleveraging.
Exhibit 10. U.K. in Balance Sheet Recession:
Massive Increase in Private Savings after the Bubble
Shift from 4Q 2006 in
private sector:7.77% of GDPCorporate: 4.21%
Households: 3.56%
Shift from 4Q 2006 in
public sector:7.02% of GDP
-12
-9
-6
-3
0
3
6
9
88 89 90 91 92 93 94 95 96 97 98 99 00 01 02 03 04 05 06 07 08 09 10 11
Note: For f igures, 4 quarter averages ending with 1Q/11' are used.Source: Of f ice for National Statistics, UK
(as a ratio to nominal GDP, %)
(Financial Surplus)
(Financial Deficit)
Rest of the World
Households
General Government
Corporate Sector(Non-Financial Sector +
Financial Sector)
Financial Surplus or Deficit by Sector
26
Source: Koo, Richard. “Two World in Balance Sheet Recession: Causes, Cure, and
Politics. Real-world economics review, issue 58, 2011.
Source: Koo, Richard. “Two World in Balance Sheet Recession: Causes, Cure, and
Politics. Real-world economics review, issue 58, 2011.

Source: Koo, Richard. “Two World in Balance Sheet Recession: Causes, Cure, and
Politics. Real-world economics review, issue 58, 2011.

real-world economics review, issue no. 58
Exhibit 16. Recovery from Lehman Shock Is NOT Recovery from Balance Sheet Recession
Source: Nomura Research Institute
?
Lehman Shock
Actual Path
Current Location
Likely GDP Pathwithout Lehman Shock
Weaker Demand from Private Sector
De-leveraging
Stronger Demand from Government's
Fiscal Stimulus
BubbleBurst
(A)
(B)
Economic weakness from private-sector
de-leveraging
Economic weakness from policy mistake
on Lehman
Conclusion
It is laudable for policy makers to shun fiscal profligacy and aim for self-reliance on
the part of the private sector. But every several decades, the private sector loses its self-
control in a bubble and sustains heavy financial injuries when the bubble bursts. That forces
the private sector to pay down debt in spite of zero interest rates, triggering a deflationary
spiral. At such times and at such times only, the government must borrow and spend the
private sector’s excess savings, not only because monetary policy is impotent at such times
but also because the government cannot tell the private sector not to repair its balance sheet.
Although anyone can push for fiscal consolidation in the form of higher taxes and
lower spending, whether such efforts actually succeed in reducing the budget deficit is
another matter entirely. When the private sector is both willing and able to borrow money,
fiscal consolidation efforts by the government will lead to a smaller deficit and higher growth
as resources are released to the more efficient private sector. But when the financial health
of the private sector is so impaired that it is forced to deleverage even with interest rates at
zero, a premature withdrawal of fiscal stimulus will both increase the deficit and weaken the
economy. Key differences between the textbook world and the world of balance sheet
recessions are summarized in Exhibit 17.
With massive private sector deleveraging continuing in the U.S. and in many other
countries in spite of historically low interest rates, this is no time to embark on fiscal
consolidation. Such measures must wait until it is certain the private sector has finished
deleveraging and is ready to borrow and spend the savings that would be left un-borrowed by
the government under an austerity program.
36
Source: Koo, Richard. “Two World in Balance Sheet Recession: Causes, Cure, and
Politics. Real-world economics review, issue 58, 2011.

New Global Economic Order
• Hegemonic Interregnum (vacuum of dominant
power, of ideology and of policy consensus, etc.)
– Redistribution of power and leadership in world
economy
• From US hegemony to Chinese hegemony
The Economist: China will overtake USA in 2018 in terms of GDP
in dollar.
Who will prevail in western Pacific: US Navy or rising industrial
and naval power of China? And India?
• From financial plutocracy to industrial plutocracy?
– Historical similarity with the decline of British financial
plutocracy and rise of American industrial power

New Global Economic Order
– From global capitalism to state capitalism?
• Which model will prevail?
• Decline of market led liberal globalization?
• Rise of protectionism and nationalism?
– What will happen to capital movement and financial
integration?

New Global Economic Order
– Greater external autonomy for peripheral
countries
• US declining governability and global
governance/priority in next decades will be to
revitalize itself.
• Rise of New Nations States with rising vigor?
• New international division of labor or
reindustrialization and rise of new regional
industrial powers?

Global Economic Order
and Brazilian Development
• Brazilian historical experience during
hegemonic interregnum
– From Great Depression of 1890s
• Immigration, end of slavery, Republic and take off of
the construction of modern Brazilian society
– From Great Depression of 1930s
• Displacement of dynamic center and industrialization
• From Resilience to 2008 Crisis to Robust
Growth?
Resilience of Brazilian
Economy
•Very low export to GDP ratio;
•Large and dynamic domestic market;
– End of “Labor Surplus Economy” and new
dynamics of domestic market/mass
consumption/new middle class
Resilience of Brazilian
Economy
• Improving macroeconomic policy: From
stability to Stability + Growth – Fiscal policy: small deficit and low debts that could
afford to become counter-cyclical
– Monetary policy: flexible, richer and expanded inflation
targeting + plus
– External reserves
Resilience of Brazilian
Economy
• Beginning of growth cycle with favorable
commodities prices
• Diversified manufacturing industry
• Natural resources and energy
Fragilities of Brazilian
Economy
– Weak institutions: patrimonial state captured by
bureaucracy and allied forces imposing very high
taxation on productive sector
– Heritages from high inflation period: high level of
interest rate and indexation of financial system
– Natural resources curse?
– Overvalued exchange rate and premature
deindustrialization
– Low rate of investment/low saving rate of public sector
Why Brazil May Succeed
• In the last few years Brazilian GDP has been growing
4%, fast enough to propel the economy and turning
easier to solve problems.
• The crises of US global governance and decline of
conventional economic thinking, Brazil have to think
by itself searching for a new model.
• “Slowly” Brazilian state are recovering capacity of
strategic planning.
• Strong political demand of stability and growth by the
large and better educated “new middle class”
• High potential growth (catching up)