global disparities in metabolic syndrome, diabetes and cardiovascular disease nathan d. wong, phd,...
TRANSCRIPT

Global Disparities in Metabolic Global Disparities in Metabolic Syndrome, Diabetes and Syndrome, Diabetes and Cardiovascular DiseaseCardiovascular Disease
Nathan D. Wong, PhD, FACC, FAHANathan D. Wong, PhD, FACC, FAHAProfessor and Director, Heart Disease Professor and Director, Heart Disease Prevention Program, Division of Prevention Program, Division of Cardiology, University of California, IrvineCardiology, University of California, IrvineImmediate Past President, American Immediate Past President, American Society of Preventive CardiologySociety of Preventive Cardiology

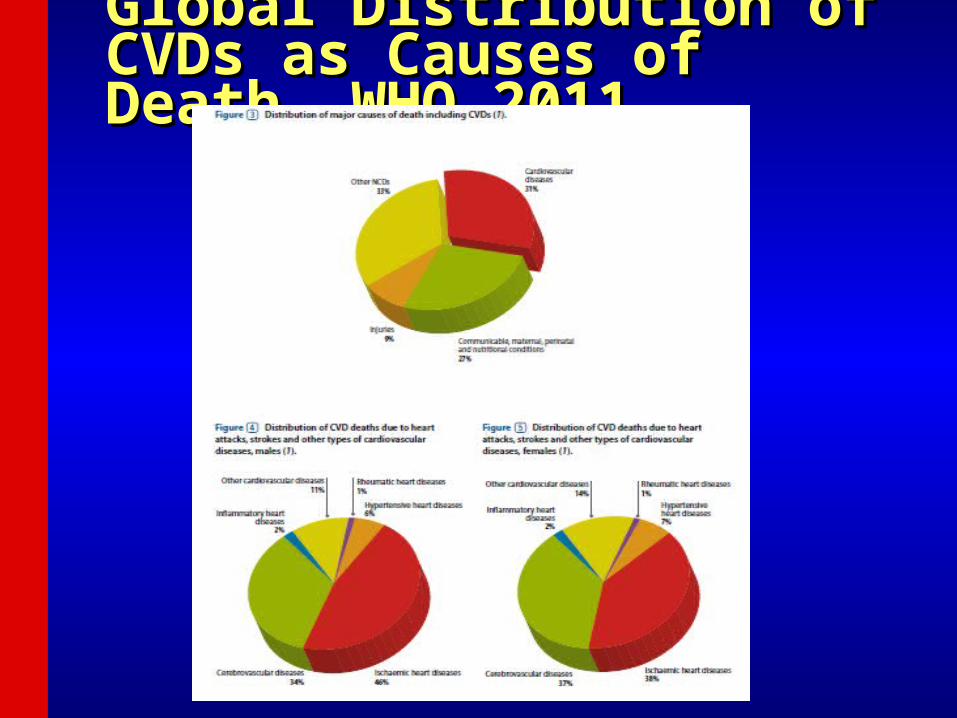
Global Distribution of CVDs as Global Distribution of CVDs as Causes of Death, WHO 2011Causes of Death, WHO 2011
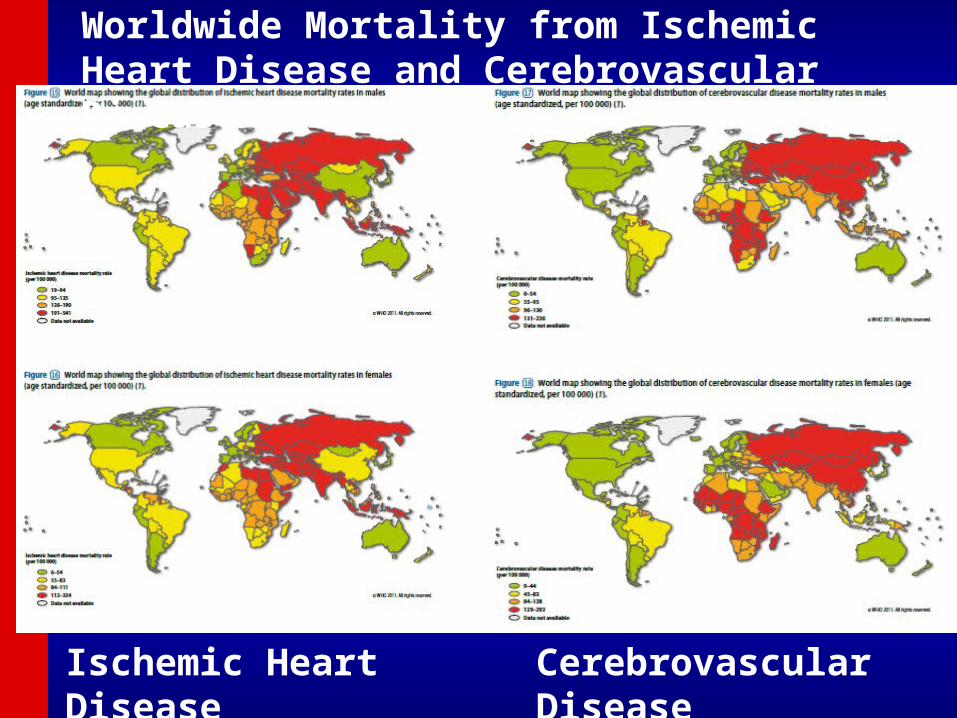
Worldwide Mortality from Ischemic Heart Disease and Cerebrovascular Disease 2011
Ischemic Heart Disease Cerebrovascular Disease

Development of Atherosclerotic Plaques
NormalFatty streak
Foam cells
Lipid-rich plaque
Lipid core
Fibrous cap
Thrombus
Ross R. Nature. 1993;362:801-809.

Age-Adjusted Coronary Heart Age-Adjusted Coronary Heart Disease Rates by CountryDisease Rates by Country

Age-Adjusted Death Rates Age-Adjusted Death Rates from Stroke, by Countryfrom Stroke, by Country


CVD will be the top cause for future total CVD will be the top cause for future total DALY lost in ChinaDALY lost in China(Per 1000 Population)(Per 1000 Population)
Morbidity Mortality

Approaches to Primary and Approaches to Primary and Secondary Prevention of Secondary Prevention of CVDCVD
• Primary prevention involves prevention of Primary prevention involves prevention of onset of disease in persons without onset of disease in persons without symptoms.symptoms.
• Primordial prevention involves the Primordial prevention involves the prevention of risk factors causative o the prevention of risk factors causative o the disease, thereby reducing the likelihood of disease, thereby reducing the likelihood of development of the disease.development of the disease.
• Secondary prevention refers to the Secondary prevention refers to the prevention of death or recurrence of disease prevention of death or recurrence of disease in those who are already symptomaticin those who are already symptomatic
Risk Factor Concepts in Risk Factor Concepts in Primary PreventionPrimary Prevention
• Nonmodifiable risk factorsNonmodifiable risk factors include age, sex, include age, sex, race, and family history of CVD, which can race, and family history of CVD, which can identify high-risk populationsidentify high-risk populations
• Behavioral risk factorsBehavioral risk factors include sedentary include sedentary lifestyle, unhealthful diet, heavy alcohol or lifestyle, unhealthful diet, heavy alcohol or cigarette consumption.cigarette consumption.
• Physiological risk factorsPhysiological risk factors include include hypertension, obesity, lipid problems, and hypertension, obesity, lipid problems, and diabetes, which may be a consequence of diabetes, which may be a consequence of behavioral risk factors.behavioral risk factors.

Major Risk FactorsMajor Risk Factors
• Cigarette smoking (passive smoking?)Cigarette smoking (passive smoking?)• Elevated total or LDL-cholesterolElevated total or LDL-cholesterol• Hypertension (BP Hypertension (BP 140/90 mmHg or on 140/90 mmHg or on
antihypertensive medication)antihypertensive medication)• Low HDL cholesterol (<40 mg/dL)Low HDL cholesterol (<40 mg/dL)†† • Family history of premature CHDFamily history of premature CHD
– CHD in male first degree relative <55 CHD in male first degree relative <55 yearsyears
– CHD in female first degree relative <65 CHD in female first degree relative <65 yearsyears
• Age (men Age (men 45 years; women 45 years; women 55 years)55 years)
† HDL cholesterol 60 mg/dL counts as a “negative” risk factor; its presence removes one risk factor from the total count.
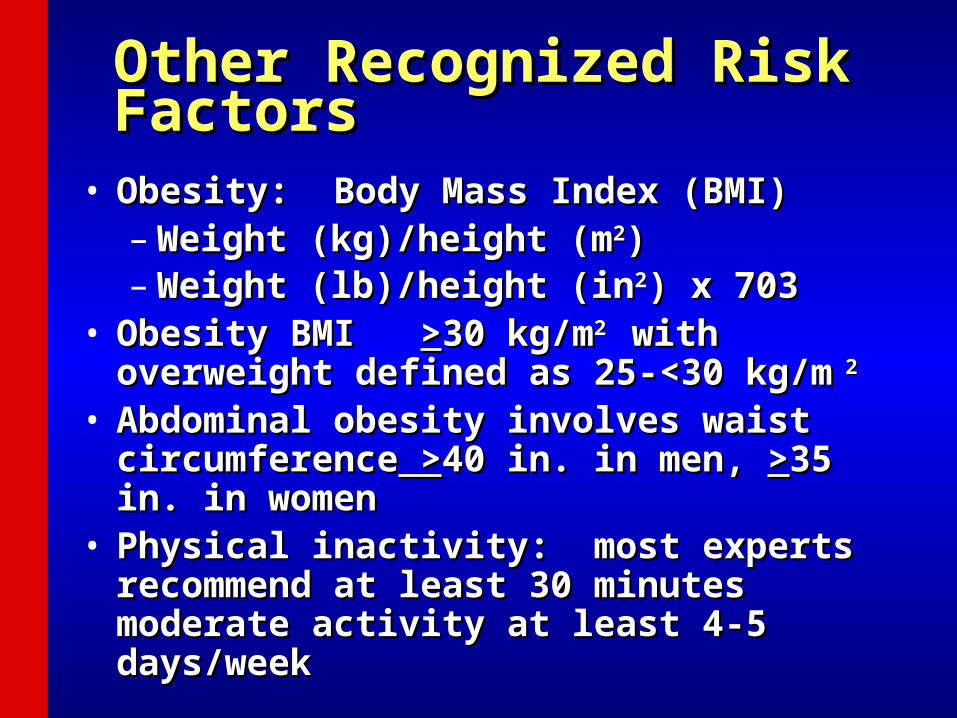
Other Recognized Risk Other Recognized Risk FactorsFactors
• Obesity: Body Mass Index (BMI)Obesity: Body Mass Index (BMI)– Weight (kg)/height (mWeight (kg)/height (m22))– Weight (lb)/height (inWeight (lb)/height (in22) x 703) x 703
• Obesity BMI Obesity BMI >>30 kg/m30 kg/m2 2 with overweight with overweight defined as 25-<30 kg/mdefined as 25-<30 kg/m 2 2
• Abdominal obesity involves waist Abdominal obesity involves waist circumferencecircumference > >40 in. in men, 40 in. in men, >>35 in. in 35 in. in womenwomen
• Physical inactivity: most experts Physical inactivity: most experts recommend at least 30 minutes moderate recommend at least 30 minutes moderate activity at least 4-5 days/weekactivity at least 4-5 days/week

Cardiovascular Risk Factors are the Top 6 Leading Causes of Death
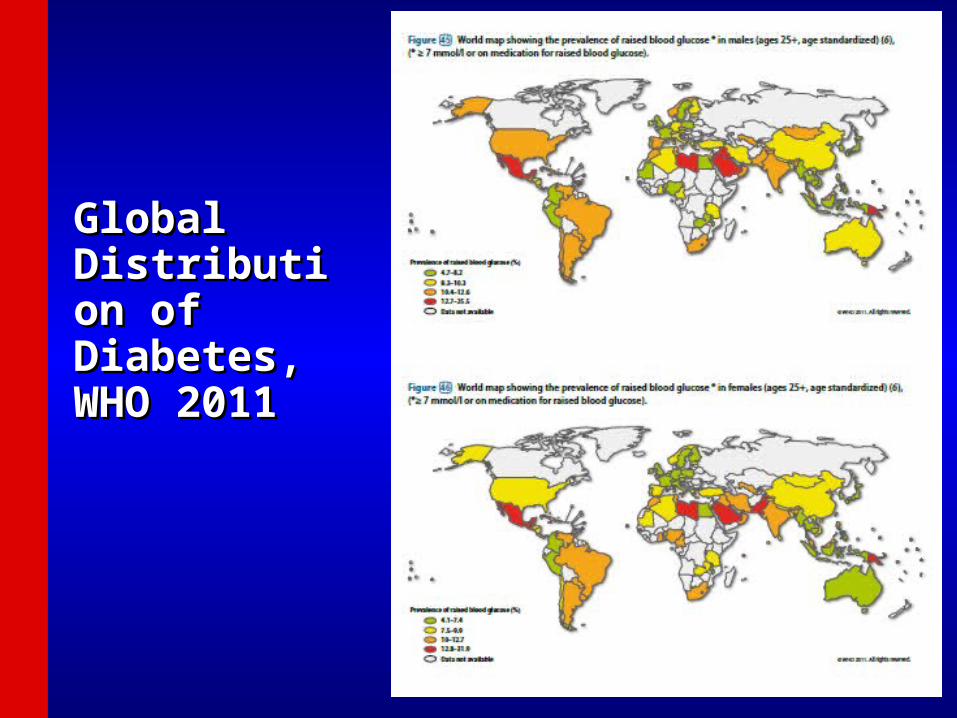
Global Global Distribution Distribution of Diabetes, of Diabetes, WHO 2011WHO 2011

Risk of Cardiovascular Events in Risk of Cardiovascular Events in DiabeticsDiabetics Framingham StudyFramingham Study
Age-adjustedAge-adjusted
Biennial Rate Age-adjustedBiennial Rate Age-adjusted Per 1000Per 1000 Risk RatioRisk Ratio
Cardiovascular EventCardiovascular Event Men WomenMen Women Men WomenMen WomenCoronary DiseaseCoronary Disease 39 2139 21 1.5** 2.2*** 1.5** 2.2***StrokeStroke 15 615 6 2.9*** 2.6*** 2.9*** 2.6***Peripheral Artery Dis. 18 18Peripheral Artery Dis. 18 18 3.4*** 6.4*** 3.4*** 6.4***Cardiac FailureCardiac Failure 23 21 23 21 4.4*** 7.8*** 4.4*** 7.8***All CVD EventsAll CVD Events 76 65 2.2*** 76 65 2.2***
3.7***3.7***
Subjects 35-64 36-year Follow-up **P<.001,***P<.0001Subjects 35-64 36-year Follow-up **P<.001,***P<.0001
_________________________________________________________________
_________________________________________________________________
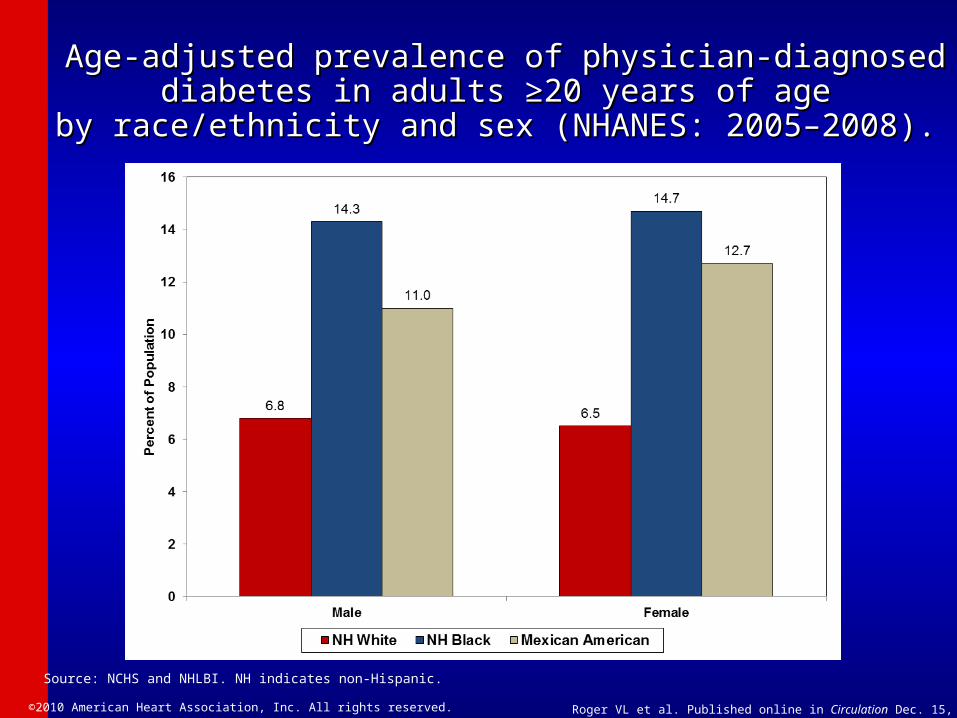
Age-adjusted prevalence of physician-diagnosed diabetes in Age-adjusted prevalence of physician-diagnosed diabetes in adults ≥20 years of age adults ≥20 years of age
by race/ethnicity and sex (NHANES: 2005–2008). by race/ethnicity and sex (NHANES: 2005–2008).
Source: NCHS and NHLBI. NH indicates non-Hispanic.
©2010 American Heart Association, Inc. All rights reserved. Roger VL et al. Published online in Circulation Dec. 15, 2010


Global Prevalence of Obesity, WHO 2011
©2011 American Heart Association, Inc. All rights reserved. Roger VL et al. Published online in Circulation Dec. 15, 2011
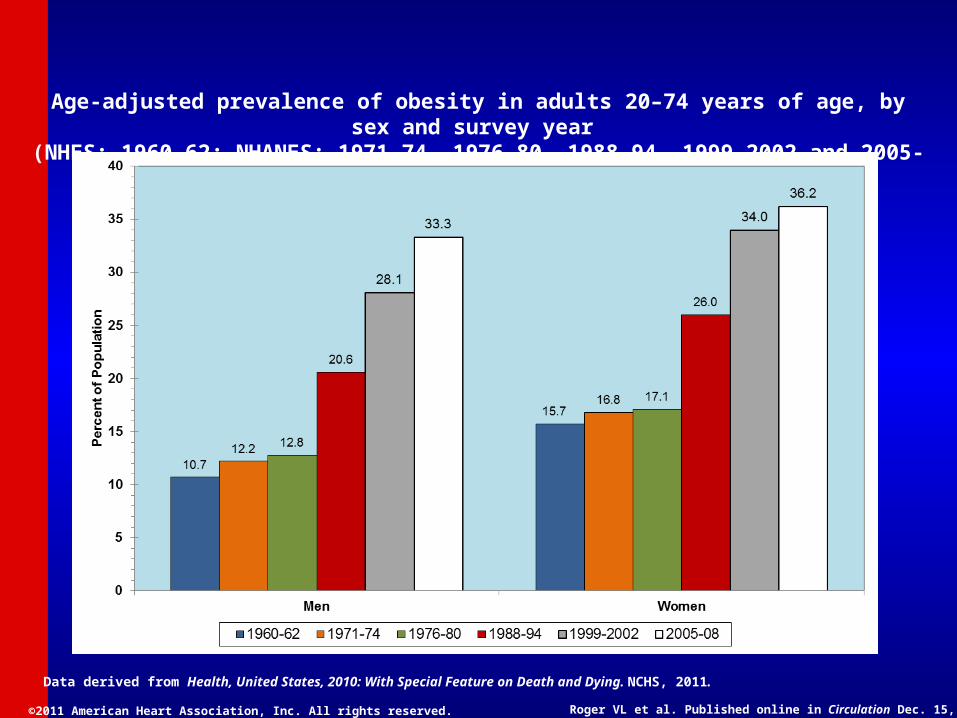
Age-adjusted prevalence of obesity in adults 20–74 years of age, by sex and survey year (NHES: 1960–62; NHANES: 1971–74, 1976–80, 1988–94, 1999-2002 and 2005-08)
Data derived from Health, United States, 2010: With Special Feature on Death and Dying. NCHS, 2011.
©2011 American Heart Association, Inc. All rights reserved. Roger VL et al. Published online in Circulation Dec. 15, 2011
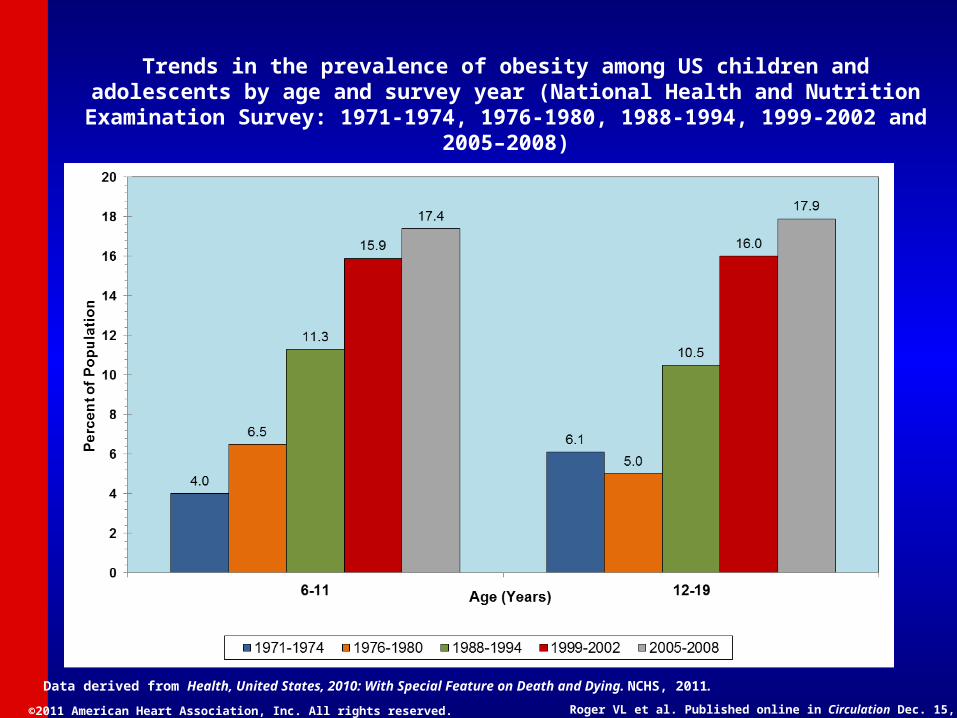
Trends in the prevalence of obesity among US children and adolescents by age and survey year (National Health and Nutrition Examination Survey: 1971-1974, 1976-1980, 1988-1994, 1999-
2002 and 2005–2008)
Data derived from Health, United States, 2010: With Special Feature on Death and Dying. NCHS, 2011.

Causes of Mortality in Causes of Mortality in Patients With Diabetes Patients With Diabetes

Diabetes and CVDDiabetes and CVD
• Atherosclerotic complications responsible for Atherosclerotic complications responsible for – 80% of mortality among patients with diabetes80% of mortality among patients with diabetes– 75% of cases due to coronary artery disease (CAD)75% of cases due to coronary artery disease (CAD)– Results in >75% of all hospitalizations for diabetic Results in >75% of all hospitalizations for diabetic
complicationscomplications
• 50% of patients with type 2 diabetes have 50% of patients with type 2 diabetes have preexisting CAD. preexisting CAD. (This number may be less now that (This number may be less now that more younger people are diagnosed with diabetes.) more younger people are diagnosed with diabetes.)
• 1/3 of patients presenting with myocardial 1/3 of patients presenting with myocardial infarction have undiagnosed diabetes mellitusinfarction have undiagnosed diabetes mellitus
Lewis GF. Can J Cardiol. 1995;11(suppl C):24C-28CNorhammar A, et.al. Lancet 2002;359;2140-2144

AGE=Advanced glycation end products, CRP=C-reactive protein, CHD=Coronary heart disease HDL=High-density lipoprotein, HTN=Hypertension, IL-6=Interleukin-6, LDL=Low-density lipoprotein, PAI-1=Plasminogen activator inhibitor-1, SAA=Serum amyloid A protein, TF=Tissue factor, TG=Triglycerides, tPA=Tissue plasminogen activator
Subclinical Atherosclerosis
Atherosclerotic Clinical Events
Hyperglycemia
AGE Oxidative
stress
Inflammation
IL-6 CRP SAA
Infection Defense
mechanisms Pathogen burden
Insulin Resistance
HTN Endothelial dysfunction
Dyslipidemia
LDL TG HDL
Thrombosis PAI-1 TF tPA
Disease Progression
Biondi-Zoccai GGL et al. JACC 2003;41:1071-1077.
Mechanisms by which Diabetes Mechanisms by which Diabetes
MellitusMellitusLeads to Coronary Heart DiseaseLeads to Coronary Heart Disease
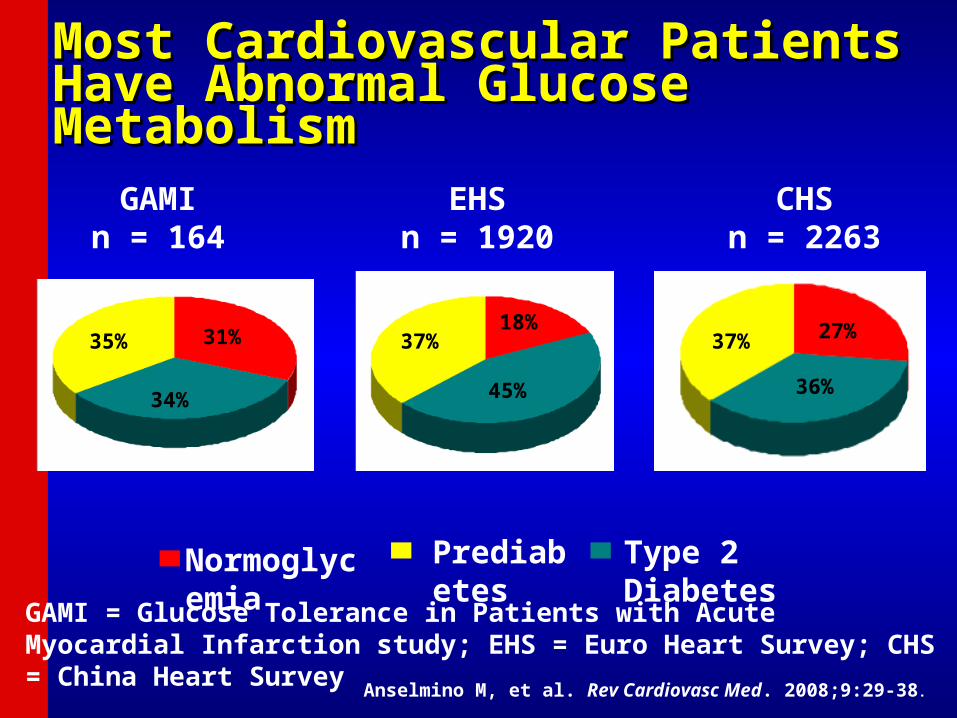
Most Cardiovascular Patients Have Most Cardiovascular Patients Have Abnormal Glucose MetabolismAbnormal Glucose Metabolism
35% 31%
34%
37%18%
45%
37% 27%
36%
GAMIn = 164
EHSn = 1920
CHSn = 2263
GAMI = Glucose Tolerance in Patients with Acute Myocardial Infarction study; EHS = Euro Heart Survey; CHS = China Heart Survey
Prediabetes
Normoglycemia
Type 2 Diabetes
Anselmino M, et al. Rev Cardiovasc Med. 2008;9:29-38.
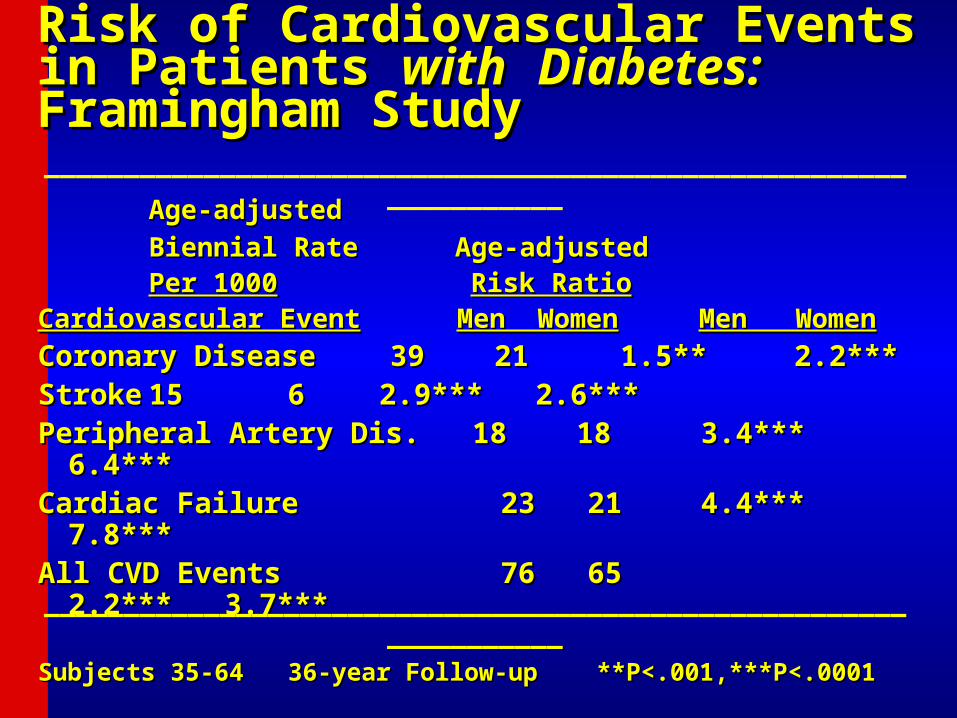
Risk of Cardiovascular Events in Patients Risk of Cardiovascular Events in Patients withwith Diabetes: Diabetes: Framingham StudyFramingham Study
Age-adjustedAge-adjusted
Biennial Rate Age-Biennial Rate Age-adjustedadjusted
Per 1000Per 1000 Risk RatioRisk RatioCardiovascular EventCardiovascular Event Men WomenMen Women Men WomenMen Women
Coronary DiseaseCoronary Disease 39 2139 21 1.5** 2.2*** 1.5** 2.2***StrokeStroke 15 615 6 2.9*** 2.6*** 2.9*** 2.6***Peripheral Artery Dis. 18 18Peripheral Artery Dis. 18 18 3.4*** 6.4*** 3.4*** 6.4***Cardiac FailureCardiac Failure 23 21 23 21 4.4*** 7.8*** 4.4*** 7.8***All CVD EventsAll CVD Events 76 65 2.2*** 3.7*** 76 65 2.2*** 3.7***
Subjects 35-64 36-year Follow-up **P<.001,***P<.0001Subjects 35-64 36-year Follow-up **P<.001,***P<.0001
_________________________________________________________________
_________________________________________________________________

Diabetes Across US Ethnic Diabetes Across US Ethnic GroupsGroups
• From 2007-2009 National Survey Data prevalence of diabetes:• 8.4% of Asian-Americans• 7.1% in non-Hispanic whites• 11.8% of Hispanics• 12.6% of non-Hispanic blacks.
Source: AHA Heart and Stroke Facts 2013

Prevalence estimates for Prevalence estimates for DiabetesDiabetes and and Borderline Borderline DiabetesDiabetes across California racial and ethnic groups across California racial and ethnic groups (California Health interview Survey 2009) (California Health interview Survey 2009)
Borderline DiabetesDiabetes

健康危害健康危害——糖尿病患病率持续增长糖尿病患病率持续增长
Prevalence( % )
Increasing prevalence of diabetes in urban China
Ministry of Health of the People’s Republic of China

2008 Diabetes Cases in China Exceeds 2008 Diabetes Cases in China Exceeds 2008 and 2016 Projected Levels2008 and 2016 Projected Levels
92
53
76
20
0
20
40
60
80
100
Cas
es (M
illio
ns)
Actual 2008 Projected 2008 Projected 2016 US 2008 Actual
Sources: Liu et al 2002, Pan et al, US CDC

Changes in Overweight/Obesity Prevalence 1992-Changes in Overweight/Obesity Prevalence 1992-2002 in Adults in China (Wang et al., 2007)2002 in Adults in China (Wang et al., 2007)

Increases in Overweight/Obesity Increases in Overweight/Obesity Prevalence in China by Urban/Rural and Prevalence in China by Urban/Rural and Income Status (Du et al. 2002)Income Status (Du et al. 2002)
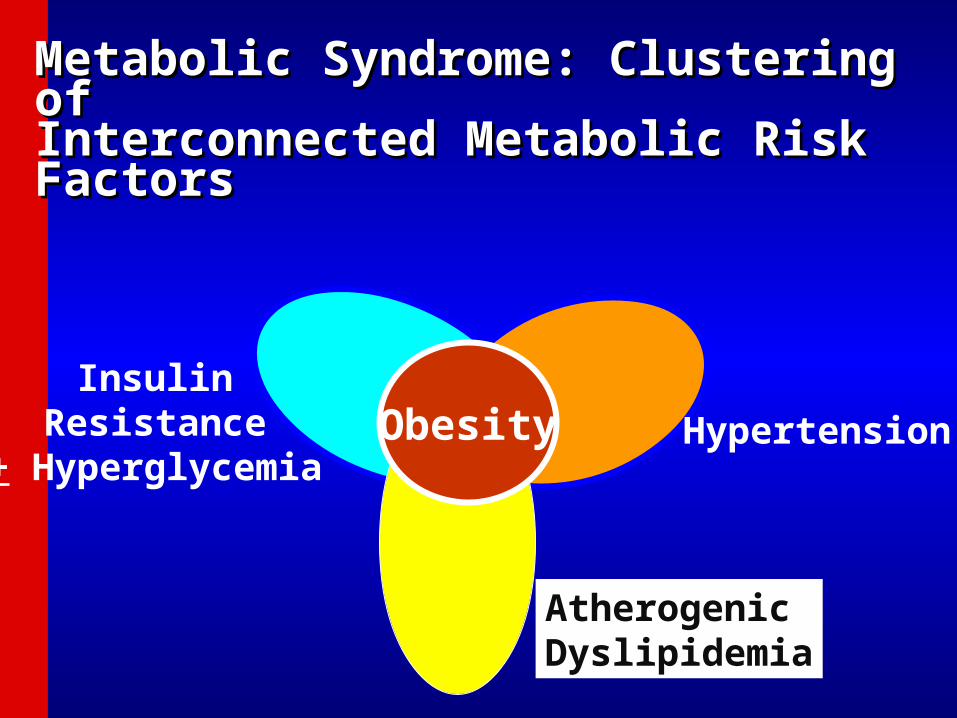
Metabolic Syndrome: Clustering Metabolic Syndrome: Clustering of of Interconnected Metabolic Risk Interconnected Metabolic Risk FactorsFactors
ObesityInsulin
Resistance+ Hyperglycemia
Hypertension
AtherogenicDyslipidemia

2009 IDF/IAS/NHLBI/AHA/WHF Joint Scientific Statement on Diagnosis of Metabolic Syndrome
(Alberti et al. Circulation 2009) (>=3 criteria required for diagnosis)
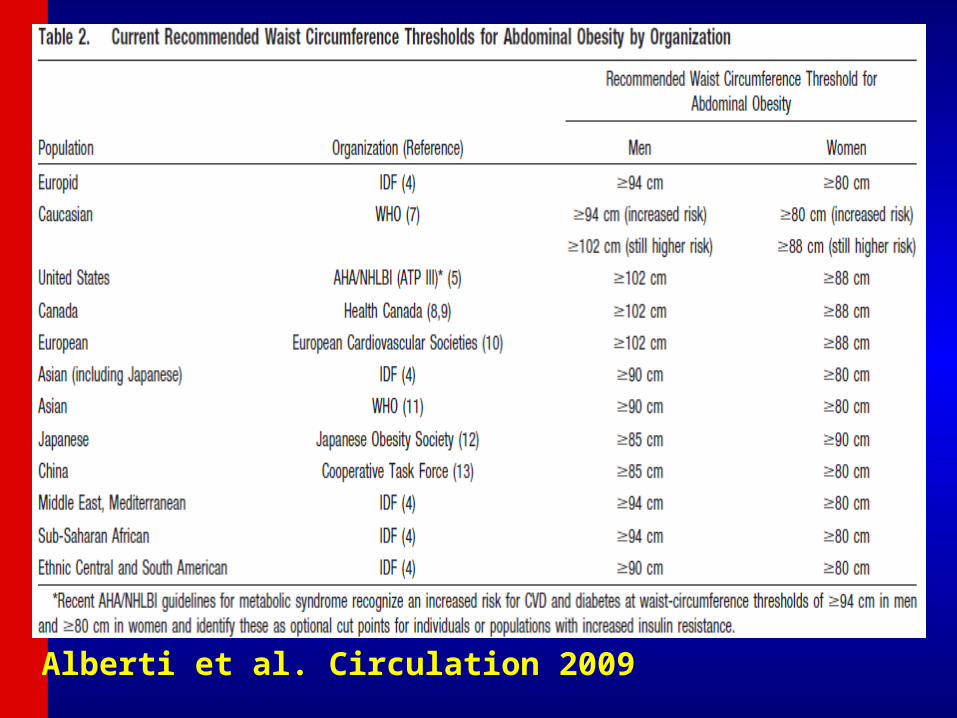
Alberti et al. Circulation 2009
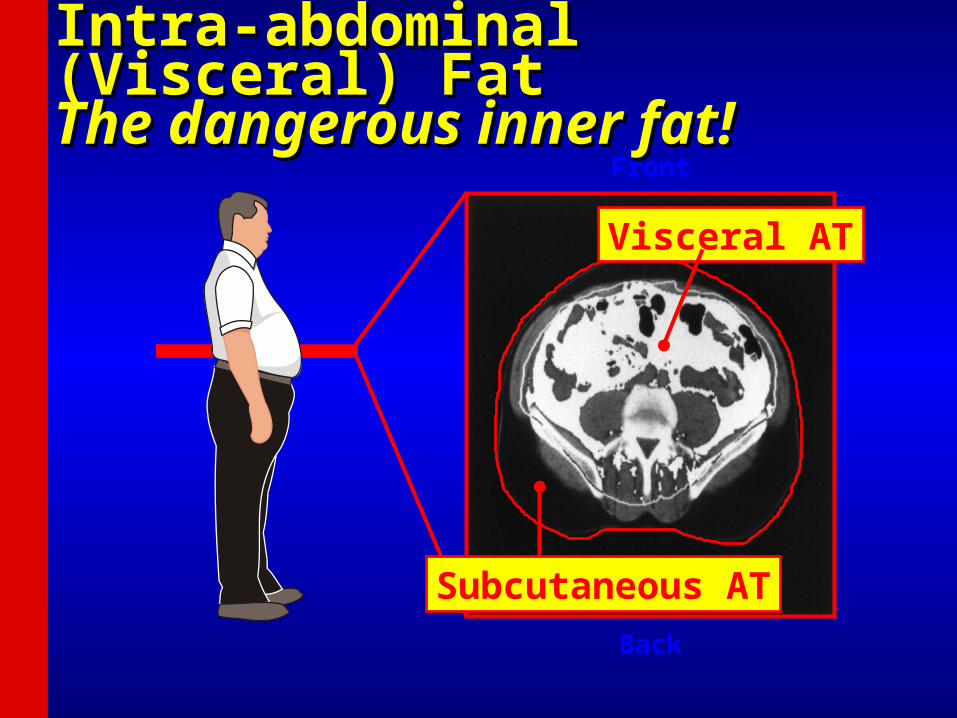
Back
Visceral AT
Subcutaneous AT
Front
Intra-abdominal (Visceral) FatIntra-abdominal (Visceral) FatThe dangerous inner fat!The dangerous inner fat!

0
5
10
15
20
25
<28 >28-29 30-31 32-33 34-35 36-37 ≥38
Rel
ativ
e R
isk
of
Dia
bet
es
Waist Circumference (in)
Abdominal Adiposity Is AssociatedAbdominal Adiposity Is Associated With Increased Risk of DiabetesWith Increased Risk of Diabetes
P value for trend <0.001
Carey VJ, et al. Am J Epidemiol. 1997;145:614-619


Metabolic Syndrome and Diabetes in Relation to CHD, CVD, Metabolic Syndrome and Diabetes in Relation to CHD, CVD, and Total Mortality: U.S. Men and Women Ages 30-74and Total Mortality: U.S. Men and Women Ages 30-74
* p<.05, ** p<.01, **** p<.0001 compared to none
*
***
***
***
**
***
***
***
***
***
***
Malik and Wong, et al., Circulation 2004.
(Risk-factor Adjusted Cox Regression) NHANES II Follow-up (n=6255)
***

Metabolic Syndrome and CVD Metabolic Syndrome and CVD Risk: Meta-Analysis: Risk: Meta-Analysis: Mottillo et al. JACC 2010Mottillo et al. JACC 2010
• 951,083 pts in 83 studies951,083 pts in 83 studies• Little variation in risk between definitionsLittle variation in risk between definitions• Relative risk:Relative risk:
– 2.35 (2.20-2.73) for CVD events2.35 (2.20-2.73) for CVD events– 2.40 (1.87-3.08) for CVD mortality2.40 (1.87-3.08) for CVD mortality– 1.58 (1.39-1.78) for all-cause mortality1.58 (1.39-1.78) for all-cause mortality– 1.99 (1.61-2.46) for myocardial infarction1.99 (1.61-2.46) for myocardial infarction– 2.27 (1.80-2.85) for stroke2.27 (1.80-2.85) for strokeThose with metabolic syndrome, without Those with metabolic syndrome, without
diabetes, maintained high CVD risk (RR=1.75, diabetes, maintained high CVD risk (RR=1.75, 95% CI=1.19-2.58)95% CI=1.19-2.58)
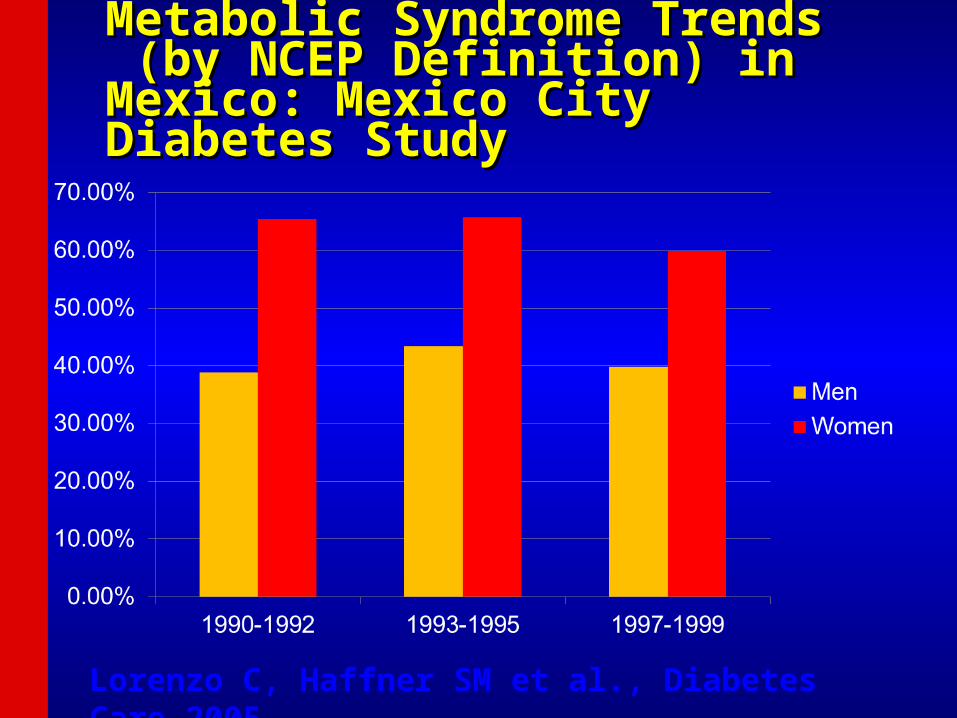
Metabolic Syndrome TrendsMetabolic Syndrome Trends (by NCEP Definition) in Mexico: (by NCEP Definition) in Mexico: Mexico City Diabetes StudyMexico City Diabetes Study
Lorenzo C, Haffner SM et al., Diabetes Care 2005
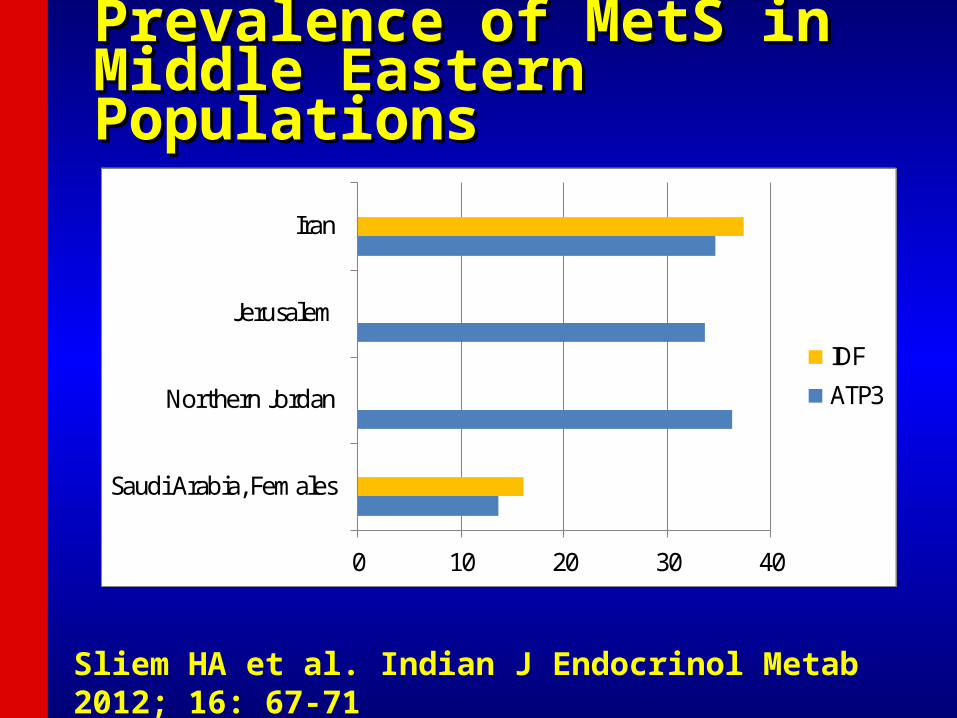
Prevalence of MetS in Middle Prevalence of MetS in Middle Eastern PopulationsEastern Populations
Sliem HA et al. Indian J Endocrinol Metab 2012; 16: 67-71
0 10 20 30 40
Saudi Arabia, Females
Northern Jordan
Jerusalem
Iran
IDF
ATP3

Significant Prevalence of Obesity in Significant Prevalence of Obesity in Middle East: BMI >=30Middle East: BMI >=30
• Oman 30.8%Oman 30.8%• Qatar 40.8%Qatar 40.8%• Gaza/West Bank 41.5%Gaza/West Bank 41.5%• Egypt 30.2% of men and 70.9% of women Egypt 30.2% of men and 70.9% of women
based on IDF European cutpoints (80cm based on IDF European cutpoints (80cm women and 94 cm men), but 31.7% of men women and 94 cm men), but 31.7% of men and 50.8% of women based on new Egyptian and 50.8% of women based on new Egyptian waist circumference cutpoints (97.5 cm men waist circumference cutpoints (97.5 cm men and 92.3 cm women)and 92.3 cm women)
• Metabolic syndrome present in 26% of obese Metabolic syndrome present in 26% of obese children in Lebanonchildren in Lebanon
Sliem HA et al. Indian J Endocrinol Metab 2012; 16: 67-71

Lifestyle Issues Contribute to Lifestyle Issues Contribute to Obesity and MetS in Saudi ArabiaObesity and MetS in Saudi Arabia
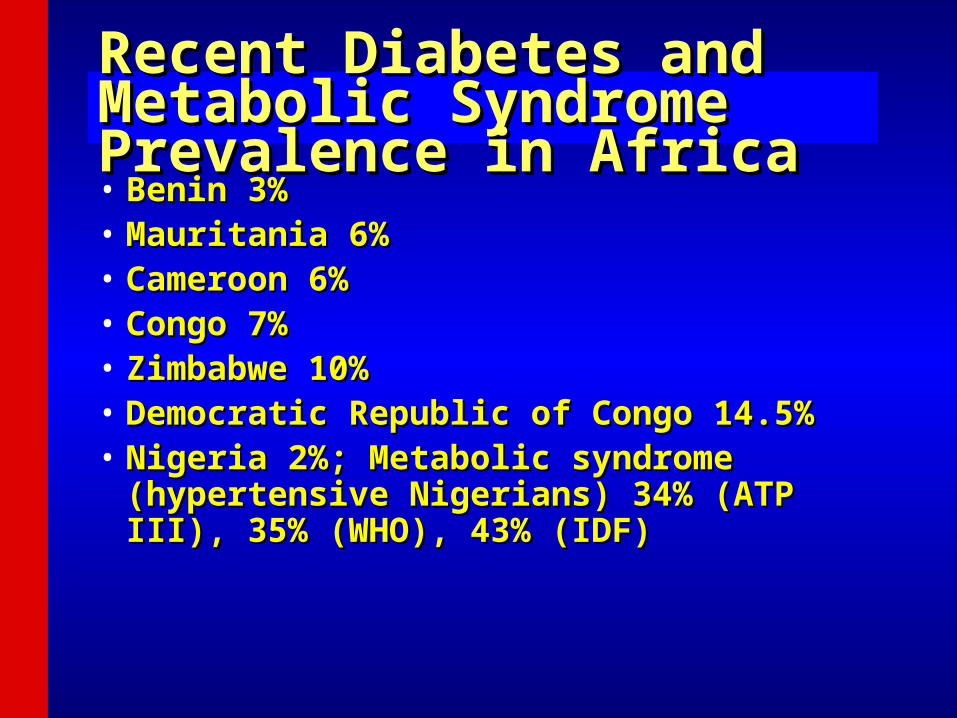
Recent Diabetes and Recent Diabetes and Metabolic Syndrome Metabolic Syndrome Prevalence in Africa Prevalence in Africa • Benin 3%Benin 3%• Mauritania 6%Mauritania 6%• Cameroon 6%Cameroon 6%• Congo 7%Congo 7%• Zimbabwe 10%Zimbabwe 10%• Democratic Republic of Congo 14.5%Democratic Republic of Congo 14.5%• Nigeria 2%; Metabolic syndrome Nigeria 2%; Metabolic syndrome
(hypertensive Nigerians) 34% (ATP III), 35% (hypertensive Nigerians) 34% (ATP III), 35% (WHO), 43% (IDF)(WHO), 43% (IDF)

Prevalence of Metabolic Prevalence of Metabolic Syndrome in AfricaSyndrome in Africa
• Prevalence depends greatly on the population setting; Prevalence depends greatly on the population setting; increase attributed to the Western lifestyle from increase attributed to the Western lifestyle from reduced physical activity and substitution of the reduced physical activity and substitution of the traditional African diet (rich in fruits and vegetables) to traditional African diet (rich in fruits and vegetables) to energy-laden foodsenergy-laden foods
• More common in females, with increasing age, and More common in females, with increasing age, and urban setting; some exceptions such as lower urban setting; some exceptions such as lower prevalence among women in Jos plateau of Nigeria prevalence among women in Jos plateau of Nigeria who are more active whereas in Sokota region the who are more active whereas in Sokota region the religious practice of women in Purdah makes them religious practice of women in Purdah makes them sedentary.sedentary.

Purdah is the traditional Islamic practice that confines Purdah is the traditional Islamic practice that confines women to the home or compound and so limits their women to the home or compound and so limits their participation in society. Women living in purdah are not participation in society. Women living in purdah are not allowed to come out of their homesteads. allowed to come out of their homesteads.
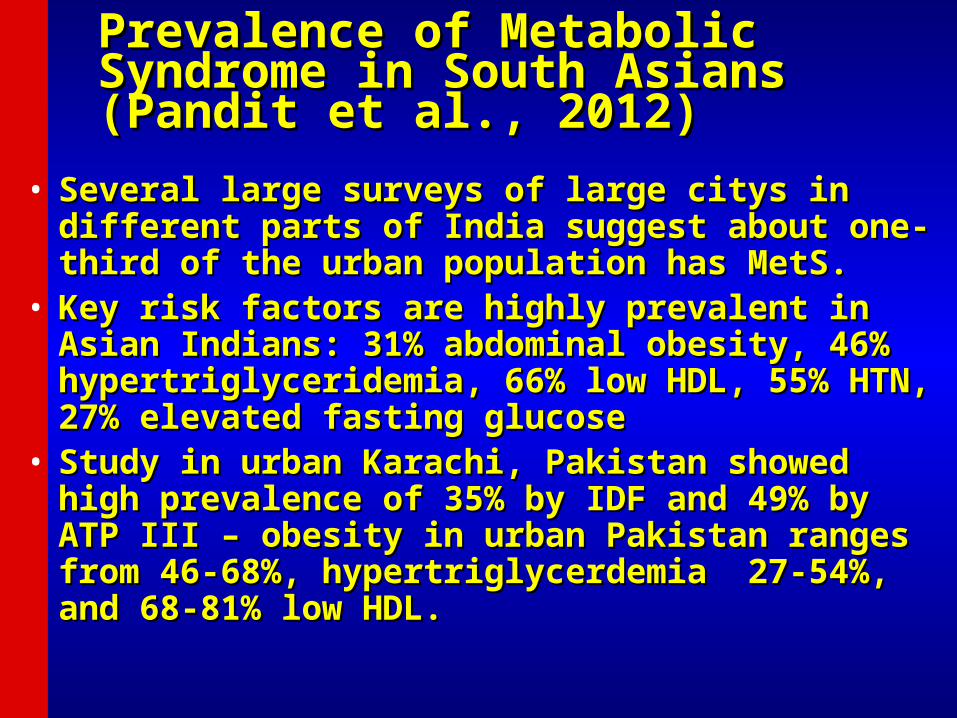
Prevalence of Metabolic Syndrome in Prevalence of Metabolic Syndrome in South Asians (Pandit et al., 2012)South Asians (Pandit et al., 2012)
• Several large surveys of large citys in different Several large surveys of large citys in different parts of India suggest about one-third of the urban parts of India suggest about one-third of the urban population has MetS.population has MetS.
• Key risk factors are highly prevalent in Asian Key risk factors are highly prevalent in Asian Indians: 31% abdominal obesity, 46% Indians: 31% abdominal obesity, 46% hypertriglyceridemia, 66% low HDL, 55% HTN, 27% hypertriglyceridemia, 66% low HDL, 55% HTN, 27% elevated fasting glucoseelevated fasting glucose
• Study in urban Karachi, Pakistan showed high Study in urban Karachi, Pakistan showed high prevalence of 35% by IDF and 49% by ATP III – prevalence of 35% by IDF and 49% by ATP III – obesity in urban Pakistan ranges from 46-68%, obesity in urban Pakistan ranges from 46-68%, hypertriglycerdemia 27-54%, and 68-81% low HDL.hypertriglycerdemia 27-54%, and 68-81% low HDL.
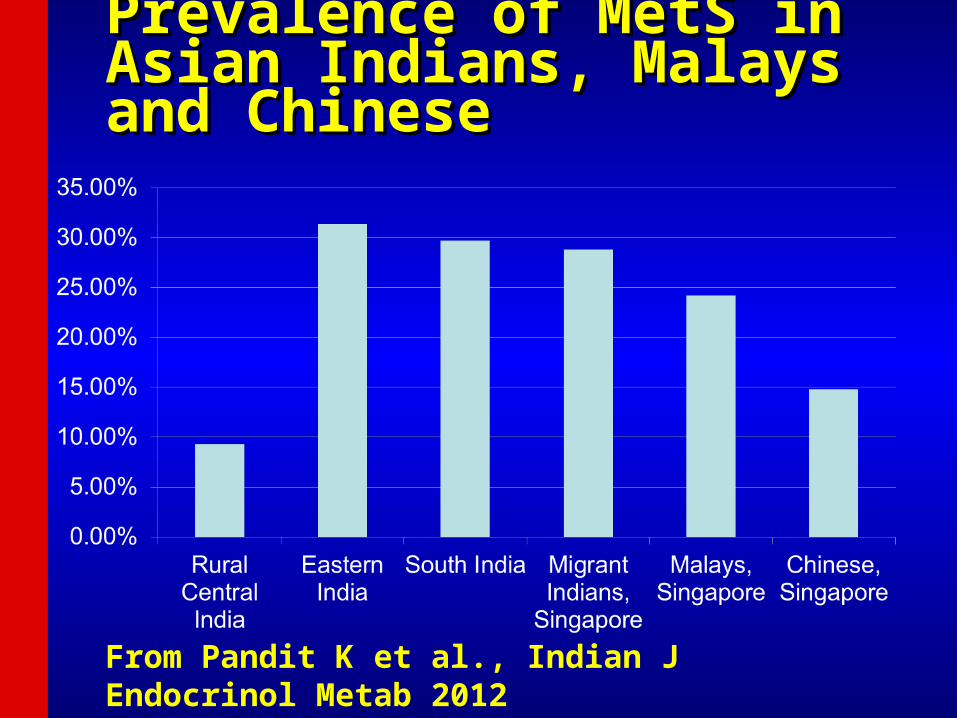
Prevalence of MetS in Asian Prevalence of MetS in Asian Indians, Malays and ChineseIndians, Malays and Chinese
From Pandit K et al., Indian J Endocrinol Metab 2012
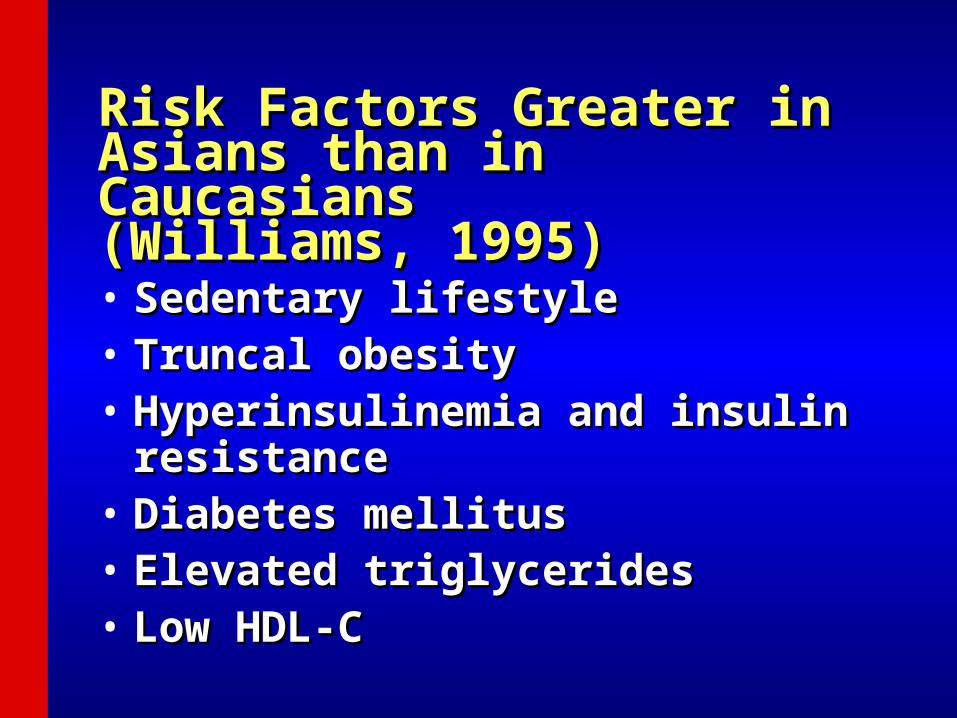
Risk Factors Greater in Asians Risk Factors Greater in Asians than in Caucasians than in Caucasians (Williams, 1995)(Williams, 1995)
• Sedentary lifestyleSedentary lifestyle• Truncal obesityTruncal obesity• Hyperinsulinemia and insulin resistanceHyperinsulinemia and insulin resistance• Diabetes mellitusDiabetes mellitus• Elevated triglyceridesElevated triglycerides• Low HDL-CLow HDL-C
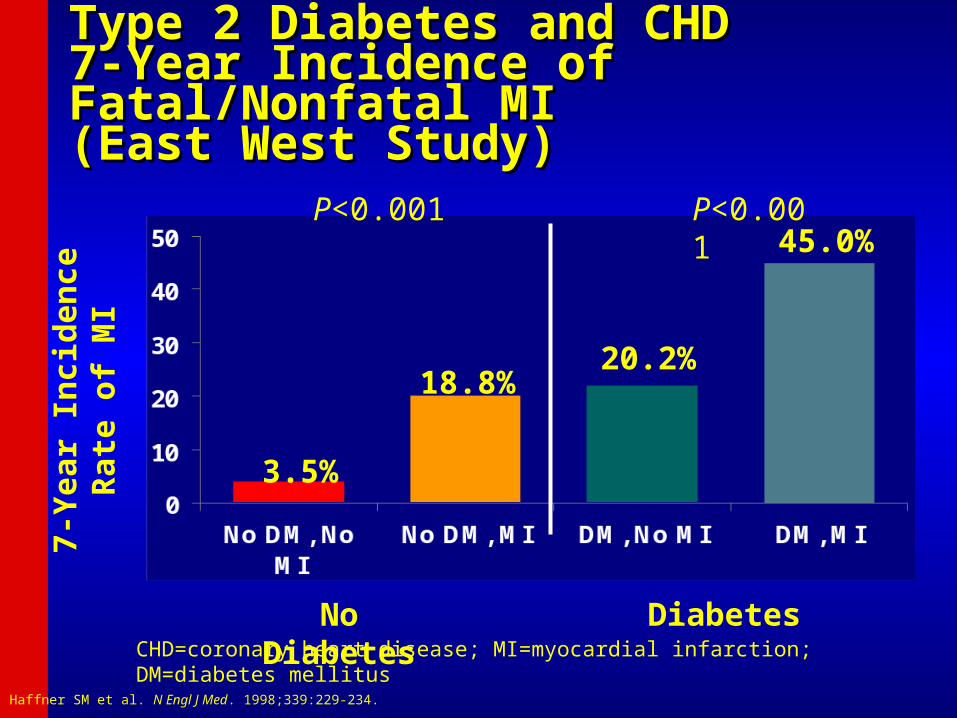
Type 2 Diabetes and CHD Type 2 Diabetes and CHD 7-Year Incidence of Fatal/Nonfatal MI 7-Year Incidence of Fatal/Nonfatal MI (East West Study)(East West Study)
No Diabetes
Diabetes
3.5%
18.8%20.2%
45.0%P<0.001 P<0.001
7-Y
ear
Inci
den
ce R
ate
of
MI
CHD=coronary heart disease; MI=myocardial infarction; DM=diabetes mellitusHaffner SM et al. N Engl J Med. 1998;339:229-234.
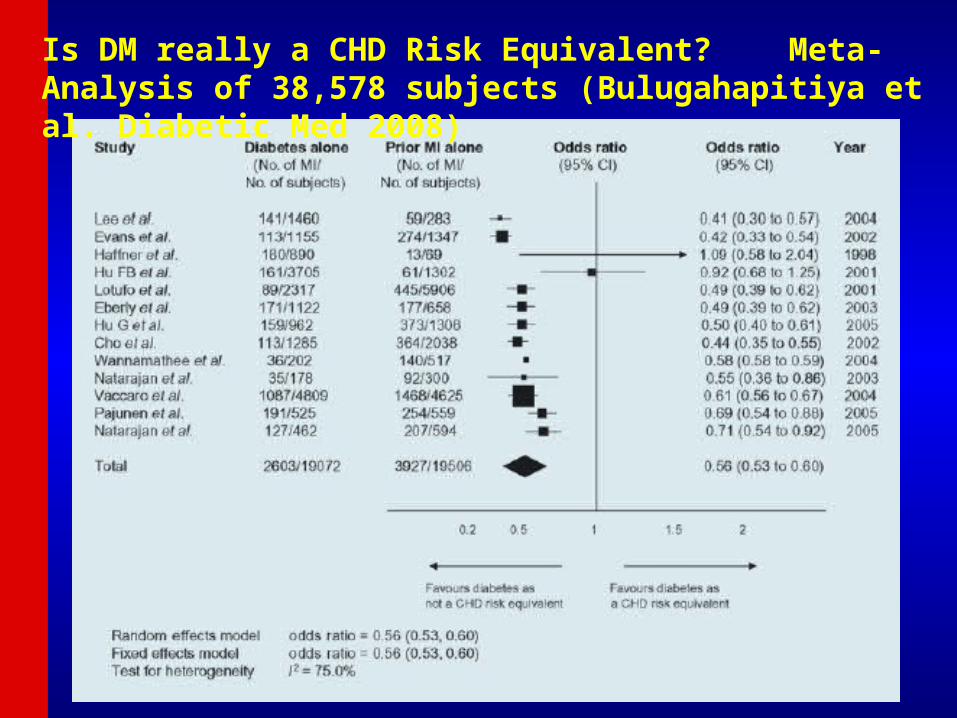
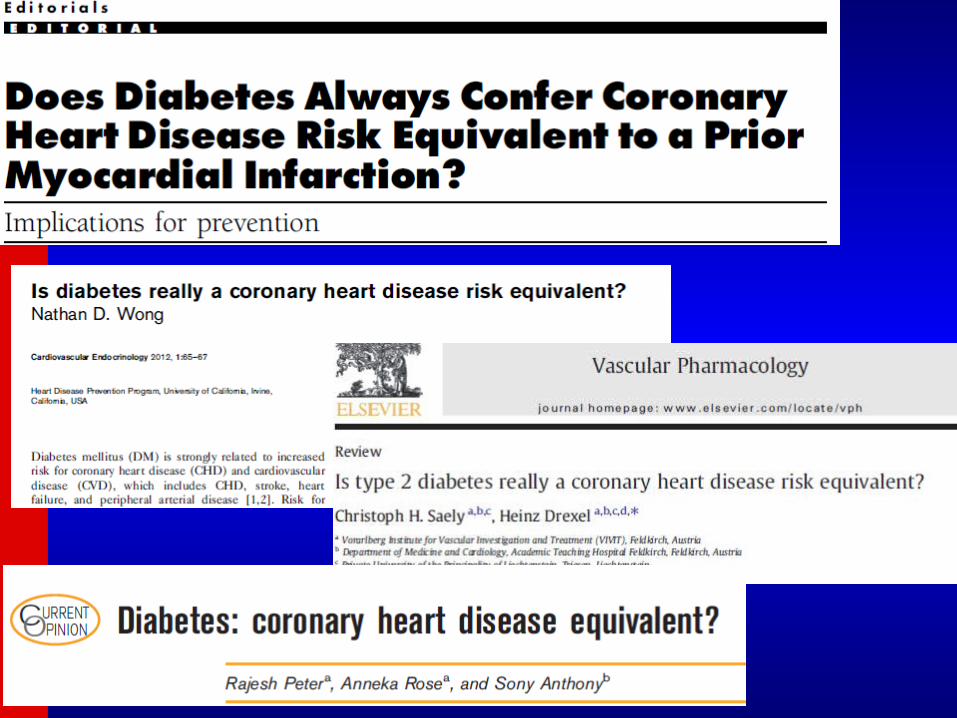
Is DM really a CHD Risk Equivalent? Meta-Analysis of 38,578 subjects (Bulugahapitiya et al. Diabetic Med 2008)

Global Risk Assessment in DM: Global Risk Assessment in DM: 10-year Total CVD Risk by Gender10-year Total CVD Risk by Gender(Wong ND et al., Diab Vas Dis Res 2012)(Wong ND et al., Diab Vas Dis Res 2012)

Annual CHD Event Rates (in %) by Calcium Score Events by Annual CHD Event Rates (in %) by Calcium Score Events by CAC Categories in Subjects with DM, MetS, or Neither DiseaseCAC Categories in Subjects with DM, MetS, or Neither Disease(Malik and Wong et al., Diabetes Care 2011)(Malik and Wong et al., Diabetes Care 2011)
Coronary Heart Disease
Coronary Artery Calcium Score
ACCF/AHA 2010 Guideline: CAC Scoring for CV risk ACCF/AHA 2010 Guideline: CAC Scoring for CV risk assessment in asymptomatic adults aged 40 and over with assessment in asymptomatic adults aged 40 and over with diabetes (Class IIa-B)diabetes (Class IIa-B)
0 1-99 100-399400+
Neither MetS/DM
MetSDM
0.4
1.5 1.9
4
0.20.8
2.1
3.5
0.1 0.41.3
2.2
00.5
11.5
22.5
33.5
4
Annual CHD Event Rate
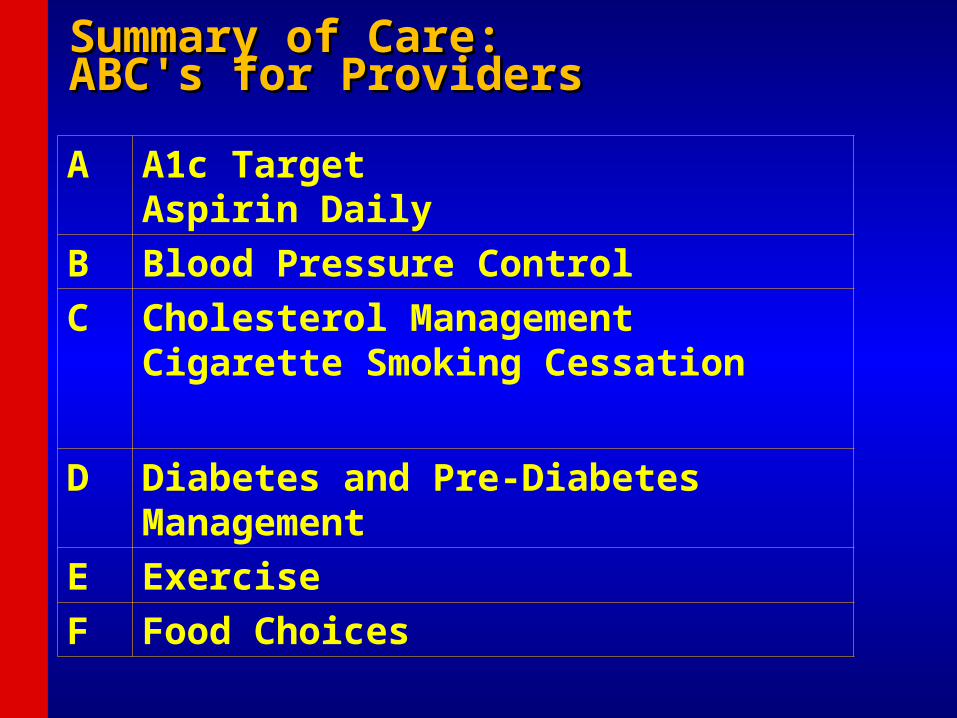
Summary of Care: Summary of Care: ABC's for ProvidersABC's for Providers
A A1c Target Aspirin Daily
B Blood Pressure Control
C Cholesterol ManagementCigarette Smoking Cessation
D Diabetes and Pre-Diabetes Management
E Exercise
F Food Choices

Control of DM Risk Factors in a Large Multipayer Outpatient Population in Northern California (n=15,826) (Holland et al., J Diab Complic 2013)
Individual control of HbA1c, BP, and LDL ranged from 42-78% in AsiansComposite control of HbA1c, BP, and LDL ranged from 21-27% in Asians

1. Steering Committee of the Physicians' Health Study Research Group. NEJM 1989;321:129-35
2. ETDRS Investigators. JAMA 1992;268:12923. Antiplatelet Trialists' Collaboration. BMJ
1994; 308:81
0
5
10
15
20
25
PHS ETDRS APT BIP PPP POPADAD JPAD
En
dp
oin
t (%
)
No ASA
ASA
n= 533 3711 4502 2368 1031 1276 2539 Endpoint 5 yr MI 7 yr MI 1 yr MCE 5 yr CV Death 4 yr MCE 7yr MCE 4 yr MCE # Events 26 vs 11 283 vs 241 502 vs 415 183 vs 133 20 vs 22 117 vs 116 86 vs 68
Diabetes Mellitus:Diabetes Mellitus:Effect of AspirinEffect of Aspirin
4. Harpaz D et al. Am J Med 1998;105:494
3. Sacco M et al. Diabetes Care 2003;26:3264
4. Belch J et al. BMJ 2008; 337:a18405. Ogawa H et al. JAMA 2008; 300:
2134
p=.04p < 0.001
p<0.002
p=NS
p=NS
p=NS
NS=Not Significant
p<0.05

Variation in Aspirin Use by Ethnicity: MESA Study (Sanchez DR, Am J Cardiol 2011)
1)Regular use of aspirin (>=3X per week) examined in 6,452 White, Black, Hispanic, and Chinese patients without CVD.2)In 2002, prevalence of aspirin use in those at increased (6-<10%) risk was greatest in whites (41%) followed by Blacks (27%), Hispanics (24%), or Chinese (15%) (p<0.001).3)Among high risk subjects (>=10%), corresponding prevalences were 53%, 43%, 38%, and 28%.4)Important racial/ethnic disparities exist for unclear reasons.

Recommendations:Recommendations:Antiplatelet Agents (1)Antiplatelet Agents (1)
• Consider aspirin therapy (75–162 mg/day) (C)Consider aspirin therapy (75–162 mg/day) (C)– As a primary prevention strategy in those with type 1 or type 2 As a primary prevention strategy in those with type 1 or type 2
diabetes at increased cardiovascular risk (10-year risk >10%)diabetes at increased cardiovascular risk (10-year risk >10%)– Includes most men >50 years of age or women >60 years of age who Includes most men >50 years of age or women >60 years of age who
have at least one additional major risk factorhave at least one additional major risk factor Family history of CVDFamily history of CVD HypertensionHypertension SmokingSmoking DyslipidemiaDyslipidemia AlbuminuriaAlbuminuria
ADA. VI. Prevention, Management of Complications. Diabetes Care 2013;36(suppl 1):S32-S33.

Recommendations:Recommendations:Antiplatelet Agents (2)Antiplatelet Agents (2)
• Aspirin should not be recommended for CVD prevention Aspirin should not be recommended for CVD prevention for adults with diabetes at low CVD risk, since potential for adults with diabetes at low CVD risk, since potential adverse effects from bleeding likely offset potential adverse effects from bleeding likely offset potential benefits (C)benefits (C)• 10-year CVD risk <5%: men <50 and women <60 years of age 10-year CVD risk <5%: men <50 and women <60 years of age
with no major additional CVD risk factors with no major additional CVD risk factors
• In patients in these age groups with multiple other risk In patients in these age groups with multiple other risk factors (10-year riskfactors (10-year risk55––10%), clinical judgment is required (E)10%), clinical judgment is required (E)
ADA. VI. Prevention, Management of Complications. Diabetes Care 2013;36(suppl 1):S33.
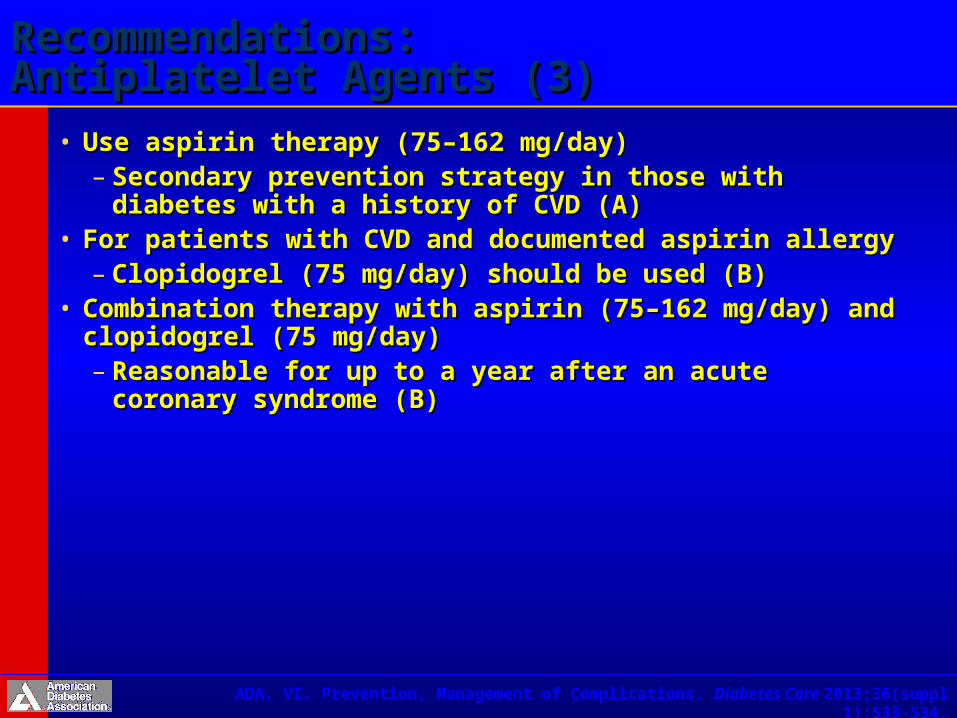
Recommendations:Recommendations:Antiplatelet Agents (3)Antiplatelet Agents (3)
• Use aspirin therapy (75–162 mg/day)Use aspirin therapy (75–162 mg/day)– Secondary prevention strategy in those with diabetes with a Secondary prevention strategy in those with diabetes with a
history of CVD (A)history of CVD (A)• For patients with CVD and documented aspirin allergyFor patients with CVD and documented aspirin allergy
– Clopidogrel (75 mg/day) should be used (B)Clopidogrel (75 mg/day) should be used (B)• Combination therapy with aspirin (75–162 mg/day) and Combination therapy with aspirin (75–162 mg/day) and
clopidogrel (75 mg/day)clopidogrel (75 mg/day)– Reasonable for up to a year after an acute coronary syndrome Reasonable for up to a year after an acute coronary syndrome
(B)(B)
ADA. VI. Prevention, Management of Complications. Diabetes Care 2013;36(suppl 1):S33-S34.

CV
death
, M
I,
or
str
oke (
%)
Standard Therapy
7.2
Intensive Glucose
Lowering
9
6
3
0
6.9
P=0.16
All-c
au
se
mort
ality
(%
)
Standard Therapy
4.0
Intensive Glucose
Lowering
9
6
3
0
5.0
P=0.04
Action to Control Cardiovascular Risk in Diabetes (ACCORD) Trial10,251 diabetic patients randomized to intensive glucose lowering (HbA1C
<6%) or standard glucose lowering (HbA1C 7.0-7.9%) for 3.5 years
Intensive glucose lowering does not reduce adverse CV events and increases all-cause mortality
ACCORD Study Group. NEJM 2008;358;2545-59
CV=Cardiovascular, HbA1C=Glycated hemoglobin, MI=Myocardial infarction
Diabetes Mellitus (Type II):Diabetes Mellitus (Type II):Effect of Intensive Glycemic ControlEffect of Intensive Glycemic Control
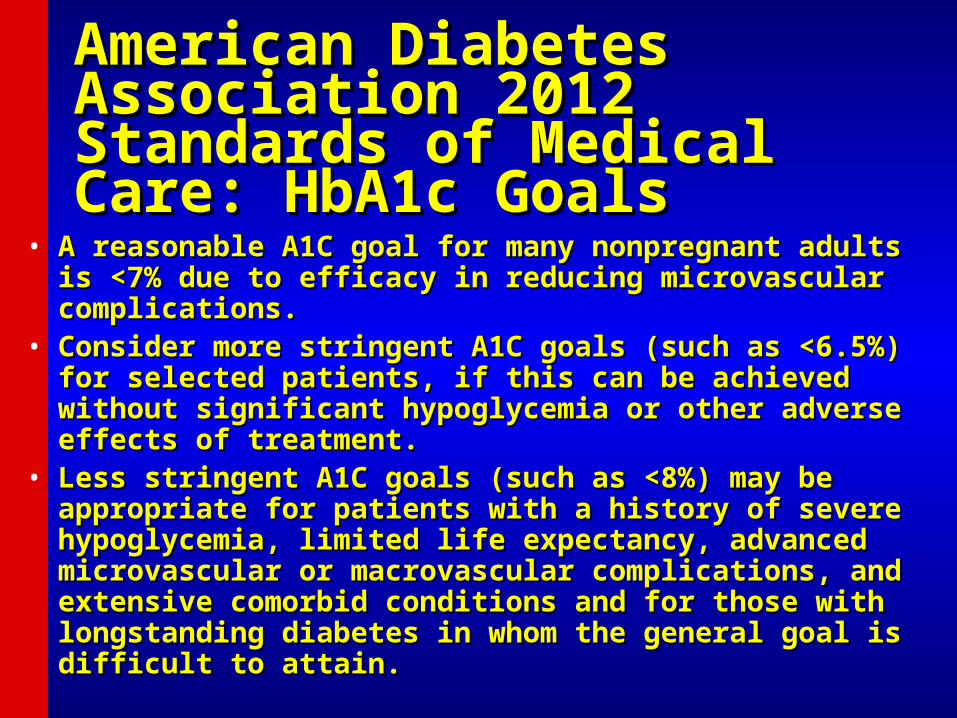
American Diabetes Association American Diabetes Association 2012 Standards of Medical Care: 2012 Standards of Medical Care: HbA1c GoalsHbA1c Goals
• A reasonable A1C goal for many nonpregnant adults is <7% A reasonable A1C goal for many nonpregnant adults is <7% due to efficacy in reducing microvascular complications.due to efficacy in reducing microvascular complications.
• Consider more stringent A1C goals (such as <6.5%) for Consider more stringent A1C goals (such as <6.5%) for selected patients, if this can be achieved without significant selected patients, if this can be achieved without significant hypoglycemia or other adverse effects of treatment. hypoglycemia or other adverse effects of treatment.
• Less stringent A1C goals (such as <8%) may be appropriate Less stringent A1C goals (such as <8%) may be appropriate for patients with a history of severe hypoglycemia, limited for patients with a history of severe hypoglycemia, limited life expectancy, advanced microvascular or macrovascular life expectancy, advanced microvascular or macrovascular complications, and extensive comorbid conditions and for complications, and extensive comorbid conditions and for those with longstanding diabetes in whom the general goal those with longstanding diabetes in whom the general goal is difficult to attain.is difficult to attain.

Diabetes Mellitus:Diabetes Mellitus:Effect of Blood Pressure ControlEffect of Blood Pressure Control
Action to Control Cardiovascular Risk in Diabetes (ACCORD) Blood Pressure Trial
Pat
ien
ts w
ith
Eve
nts
(%
)
0
5
10
15
20
Years Post-Randomization0 1 2 3 4 5 6 7 8
Pat
ien
ts w
ith
Eve
nts
(%
)
0
5
10
15
20
Years Post-Randomization0 1 2 3 4 5 6 7 8
Tota
l S
troke
HR=0.8895% CI (0.73-1.06)
HR=0.5995% CI (0.39-0.89)
4,733 diabetic patients randomized to intensive BP control (target SBP <120 mm Hg) or standard BP control (target SBP <140 mm Hg)
for 4.7 years
Intensive BP control in DM does not reduce a composite of adverse CV events, but does reduce the rate of stroke
Non
fata
l M
I,
non
fata
l str
oke,
or
CV
death
BP=Blood pressure, DM=Diabetes mellitus, HR=Hazard ratio, SBP=Systolic blood pressureACCORD study group. NEJM 2010

Recommendation #5Recommendation #5
5. In patients aged ≥18 years with diabetes, initiate 5. In patients aged ≥18 years with diabetes, initiate pharmacologic treatment at systolic BP ≥140mmHg or pharmacologic treatment at systolic BP ≥140mmHg or diastolic BP ≥90mmHg and treat to a goal systolic BP diastolic BP ≥90mmHg and treat to a goal systolic BP <140mmHg and goal diastolic BP <90mmHg. (Expert <140mmHg and goal diastolic BP <90mmHg. (Expert Opinion–Grade E)Opinion–Grade E)
For Adults with diabetes aim for the same BP goals as in the general
population
Treat if BP >140/90; Aim for <140/90
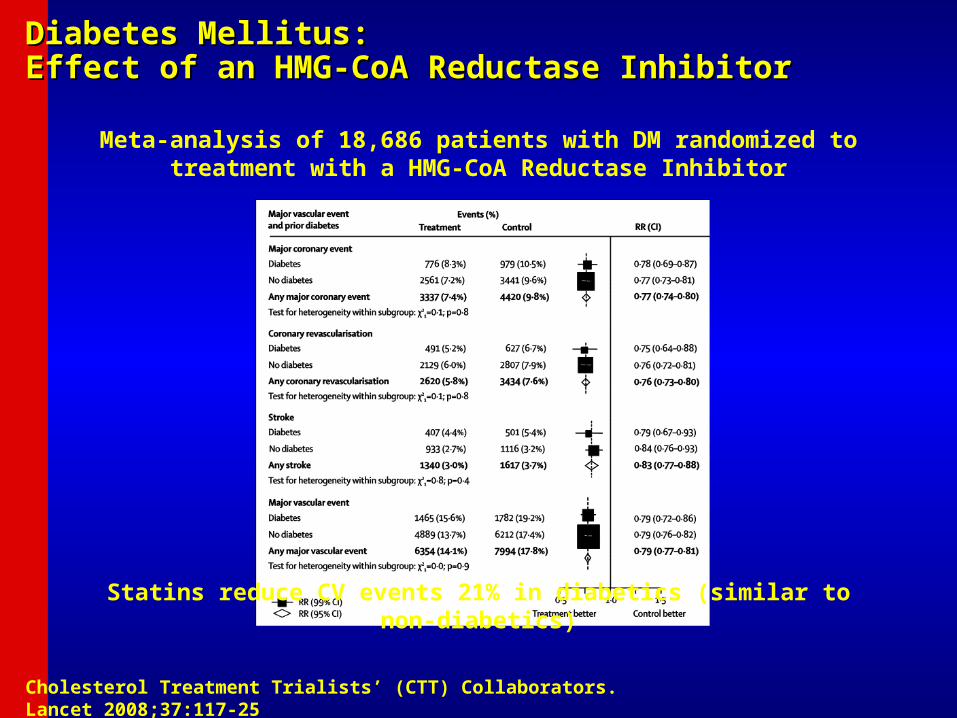
Diabetes Mellitus:Diabetes Mellitus:Effect of an HMG-CoA Reductase InhibitorEffect of an HMG-CoA Reductase Inhibitor
Cholesterol Treatment Trialists’ (CTT) Collaborators. Lancet 2008;37:117-25
Meta-analysis of 18,686 patients with DM randomized to treatment with a HMG-CoA Reductase Inhibitor
Statins reduce CV events 21% in diabetics (similar to non-diabetics)
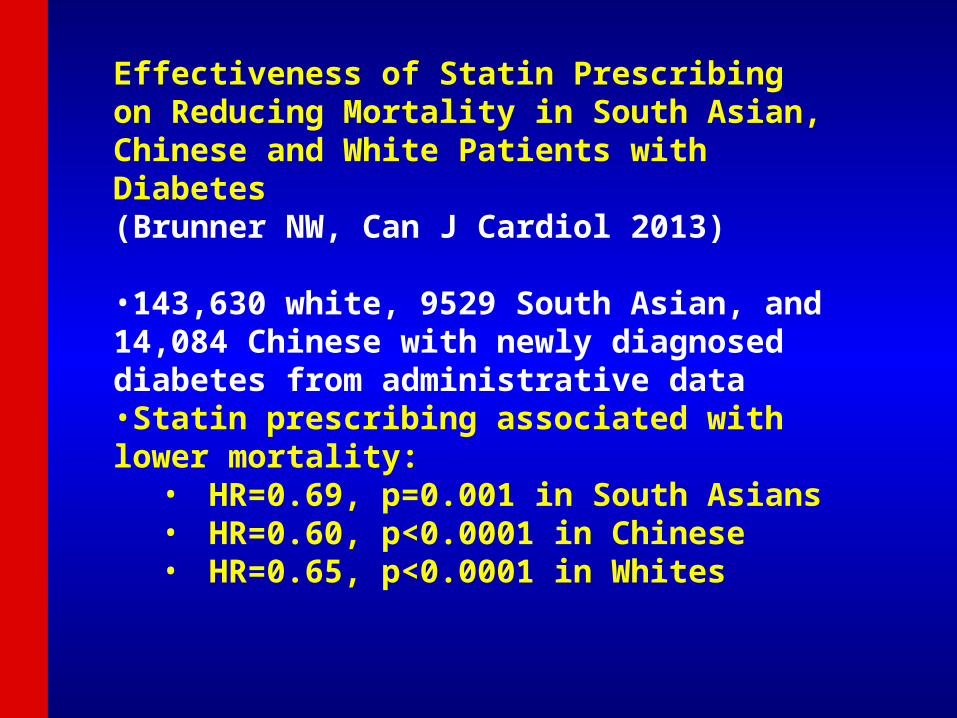
Effectiveness of Statin Prescribing on Reducing Mortality in South Asian, Chinese and White Patients with Diabetes (Brunner NW, Can J Cardiol 2013)
•143,630 white, 9529 South Asian, and 14,084 Chinese with newly diagnosed diabetes from administrative data•Statin prescribing associated with lower mortality:
• HR=0.69, p=0.001 in South Asians• HR=0.60, p<0.0001 in Chinese• HR=0.65, p<0.0001 in Whites


High, Moderate and Low Intensity Statin Dosages

AAPI CV Health Status: ObesityAAPI CV Health Status: Obesity• Obesity generally less common in Asians (9.3%) compared to Obesity generally less common in Asians (9.3%) compared to
other ethnic groups (27-41%) in 2011.other ethnic groups (27-41%) in 2011.
• Prevalence of obesity ranged from 4% in Chinese, 5% in Prevalence of obesity ranged from 4% in Chinese, 5% in
Vietnamese, 6% in Asian Indians, but 14% in Filipino adults.Vietnamese, 6% in Asian Indians, but 14% in Filipino adults.
• Native Hawaiians and Samoans are among the most obese Native Hawaiians and Samoans are among the most obese
people in the worldpeople in the world
• Molokai Heart Study (Native Hawaiians): 64% were obeseMolokai Heart Study (Native Hawaiians): 64% were obese

AAPI CV Health Status: Risk FactorsAAPI CV Health Status: Risk Factors
• BMI levels for selected Samoan population BMI levels for selected Samoan population
subgroups* subgroups*
Men (BMI)Men (BMI) Women (BMI) Women (BMI)
Western SamoanWestern Samoan 26 26 2828
Hawaii Hawaii 31 31 3333
CaliforniaCalifornia 35 35 34 34
American SamoaAmerican Samoa 30 30 3333* NOTE: BMI * NOTE: BMI >> 30 is obese; BMI of 25-29 is overweight 30 is obese; BMI of 25-29 is overweight
Obesity (cont.)

Prevalence estimates for poor and intermediate Prevalence estimates for poor and intermediate BMIBMI across California racial and ethnic groups across California racial and ethnic groups (California Health interview Survey 2009) (California Health interview Survey 2009)

DDiabetes iabetes PPrevention revention PProgram: rogram: Reduction in Diabetes Reduction in Diabetes IncidenceIncidence

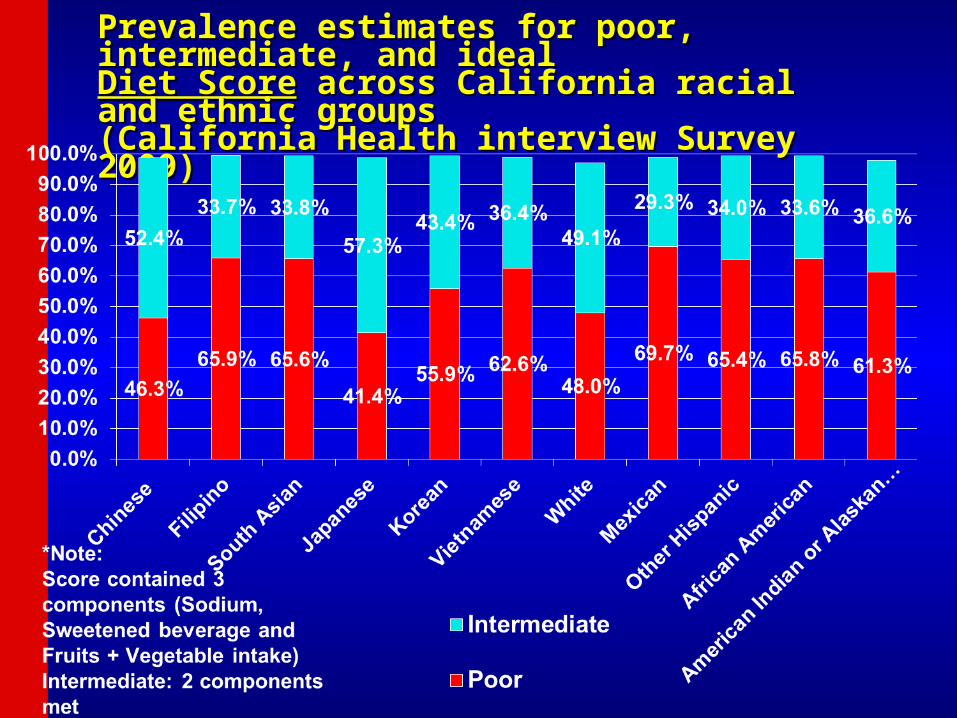
Prevalence estimates for poor, intermediate, and ideal Prevalence estimates for poor, intermediate, and ideal
Diet ScoreDiet Score across California racial and ethnic groups across California racial and ethnic groups (California Health interview Survey 2009)(California Health interview Survey 2009)
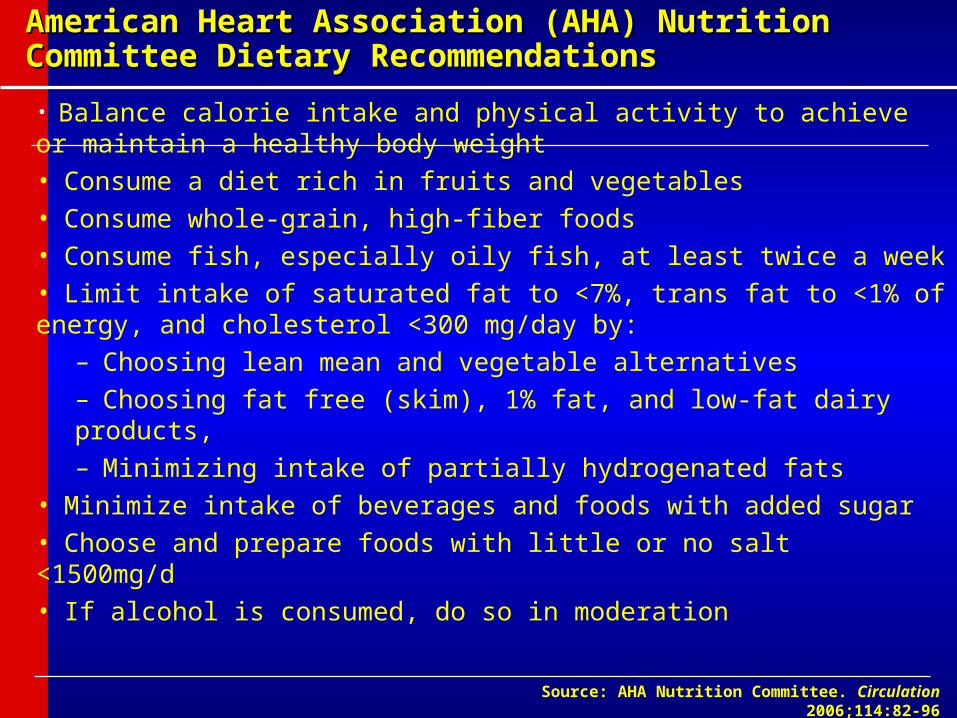
American Heart Association (AHA) Nutrition American Heart Association (AHA) Nutrition Committee Dietary RecommendationsCommittee Dietary Recommendations
• Balance calorie intake and physical activity to achieve or maintain a healthy body weight• Consume a diet rich in fruits and vegetables• Consume whole-grain, high-fiber foods• Consume fish, especially oily fish, at least twice a week• Limit intake of saturated fat to <7%, trans fat to <1% of energy, and cholesterol <300 mg/day by:
– Choosing lean mean and vegetable alternatives– Choosing fat free (skim), 1% fat, and low-fat dairy products,– Minimizing intake of partially hydrogenated fats
• Minimize intake of beverages and foods with added sugar• Choose and prepare foods with little or no salt <1500mg/d• If alcohol is consumed, do so in moderation
Source: AHA Nutrition Committee. Circulation 2006;114:82-96

Possible Benefits From Other Possible Benefits From Other TherapiesTherapies
Therapy Result
• Soluble fiber in diet (2–8 g/d) (oat bran, fruit, and vegetables)
• Soy protein (20–30 g/d)
• Stanol esters (1.5–4 g/d) (inhibit cholesterol absorption)
• Fish oils (3–9 g/d) (n-3 fatty acids)
LDL-C 1% to 10%
LDL-C 5% to 7%
LDL-C 10% to 15%
Triglycerides 25% to 35%
Jones PJ. Curr Atheroscler Rep. 1999;1:230-235.Lichtenstein AH. Curr Atheroscler Rep. 1999;1:210-214.Rambjor GS et al. Lipids. 1996;31:S45-S49.Ripsin CM et al. JAMA. 1992;267:3317-3325.

Dietary AdjunctsDietary Adjuncts• TLC for patients with LDL-C = 160TLC for patients with LDL-C = 160
Walden CE et al. Arterioscler Thromb Vasc Biol 1997;17:375-382.Jenkins DJ et al. Curr Opin Lipidol 2000;11:49-56.Cato N. Stanol meta-analysis. Personal communication, 2000.
Dietary ComponentDietary Component LDL-C LDL-C (mg/dL) (mg/dL)
Low saturated fat/dietary Low saturated fat/dietary cholesterolcholesterol ––1212
Viscous fiber (10–25 g/d)Viscous fiber (10–25 g/d) – –88
Plant stanols/sterols (2 g/d)Plant stanols/sterols (2 g/d) ––1616
TotalTotal – –36 mg/dl36 mg/dl
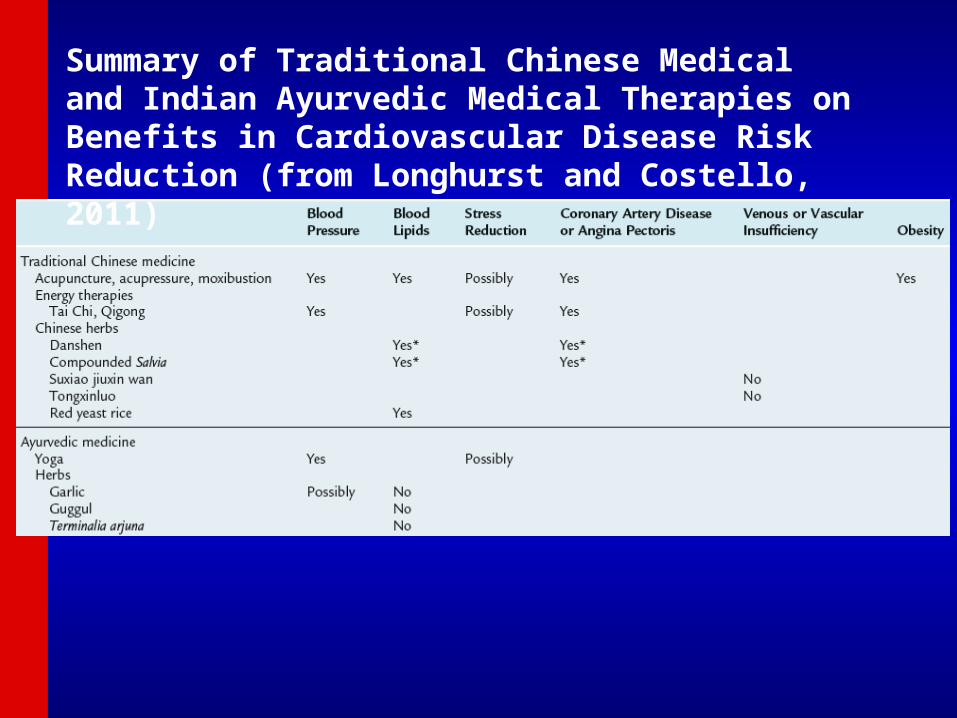
Summary of Traditional Chinese Medical and Indian Ayurvedic Medical Therapies on Benefits in Cardiovascular Disease Risk Reduction (from Longhurst and Costello, 2011)

Effect of Xuezhikang, an Extract from Read east Effect of Xuezhikang, an Extract from Read east Chinese Rice on CHD Events in 4870 Chinese Adults Chinese Rice on CHD Events in 4870 Chinese Adults with Prior Myocardial Infarction (Lu Z et al., Am J with Prior Myocardial Infarction (Lu Z et al., Am J Cardiol 2008) Cardiol 2008)
Frequency of CHD events 10.4% in placebo vs. 5.7% in XZK groups, for a 4.7% absolute and 45% relative risk reduction. CV and total mortality also reduced 30% and 33%. LDL-C reduced 17.6%, HDL-C increased 4.2%.
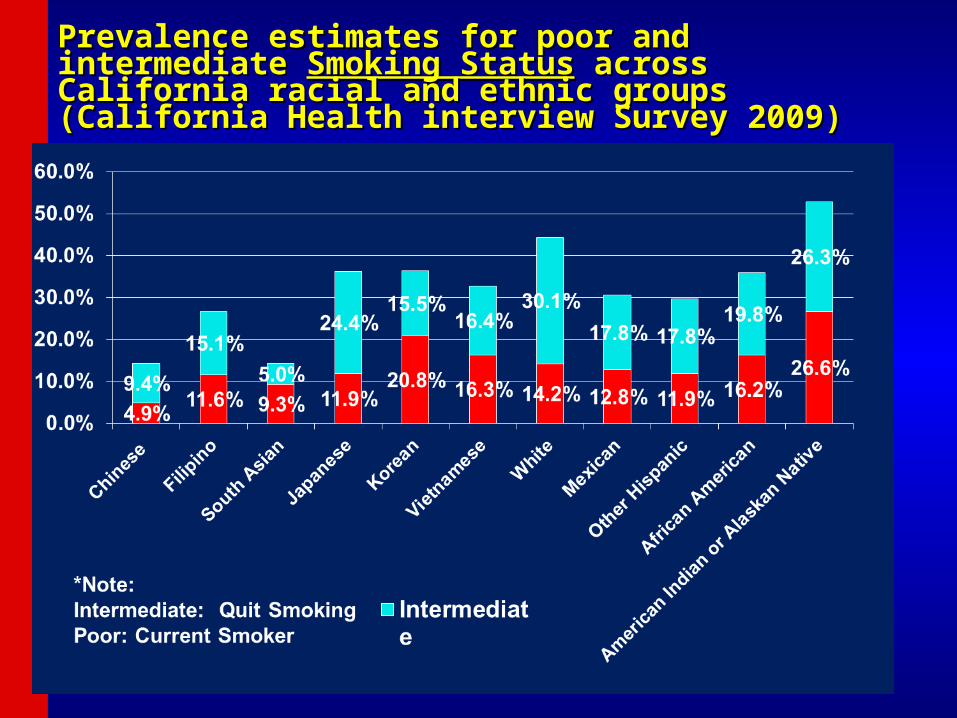
Prevalence estimates for poor and intermediate Prevalence estimates for poor and intermediate Smoking Smoking StatusStatus across California racial and ethnic groups across California racial and ethnic groups (California Health interview Survey 2009) (California Health interview Survey 2009)

AAPI CV Health Status: Cigarette AAPI CV Health Status: Cigarette SmokingSmoking
• 9.6% of Asian adults are smokers; Korean adults 9.6% of Asian adults are smokers; Korean adults more likely to be current smokers (22%) than more likely to be current smokers (22%) than Japanese (12%), Asian Indian (7%) or Chinese Japanese (12%), Asian Indian (7%) or Chinese (7%) adults.(7%) adults.
• Highest rates among Southeast AsiansHighest rates among Southeast Asians
• Southeast Asian males start smoking early in lifeSoutheast Asian males start smoking early in life
• High tobacco use among Korean men in CaliforniaHigh tobacco use among Korean men in California
Recommendations:Recommendations:Smoking CessationSmoking Cessation
• Advise all patients not to smoke or use Advise all patients not to smoke or use tobacco products (A)tobacco products (A)
• Include smoking cessation counseling and Include smoking cessation counseling and other forms of treatment as a routine other forms of treatment as a routine component of diabetes care (B)component of diabetes care (B)
ADA. VI. Prevention, Management of Complications. Diabetes Care 2013;36(suppl 1):S34.

AAPI CV Health Status: Risk AAPI CV Health Status: Risk FactorsFactors
• In 2011, only 16.7% of Asian adults met the 2008 In 2011, only 16.7% of Asian adults met the 2008 Federal Physical Activity GuidelinesFederal Physical Activity Guidelines
• AAPIs engage in less physical activity compared AAPIs engage in less physical activity compared to the general populationto the general population
• Korean Americans in California are less likely to Korean Americans in California are less likely to exercise than the general Californian populationexercise than the general Californian population
Physical Inactivity
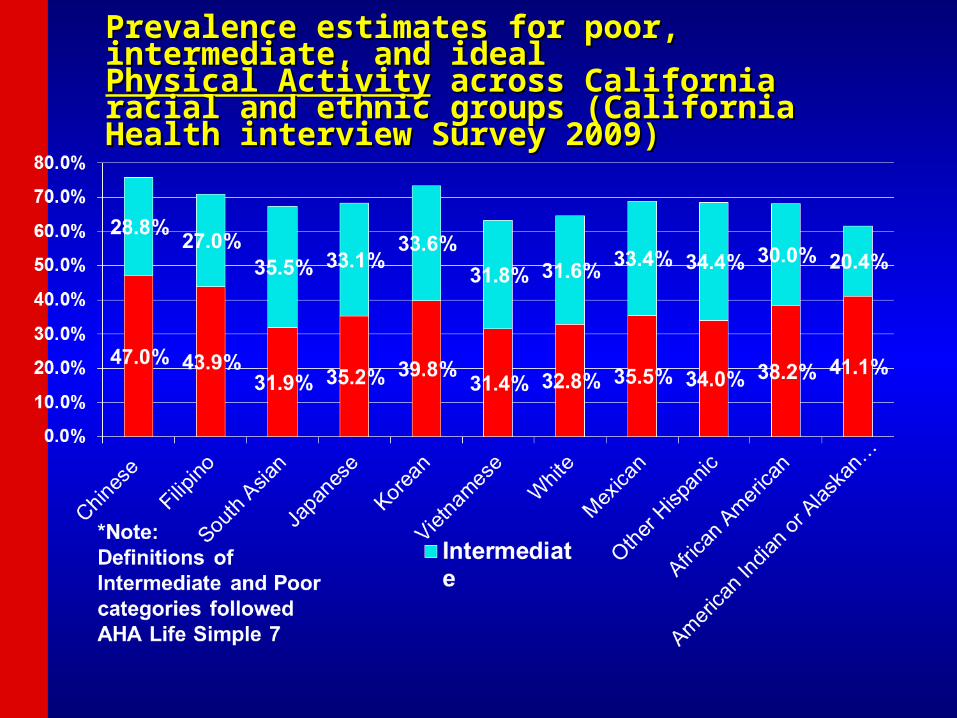
Prevalence estimates for poor, intermediate, and ideal Prevalence estimates for poor, intermediate, and ideal Physical ActivityPhysical Activity across California racial and ethnic across California racial and ethnic groups (California Health interview Survey 2009) groups (California Health interview Survey 2009)
Recommendations: Physical ActivityRecommendations: Physical Activity
• Advise people with or without diabetes to Advise people with or without diabetes to perform at least 150 min/week of moderate-perform at least 150 min/week of moderate-intensity aerobic physical activity (50intensity aerobic physical activity (50––70% of 70% of maximum heart rate), spread over at least 3 maximum heart rate), spread over at least 3 days per week with no more thandays per week with no more than2 consecutive days without exercise (A)2 consecutive days without exercise (A)
• In absence of contraindications, adults with In absence of contraindications, adults with type 2 diabetes should be encouraged to type 2 diabetes should be encouraged to perform resistance training at least twice per perform resistance training at least twice per week (A)week (A)
ADA. V. Diabetes Care. Diabetes Care 2013;36(suppl 1):S24.

RCT Trial Assessment of Pedometer RCT Trial Assessment of Pedometer InterventionsInterventions
Bravata, DM et al. JAMA 2007; 298:2296-2304
N=277; 8 TrialsPedometer increased steps by 2500/day

Percent of CHD Events Over 10 Years Prevented in US Adults Percent of CHD Events Over 10 Years Prevented in US Adults with T2DM, According to Individual and Composite Risk Factor with T2DM, According to Individual and Composite Risk Factor Control (Wong ND, et al., Am J Cardiol 2014)Control (Wong ND, et al., Am J Cardiol 2014)
0
10
20
30
40
50
60
HbA1cSystolic Blood PressureTotal CholesterolHDL CholesterolAll Risk Factors
5.1 4.8
18.5
5.1
30.6
Prop
ortio
n of
Eve
nts
Prev
ente
d (%
)Nominal
Goal
Aggressive
Population vs. High-Risk Population vs. High-Risk ApproachApproach
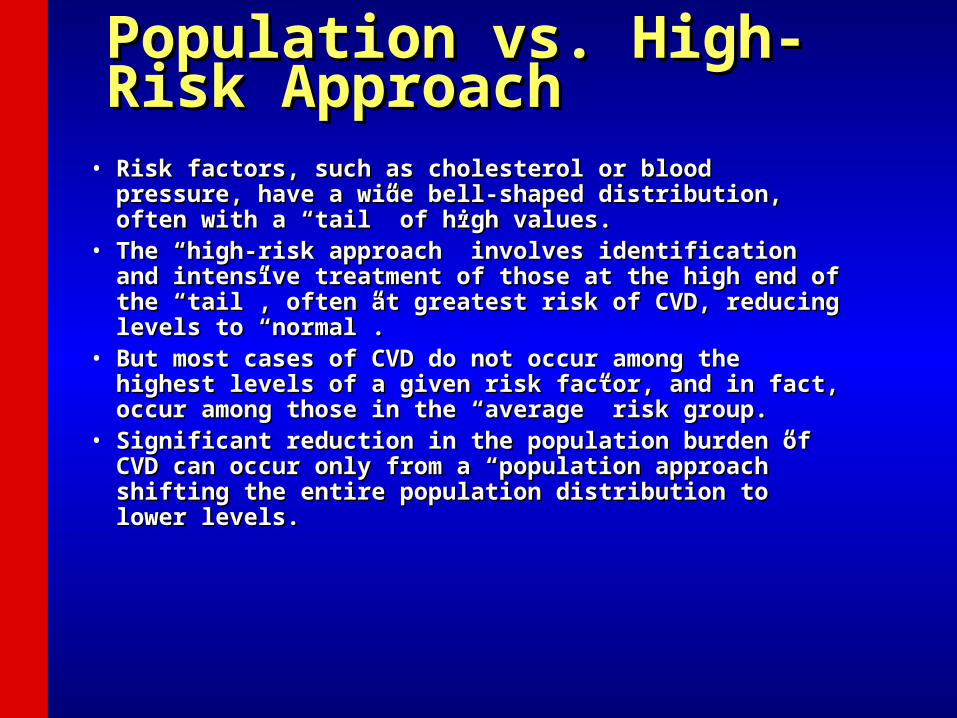
• Risk factors, such as cholesterol or blood pressure, have Risk factors, such as cholesterol or blood pressure, have a wide bell-shaped distribution, often with a “tail” of high a wide bell-shaped distribution, often with a “tail” of high values.values.
• The “high-risk approach” involves identification and The “high-risk approach” involves identification and intensive treatment of those at the high end of the “tail”, intensive treatment of those at the high end of the “tail”, often at greatest risk of CVD, reducing levels to often at greatest risk of CVD, reducing levels to “normal”.“normal”.
• But most cases of CVD do not occur among the highest But most cases of CVD do not occur among the highest levels of a given risk factor, and in fact, occur among levels of a given risk factor, and in fact, occur among those in the “average” risk group.those in the “average” risk group.
• Significant reduction in the population burden of CVD Significant reduction in the population burden of CVD can occur only from a “population approach” shifting the can occur only from a “population approach” shifting the entire population distribution to lower levels.entire population distribution to lower levels.
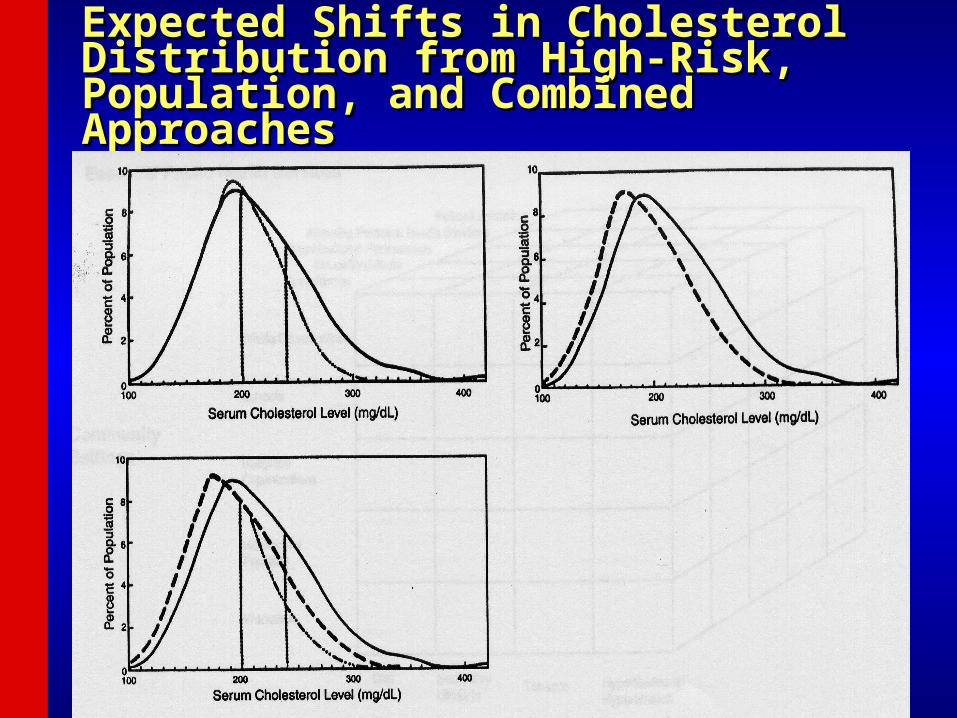
Expected Shifts in Cholesterol Distribution Expected Shifts in Cholesterol Distribution from High-Risk, Population, and from High-Risk, Population, and Combined ApproachesCombined Approaches

Population and Community-Population and Community-Wide CVD Risk Reduction Wide CVD Risk Reduction ApproachesApproaches
• Populations with high rates of CVD are those with Populations with high rates of CVD are those with Western lifestyles of high-fat diets, physical inactivity, Western lifestyles of high-fat diets, physical inactivity, and tobacco use.and tobacco use.
• Targets of a population-wide approach must be these Targets of a population-wide approach must be these behaviors causative of the physiologic risk factors or behaviors causative of the physiologic risk factors or directly causative of CVD.directly causative of CVD.
• Requires public health services such as surveillance Requires public health services such as surveillance (e.g.,BFRSS), education (AHA, NCEP), organizational (e.g.,BFRSS), education (AHA, NCEP), organizational partnerships (Singapore Declaration), and partnerships (Singapore Declaration), and legislation/policy (Anti-Tobacco policies)legislation/policy (Anti-Tobacco policies)
• Activities in a variety of community settings: schools, Activities in a variety of community settings: schools, worksites, churches, healthcare facilities, entire worksites, churches, healthcare facilities, entire communitiescommunities

A conceptual framework for public A conceptual framework for public health practice in CVD prevention. health practice in CVD prevention. (From Pearson et al., (From Pearson et al., J Public HealthJ Public Health. 2001; 29:69 –78) . 2001; 29:69 –78)

Communitywide CVD Communitywide CVD Prevention ProgramsPrevention Programs
• Stanford 3-Community Study (1972-75) Stanford 3-Community Study (1972-75) showed mass media vs. no intervention in showed mass media vs. no intervention in high-risk residents to result in 23% reduction high-risk residents to result in 23% reduction in CHD risk scorein CHD risk score
• North Karelia (1972-) showed public education North Karelia (1972-) showed public education campaign to reduce smoking, fat campaign to reduce smoking, fat consumption, blood pressure, and cholesterolconsumption, blood pressure, and cholesterol
• Stanford 5-City Project (1980-86) showed Stanford 5-City Project (1980-86) showed reductions in smoking, cholesterol, BP, and reductions in smoking, cholesterol, BP, and CHD riskCHD risk
• Minnesota Heart Health Program (1980-88) Minnesota Heart Health Program (1980-88) showed some increases in physical activity showed some increases in physical activity and in women reductions in smokingand in women reductions in smoking

Materials Developed for US Materials Developed for US Community Intervention Community Intervention TrialsTrials
• Mass media, brochures and direct mailMass media, brochures and direct mail• Events and contestsEvents and contests• ScreeningsScreenings• Group and direct educationGroup and direct education• School programs and worksite interventionsSchool programs and worksite interventions• Physician and medical setting programsPhysician and medical setting programs• Grocery store and restaurant projectsGrocery store and restaurant projects• Church interventionsChurch interventions• PoliciesPolicies

My Life Check Assessment

My Life Check AssessmentMy Life Check Assessment

My Life Check AssessmentMy Life Check Assessment

Age-standardized prevalence for poor, intermediate and ideal cardiovascular health for each of the 7 metrics of cardiovascular health in the AHA 2020 goals, among US adults >20 years of age, NHANES 2007-
2008
©2011 American Heart Association, Inc. All rights reserved. Roger VL et al. Published online in Circulation Dec. 15, 2011

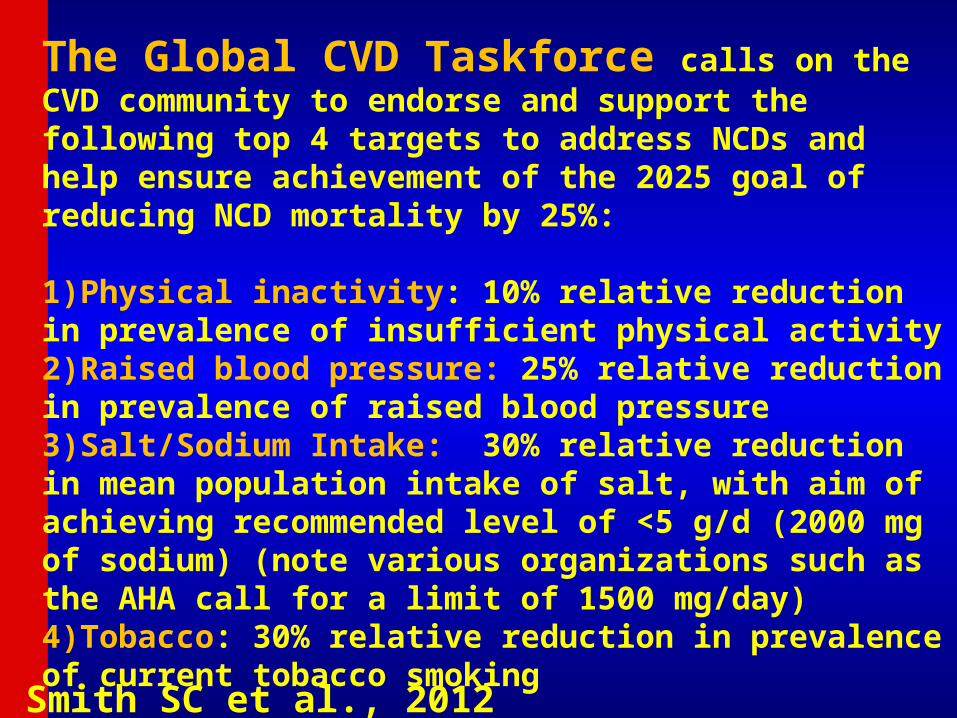
The Global CVD Taskforce calls on the CVD community to endorse and support the following top 4 targets to address NCDs and help ensure achievement of the 2025 goal of reducing NCD mortality by 25%:
1)Physical inactivity: 10% relative reduction in prevalence of insufficient physical activity2)Raised blood pressure: 25% relative reduction in prevalence of raised blood pressure3)Salt/Sodium Intake: 30% relative reduction in mean population intake of salt, with aim of achieving recommended level of <5 g/d (2000 mg of sodium) (note various organizations such as the AHA call for a limit of 1500 mg/day)4)Tobacco: 30% relative reduction in prevalence of current tobacco smoking
Smith SC et al., 2012
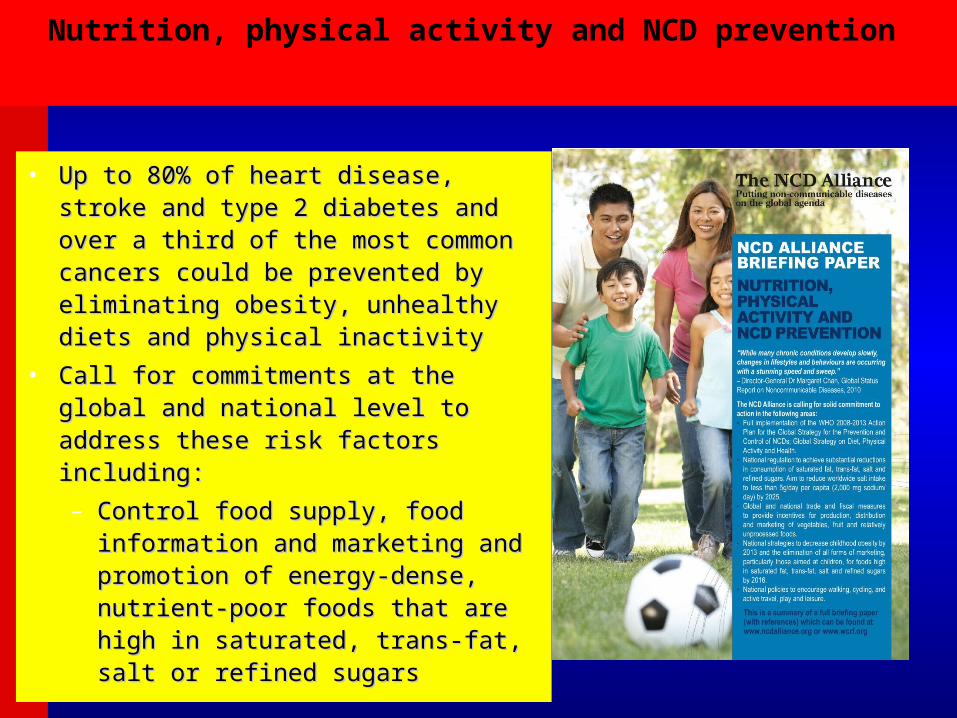
• Up to 80% of heart disease, stroke Up to 80% of heart disease, stroke and type 2 diabetes and over a and type 2 diabetes and over a third of the most common cancers third of the most common cancers could be prevented by eliminating could be prevented by eliminating obesity, unhealthy diets and obesity, unhealthy diets and physical inactivityphysical inactivity
• Call for commitments at the global Call for commitments at the global and national level to address these and national level to address these risk factors including:risk factors including:
– Control food supply, food Control food supply, food information and marketing and information and marketing and promotion of energy-dense, promotion of energy-dense, nutrient-poor foods that are nutrient-poor foods that are high in saturated, trans-fat, salt high in saturated, trans-fat, salt or refined sugarsor refined sugars
Nutrition, physical activity and NCD prevention

Braunwald’s Preventive Cardiology Now Available
Join the ASPC at Join the ASPC at www.aspconline.orgwww.aspconline.org
www.heart.uci.eduwww.heart.uci.edu