global defense perspectives 2017 - … global defense perspectives 2017 ... 5 4 3 2 1 0 the 2017...
TRANSCRIPT

Global Defense Perspectives 2017Updating the Map of Defense Prioritization and Posture in a Challenging World
www.pwc.com
November 2017
2 Global Defense Perspectives 2017
Foreword 1
The 2017 Global Defense Map 2
Significant Shifts on the Global Defense Map 6
Top 5 Defense Prioritization Growers 6
Top 5 Defense Prioritization Decliners 8
Top 5 Security Posture Growers 10
Top 5 Security Posture Decliners 12
Special Focus Area: NATO 14
Special Focus Area: South Central Asia and the Pacific Rim 16
Conclusion 18
Authors 18
Appendix: Approach 19
Defense Prioritization 19
Ratings by Nation 20
Security Posture 22
Ratings by Nation 24
Endnotes 26
Contents

1Updating the Map of Defense Prioritization and Posture in a Challenging World
Foreword
In this new edition, PwC has retained the broad, but helpfully descriptive, intellectual framework for explaining why states spend as they do on defense, and has both sought to explain changes and to graphically depict the movements of the states in relation to each other and to their respective positions in 2015. The result points to important developments. The reader would be well served to closely study the graphics to absorb the shifts of key states in response to changes in the overall strategic environment and economic forces. To that extent, I fully endorse PwC’s analysis of the causal factors of change, and from that analysis offer the following observations:
US/RussiaIt is often lost on observers of international relations the stark differences in the magnitude of the defense spend by the United States versus Russia. While the two are barely comparable, graphically, Russia is on the move within its capabilities, and is exploiting both a perceived absence of political will by the US, and of military capability by NATO. As this edition points out, the Trump presidential campaign promised increased defense spending, and implied an increased will. How this will graphically affect the US/Russia positions will be illuminating.
NATO and regional partnersThis edition of Global Defense Perspectives captures well the challenges NATO faces as it seeks to adapt to the complexities of its relationship with Russia, and an unstable southern flank, as well as achieve its spending commitment by the member states of 2 percent of GDP, so reversing a trend of constrained defense spending. This is all the more important to NATO as the vital Atlantic Alliance comes into a new relationship with the US administration.
Middle EastIn the aftermath of the Arab Spring, the regional civil wars, the persistent Saudi/Iranian “cold war”, growing tensions within the Gulf Cooperation Council, and the broad collapse of oil prices, countries of the region are spending differently. While the long-term outcomes may not be specifically evident, just the behavioral differences may carry significant implications for the region.
�South�Central�Asia�and�the�Pacific RimThis revision accurately identifies a megatrend in that spending on defense has increased in Asia and the Pacific Rim as a direct result of the enormous migration of economic power from West to East over the last fifty years, as demonstrated by the growth of the Chinese and Indian economies, and overall steadiness of Asian economies generally. Even so, there are real tensions associated with China’s continued rise, North Korea’s belligerence, and the spread of Salafi extremism. All of these have affected defense spending and behaviour.
In closing, the 2017 Global Defense Perspectives provides very important insights. PwC has provided a framework for thinking about these issues on defense, which, given the rapidly changing security and economic environments, signals important characteristics and behaviors of spending. Readers should view PwC’s work on megatrends as the global shaping influences of the future, “Agile Defense” as the means for states to remain relevant in allocating defense resources, and this report as the depiction of how states are reacting to security and economic forces.
In updating and reissuing its Global Defense Perspectives, PwC provides an important revision to its report on the defense spending behavior of a broad swathe of nations. The 2017 edition joins PwC’s excellent existing work on Agilityi and the Global Megatrendsii in setting the basis for understanding the present and future strategic defense environments, what imperatives states must consider to be competitive, and how they are trending.
John R. Allen
General, U.S. Marine Corps, (Ret.) Senior Strategic Advisor to PwC
i. https://www.pwc.com/gx/en/industries/government-public-services/public-sector-research-centre/publications/agile-defense.html
ii. https://www.pwc.com/gx/en/industries/government-public-services/public-sector-research-centre/publications/five-megatrends. html

2 Global Defense Perspectives 2017
The 2017 Global Defense Map
Recent global events have further complicated an already complex global defense environment. Whether new or old, the tensions and conflicts that define the world today are increasingly transnational in impact and involve a diverse set of state and non-state actors including criminal networks. Additionally, the nature of what defines today’s battlespace is evolving rapidly as cyber criminality and information warfare are increasingly leveraged as disruptive tools for nefarious cyber activities that target individuals, governments, and commercial entities. These developments have raised international tension, and, ultimately, increased the risk of military confrontation.
These wide-ranging security challenges leave defense leaders with tough choices. To better evaluate and understand these choices and the implications for global security, PwC has developed a new framework to assess nations against two primary parameters:
How they prioritize defense spending.
1How they position or ‘posture’ themselves in the global security environment.
2

3Updating the Map of Defense Prioritization and Posture in a Challenging World
We first introduced this framework in 2015 in our paper entitled Global Defense Perspectives. This update to that original paper illustrates how and why the nations on the map have shifted their positions over the last two years, and provides insight into the prospective shifts that we can anticipate in the future.
In our original work, mapping nations on the basis of defense prioritization vs. security posture resulted in a visualization tool that clearly defined six unique defense archetypes or profiles. The dividing lines for prioritization as a percentage of GDP were not predetermined, but rather depended on what the actual mapping of this data appeared to suggest as logical breakpoints as follows:
//
Secu
rity
Po
stu
tre
Defense Prioritization (2016 Defense Spend % GDP)
0.0% 0.5% 1.5% 2.5%1.0% 2.0% 3.0% 3.5% 4% 5% 6% 7% 8% 9% 10% 11% 17%
12
11
10
9
8
7
6
5
4
3
2
1
0
Global Power ProjectorsSpend greater than 3% of their GDP on defense and are very engaged in security efforts around the world. These nations seek to use their military capabilities and security posture to influence global security issues. Their defense organizations are very large and mature. Although not necessarily nimble, these organizations are capable of deploying forces, managing large complex procurements and conducting operations around the world.
Robust Self-DefendersSpend greater than 3% of their GDP on defense, but are more focused on security efforts in their immediate geographic region. Because of internal or immediate regional threats, these nations have developed military capabilities centered on directly and aggressively countering those challenges. They generally do not get involved in UN or multilateral coalition operations except when addressing nearby security concerns.
Coalition PartnersSpend less than 1.5% of their GDP on defense, but they are very engaged in security efforts around the world. While these nations have modest defense budgets, they readily contribute to United Nations peacekeeping and multilateral coalition operations around the world.
Constrained Force ProjectorsSpend between 1.5% and 3% of their GDP on defense and are engaged in security efforts around the world. They all either play leading roles in coalition operations, conduct a significant amount of international arms transfers, or both.
Threat-Focused Self-DefendersSpend between 1.5% and 3% of their GDP on defense and are more focused on security efforts in their immediate geographic area. Many of these nations participate in UN peacekeeping or multilateral coalition operations to help build relationships with allies and partners, but the focus of their spending is on countering specific threats to their national interests.
Territorial Security SeekersSpend less than 1.5% of their GDP on defense and are more focused on security efforts in their immediate geographic area. These nations spend modestly on defense, but many contribute to UN peacekeeping operations or multilateral coalition operations in some fashion.
These archetypes or profiles represent six distinct “segments” in which nations choose to “participate” within the defense and security environment with which they are faced. The resultant Global Defense Map provides a useful tool to better understand this complex environment and identify meaningful insights and trends over time (see Figure 1).
In this year’s report, we assess 71 nations and regions and focus analysis on those with the biggest shifts in defense prioritization and security posture or, in other words, those with the biggest movement on the map. The nations assessed in this report include the world’s top 50 defense-spending nations according to the Stockholm International Peace Research Institute (SIPRI) and a group of 21 additional nations selected for their global or regional significance regardless of defense expenditure (such as Syria, NATO nations and Jordan ).

4 Global Defense Perspectives 2017
China
UK France
Russia
USA
NorwaySouthAfrica
EgyptCroatia
Malaysia
Thailand
Angola
Turkey
PolandIndonesia
Philippines
Venezuela
Mexico
Canada
Spain
Sweden
New Zealand
Qatar
Chile Singapore
Kuwait
Algeria
Estonia
SouthKorea
Bahrain
UAE
Israel
Oman
Australia
Finland
Denmark
Lithuania
Latvia
The Netherlands
Belgium
Switzerland
Austria
Syria
Italy
Brazil
Germany
Ukraine
SaudiArabia
India
Argentina
Greece
Vietnam
Taiwan
Iran
Pakistan
IraqPortugal
Morocco
Colombia
Luxembourg
Iceland
CzechRepublic
SloveniaHungary
SlovakiaRomania
Bulgaria
Montenegro
Albania
Jordan
Japan
Defense Prioritization • How much does the country spend: total and % GDP?• Recent trends and expected future vector: upward, flat or down?
Security Posture • Does the country have a global, regional or domestic security orientation?
Notes:Bubble size = 2016 total defense spend
2012-16 Growth <0
2012-16 Growth 0-1%
2012-16 Growth >1%
//Territorial Security Seekers Threat-Focused Self-Defenders
Coalition Partners Constrained Force Projectors
Do
mes
tic
Reg
ion
al
Glo
ba
l
Secu
rity
Po
stu
re
Defense Prioritization (2016 Defense Spend % GDP)
Robust Self-Defenders
Global Power Projectors
0.0% 0.5% 1.5% 2.5%1.0% 2.0% 3.0% 3.5% 4% 5% 6% 7% 8% 9% 10%11% 17%
12
11
10
9
8
7
6
5
4
3
2
1
0
The 2017 Global Defense Map visually demonstrates some important trends and shifts that are driving defense spending and regional/global assertiveness of defense forces around the world. While the focus of this report is on those nations who made the most significant shifts on the map, some broader insights and themes are discussed below whose relevance extends to all nations regardless of where, or if, they moved at all.
In our previous report we observed that going forward several themes would persist in the coming years:
• Expect movement on the Map• Global players under severe pressure• Cost-Cutting dominating strategy• A focus on institutional and
national capacity• Collaboration in procurement• Asymmetric threats and cyber
“insecurity” gaining prominence
Sources: SIPRI, Teal Group International Defense Briefing, The Military Balance, IHS Defense Budgets, PwC analysis.
Figure 1: 2017 Global Defense Map
Security Posture• Does the country have a
global, regional or domestic security orientation?
Defense Prioritization• How much does the country
spend: total and % GDP?• Recent trends and expected
future vector: upward, flat or down?

5Updating the Map of Defense Prioritization and Posture in a Challenging World
We believe these themes will continue to be relevant in the coming years, but our analysis of more recent events and data support an expansion of this initial list to include these additional observations:
Movement�on�the�Map�will�continue From 2014 to 2016, 8 of the 61 nations, or 13 percent, assessed in our last report changed archetypes or segments on the map. There is a tremendous amount of growth in the lower half of the Map where many of the 59 nations have seen significant recent growth that is expected to continue over the next five years. But this raises important questions: how might countries like India, Japan and Poland, for example, make efforts to increase their global security posture and move into the upper half of the Map over time? Conversely, persisting limitations on the Constrained Force Projectors may drive a shift down and left on the map for several nations in this category.
Defense budgets squeezed by contracting�economies�and�falling�oil prices Since 2014, the collapse in oil markets caused drastic economic contractions in oil-dependent nations forcing many of these nations to significantly curtail defense spending. Of the 15 countries with the largest decreases in defense spending in 2016 only 2 countries are not oil exporters.1 If there is not a substantial recovery in the oil markets in the coming years, oil-reliant nations such as Saudi Arabia will face a budget squeeze which could make it difficult to sustain or grow current levels of defense spending.
Rising geopolitical tensions fueling a major�increase�in�global�arms�sales From 2012 to 2016, global arms transfers reached their highest volume for any 5 year period since the end of the Cold War.2 The global demand for arms is strong due to a multitude of global conflicts and potential flash points compelling nations to bolster their defenses. Maturing militaries are looking to expand capability and capacity while many developed militaries in the West are playing catch up after deferring capital investment and modernization in defense during the so-called post-Cold War “peace dividend.” Looking forward, to meet the global demand for arms it is likely that nations such as China and India will increasingly challenge the traditional arms supplier duopoly of the United States and Russia, which combined supplied 56 percent of the arms exports from 2012 to 2016.3
NATO�nations�are�committed,�but�struggling,�to�meet�the�2�percent�guideline In order to address negative defense spending trends and achieve more equitable burden sharing amongst its membership, NATO formally adopted in the 2014 Wales Summit Declaration a goal that each of its members spend at least 2 percent of its GDP on defense.4 In 2016, only 4 of 29 NATO nations, or 14 percent, met the 2 percent guideline and 20 of 29 nations spent less in real dollars on defense in 2016 than in 2014.5 If the costs of maintaining the NATO Alliance continue to be carried by a select few nations, the long term viability of this crucial collective security alliance may come under threat.
United States defense spending returns�to�growth In 2016, the United States increased its defense spending by 1.7 percent to $611 billion.6 This increase likely signals the end of a trend of decreases in defense spending driven by sequestration and the drawdowns in Iraq and Afghanistan. The Trump Administration campaigned on a strong commitment to increase defense spending and it is likely that defense spending will continue on a positive trend over the next five years.
Five�Global�Megatrends�will�have�significant�impact Global megatrends are macroeconomic and geostrategic forces that are shaping our world, and our collective futures, in profound ways. The five key megatrends – The Shift in Global Economic Power from West to East, Demographic Changes, Rapid Urbanization, Rise of Technology and Climate Change/Resource Scarcity – will have profound effects on defense and security. This is particularly the case in lesser developed areas of the world where the megatrends will contribute to instability and pose more broad and complex internal, and external, defense and security challenges.

6 Global Defense Perspectives 2017
Significant Shifts on the Global Defense Map
We look in turn at the countries with the biggest changes in defense prioritization/posture across our Map.
Figure 2: Top 5 Defense Prioritization Growers
The five countries with the largest increases in defense prioritization are: Oman, Kuwait, Iraq, Algeria, and Ukraine (see Figure 2 and Table 1). All five of these countries have been characterized as Robust Self-Defenders that historically prioritize defense spending and currently face destabilizing conflict either within or near their territorial borders.
Kuwait
Kuwait
AlgeriaAlgeria
OmanOman
UkraineUkraine
Iraq
Iraq
Notes:Country bubble size = 2014 total defense spend
2012-16 Growth <0
2012-16 Growth 0-1%
2012-16 Growth >1%
Secu
rity
Po
stu
re
Defense Prioritization (Defense Spend % GDP)
Robust Self-Defenders
3.0% 3.5% 4% 5% 6% 7% 8% 9% 10%11% 17%
5
4
3
2
1
0
CoalitionPartners
TerritorialSecuritySeekers
ConstrainedForce
Projectors
Threat-Focused
Self-Defenders
Global Power Projectors
Robust Self-
Defenders
Notes:Bubble size = 2016 total defense spend
2012-16 Growth <0
2012-16 Growth 0-1%
Lighter shades and italics indicate positions in 2014
2012-16 Growth >1%
Top 5 Defense Prioritization Growers
Sources: SIPRI, IISS The Military Balance, IHS Janes Defense Budgets, and PwC analysis

7Updating the Map of Defense Prioritization and Posture in a Challenging World
Table 1: Top 5 Defense Prioritization Growers7
Nation Defense Prioritization Defense Spend
2014 2016 Basis Point Change8
2014 2016 Percent Change
2012-2016 Defense Spend CAGR
Oman9 13.4% 16.8% +340 $11.0 $9.1 -16.9% -5.9%
Kuwait 3.6% 6.5% +290 $5.8 $6.6 12.5% 2.0%
Iraq10 3.6% 4.8% +130 $6.9 $6.2 -9.9% 8.5%
Algeria 5.5% 6.7% +110 $9.7 $10.2 5.1% 1.8%
Ukraine11 3.0% 3.8% +80 $4.0 $3.4 -15.1% -3.7%
While each country significantly increased defense spending as a percentage of GDP from 2014 to 2016, this occurred in conjunction with major economic challenges driven by war, the collapse in global oil markets, or both.
Despite the difficult economic conditions, the challenging security situation faced by these countries highlighted the need to maintain a strong national defense. In the case of Ukraine, specific challenges to its territorial integrity have led to a deterioration of its relationship with Russia. The loss of Crimea in 2014 and continuing challenges from separatist elements within its borders have put a significant strain on defense resources.
The economic costs of the conflict have been devastating; since 2012, the Ukrainian economy has contracted by nearly half.14 Despite this severe economic contraction, it is likely that Ukraine will maintain or increase its level of defense spending over the next five years. Some of this increase will come in the form of international security assistance funding.
Oman, Kuwait, Iraq and Algeria face a more diverse set of security challenges in the Middle East North Africa (MENA) region, including the rise of the Islamic State of Iraq and Syria (ISIS) and its North African affiliates, the Syrian civil war and corresponding refugee crisis, and the war in Yemen.
Given the security situation facing these five nations, the building or, at the very least, sustainance of robust defense capabilities is a natural priority, even in the face of economic headwinds. While each of these five nations faces its own unique challenges, all of them have clearly prioritized defense as a vital tool of the state. From 2014 to 2016, these nations made the world’s largest gains in percent of GDP spent on defense.
As long as the epicentre of global conflict continues to be in the Middle East, it is likely that the world’s top defense prioritization growers will continue to be Robust Self-Defenders from this region of the world. As tensions rise at other flashpoints around the globe, such as in the South China Sea or on the Korean Peninsula, a corresponding uptick in defense prioritization amongst the principal stakeholders is likely to follow.
The security challenges confronting national defense organizations are both complex and dynamic.
Nations around the globe are facing a myriad of threats that vary greatly in both scope and scale and are transforming the global defense landscape.
(% GDP) ($B, 2017 USD)
Sources: SIPRI, IISS The Military Balance, IHS Janes Defense Budgets, and PwC analysis

8 Global Defense Perspectives 2017
Figure 3: Top 5 Defense Prioritization Decliners
The five countries with the largest decreases in defense prioritization in 2016 are: Angola, United Arab Emirates (UAE), Venezuela, Morocco and Syria (see Figure 3 and Table 2). The group consists of four Robust Self-Defenders (Angola, UAE, Morocco and Syria) and 1 Territorial Security Seeker (Venezuela).
CoalitionPartners
TerritorialSecuritySeekers
ConstrainedForce
Projectors
Threat-Focused
Self-Defenders
Global Power Projectors
Robust Self-
Defenders
Notes:Bubble size = 2016 total defense spend
Lighter shades and italics indicate positions in 2014
2012-16 Growth <0 2012-16 Growth 0-1% 2012-16 Growth >1%
Angola AngolaVenezuela Venezuela
UAE
UAE
Syria Syria
Morocco
Morocco
//
Secu
rity
Po
stu
re
Defense Prioritization (Defense Spend % GDP)0.0% 0.5% 1.0% 3.0% 3.5% 4% 5% 6% 7% 8% 9% 10%11% 17%
5
4
3
2
1
0
Top 5 Defense Prioritization Decliners
Sources: SIPRI, IISS The Military Balance, IHS Janes Defense Budgets, and PwC analysis

9Updating the Map of Defense Prioritization and Posture in a Challenging World
Table 2: Top 5 Defense Prioritization Decliners15
Nation Defense Prioritization Defense Spend
2014 2016 Basis Point Change
2014 2016 Percent Change
2012-2016 Defense Spend CAGR
Angola 5.4% 3.7% -170 $6.8 $2.8 -58.7% -7.4%
United Arab Emirates16
5.7% 4.8% -90 $22.8 $19.1 -5.6% 0.0%
Venezuela17 1.2% 0.3% -90 $5.6 $9.2 65.4% 13.2%
Morocco 3.7% 3.2% -50 $4.0 $3.3 -17.8% -0.4%
Syria18 8.9% 8.5% -40 $2.1 $1.8 -17.1% -0.1%
When compared to the increases observed for the Top 5 Defense Prioritization Growers, the decreases for the Top 5 Defense Prioritization Decliners are more modest.
In 2016, all of the Top Five Defense Prioritization Decliners except Venezuela spent less on defense both in terms of percent GDP and dollars spent. Since 2014, Venezuela’s economy and political system have become more volatile, reaching dire straits in 2016 driven by extreme levels of inflation and political instability. These conditions resulted in a relative decrease in defense prioritization.
Economic headwinds and budgetary pressures in Angola, UAE, Morocco and Syria likely played a major role in the curtailing of defense spending from 2014 to 2016. However, over the next five years, defense spending is expected to increase in Angola, UAE and Morocco, suggesting that reduced defense spending for these nations in 2016 is more a function of short-term economics than of a long-term change in priorities.19
In the case of Syria, it is important to stress the uncertain nature of the defense spending figures available. At present, with the majority of the country’s territory outside of the control of the Assad regime, it is difficult to analyze Syria as a nation in the traditional sense or relative to its nation counterparts. Syria should therefore be considered somewhat of an outlier when compared to others in this analysis.
(% GDP) ($B, 2017 USD)
Sources: SIPRI, IISS The Military Balance, IHS Janes Defense Budgets, and PwC analysis

10 Global Defense Perspectives 2017
Figure 4: Top 5 Security Posture Growers
The five countries with the largest increases in security posture in 2016 are: UAE, Qatar, Russia, Turkey, and Saudi Arabia. The group consists of two Robust Self-Defenders (UAE and Saudi Arabia), one Threat-Focused Self-Defender (Qatar), one Constrained Force Projector (Turkey), and one Global Power Projector (Russia).
CoalitionPartners
TerritorialSecuritySeekers
ConstrainedForce
Projectors
Threat-Focused
Self-Defenders
Global Power Projectors
Robust Self-
Defenders
Russia
Russia
Turkey
Turkey
Qatar
Qatar
UAE
UAE
SaudiArabia
SaudiArabia
//
Secu
rity
Po
stu
re
Defense Prioritization (Defense Spend % GDP)
1.5% 2.5%2.0% 3.0% 3.5% 4% 5% 6% 7% 8% 9% 10%11% 17%
9
8
7
6
5
4
3
2
Notes:Bubble size = 2016 total defense spend
Lighter shades and italics indicate positions in 2014
2012-16 Growth <0 2012-16 Growth 0-1% 2012-16 Growth >1%
Top 5 Security Posture Growers
Sources: SIPRI, IISS The Military Balance, IHS Janes Defense Budgets, and PwC analysis

11Updating the Map of Defense Prioritization and Posture in a Challenging World
Table 3: Top 5 Security Posture Growers20
Nation Security Posture Score (1-10 scale) Security Posture Factors
2014 2016 2014-2016 change
Forces Deployed
(% of Total)
Forces Deployed
Score (1-5)
Coalition Operations Score (1-5)
2012-2016 Arms Transfers
($B, current prices)
Arms Transfers
Score (1-5)
United Arab Emirates
3.0 5.5 +2.5 6.4% 5 4 $0.1 1
Qatar 2.5 5.0 +2.5 8.5% 5 3 $0 1
Russia 7.5 8.5 +1.0 6.7% 5 2 $33.2 5
Turkey 5.5 6.5 +1.0 13.2% 5 4 $1.1 2
Saudi Arabia 3.5 4.5 +1.0 1.0% 2 5 $0 1
Given the security environment in the Middle East, it is natural that four of the five countries with the largest increases in security posture since 2014 are from the region and the fifth nation, Russia, is deeply involved there. The increases in security posture of all five nations were driven by increases in deployed forces and participation in coalition operations.
The UAE and Qatar saw the largest increases as they each took a more prominent role in regional conflicts, particularly the Saudi-led anti-Houthi campaign in Yemen. The UAE fields what is considered one of the best trained and most capable militaries among the Gulf Cooperation Council (GCC) countries, and in recent years the country is demonstrating an increasing willingness to deploy and employ its forces. In 2016, the UAE sent approximately 4,000 troops to support the Saudi-led coalition in Yemen, increasing its deployed forces to 6.4 percent from less than 0.1 percent in 2014.21 Qatar also sent approximately 1,000 troops to Yemen in support of the Saudi-led coalition, increasing its deployed force to 8.5 percent from less than 0.1 percent in 2014.22
Since 2014, Russia has nearly doubled its deployed forces to over 55,000 troops, or 6.7 percent of its total force. Russia also deepened its involvement in the Syrian civil war, conducting extensive airstrikes and deploying roughly 4,000 troops to Syria.23 In 2016, President Putin suggested that Russia’s primary mission objectives in Syria were met, but it is still assessed that Russia maintains a substantive ground presence in Syria as the war against the Islamic State in Iraq and Syria nears its final phases.24
Russia also expanded its military footprint in Crimea, deploying an additional 8,000 troops to the region.25 Growing distrust between Russia and its NATO neighbors will fuel increased defense prioritization in the region, as evidenced by a trend of growing defense budgets in Eastern European nations such as Poland, Lithuania and Estonia.
Turkey’s increase in security posture resulted in it shifting from the Threat-Focused Self-Defenders segment to the Constrained Force Projectors segment. The shift was primarily driven by Turkey’s increased involvement and support of the counter-ISIS campaigns in Syria and Iraq. In July 2015, Turkey agreed to allow the US to launch counter-ISIS air strikes from Incirlik Air Base after more than a year’s prohibition that strained relations between the two allies.26 Rifts in the relationship remain over such as issues as support of the Kurds, but Turkey’s actions in 2015 and 2016 enhanced its support to Coalition operations and boosted its security posture.
Saudi Arabia’s increase in security posture is primarily driven by the increased leadership role it has taken in the region, most specifically by organizing and leading a coalition of nations against the Houthis in Yemen and their Iranian supporters. In 2016, Saudi Arabia spent over $63 billion on defense, and while this was a significant decrease from 2015, it still placed them as the world’s fourth largest defense spender behind the United States, China and Russia. Since 2015, Saudi Arabia has adopted a more robust security posture by assuming a greater regional leadership role more commensurate with its level of defense prioritization.
As this revision “goes to print”, we must acknowledge the heightened tensions in the Gulf affecting nearly all of the countries in this segment of Global Defense Perspectives. On 5 June, three of the GCC states—Saudi Arabia, UAE and Bahrain—along with Egypt (the GCC3+1), cut diplomatic ties with Qatar. This consisted of closing the air and sea spaces around Qatar and the land border with Saudi Arabia, as well as other measures.
While Qatar’s political rift with its neighbors continues, we do not expect this crisis to result in open conflict. However, the incident presents challenges to GCC coherence and it could become a drag on growth in the region. Furthermore, there could be significant effects with respect to spending behaviors and the relative positions of these states in Figure 4.
Sources: SIPRI, IISS The Military Balance, IHS Janes Defense Budgets, and PwC analysis
12 Global Defense Perspectives 2017
Poland
Poland
Sweden
Sweden
Denmark
Denmark
Lithuania
Lithuania
Latvia
LatviaSecu
rity
Po
stu
re
Defense Prioritization (Defense Spend % GDP)
1.5%1.0% 2.0%
8
7
6
5
4
3
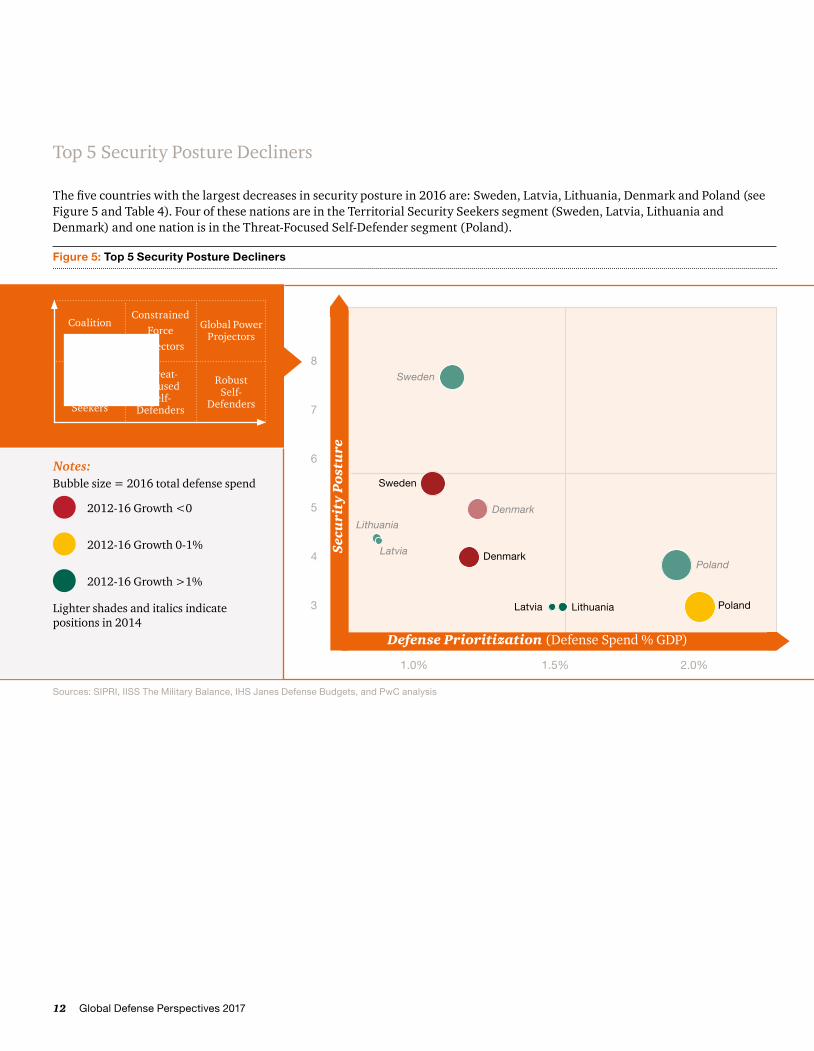
Figure 5: Top 5 Security Posture Decliners
The five countries with the largest decreases in security posture in 2016 are: Sweden, Latvia, Lithuania, Denmark and Poland (see Figure 5 and Table 4). Four of these nations are in the Territorial Security Seekers segment (Sweden, Latvia, Lithuania and Denmark) and one nation is in the Threat-Focused Self-Defender segment (Poland).
CoalitionPartners
TerritorialSecuritySeekers
ConstrainedForce
Projectors
Threat-Focused
Self-Defenders
Global Power Projectors
Robust Self-
Defenders
Notes:Bubble size = 2016 total defense spend
2012-16 Growth <0
2012-16 Growth 0-1%
Lighter shades and italics indicate positions in 2014
2012-16 Growth >1%
Top 5 Security Posture Decliners
Sources: SIPRI, IISS The Military Balance, IHS Janes Defense Budgets, and PwC analysis

13Updating the Map of Defense Prioritization and Posture in a Challenging World
Table 4: Top 5 Security Posture Decliners27
Nation Security Posture Score (1-10 scale) Security Posture Factors
2014 2016 2014-2016 change
Forces Deployed
(% of Total)
Forces Deployed
Score (1-5)
Coalition Operations Score (1-5)
2012-2016 Arms Transfers
($B, current prices)
Arms Transfers
Score (1-5)
Sweden 7.5 5.5 -2.0 1.1% 3 2 $1.7 3
Latvia 4.5 3.0 -1.5 0.8% 2 2 $0 1
Lithuania 4.5 3.0 -1.5 0.3% 2 2 $0 1
Denmark 5.0 4.0 -1.0 3.1% 4 2 $0.1 1
Poland 4.0 3.0 -1.0 0.6% 2 2 $0.2 1
Sweden’s security posture decrease was driven by significant growth in active duty end strength without a corresponding increase in forces deployed and below average arms transfers.
In the case of Lithuania, Latvia and Poland, all three nations saw a decrease in security posture due to a reduction in the percentage of deployed forces. In 2015, Lithuania boosted its active duty end strength nearly 40%, from 11,800 to 16,400, which was also accompanied by a reduction in troops deployed from 245 to 78.28
Latvia had a similar reduction in deployed forces, reducing its footprint in Mali and pulling its forces out of the Central African Republic.29
Sources: SIPRI, IISS The Military Balance, IHS Janes Defense Budgets, and PwC analysis

14 Global Defense Perspectives 2017
Figure 6: Special Focus Area: NATO
In order to address negative defense spending trends and achieve more equitable burden sharing amongst its membership, NATO formally adopted in the 2014 Wales Summit Declaration a goal that each of its members spend at least 2 percent of its GDP on defense.32
The Wales Summit Declaration states that NATO Members not currently meeting the 2 percent guideline will “halt any decline in defense expenditure” and “move towards the 2 percent guideline within a decade.”33 Furthermore, in an effort to ensure NATO members invest in modernization and field a force relevant for tomorrow’s battles, the Wales Summit Declaration also set forth the goal that all NATO nations spend at least 20 percent of their defense budgets on “major new equipment, including related research and development.”34
Progress toward and adherence to these goals and the 2 percent guideline is slow to date. In 2016, only 4 of 29 NATO nations, or 14 percent, met the 2 percent guideline (see Figure 7) and 20 of 29 nations spent less in real dollars on defense in 2016 than in 2014.35/36
China
UK UK
USA USA
Norway
Norway
Croatia
Belgium
Croatia
Turkey
Turkey
Poland
Canada
Canada
Spain Spain
Poland
EstoniaEstonia
Denmark
Denmark
Lithuania
Lithuania
Latvia
Latvia
The NetherlandsThe Netherlands
Belgium
Italy
Italy
Germany
GreeceGreecePortugal
Portugal
Luxembourg
Iceland
Czech Republic
Slovenia
Hungary
SlovakiaRomania
BulgariaMontenegro
Albania
Germany
France
France
Notes:Country bubble size = 2016 total defense spend
Lighter shades and italics indicate positions in 2014
2012-16 Growth <0
2012-16 Growth 0-1%
2012-16 Growth >1%
//Territorial Security Seekers Threat-Focused Self-Defenders
Coalition Partners
Do
mes
tic
Reg
ion
al
Glo
ba
l
Secu
rity
Po
stu
re
Defense Prioritization (Defense Spend % GDP)
Robust Self-Defenders
Global Power Projectors
0.0% 0.5% 1.5% 2.5%1.0% 2.0% 3.0% 3.5% 4% 5% 6% 7% 8% 9% 10%11% 17%
12
11
10
9
8
7
6
5
4
3
2
1
0
Constrained Force Projectors
The 29 NATO members assessed in this report are: Albania, Belgium, Bulgaria, Canada, Croatia, Czech Republic, Denmark, Estonia, France, Germany, Greece, Hungary, Iceland30, Italy, Latvia, Lithuania, Luxembourg, Montenegro31, The Netherlands, Norway, Poland, Portugal, Romania, Slovakia, Slovenia, Spain, Turkey, United Kingdom and United States.
Special Focus Area: NATO
Sources: SIPRI, IISS The Military Balance, IHS Janes Defense Budgets, and PwC analysis

15Updating the Map of Defense Prioritization and Posture in a Challenging World
Figure 7: 2016 NATO Member Nation Defense Spending (% GDP)
While defense spending trends remain negative amongst NATO nations, it is likely increasing pressure from Allies and improving economic conditions will enhance the prospects for more NATO nations to meet the 2 percent guideline in the next five years.
In 2016, four NATO nations shifted segments on the Global Defense Map: Turkey, Norway, Italy and Croatia. While Turkey’s shift on the Global Defense Map represents a substantive shift in security posture, the shifts of Norway, Italy, and Croatia are more modest and driven primarily by small shifts in defense prioritization.
Turkey shifted from the Threat-Focused Self-Defenders segment to the Constrained Force Projectors segment, meaning Turkey took actions to enhance its security posture. As highlighted earlier, Turkey’s increased security posture was driven by the country’s increased involvement and support of counter-ISIS operations in Syria and Iraq. Since 2014, Turkey increased its percentage of armed forces deployed from 8.6 percent to 13.2 percent, giving Turkey the world’s second highest proportion of deployed forces behind the United States.37
Norway shifted from the Territorial Security Seekers segment to the Threat-Focused Self-Defenders segment because the nation’s defense spending took up a larger share of GDP from 2014 to 2016, increasing from 1.5 percent to 1.6 percent. Since 2014, the global fall in oil prices placed significant downward pressure on Norway’s economy. Going forward, however, Norway’s economy is expected to improve and its defense spending will likely remain flat; therefore, it is likely that Norway will shift back to the Territorial Security Seekers segment within the next 1 to 3 years.
Italy shifted from the Coalition Partners segment to the Constrained Force Projectors segment due to a slight increase in defense spending as a percentage of GDP from 2014 to 2016. Conversely, Croatia’s shift from the Threat-Focused Self-Defenders segment to the Territorial Self-Defenders segment was driven by a slight decrease in defense prioritization from 2014 to 2016.
Since the end of the World War II, the NATO Alliance has been a principal guarantor of peace and security in Europe and around the world. Today, tensions between NATO and Russia are on the rise and friction between the two sides in Eastern Europe is at levels not seen since the Cold War. At the same time, inequities within the NATO Alliance are garnering much attention and raising concern over NATO’s future.
Going forward NATO nations seeking to achieve the 2 percent of GDP spending goal will face significant challenges from both internal opposition to sacrificing domestic social programs in favor of defense spending and from a simple lack of institutional capacity to effectively manage such a large growth in their respective overall defense establishments. For many of these countries, the plan to reach 2 percent of GDP will likely coincide with a GDP denominator that is also growing thereby facilitating more than a doubling of their current defense expenditures. Ensuring that this spending growth is managed effectively, without corruption, and that it actually delivers capability that enhances national defense within the broader context of NATO interoperability will not be a trivial exercise.
0.0
0.5
1.0
1.5
2.0
2.5
3.0
3.5
2% NATO Target
Uni
ted
Sta
tesPer
cent
of G
DP
Spe
nt o
n D
efen
se in
201
6
Gre
ece
Fran
ce
Est
onia
Turk
ey
Pol
and
Uni
ted
Kin
gdom
Por
tuga
l
Nor
way
Mon
tene
gro
Italy
Bul
garia
Rom
ania
Lith
uani
a
Latv
ia
Cro
atia
Spa
in
The
Net
herla
nds
Alb
ania
Ger
man
y
Den
mar
k
Slo
vaki
a
Cze
ch R
epub
lic
Hun
gary
Can
ada
Slo
veni
a
Bel
gium
Luxe
mbo
urg
Icel
and
Sources: SIPRI, IISS The Military Balance, IHS Janes Defense Budgets, and PwC analysis

16 Global Defense Perspectives 2017
Figure 8: Special Focus Area: South Central Asia and the Pacific Rim
The global balance of military spending is shifting east. This shift is accompanied by South Central Asia and the Pacific Rim continuing to increase their respective shares of the global economy and population. Today, and into the foreseeable future, Asia will be a primary stage for great power competition and this broad region is home to some of the world’s thorniest potential geopolitical flashpoints.
The ten nations and regions spending the most on defense in South Central Asia and the Pacific Rim are: China, India, Japan, South Korea, Australia, Iran, Pakistan, Singapore, Taiwan and Indonesia (see Figure 8).
CoalitionPartners
TerritorialSecuritySeekers
ConstrainedForce
Projectors
Threat-Focused
Self-Defenders
Global Power Projectors
Robust Self-
Defenders
China
Indonesia
Indonesia Singapore
Singapore
SouthKorea
SouthKorea
India
IndiaTaiwan
Taiwan
Iran
Iran
PakistanPakistan
Japan
Japan
China Australia
Australia
Secu
rity
Po
stu
re
Defense Prioritization (Defense Spend % GDP)0.5% 1.5% 2.5%1.0% 2.0% 3.0% 3.5%
7
6
5
4
3
2
1
0
Notes:Bubble size = 2016 total defense spend
Lighter shades and italics indicate positions in 2014
2012-16 Growth <0 2012-16 Growth 0-1% 2012-16 Growth >1%
Special Focus Area: South Central Asia and the Pacific Rim
Sources: SIPRI, IISS The Military Balance, IHS Janes Defense Budgets, and PwC analysis

17Updating the Map of Defense Prioritization and Posture in a Challenging World
The defense prioritization and posture of nations in this vast region that lines the Indian and Western Pacific Oceans is dominated by a multitude of traditional rivalries that show few signs of diminishing in significance.
On the western edge of this region, Iran has expanded its military assertiveness through active engagement in Iraq, Syria, Yemen and Afghanistan and through its accelerating “cold war” of sorts with the Gulf States, particularly Saudi Arabia. This increased assertiveness is enabled in large part by a significant increase in Iran’s defense spending. In 2016, Iran spent over $2.7 billion, or 28 percent, more on defense than it did in 2014, and this increase in defense prioritization moved Iran on the Global Defense Map from Threat-Focused Self-Defender to Robust Self-Defender.38
Proceeding eastward, the traditional hostilities between Pakistan and India dominate defense spending priorities in both countries. India remains identified in our analysis as a Threat-Focused Self-Defender, with that threat nearly solely embodied by its neighbour to the west, Pakistan. Pakistan remains a Robust Self-Defender on the map, but despite the higher percentage of GDP it spends on defense, its primary adversary, India, is outspending them approximately five to one in real dollars.
Heading eastward we see evidence of China’s increased assertiveness in the South China Sea driving a greater emphasis by neighbor states on defense spending, and a return to calls for more active U.S. engagement and presence in the region. Additionally, the on-and off-line proliferation of Salafist terror groups facilitated by both sophisticated social media and overt funding of radical Islamic education have created outposts of radicalism that threaten large populations in this region to include Indonesia and the Philippines.
Advancing further east and north, North Korea’s continued belligerence and lack of adherence to international treaties and norms dominates defense planning, and spending, in South Korea and Japan, as well as other neighbours in the region. Finally, Chinese investments in massive infrastructure programs – such as the “Silk Road Economic Belt” and “21st Century Maritime Silk Road” which together link 65 countries across Asia, Europe, the Middle East and Africa – portend dramatic increases in trade, but not necessarily greater stability as an end result. More trade via ocean and advanced overland routes in this region will put a higher percentage of national GDP for most nations in the region and beyond at risk and will require greater defense expenditures to maintain the security of these routes over time, whether the threats to these routes are national or transnational in nature.

Conclusion
In the two years since we published our first Global Defense Perspectives paper the global security environment has become even more complex and dangerous. As reflected in our research, these changes have generated some serious recalibrations regarding how the nations included in this study have prioritized government spending. These changes are impacting every region of the world in ways that may lead to increased defense spending in both absolute terms, and in relation to GDP, by most nations.
In Asia, the North Korea crisis and Chinese military modernization and assertiveness in the South China Sea have raised tensions across the region. In Europe, heightened tensions between the West and Russia have actually helped advance the United States’ demands that NATO nations meet their 2 percent of GDP obligations. This is particularly true for those NATO nations in Central and Eastern Europe who sense an acute vulnerability due to their geographic position on the eastern edge of the NATO alliance.
Finally, the deteriorating situation in the Middle East, centered around the violence and instability emanating from Syria, Iraq, Libya and Yemen, has had profound implications for regional actors, but also for European nations and the rest of the world. As both a source and by-product of instability in the Middle East, ISIS has transformed itself into a transnational movement that threatens peace and stability everywhere.
While defense prioritization and posture may continue to increase to meet these evolving threats, in order to be effective these increases must be focused on staying ahead of increasingly sophisticated adversaries who have access to increasingly more disruptive and destructive capabilities. These challenges are not likely to be abated in the near term. Thomas Modly
Chris Lehman
Contacts
18 Global Defense Perspectives 2017
Rollie QuinnGlobal Leader, Government and Public Services
Terry Weber

Approach PwC developed a template to analyze the specific defense characteristics of the 71 nations/regions39 assessed in this report. This template had two principal sections that focused on:
• Recent, current and anticipated defense spending trends; and
• The major investment, institutional, structural and strategic priorities and challenges impacting these nations.
We used the insights of PwC’s Global Government Defense Network as well as publicly available resources to populate the templates and develop insights on the progress made by these defense organizations in adapting to their respective challenges.
Using this information, we then measured these nations against two metrics: 1) Prioritization – how they prioritize defense spending and 2) Posture – how they posture themselves in the global security environment.
Defense Prioritization Defense spending is the first order measure of how much a nation prioritizes their national security. This total spend is important, but it does not adequately measure the respective prioritization of defense to each nation. To assess prioritization, the traditional measure is to look at the percentage of Gross Domestic Product (GDP) that a nation spends on defense. In developing the Global Defense Map, the dividing lines for prioritization based on defense spending as a percentage of GDP spend were not predetermined, but rather what the actual mapping of this data appeared to suggest as logical breakpoints.
In addition to current spending levels, it is also important to look at recent and expected future trends. Some nations, for example, are coping with fiscal challenges that are impacting governmental resources for defense while others are aggressively increasing their level of spending to face current or expected security threats. Assessing the growth of defense spending over the past five years and the combined annual growth rate (CAGR) of each nation, for instance, gives a good sense of where a nation’s defense spending has been and where it is heading.
Ratings by Nation Table 5 illustrates the spending trends of the 71 nations in descending order of defense prioritization.
Appendix
19Updating the Map of Defense Prioritization and Posture in a Challenging World

20 Global Defense Perspectives 2017
Table 5: Defense Prioritization by nation/region40
Nation/region Defense Prioritization (% GDP)
2016 Total Spend ($B, 2017 USD)
CAGR (2012-2016)
Projected CAGR (2017-2021)
Oman 16.75% 9.1 -5.90% 0.20%
Saudi Arabia 10.41% 63.7 2.40% 4.30%
Syria 8.49% 1.8 0.10% -2.60%
Algeria 6.66% 10.2 1.80% 1.90%
Kuwait 6.47% 6.6 2.00% 1.00%
Israel 5.78% 18.0 4.00% 1.20%
Russia 5.32% 69.2 -3.20% -0.20%
Iraq 4.84% 6.2 8.50% 0.20%
United Arab Emirates 4.80% 19.1 0.00% 5.00%
Bahrain 4.75% 1.4 3.90% 1.90%
Jordan 4.45% 1.8 3.70% 0.50%
Ukraine 3.84% 3.4 -3.70% 0.00%
Angola 3.68% 2.8 -7.40% 5.00%
Colombia 3.39% 9.6 -4.00% 0.10%
Singapore 3.39% 10.0 1.70% 2.20%
Pakistan 3.38% 10.1 6.10% 2.50%
United States 3.29% 611.2 -2.20% 2.20%
Morocco 3.20% 3.3 -0.40% 3.60%
Iran 3.03% 12.7 -5.10% 4.40%
South Korea 2.65% 36.8 2.90% 2.40%
Greece 2.57% 5.0 -3.40% 0.70%
India 2.50% 55.9 3.40% 4.50%
Vietnam 2.41% 5.0 8.30% 4.20%
France 2.27% 55.7 -1.50% 0.30%
Estonia 2.12% 0.5 2.80% 1.90%
Qatar 2.05% 4.4 8.00% 4.60%
Turkey 1.99% 14.8 -3.80% 0.30%
Poland 1.97% 9.3 0.80% 2.80%
Australia 1.97% 24.6 -1.30% 2.30%
China 1.93% 215.2 6.50% 4.00%
Taiwan 1.89% 9.9 -1.10% 1.90%
Chile 1.89% 4.6 -3.40% 2.30%
United Kingdom 1.86% 48.3 -3.80% 0.00%
Portugal 1.84% 3.8 -1.90% 2.10%
Egypt 1.60% 4.5 -0.20% 2.60%
Norway 1.60% 6.0 -3.40% -0.40%

21Updating the Map of Defense Prioritization and Posture in a Challenging World
Nation/region Defense Prioritization (% GDP)
2016 Total Spend ($B, 2017 USD)
CAGR (2012-2016)
Projected CAGR (2017-2021)
Montenegro 1.58% 0.1 -0.20% 2.00%
Italy 1.52% 27.9 -3.70% 0.10%
Bulgaria 1.51% 0.8 -1.30% 0.90%
Romania 1.49% 2.8 5.60% 5.20%
Lithuania 1.49% 0.6 14.10% 5.50%
Thailand 1.47% 5.9 1.40% 1.40%
Latvia 1.45% 0.4 9.70% 6.70%
Malaysia 1.39% 4.2 -1.50% 2.70%
Croatia 1.38% 0.7 -6.20% 2.80%
Finland 1.38% 3.2 -2.10% 2.50%
Brazil 1.34% 23.7 -7.00% 1.40%
Philippines 1.28% 3.9 6.10% 4.00%
Spain 1.20% 14.9 -4.60% 0.80%
The Netherlands 1.20% 9.3 -2.20% -1.60%
Albania 1.19% 0.1 -4.40% -6.30%
Germany 1.19% 41.1 -2.40% 0.60%
Denmark 1.17% 3.5 -4.50% -0.60%
New Zealand 1.16% 2.1 0.00% 1.70%
Slovakia 1.15% 1.0 0.30% 2.90%
South Africa 1.08% 3.2 -6.80% 0.20%
Sweden 1.04% 5.3 -3.20% 1.40%
Czech Republic 1.01% 2.0 -1.80% 8.10%
Hungary 1.00% 1.3 -1.10% 5.20%
Canada 1.00% 15.2 -5.80% -1.00%
Japan 0.99% 46.1 -5.10% -0.40%
Argentina 0.96% 5.2 2.70% -2.40%
Slovenia 0.93% 0.4 -5.80% 2.90%
Belgium 0.88% 4.1 -4.70% 2.20%
Indonesia 0.87% 8.2 4.60% 4.40%
Austria 0.74% 2.9 -2.10% 0.00%
Switzerland 0.71% 4.7 0.40% 0.20%
Mexico 0.58% 6.0 -2.90% -0.30%
Luxembourg 0.48% 0.3 4.40% 1.80%
Venezuela 0.29% 9.2 13.20% -14.60%
Iceland 0.14% 0.0 4.40% 2.10%

Security Posture Each nation’s security posture is also critical to understanding its defense priorities. A nation uses its posture to increase its influence and build security relationships in a region or around the world. Two principal components are helpful in measuring a nation’s security posture: 1) the degree to which a nation deploys its air and ground forces outside its national boundaries, and 2) the amount of military equipment that a nation sells or leases. We defined security posture across the 71 nations with these two components:
1. Engaged forces. The willingness of a nation to deploy its forces beyond its borders demonstrates the importance of a security priority. Some nations do this for principally national interests, such as the deployment of Turkish forces in Cyprus, Russian forces in Abkhazia and South Ossetia, and French forces in Sub-Saharan Africa. Other nations deploy forces to participate in United Nations (UN) peacekeeping operations or to participate in larger coalition operations such as those in Afghanistan or, previously, in Iraq. In addition to deployed ground forces, some operations, such as Operation Inherent Resolve (OIR) against ISIS, are principally air-focused for many nations. Nations contribute to these operations through contributions of air strikes, air support and operational bases.
2.� Arms�transfers. Another tool that some nations employ is arms transfers. The sale or lease of military equipment to other nations helps to gain influence, improve interoperability and enhance the capacity of allies and partners around the world.
To measure security posture, we rated each nation on these two components. Table 6 illustrates this rating scale:
Table 6: Security Posture Rating scale
Rating Engaged forces International arms transfers (2012-2016)
Forces deployed as percentage of active forces (2016) Participation in coalition operations (2012-2016)
1 <=0.5% active forces deployed Minimal to no participation in coalition ops 0-$250 Million
2 <1% active forces deployed Limited participation (<1% deployed or air support role) in > 1 coalition operation(s)
$250 Million – $1.25 Billion
3 1-2% active forces deployed Major participation (>1% deployed or leading air role) in 1 coalition operation
$1.25-2.5 Billion
4 2-5% active forces deployed Major participation (>1% deployed or leading air role) in 2+ coalition operations
$2.5 – $5 Billion
5 5%+ active forces deployed Leading role (>5% deployed or lead air role) in 2+ coalition operations
> $5 Billion
22 Global Defense Perspectives 2017
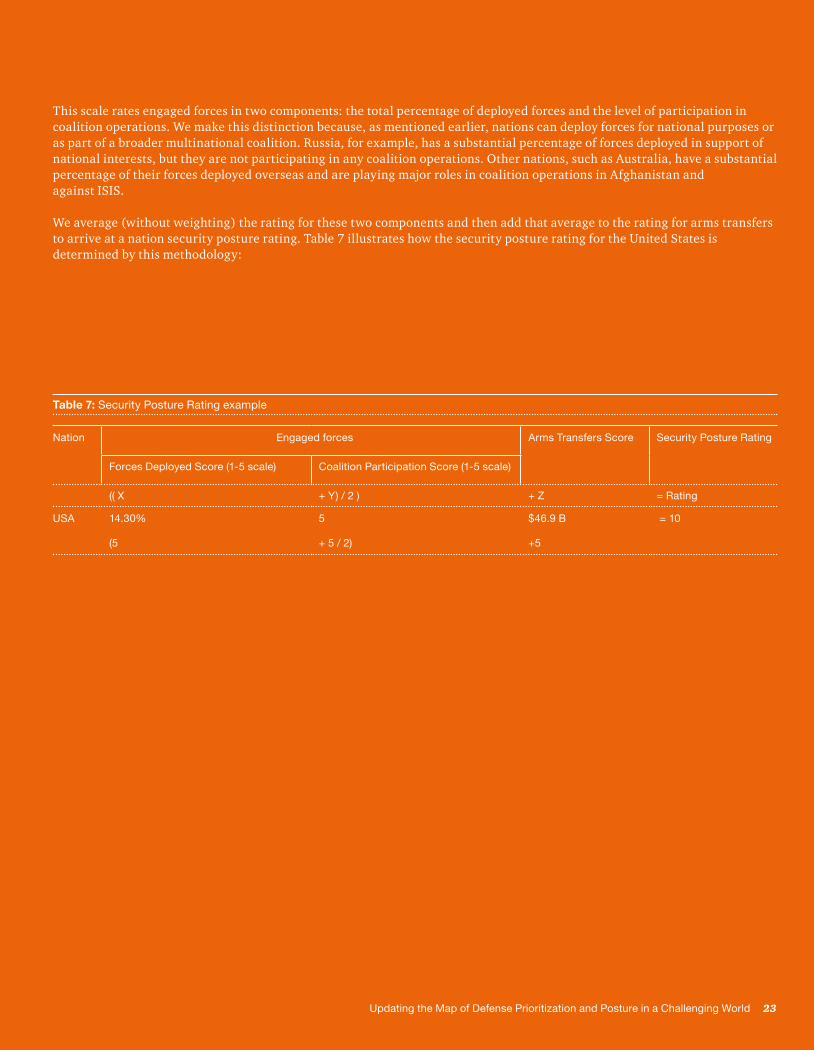
This scale rates engaged forces in two components: the total percentage of deployed forces and the level of participation in coalition operations. We make this distinction because, as mentioned earlier, nations can deploy forces for national purposes or as part of a broader multinational coalition. Russia, for example, has a substantial percentage of forces deployed in support of national interests, but they are not participating in any coalition operations. Other nations, such as Australia, have a substantial percentage of their forces deployed overseas and are playing major roles in coalition operations in Afghanistan and against ISIS.
We average (without weighting) the rating for these two components and then add that average to the rating for arms transfers to arrive at a nation security posture rating. Table 7 illustrates how the security posture rating for the United States is determined by this methodology:
Table 7: Security Posture Rating example
Nation Engaged forces Arms Transfers Score Security Posture Rating
Forces Deployed Score (1-5 scale) Coalition Participation Score (1-5 scale)
(( X + Y) / 2 ) + Z = Rating
USA 14.30%
(5
5
+ 5 / 2)
$46.9 B
+5
= 10
23Updating the Map of Defense Prioritization and Posture in a Challenging World

24 Global Defense Perspectives 2017
Nation/region Engaged Forces Arms transfers 2012-2016 ($B,
2017 USD)
Arms Transfers Score (1-5 scale)
Security Posture rating (1-10 scale)
Forces Deployed 2016 (% of Force)
Forces Deployed Score (1-5 scale)
Coalition Participation Score (1-5 scale)
United States 14.90% 5 5 47.2 5 10
France 8.90% 5 4 8.6 5 9.5
United Kingdom 8.80% 5 4 6.6 5 9.5
Russia 6.70% 5 2 33.2 5 8.5
Germany 1.80% 3 3 7.9 5 8
Italy 2.10% 4 3 3.8 4 7.5
Canada 2.20% 4 4 1.3 3 7
The Netherlands 1.80% 3 3 2.7 4 7
Turkey 13.20% 5 4 1.1 2 6.5
China 0.10% 2 1 8.8 5 6.5
Spain 0.90% 2 2 4.0 4 6
Australia 2.80% 4 4 0.4 2 6
United Arab Emirates 6.40% 5 4 0.1 1 5.5
Ukraine 0.20% 2 1 3.7 4 5.5
Sweden 1.00% 3 2 1.7 3 5.5
Israel 0.00% 1 1 3.2 4 5
Czech Republic 1.70% 3 3 0.3 2 5
Finland 2.30% 4 2 0.4 2 5
Switzerland 1.30% 3 1 1.4 3 5
Qatar 8.50% 5 3 0 1 5
Saudi Arabia 1.00% 2 5 0 1 4.5
Slovenia 4.20% 4 3 0 1 4.5
Hungary 2.90% 4 3 0 1 4.5
South Africa 2.00% 4 1 0.5 2 4.5
South Korea 0.10% 2 1 1.4 3 4.5
Norway 1.30% 3 2 0.9 2 4.5
Morocco 0.80% 2 4 0 1 4
Jordan 0.00% 2 4 0.2 2 4
Luxembourg 3.10% 4 2 0 1 4
Romania 1.20% 3 3 0.2 1 4
Montenegro 1.00% 3 3 0 1 4
Slovakia 1.60% 3 3 0 1 4
Austria 4.80% 4 2 0.1 1 4
Belgium 1.40% 3 3 0.1 1 4
Ratings by nation/region Taking this approach, we analyzed the nations/regions and the results are found in Table 8
Table 8: Security Posture by nation/region41

25Updating the Map of Defense Prioritization and Posture in a Challenging World
Nation/region Engaged Forces Arms transfers 2012-2016 ($B,
2017 USD)
Arms Transfers Score (1-5 scale)
Security Posture rating (1-10 scale)
Forces Deployed 2016 (% of Force)
Forces Deployed Score (1-5 scale)
Coalition Participation Score (1-5 scale)
Denmark 3.10% 4 2 0.1 1 4
Albania 0.80% 2 3 0 1 3.5
Brazil 0.40% 2 1 0.3 2 3.5
New Zealand 2.00% 3 2 0.1 1 3.5
Bulgaria 0.50% 2 3 0.1 1 3.5
Estonia 1.60% 3 2 0 1 3.5
Iraq 0.00% 1 3 0 1 3
Kuwait 0.00% 2 2 0 1 3
Pakistan 1.00% 3 1 0 1 3
Bahrain 0.10% 2 2 0 1 3
Malaysia 0.80% 2 2 0 1 3
Croatia 0.90% 2 2 0 1 3
Latvia 0.80% 2 2 0 1 3
Lithuania 0.30% 2 2 0 1 3
Egypt 0.50% 2 2 0 1 3
Portugal 0.90% 2 2 0.2 1 3
Greece 0.80% 2 2 0 1 3
Poland 0.60% 2 2 0.2 1 3
Iceland 0.00% 1 2 0 1 2.5
Iran 0.40% 2 1 0.1 1 2.5
Colombia 0.10% 2 1 0 1 2.5
Oman 0.00% 1 2 0 1 2.5
Singapore 0.30% 2 1 0.2 1 2.5
Mexico 0.00% 2 1 0 1 2.5
Thailand 0.00% 2 1 0 1 2.5
Indonesia 0.70% 2 1 0.1 1 2.5
Philippines 0.10% 2 1 0 1 2.5
Japan 0.20% 2 1 0 1 2.5
Argentina 0.60% 2 1 0 1 2.5
Vietnam 0.00% 2 1 0 1 2.5
Chile 0.70% 2 1 0 1 2.5
India 0.50% 2 1 0.1 1 2.5
Algeria 0.00% 1 1 0 1 2
Angola 0.00% 1 1 0 1 2
Syria 0.00% 1 1 0 1 2
Taiwan 0.00% 1 1 0 1 2
Venezuela 0.00% 1 1 0 1 2

26 Global Defense Perspectives 2017
1. SIPRI, “Trends in World Military Expenditure, 2016,” 24 April 2017. Available at https://www.sipri.org/publications/2017/sipri-fact-sheets/trends-world-military-expenditure-2016 (accessed on May 5, 2017).
2. SIPRI, “Trends in International Arms Transfers, 2016,” February 2017. Available at https://www.sipri.org/sites/default/files/Trends-in-international-arms-transfers-2016.pdf (Accessed May 10, 2017).
3. Ibid.
4. NATO Wales Summit Declaration, September 5, 2014. Available at http://www.europarl.europa.eu/meetdocs/2014_2019/documents/sede/dv/sede240914walessummit_/sede240914walessummit_en.pdf (Accessed May 10, 2017).
5. SIPRI Defense Expenditures database and PwC analysis.
6. SIPRI Defense Expenditures database
7. SIPRI Defense Expenditures database, Teal International Defense Briefing, IHS Jane’s Defense Budgets, and PwC analysis.
8. One basis point equates to one hundredth of one percent. The term basis point is used most often in finance to discuss differences of percentages.
9. 2016 data for Oman is based upon a SIPRI estimate.
10. GDP and defense expenditure data for Iraq are based on SIPRI estimates. The data is highly uncertain for Iraq given the destabilizing security situation in the country.
11. Data for Ukraine is based upon SIPRI estimates. Given the ongoing conflict in Eastern Ukraine actual defense spending in the 2014-2016 period is uncertain.
12. SIPRI Defense Expenditures database and PwC analysis.
13. Ibid.
14. Ibid.
15. SIPRI Defense Expenditures database, Teal International Defense Briefing, IHS Jane’s Defense Budgets, and PwC analysis.
16. Data for the UAE is based upon SIPRI and IHS Jane’s estimates.
17. Data for Venezuela for 2015 and 2016 is uncertain and based upon SIPRI estimates.
18. Data for Syria is uncertain and based upon IHS Jane’s estimates.
19. Ibid.
20. The Military Balance 2017, SIPRI Arms Transfers database, NATO ISAF placemat archive (available at http://www.nato.int/cps/en/natohq/topics_69366.htm (accessed December 8, 2016)), PwC analysis, and Congressional Research Service, “Coalition Contributions to Countering the Islamic State,” August 24, 2016. Available at https://fas.org/sgp/crs/natsec/R44135.pdf (Accessed May 14, 2017).
21. The Military Balance 2017.
22. Ibid.
Endnotes

27Updating the Map of Defense Prioritization and Posture in a Challenging World
23. Ibid.
24. Kimberly Marten and Rajan Menon, “Putin’s Mission Accomplished?” Foreign Affairs, March 15, 2016. Available at https://www.foreignaffairs.com/articles/syria/2016-03-15/putins-mission-accomplished (Accessed May 10, 2017).
25. The Military Balance 2017.
26. Liz Sly and Karen DeYoung, “Turkey agrees to allow U.S. military to use its base to attack Islamic State,” The Washington Post, July 23, 2015. Available at https://www.washingtonpost.com/world/middle_east/turkey-agrees-to-allow-us-military-to-use-its-base-to-attack-islamic-state/2015/07/23/317f23aa-3164-11e5-a879-213078d03dd3_story.html?utm_term=.9199c29b76f3 (Accessed December 7, 2016)
27. The Military Balance 2017, SIPRI Arms Transfers database, NATO ISAF placemat archive (available at http://www.nato.int/cps/en/natohq/topics_69366.htm (accessed December 8, 2016)), PwC analysis, and Congressional Research Service, “Coalition Contributions to Countering the Islamic State,” August 24, 2016. Available at https://fas.org/sgp/crs/natsec/R44135.pdf (Accessed May 14, 2017).
28. The Military Balance 2017.
29. Ibid.
30. It should be noted that Iceland, while a NATO Member, maintains no standing military and its defense spending is minimal.
31. Montenegro officially joined NATO in June 2017 as the alliance’s 29th member.
32. NATO Wales Summit Declaration, September 5, 2014. Available at http://www.europarl.europa.eu/meetdocs/2014_2019/documents/sede/dv/sede240914walessummit_/sede240914walessummit_en.pdf (Accessed May 10, 2017).
33. Ibid.
34. Ibid.
35. SIPRI Defense Expenditures database and PwC analysis.
36. While SIPRI’s Defense Expenditure Database serves as the primary source in this report for NATO defense expenditure as a percentage of GDP, it should be noted that other resources, to include NATO itself, report slightly different figures. To conduct consistent analysis and track relative changes in defense prioritization over time, SIPRI’s database serves as the baseline for this report.
37. SIPRI Defense Expenditures database, Teal International Defense Briefing, IHS Jane’s Defense Budgets, and PwC analysis.
38. Ibid.
39. PwC’s 2015 report assessed 60 nations. This year’s report added 10 additional NATO nations and Jordan given its prominent military and defense role in the Middle East. Thus this report assesses 71 nations.
40. SIPRI Defense Expenditures database, Teal International Defense Briefing, IHS Jane’s Defense Budgets, and PwC analysis.
41. The Military Balance 2017, SIPRI Arms Transfers database, NATO ISAF placemat archive (available at http://www.nato.int/cps/en/natohq/topics_69366.htm (accessed December 8, 2016)), PwC analysis, and Congressional Research Service, “Coalition Contributions to Countering the Islamic State,” August 24, 2016. Available at https://fas.org/sgp/crs/natsec/R44135.pdf (Accessed May 14, 2017).

28 Global Defense Perspectives 2017
Notes

29Updating the Map of Defense Prioritization and Posture in a Challenging World

This publication has been prepared for general guidance on matters of interest only, and does not constitute professional advice. You should not act upon the information contained in this publication without obtaining specific professional advice. No representation or warranty (express or implied) is given as to the accuracy or completeness of the information contained in this publication, and, to the extent permitted by law, PwC does not accept or assume any liability, responsibility or duty of care for any consequences of you or anyone else acting, or refraining to act, in reliance on the information contained in this publication or for any decision based on it.
© 2017 PwC. All rights reserved. “PwC” refers to the PwC network and/or one or more of its member firms, each of which is a separate legal entity. Please see www.pwc.com/structure for further details.
Design Services 30882 (11/17).