global data for diabetes and obesity research global data … nick wareham, interconnect co...
TRANSCRIPT
This project is funded by the European Union’s Seventh Framework Programme for research, technological development and demonstration under grant agreement no 602068.
Global data for diabetes and obesity research
Host: Nick Wareham, InterConnect Co-ordinator & Director, MRC Epidemiology Unit, University of Cambridge, UK Pre-EASD Symposium Lisbon, 11 September 2017
Global data for diabetes and obesity research

InterConnect Goal
• Create the foundations for cross-cohort analyses – Move from explaining differences in risk within populations
to explaining differences between populations
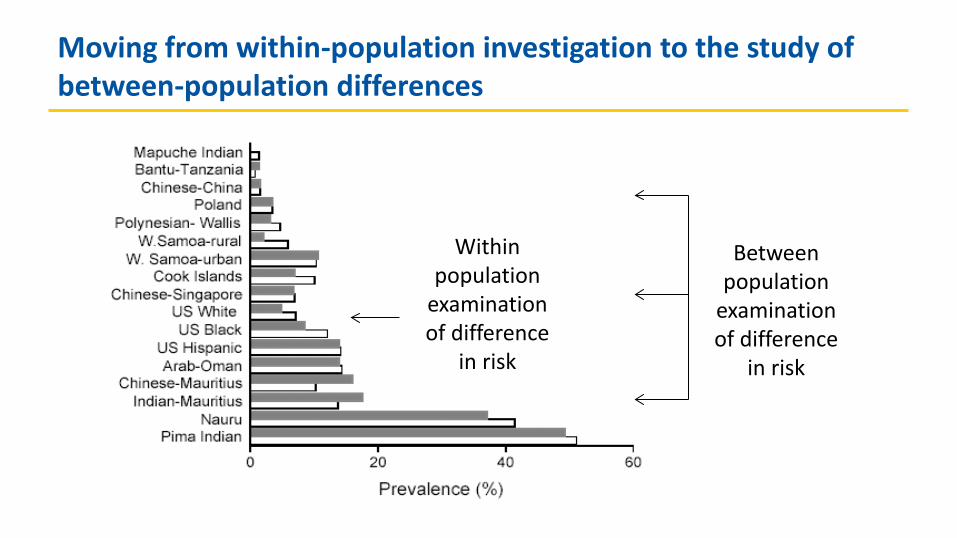
Moving from within-population investigation to the study of between-population differences
Within population
examination of difference
in risk
Between population
examination of difference
in risk
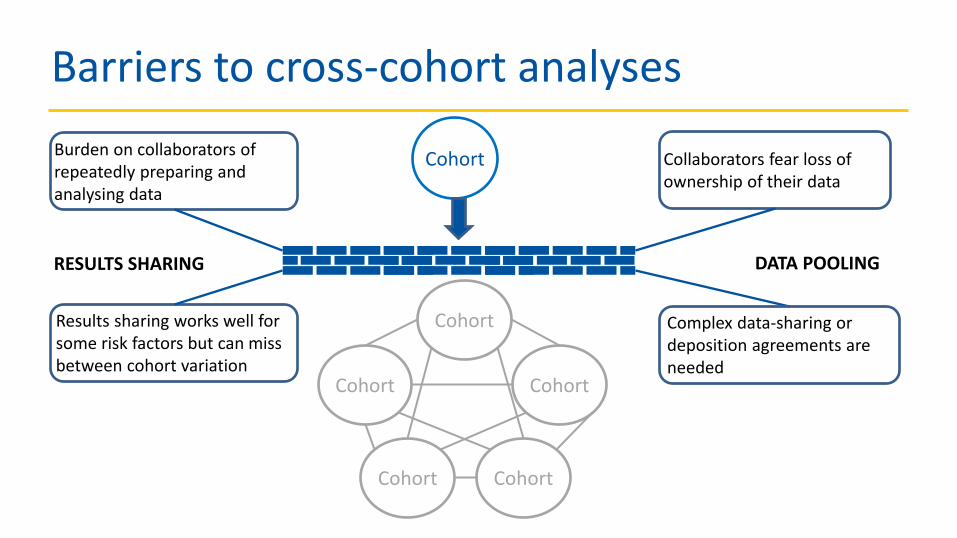
Barriers to cross-cohort analyses
Cohort Burden on collaborators of repeatedly preparing and analysing data
Collaborators fear loss of ownership of their data
Cohort
Cohort Cohort
Cohort Cohort
Complex data-sharing or deposition agreements are needed
Results sharing works well for some risk factors but can miss between cohort variation
RESULTS SHARING DATA POOLING

How to realise the vision?
• Create one large international cohort • Make better use of existing data • Align prospective studies with use of
comparable metrics
InterConnect contributing

Align prospective studies with use of comparable metrics

Steps to make better use of existing data
• Find relevant studies globally • Find out what data the studies have collected • Find an appropriate way of bringing data together • Find a way of interpreting different forms of data that
are brought together

InterConnect foundations
Identification of studies, design, data – Registry
Harmonisation of exposures and
outcomes
Framework for taking the analysis
to the data
TOOLS & INFRASTRUCTURE
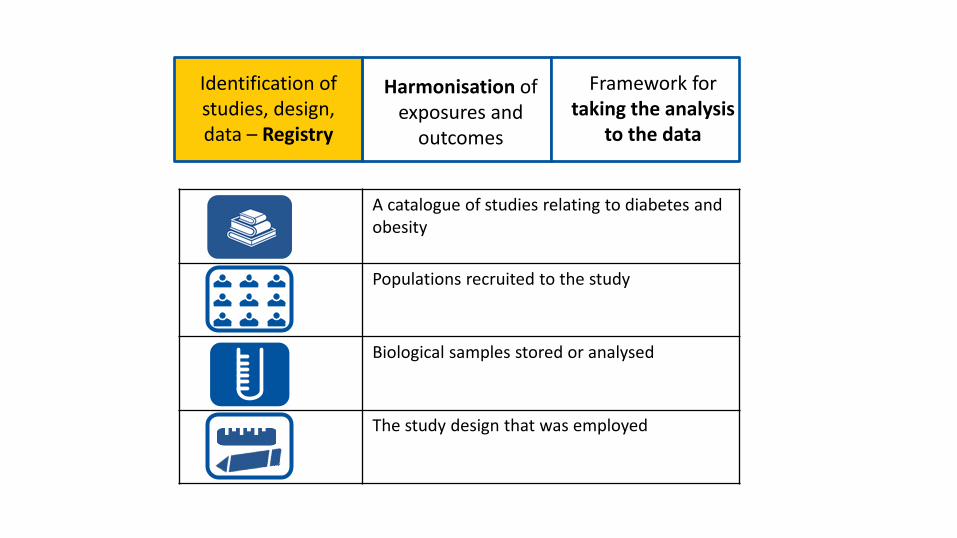
A catalogue of studies relating to diabetes and obesity
Populations recruited to the study
Biological samples stored or analysed
The study design that was employed
Identification of studies, design, data – Registry
Harmonisation of exposures and
outcomes
Framework for taking the analysis
to the data

InterConnect: Live Study Registry

Geographic diversity
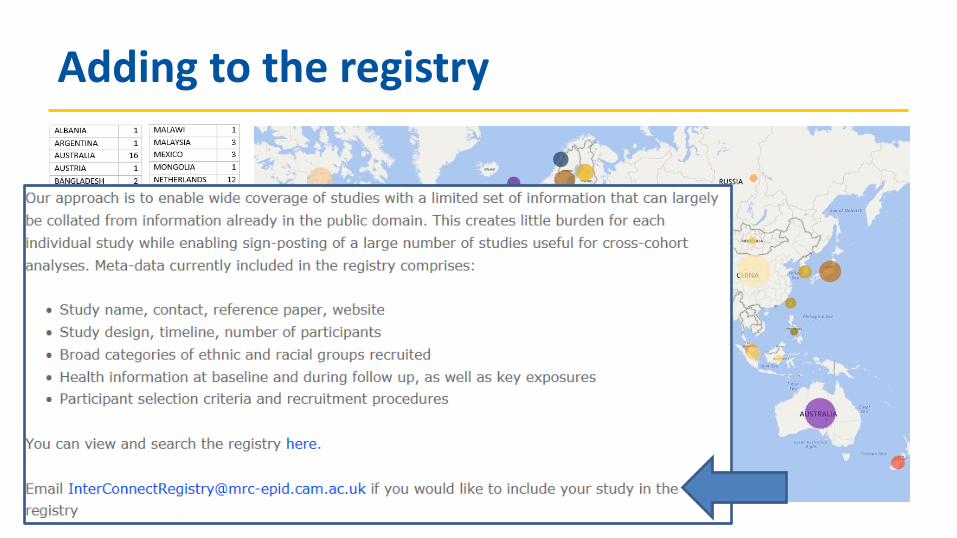
Adding to the registry

InterConnect software captures how the alignment is made so it is both explicit and re-usable
Algorithms study servers, catalogue Learning, guidance DAPA toolkit
Align to give a single exposure where possible
Exemplar question: Study A In a typical week, how many glasses of red wine (6 ounces) do you drink per day? [___] Number of drinks per day Exemplar question: Study B In general, how many glasses of red wine do you drink per day over a week and weekend? Week: [___] Number/day Weekend: [___] Number/day Exemplar question: Study C In a typical week, how many glasses of red wine do you drink per day? 1–3 4–6 7–9 10 or more
Identification of studies, design, data – Registry
Harmonisation of exposures and
outcomes
Framework for taking the analysis
to the data

DAPA toolkit • Also aids retrospective harmonisation
– Harmonisation concepts and case studies – Principles, process and different techniques

Study 1 Local data
Server
Analysis Server
Study 2 Local data
Server
Study 3 Local data
Server
Study 4 Local data
Server
Study 5 Local data
Server
• Take the analysis to the data - federated analysis
• Data stay within the governance structure of the cohort
• Analytical instructions and non-identifying summary parameters allowed to pass between computers
• Users with log in credentials can remotely access the analysis server to run analyses
Identification of studies, design, data – Registry
Harmonisation of exposures and
outcomes
Framework for taking the analysis
to the data

InterConnect: A bridging function TOOLS & INFRASTRUCTURE
RESEARCH USE: APPLICATION TO FOCUS & REFINE
Research driven ‘Exemplar projects’
1. PA in pregnancy and neonatal anthropometric outcomes 2. Fish intake and risk of type 2 diabetes
Identification of studies, design, data – Registry
Harmonisation of exposures and
outcomes
Framework for taking the analysis
to the data

Programme
• 14.30 Vision for the InterConnect approach • 14.40 Resources for data harmonisation: DAPA toolkit (Matthew Pearce) • 14.50 Relationship between maternal physical activity in pregnancy and
off spring birth size (Silvia Pastorino) • 15.05 Relationship between fish intake and type 2 diabetes (Nita Forouhi) • 15.20 Discussion of changing landscape for cross-cohort analysis

This project is funded by the European Union’s Seventh Framework Programme for research, technological development and demonstration under grant agreement no 602068.
Global data for diabetes and obesity research
Matthew Pearce MRC Epidemiology Unit, University of Cambridge, UK Pre-EASD Symposium, Lisbon, 11 September 2017
Resources for data harmonisation – the DAPA toolkit

Diet, Anthropometry and Physical Activity (DAPA) Measurement Toolkit
• www.measurement-toolkit.org
• Web-based resource to facilitate collection and interpretation of dietary, anthropometric and physical activity data
• Assists users when: – using and interpreting existing data – selecting methods that are fit-for purpose when planning new studies

DAPA resources for data harmonisation
1. Inventory of subjective and objective methods
2. Dedicated harmonisation content
3. Instrument library

1 – Inventory of assessment methods Diet Physical activity Anthropometry

1 – Inventory of assessment methods
• Each page contains information on: – What is assessed – How the measurement is conducted – When the method is used – Inferences used to convert raw data into estimates – Strengths and limitations – Considerations for use in different populations
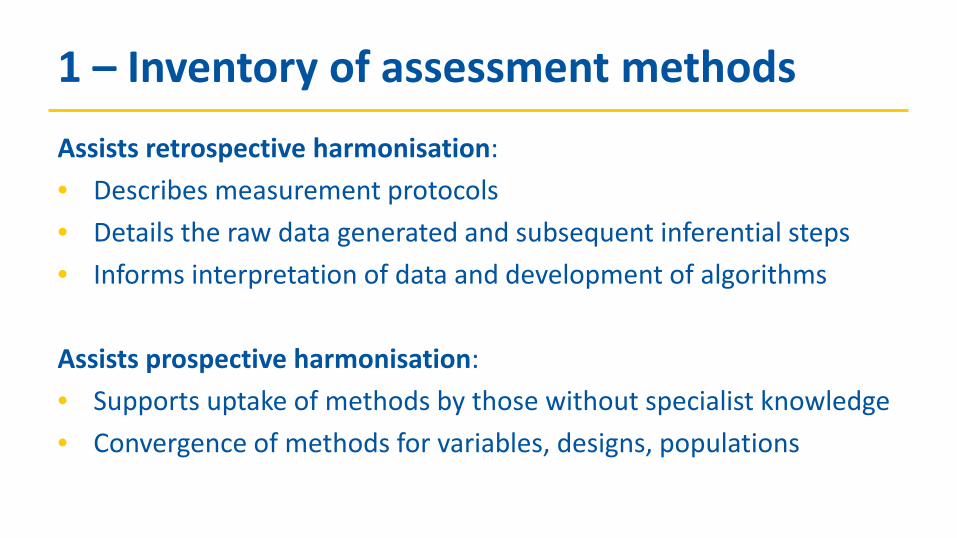
1 – Inventory of assessment methods Assists retrospective harmonisation: • Describes measurement protocols • Details the raw data generated and subsequent inferential steps • Informs interpretation of data and development of algorithms
Assists prospective harmonisation: • Supports uptake of methods by those without specialist knowledge • Convergence of methods for variables, designs, populations

2 – Dedicated harmonisation content • Provides background: what, when, why, how to harmonise?
• Explains key concepts
– Inferential equivalence – Harmonisation vs. standardisation – Retrospective vs. prospective harmonisation
• Links to other harmonisation resources, e.g. Maelstrom Research
• Describes the process of retrospective harmonisation
– Further outlined in 4 case studies
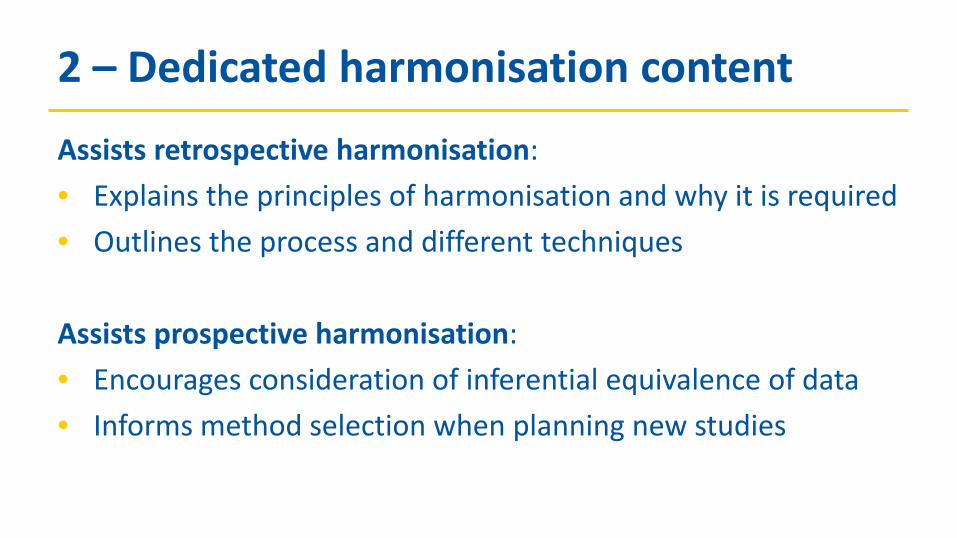
2 – Dedicated harmonisation content
Assists retrospective harmonisation: • Explains the principles of harmonisation and why it is required • Outlines the process and different techniques
Assists prospective harmonisation: • Encourages consideration of inferential equivalence of data • Informs method selection when planning new studies

3 – Instrument library
Instrument specific pages: – Description – Design – Output variables – Resources (e.g. PDF of instrument, processing code) – Reliability/validity literature – Examples of use in research


3 – Instrument library
Assists retrospective harmonisation: • Facilitates access to instruments and related resources
Assists prospective harmonisation: • Discovery of existing instruments and evidence of validity • Access to protocols, user guides and processing code • Avoids unnecessary development of additional instruments

Summary
• The DAPA Measurement Toolkit facilitates both retrospective and prospective harmonisation
• Achieved directly by providing resources which assist interpretation of existing data and planning of new studies
• Also aims to have the broader, more indirect impact of promoting convergence of methods and compatibility of data

Work in progress…. • Search/filter/sort functions for instrument library
• Method types and subtypes • Variables • Populations • Settings
• Web-form for researchers to upload instruments and resources
• Interactive map of relationships between different methods
• Long term goal: integrate instrument library with interactive validity map

Work in progress – validity map
Questionnaire A
Questionnaire B
DLW
Questionnaire C Study 1
Study 2
Accelerometer Study 3
Study 4

Work in progress – validity map
24HRPAR
ActiheartACC
ActiheartACCHRDLW
GT1M
IDEEA
MLTPAS7
RPAQ
RT3
• Network meta-analysis
• Mean difference in PAEE (kJ/kg/day)
• Thicker line = greater difference
• Green lines = direct mapping from published data
• Black lines = indirect mapping from network meta analysis

Acknowledgments Toolkit co-ordination team Fumiaki Imamura, Emanuella De Lucia Rolfe, Soren Brage, Nita Forouhi
Toolkit technical team David Vaughan, Adam Dickinson
Toolkit section contributors Birdem Amoutzopoulos, Tom Bishop, Soren Brage, Emanuella De Lucia Rolfe, Ulf Ekelund,, Anouar Fanidi, Nita Forouhi, Stefanie Hollidge, Fumiaki Imamura, Andy Jones,, Saman Khalatbari-Soltani, Youngwon Kim, Sherly Li, Alexander Mok, Grainne O'Donohue, David Ogilvie, Ken Ong, Jenna Panter, Silvia Pastorino, Matthew Pearce, Richard Powell, Paul Scherer, Alison Sleigh,, Antonia Smith, Marinka Steur, Tammy Tong, Eirini Trichia, Michelle Venables, Laura Watson, Kate Westgate, Tom White, Katrien Wijndaele, Eleanor Winpenny, Zheng Ye, Jusheng Zheng
Toolkit Principal Investigators Nita Forouhi, Soren Brage, Nick Wareham

Global data for diabetes and obesity research
Acknowledgement • This project is funded by the European Union’s Seventh Framework
Programme for research, technological development and demonstration under grant agreement no 602068.
Connect with us • [email protected]
• www.interconnect-diabetes.eu
This project is funded by the European Union’s Seventh Framework Programme for research, technological development and demonstration under grant agreement no 602068.
Global data for diabetes and obesity research
Silvia Pastorino, Career Development Fellow MRC Epidemiology Unit, University of Cambridge, UK
Physical activity during pregnancy and offspring birth size
Why physical activity during pregnancy?
• Potential intervention target to lower the risk for large offspring birth size (LGA and macrosomia)
• In turn, benefits for pregnancy (obstetric) outcomes and longer-term obesity risks (for mother & child)

Systematic reviews: RCTs
• *Two recent meta-analyses of maternal PA interventions suggest modest decreases in birth weight and risk of LGA
• High heterogeneity in effect sizes
• Unable to summarise effects of Volume / Intensity of PA
*Wiebe et al, 2015 *Sanabria-Martínez et al, 2015

Systematic review: Observational Studies Study finding (N) Birth weight
(BW) LGA or
Macrosomia % Body Fat
Negative association 8 8 2 No association 25 5 Positive association 4
• Most studies found no association with BW (continuous outcome) • LTPA associated with lower OR of LGA/Macrosomia, and lower
%Body Fat • 19 of 42 studies did not adjust for any confounder • Discordant associations with high vs. moderate PA volume and
between confounder adjusted vs. non-adjusted studies… *Bison et al, 2016

Association between pregnancy PA and offspring BW – High PA levels

Association between pregnancy PA and offspring BW – Moderate PA levels

Limitations of literature-based reviews • High heterogeneity due to:
– Different consideration of confounding (many studies were unadjusted)
– Different PA exposures: • Different domains: total PA, LTPA, occupational PA
• Different volume or intensity
• Categorisation not standardised
• Different timings of PA during pregnancy
• Publication bias not tested

Alternative approaches • Results sharing
– Burden on study investigators and analysts to prepare and analyse data
– Difficult to harmonise measures across studies
• Data pooling – Study investigators fear loss of ownership of their data
– Complex data-sharing agreements
• Federated meta-analyses – Data stay within the governance structure of the cohorts
– Only analytical instructions and non-identifying summary parameters are allowed to pass between computers

Why use federated meta-analysis? • Allows individual participant-level meta-analysis without physical data pooling
• Reduces heterogeneity by allowing: – Harmonisation of exposure and outcome variables – Consistent consideration of confounders
• Allows investigation of: – Modifying factors – Different PA domains – Shape of the association and thresholds – Timing of the exposure (i.e. PA during early or late pregnancy)
• Avoids publication bias

InterConnect PA in pregnancy exemplar project
Repro_PL
Danish National
Birth Cohort
Amsterdam ABCD
Gecko Drenthe
ALSPAC
Southampton Women’s
Survey
ROLO
Healthy Start Study

Analysis plan • Population:
– Include: Live births, singleton, full term babies – Exclude: Preterm (< 37 weeks gestation), multiple births
• Exposures: – Duration of LTPA – Duration of LT moderate/vigorous physical activity (MVPA) – MET-h/week for LTPA = duration*intensity (coded by Compendium of PAs)
• Outcomes: – Birth weight, BW (g); Macrosomia (BW >4000 g); LGA, large for gestational age
(BW >90th centile) – Ponderal index (BW/Length^3) – %body fat in newborns (by DXA, skinfold thickness, or PeaPod)

DAG
Birth weight Ponderal index
Fetal adiposity Gestational PA
Offspring sex Gestational age
Maternal Age, Education, Parity, Smoking, Alcohol,
Ethnicity, Pre-eclampsia
Offspring Sex Maternal Obesity
Ethnicity GDM
Modifiers
Confounders & other covariates

Study descriptions – birth size outcomes ALSPAC ABCD DNBC GECKO HSS REPRO_PL ROLO SWS N1 9,058 6,464 53,671 1,335 1,054 982 617 1,902 Birth weight, g -Male, mean (SD)
3,551 (479)
3,572 (491)
3,709 (503)
3,708 (505)
3,356 (432)
3,490 (440)
4,135 (481)
3,589 (480)
Birth weight, g -Female, mean (SD)
3,424 (447)
3,435 (456)
3,575 (481)
3538 (490)
3,217 (420)
3,316 (432)
3,963 (423)
3,445 (458)
Macrosomia, n (%) 1,158 (12.7)
871 (13.4)
11,681 (21.7)
289 (21.6)
60 (5.6)
84 (8.5)
320 (51.8)
267 (14)
LGA, n (%)
1,888 (20.8)
1,222 (18.9)
15,052 (28)
405 (30.3)
121 (8.7)
183 (18.6)
381 (61.7)
369 (19.4)
SGA, n (%)
418 (4.6)
311 (4.8)
1,849 (3.4)
59 (6.4)
100 (9.4)
58 (5.9)
5 (0.8)
101 (5.3)
Ponderal Index, median (IQR)
26.2 (24.7-27.8)
24.9 (23.5-26.5)
26.9 (24.9-29.2)
20.2 (18.9- 21.6)
27.1 (25.3-29.3)
27.8 (26.3-29.2)
% body fat3, median (IQR)
10 (8-12)
16 (14-18)
11 (10-13)

Study descriptions – leisure time physical activity
ALSPAC ABCD DNBC GECKO HSS REPRO_PL ROLO SWS
Early pregnancy PA median (IQR)
LTPA (h/w) 4.0 (0.5-5.5)
2.0 (0.5-4.3)
0.0 (0.0-1.0)
3.0 (1.0-5.8)
4.0 (0.0-7.0)
1.7 (1.0-2.3)
6.5 (3.2-11.5)
MVPA (h/w) 4.0 (0.5–5.0)
1.5 (0.0-3.5)
0.0 (0.0-1.0)
1.5 (0.0-3.5)
0.0 (0.0-0.0)
0.3 (0.0-1.0)
1.2 (0.3-3.0)
LTPA EE (Met-h/w) 15.2 (3.0-25.2)
8.1 (1.7-19.3)
0.0 (0.0-6.0)
10.2 (3.1-23.6)
16.5 (0.0-33.0)
4.5 (2.0-7.8)
17.5 (8.7-32.1)
Late pregnancy PA median (IQR)
LTPA (h/w) 0.0 (0.0-1.0)
1.0 (1.0-1.0)
2.0 (0.5-3.6)
5.0 (0.0-8.0)
7.0 (3.4-12.0)
MVPA (h/w) 0.0 (0.0-1.0)
0.3 (0.0-1.0)
0.0 (0.0-1.5)
0.0 (0.0-00.0)
0.8 (0.1-2.3)
LTPA EE (Met-h/w) 0.0 (0.0-3.0)
1.0 (0.0-4.0)
6.3 (1.5-11.9)
19.8 (0.0-33.0)
16.7 (8.5-31.1)

Adjustment for confounding
• Tested models BEFORE and AFTER adjustment for potential confounders (Maternal SES, Age, Parity, Smoking, Alcohol, Ethnicity)
• Adjustment for confounding reduced heterogeneity

BW (grams) Macrosomia LGA Ponderal Index SGA
Unadjusted Beta, 95% CI
I2 RR, 95% CI
I2 RR, 95% CI
I2 Beta, 95% CI
I2 Beta, 95% CI
I2 LTPA (h/w) 0.30 (-3.39, 3.99) 0.99 (0.97, 1.02) 0.99 (0.97, 1.01) 0.00 (-0.02, 0.02) 0.98 (0.96, 1.00)
86% 82% 80% 71% 41% MVPA (h/w) -0.18 (-5.46, 5.09) 1.00 (0.97 1.03) 0.99 (0.97, 1.02) -0.01 (-0.02, 0.01) 0.98 (0.95, 1.01) 86% 82% 81% 37% 47%
Adjusted
LTPA (h/w) -0.86 (-2.33, 0.61) 23%
0.99 (0.98, 1,01) 51%
0.99 (0.98, 1,00) 46%
0.0 (-0.01, 0.01) 0%
0.99 (0.98, 1.01) 0%
MVPA (h/w) -1.38 (-3.77, 1.01) 41%
1.00 (0.98, 1,01) 52%
1.00 (0.98, 1,01) 43%
0.00 (-0.01, 0.01) 0%
0.99 (0.98, 1.00) 0%
Results: Early pregnancy LTPA offspring birth size

Study (weight) Birth weight (g) Beta (95% CI)
Results: Late pregnancy MVPA offspring BW (g)
Adjusted models
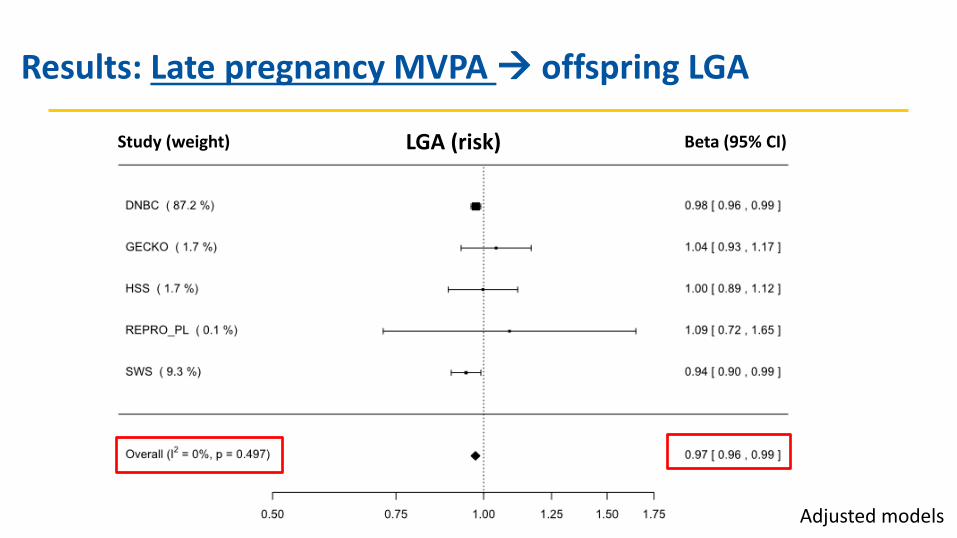
Study (weight) LGA (risk) Beta (95% CI)
Results: Late pregnancy MVPA offspring LGA
Adjusted models

Study (weight) Ponderal Index (kg/m3) Beta (95% CI)
Results: Late pregnancy MVPA offspring Ponderal Index
Adjusted models
Summary
• Heterogeneity between studies was substantially reduced by consistent adjustment for confounders
• Leisure time moderate-vigorous physical activity during late, but not early, pregnancy has a small but significant inverse association with offspring birth size (BW, large BW, ponderal index)
• No association with higher risk of low birth weight (SGA)

This project is funded by the European Union’s Seventh Framework Programme for research, technological development and demonstration under grant agreement no 602068.
Global data for diabetes and obesity research
Silvia Pastorino, Tom Bishop, Sarah R. Crozier, Charlotta Granström, Katarzyna Kordas, Leanne K. Küpers, Eileen O'Brien, Kinga Polanska,
Katherine A Sauder, Mohammad Hadi Zafarmand, Becca Wilson, Paul R. Burton, Eva Corpeleijn, Dana Dabelea, Wojciech Hanke, Hazel M. Inskip, Fionnuala McAuliffe, Sjurdur Frodi Olsen, Tanja G. Vrijkotte, Soren Brage,
Aileen Kennedy, Donal O'Gorman, Paul Scherer, Katrien Wijndaele, Nick J. Wareham, Gernot Desoye, Ken K. Ong
www.InterConnect-diabetes.eu

Global data for diabetes and obesity research
Acknowledgement • This project is funded by the European Union’s Seventh Framework
Programme for research, technological development and demonstration under grant agreement no 602068.
Connect with us • [email protected]
• www.interconnect-diabetes.eu

This project is funded by the European Union’s Seventh Framework Programme for research, technological development and demonstration under grant agreement no 602068.
Global data for diabetes and obesity research
Nita Forouhi, Silvia Pastorino and the InterConnect Team MRC Epidemiology Unit 11th September 2017
Fish intake and new-onset type 2 diabetes

What is known • It is proposed that fish intake is likely to be beneficial for the prevention of
type 2 diabetes, based on the benefits for cardiovascular health Meta analyses of fish and type 2 diabetes

Fish and T2D: Location matters
Per serving/week
Wallin A Diabetes Care, 2012, 35:
Per 100 g/d
Wu HY BJN 2012, 107:

What are the research gaps?
• Systematic reviews analysed total fish and did not distinguish between types of fish (e.g. fatty fish, lean fish and shellfish) or cooking methods;
• Systematic reviews did not include unpublished results • High heterogeneity in meta-analyses might be caused by:
– Different confounding structures of included studies – Different fish exposures (portions sizes varied across studies)
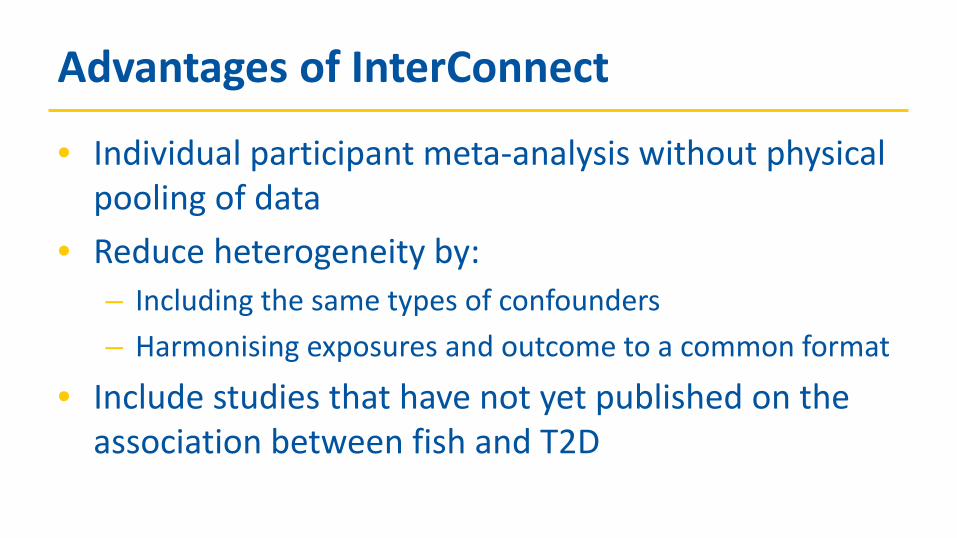
Advantages of InterConnect
• Individual participant meta-analysis without physical pooling of data
• Reduce heterogeneity by: – Including the same types of confounders – Harmonising exposures and outcome to a common format
• Include studies that have not yet published on the association between fish and T2D

Whitehall II
Swedish Mammography Cohort (SMC) & Cohort of Swedish Men (COSM)
Hoorn
Zutphen Elderly
InterAct (8 countries)
Finnish Mobile Clinic Health Examination (FMC)
ELSA Brazil
SUN Project
Norwegian Women and Cancer Study
(NOWAC)
Japan Public Health Center-based
Prospective study (JPHC)
Nutrition and Health of Aging Population in
China China Kadoorie Biobank
(CKB)
Australian Diabetes Obesity and Lifestyle
Study (AusDiab)
Atherosclerosis Risk in Communities Study (ARIC)
Coronary Artery Risk Development in Young
Adults (CARDIA)
Multi-Ethnic Study of Atherosclerosis (MESA)
Puerto Rico Heart Health Program (PRHHP)
Women Health Initiative (WHI)
Cardiovascular Health Study (CHS)
Map of participating studies
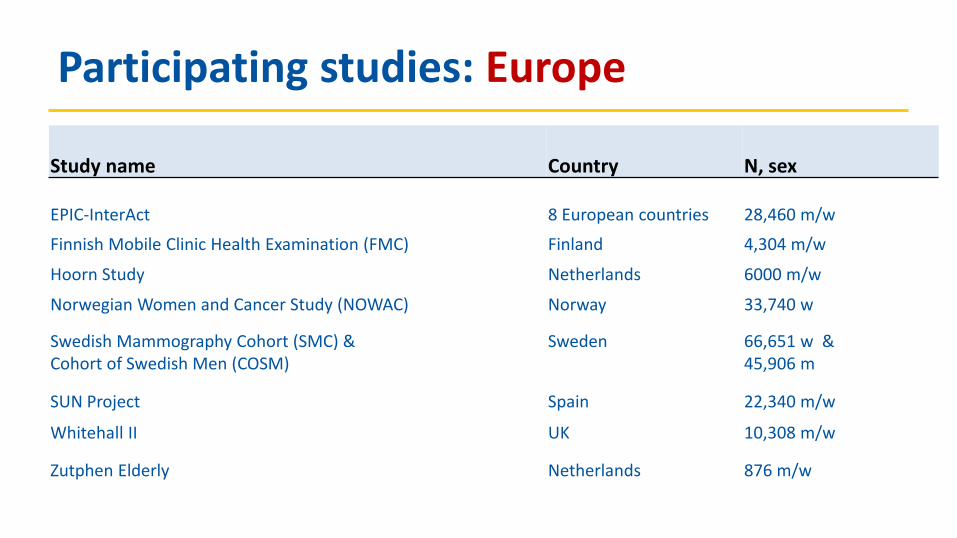
Participating studies: Europe Study name
Country
N, sex
EPIC-InterAct 8 European countries 28,460 m/w
Finnish Mobile Clinic Health Examination (FMC) Finland 4,304 m/w
Hoorn Study Netherlands 6000 m/w
Norwegian Women and Cancer Study (NOWAC) Norway 33,740 w
Swedish Mammography Cohort (SMC) & Cohort of Swedish Men (COSM)
Sweden 66,651 w & 45,906 m
SUN Project Spain 22,340 m/w
Whitehall II UK 10,308 m/w
Zutphen Elderly Netherlands 876 m/w

Participating studies: Asia and Australia Study name
Country
N, sex
The Australian Diabetes Obesity and Lifestyle Study (AusDiab) Australia 6537 m/w
Japan Public Health Center-based Prospective study (JPHC) Japan 52,680 m/w
Nutrition and Health of Aging Population in China China 4,526 m/w
China Kadoorie Biobank China >500,000 m/w

Participating studies: North and South America Study name
Country
N, sex
Atherosclerosis Risk in Communities Study (ARIC) US 15,792 m/w
Cardiovascular Health Study (CHS) US 5,210 m/w
Coronary Artery Risk Development in Young Adults (CARDIA) US 5,115 m/w
Multi-Ethnic Study of Atherosclerosis (MESA) US 6,814 m/w
Puerto Rico Heart Health Program (PRHHP)
US 9,824 m
Women Health Initiative (WHI)
US 93,676 w
ELSA Brazil Brazil 15,105 m/w

Exposure: harmonised variables • Total fish • Fatty/oily fish (EPIC classification: fat content > 4%) • Lean fish • Fried fish • Shellfish (crustaceans and molluscs) • Saltwater fish • Freshwater fish • Smoked or salted fish Units:
– Harmonised to g/day; results presented as 120g serving/week

Outcome: harmonised variables Primary outcome: clinically incident type 2 diabetes A confirmed clinical case is considered as fulfilling any one or more of the following criteria:
• ascertained by linkage to a registry or medical record, OR
• self-report of physician diagnosis or use of antidiabetic medication verified by at least
one additional source including:
– a) linkage to a registry or medical record, OR
– b) biochemical measurement (glucose or HbA1c), OR
– c) if validated in a validation study with high concordance

Outcome: harmonised variables
Secondary outcome: incident type 2 diabetes Presence of any of the following criteria:
• self-report of physician diagnosis or use of antidiabetic medication (reported or confirmed
use of medication), OR
• ascertained by linkage to a registry or medical record, OR
• biochemical measurement (glucose or HbA1c)

Confounders Demographic:
– Age – education (highest educational level or years of education)
Lifestyle: – Smoking (mostly equivalent to smoking history: current, never, former) – Physical activity – Alcohol (g/d or categorical variables)
Health: – BMI; Waist circumference – Family history of diabetes – Co-morbidity (diagnosed with: MI OR stroke OR cancer OR hypertension)
Dietary: – Total energy intake; Fibre – Red and processed meat; Fruits; Vegetables; Sugary beverages – Fish-oil supplement
Title of slide
• Bullet – Secondary text
• Tertiary text
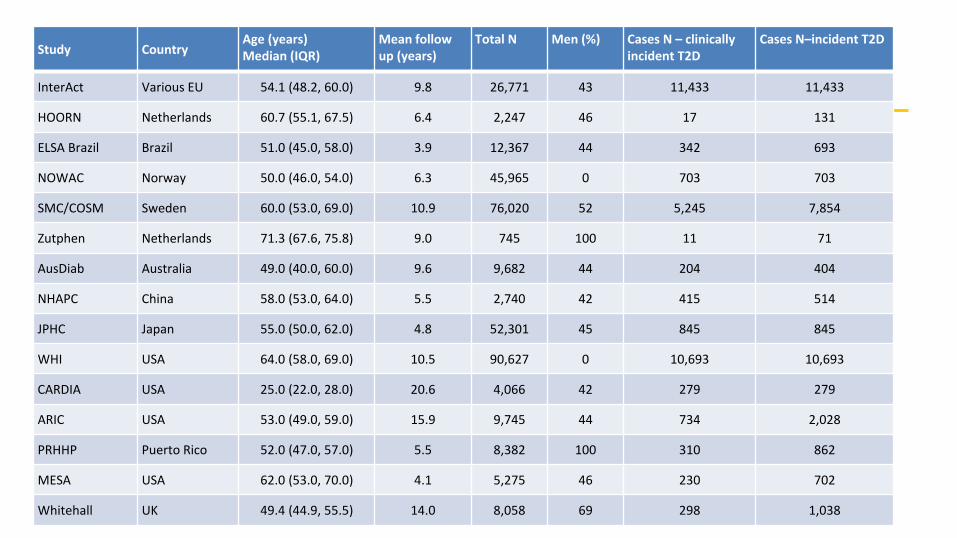
Study Country Age (years) Median (IQR)
Mean follow up (years)
Total N Men (%) Cases N – clinically incident T2D
Cases N–incident T2D
InterAct Various EU 54.1 (48.2, 60.0) 9.8 26,771 43 11,433 11,433
HOORN Netherlands 60.7 (55.1, 67.5) 6.4 2,247 46 17 131
ELSA Brazil Brazil 51.0 (45.0, 58.0) 3.9 12,367 44 342 693
NOWAC Norway 50.0 (46.0, 54.0) 6.3 45,965 0 703 703
SMC/COSM Sweden 60.0 (53.0, 69.0) 10.9 76,020 52 5,245 7,854
Zutphen Netherlands 71.3 (67.6, 75.8) 9.0 745 100 11 71
AusDiab Australia 49.0 (40.0, 60.0) 9.6 9,682 44 204 404
NHAPC China 58.0 (53.0, 64.0) 5.5 2,740 42 415 514
JPHC Japan 55.0 (50.0, 62.0) 4.8 52,301 45 845 845
WHI USA 64.0 (58.0, 69.0) 10.5 90,627 0 10,693 10,693
CARDIA USA 25.0 (22.0, 28.0) 20.6 4,066 42 279 279
ARIC USA 53.0 (49.0, 59.0) 15.9 9,745 44 734 2,028
PRHHP Puerto Rico 52.0 (47.0, 57.0) 5.5 8,382 100 310 862
MESA USA 62.0 (53.0, 70.0) 4.1 5,275 46 230 702
Whitehall UK 49.4 (44.9, 55.5) 14.0 8,058 69 298 1,038

Title of slide
• Bullet – Secondary text
• Tertiary text
Study Dietary assessment method
Total Fish Median (IQR)
Lean Median (IQR)
Fatty Median (IQR)
Fried Median (IQR)
InterAct FFQ 32.3 (19.0, 51.0) 10.2 (4.6, 20.1) 6.9 (2.2, 14.3) 2.6 (0.8, 5.5)
HOORN FFQ 12.0 (1.0, 27.0) 3.6 (0.0, 10.0) 1.0 (0.0, 9.0) 0.0 (0.0, 0.0)
ELSA Brazil FFQ 33.0 (18.0, 58.0) N/A N/A 0.0 (0.0, 13.0)
NOWAC FFQ 87.3 (57.6, 126.0) 23.7 (11.0, 42.9) 11.4 (4.2, 21.5) N/A
SMC/COSM FFQ 29.0 (19.0, 41.0) 10.0 (8.0, 25.0) 10.0 (6.0, 15.0) 16.4 (8.2, 16.4)
Zutphen Cross-check dietary history 13.0 (0.0, 27.0) 9.0 (0.0, 18.0) 0.0 (0.0, 8.0) 0.0 (0.0, 14.0)
AusDiab FFQ 25.3 (13.5, 44.0) N/A N/A 3.2 (1.2, 10.8)
NHAPC Open-ended FFQ 26.6 (9.6, 55.0) N/A N/A N/A
JPHC FFQ 78.8 (49.8, 120.7) 8.0 (4.0, 19.3) 27.1 (15.3, 48.3) N/A
WHI FFQ 23.0 (11.8, 40.8) 3.9 (0.0, 9.2) 0.0 (0.0, 5.9) 0.0 (0.0, 3.9)
CARDIA Diet history interview 34.5 (9.2, 80.5) 18.4 (0.0, 46.0) 0.0 (0.0, 0.0) 0.0 (0.0, 0.0)
ARIC FFQ interview 60.1 (38.4, 96.4) 7.7 (1.9, 16.4) 7.7 (7.7, 16.4) N/A
PRHHP FFQ 0.0 (0.0, 0.0) N/A N/A N/A
MESA FFQ 23.6 (11.0, 46.6) 1.7 (0.0, 9.2) 3.5 (0.0, 9.2) 3.5 (0.0, 9.2)
Whitehall FFQ 35.0 (17.5, 52.5) 17.5 (8.8, 26.3) 8.8 (0.0, 17.5) 0.0 (0.0, 8.8)

RESULTS– Model 1: Total fish adjusted for age, sex, education, smoking, physical activity, BMI, co-morbidities
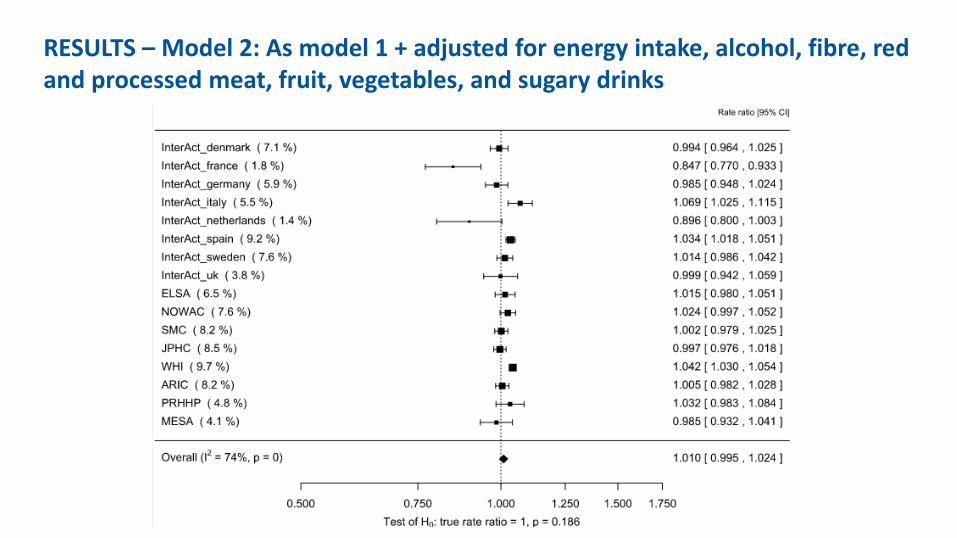
RESULTS – Model 2: As model 1 + adjusted for energy intake, alcohol, fibre, red and processed meat, fruit, vegetables, and sugary drinks

RESULTS – Model 2 using secondary outcome (incident T2D)
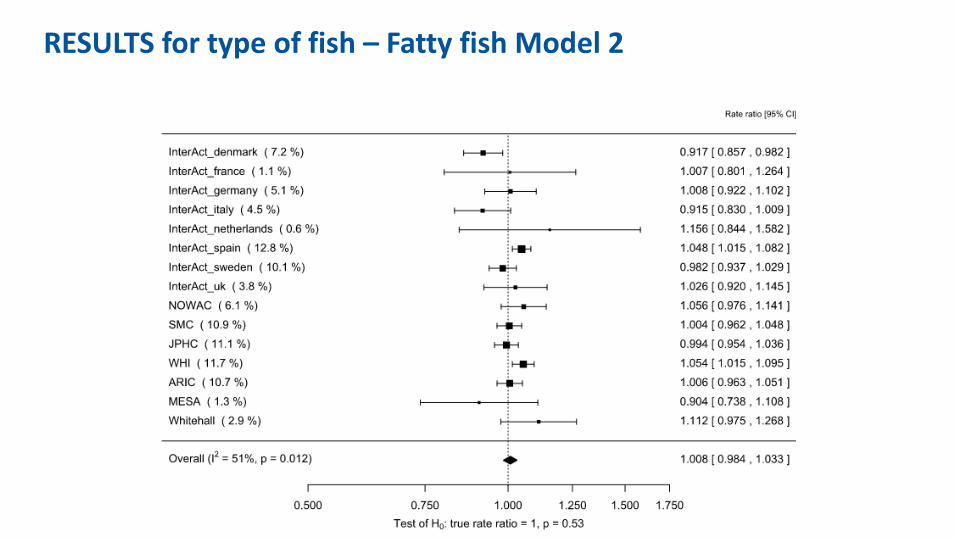
RESULTS for type of fish – Fatty fish Model 2
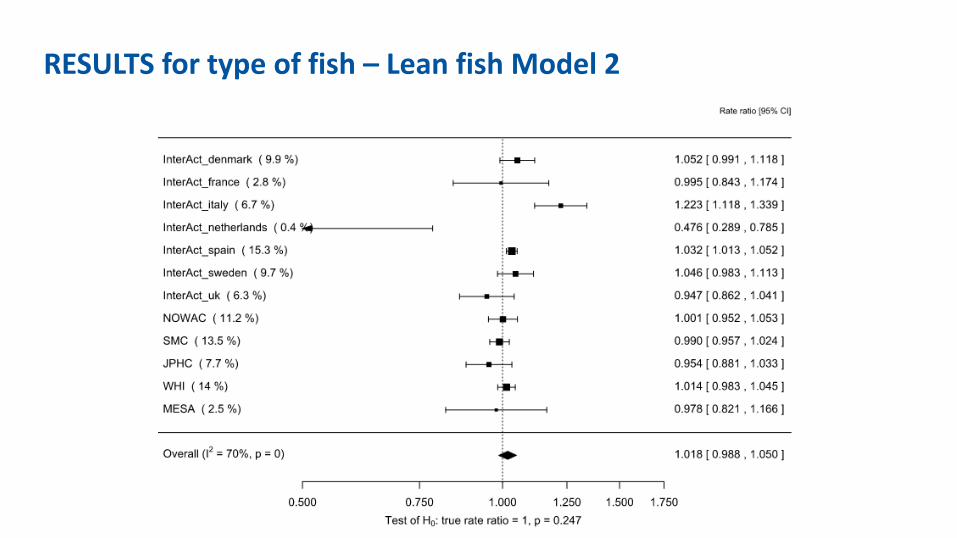
RESULTS for type of fish – Lean fish Model 2

RESULTS for type of fish – Fried fish Model 2

RESULTS stratified by geographical location – Model 1 WESTERN
CENTRAL
EASTERN
Rate ratio [95%CI]

RESULTS stratified by geographical location – Model 1 WESTERN
CENTRAL
EASTERN
Rate ratio [95%CI]
• Heterogeneity reduced in Western and Eastern countries
• Risk increased in US countries
Summary
• No association between total fish, types of fish (fatty and lean) or cooking method (fried fish) and type 2 diabetes

Summary – effect of geographic location
• Heterogeneity was reduced when results stratified by geographical location (I2=35% for US, I2=54% among Eastern countries)
• Higher T2D risk among US studies (HR for 120g/week=1.015, p=0.01)
• Null associations for European countries • Tendency for lower risk among Asian countries but not
Australia

Next Steps
• More studies will be added to the analyses: – China Kadoorie Biobank (China), N>500,000 m/w – Shanghai Women’s Health Study (China), N>70,000 w – SUN Project (Spain), N=22,340 m/w – Finnish Mobile Clinic Health Examination (Finland), N=4,304 m/w
• Sensitivity analyses: – Models including waist circumference, family history of diabetes and fish
oil supplements – Test interaction for sex and BMI
Global data for diabetes and obesity research
Acknowledgement • This project is funded by the European Union’s Seventh Framework
Programme for research, technological development and demonstration under grant agreement no 602068.
Connect with us • [email protected]
• www.interconnect-diabetes.eu

RESULTS for highest quartile of total fish intake compared to lowest quartile

Exclusions Exclude: • Type 2 diabetes prevalent cases (i.e. cases at baseline) • Energy intake misreporters :
– <500 or >3500 kcal/d for women – <800 or >4,200 kcal/d for men
• Type 1 diabetes cases • Those with missing values for any of the variables (complete case analysis)

Changing the landscape for cross-cohort analysis
• Creating change requires many actors – Researchers – to see need, think useful, demonstrate value – Stakeholders who are users of research evidence – create pull – Funders – infrastructure, incentives for re-use of data

InterConnect focus on researchers
• Researchers – to see need, think useful, demonstrate value
Research driven ‘Exemplar projects’
1. PA in pregnancy and neonatal anthropometric outcomes 2. Fish intake and risk of type 2 diabetes
3. Additional diet-related research questions 4. Birthweight and childhood central fat deposition

Wider pull beginning?
• EU Child Cohort Network • Data sharing platform based on
federated meta-analysis using DataSHIELD

Global data for diabetes and obesity research
Acknowledgement • This project is funded by the European Union’s Seventh Framework
Programme for research, technological development and demonstration under grant agreement no 602068.
Connect with us • [email protected]
• www.interconnect-diabetes.eu