global construction outlook - ihs · pdf file• powerhouse of global growth: 2002–06...
TRANSCRIPT

Global Construction Outlook
Scott HazeltonDirector of Construction Services

Copyright © 2008 Global Insight, Inc. 2
Global Shock Waves
• The “double-shock” world economy— subprime crisis plus record-high oil prices
• Crisis status—we are not out of the woods yet• Global transmission of crisis—no de-coupling• Crisis management—shifting into high gear• Global inflation—how big of a threat?• Weaker growth in the developed economies…
…Means that emerging markets will eventually slow as well
• The risks are predominantly on the downside

Copyright © 2008 Global Insight, Inc. 3
-2
-1
0
1
2
3
4
5
6
1990 1992 1994 1996 1998 2000 2002 2004 2006 2008 2010 2012
Perc
ent c
hang
e
Real GDPIndustrial Production
The World’s Economic Expansion Is Slowing
Copyright © 2008 Global Insight, Inc. 4
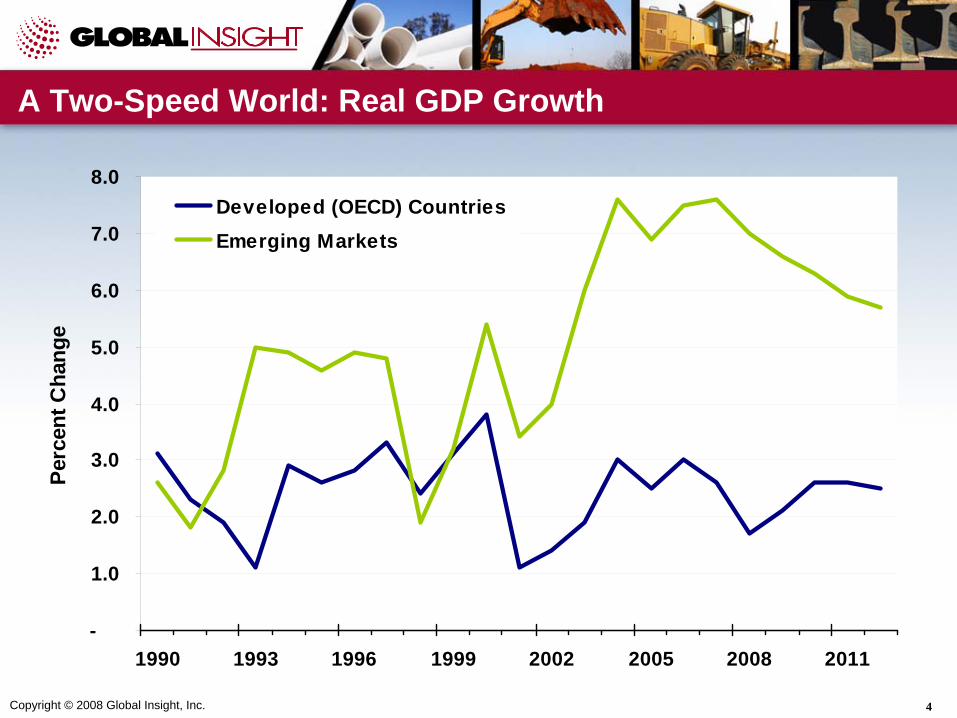
-
1.0
2.0
3.0
4.0
5.0
6.0
7.0
8.0
1990 1993 1996 1999 2002 2005 2008 2011
Perc
ent C
hang
e
Developed (OECD) CountriesEmerging Markets
A Two-Speed World: Real GDP Growth

Copyright © 2008 Global Insight, Inc. 5
Wide Variations in Regional Economic Growth
0
1
2
3
4
5
6
7
8
9
NAFTA WesternEurope
Japan OtherAsia
EmergingEurope
Mideast -N. Africa
OtherAmericas
Rea
l GD
P, P
erce
nt c
hang
e
20062007200820092010

Copyright © 2008 Global Insight, Inc. 6
Source: OECD
Output Gaps Show Little Spare Capacity
-4
-3
-2
-1
0
1
2
3
4
5
1990 1993 1996 1999 2002 2005
Gap
as
Perc
ent o
f Pot
entia
l Rea
l GD
P
Total OECDUnited StatesEurozoneJapan

Copyright © 2008 Global Insight, Inc. 7
0.0
0.5
1.0
1.5
2.0
2.5
3.0
3.5
4.0
4.5
1999 2000 2001 2002 2003 2004 2005 2006 2007 2008 2009 2010
Rea
l GD
P, P
erce
nt c
hang
e
Eurozone
Eurozone: Real GDP Growth

Copyright © 2008 Global Insight, Inc. 8
0.0
0.5
1.0
1.5
2.0
2.5
3.0
3.5
4.0
4.5
France Germany Italy Spain U.K.
Rea
l GD
P, P
erce
nt c
hang
e
20062007200820092010
Real GDP Growth Rates Vary Across Europe

Copyright © 2008 Global Insight, Inc. 9
Asia: Cyclical Peak
• Powerhouse of global growth: 2002–06 average growth 7.0%; 8.0% in 2007 (excl. Japan)
• BOP positions have strengthened, debt burdens have eased, strong fiscal positions more resilience to shocks
• Big plus: investment and private consumption are finally recovering
• Slowdown will be moderate, but risks have increased• No true “de-coupling”• Inflation is a problem: currency appreciation a better
policy option than interest rate hikes

Copyright © 2008 Global Insight, Inc. 10
Japan: Sluggish Growth Ahead
0.0
0.5
1.0
1.5
2.0
2.5
3.0
2004 2005 2006 2007 2008 2009 2010 2011
Rea
l GD
P, P
erce
nt c
hang
e
Japan

Copyright © 2008 Global Insight, Inc. 11
Real GDP Growth in Asia-Pacific Economies
0.0
2.0
4.0
6.0
8.0
10.0
12.0
China India South Korea Australia Taiwan
Rea
l GD
P, P
erce
nt c
hang
e
20062007200820092010

Copyright © 2008 Global Insight, Inc. 12
Real GDP Growth in Asia-Pacific Economies
0.0
1.0
2.0
3.0
4.0
5.0
6.0
7.0
8.0
9.0
Indonesia Hong Kong Malaysia Singapore Philippines Thailand
Rea
l GD
P, P
erce
nt c
hang
e
20062007200820092010

Copyright © 2008 Global Insight, Inc. 13
China: The “Double Squeeze”
• Economy could be squeezed domestically and externallyMonetary policy tightening has startedExports to the United States already slowing
• Policy dilemma—exports and investment/inflation in different phases of cycle, and require countering policies
• Without inflation risk, Beijing is willing to continue loose monetary policy to cushion the impact of sliding exports
• Asset bubbles may also be a threat• Risks of a boom-bust are still 35% to 40%

Copyright © 2008 Global Insight, Inc. 14
-5
0
5
10
15
20
25
1980 1983 1986 1989 1992 1995 1998 2001 2004 2007 2010
Perc
ent C
hang
e
Real GDPGDP Deflator
China’s Current Business Cycle Is Relatively Mild

Copyright © 2008 Global Insight, Inc. 15
Emerging Europe: Robust Despite Deteriorating External Environment
• While exports have been supportive, domestic demand has been driving output growth
• Central Europe continues to expand share of key Western European markets as FDI boosts export capacity, productivity
• Baltics, Balkans show signs of overheating; tighter global credit conditions could help orchestrate a softer landing
• Russia, other energy exporters in CIS riding world market oil prices. Domestic demand will continue to grow rapidly, but surging imports trimming external surpluses

Copyright © 2008 Global Insight, Inc. 16
Real GDP Growth in Emerging Europe
0.0
1.0
2.0
3.0
4.0
5.0
6.0
7.0
8.0
9.0
Russia Turkey Poland CzechRepublic
Hungary Romania
Rea
l GD
P, P
erce
nt c
hang
e
20062007200820092010

Copyright © 2008 Global Insight, Inc. 17
Latin America: One Region, Two Stories
• Mexico, Central America, and Colombia: the United States is their main trading partner
• Rest of South America: a commodities storyStrong demand from the rest of the world will continue to support high growth rates in an environment of relative capital intensive exports
• The Latin American region is now better prepared to avoid crisis contagion…
• …But while the vulnerability to external finance is less, the vulnerability to external demand is substantial
• Parts of the region are vulnerable to a China hard landing

Copyright © 2008 Global Insight, Inc. 18
Real GDP Growth in Latin America
0.0
2.0
4.0
6.0
8.0
10.0
12.0
Argentina Brazil Chile Colombia Mexico Peru Venezuela
Rea
l GD
P, P
erce
nt c
hang
e
2006 2007 20082009 2010

Copyright © 2008 Global Insight, Inc. 19
Middle East / North Africa — Maybe a Bust, But Not Now
• MENA’s current economic boom will not falter this year—it is actually intensifying
• Even an oil crash will not immediately affect the region’s economy, thanks to improved fundamentals
• However, the boom has strained the economy’s capacity, leading to increasingly severe overheating
• Sectors hurt most by capacity limits: energy, utilities, housing, construction, and manufacturing
• The boom may be headed for a bust, but not in 2008

Copyright © 2008 Global Insight, Inc. 20
MENA Fiscal Balances Are Strongly Positive…
-18
-13
-8
-3
2
7
12
1990 1993 1996 1999 2002 2005 2008
Fisc
al b
alan
ce, (
Per
cent
of G
DP)
Middle East & North AfricaMiddle EastNorth Africa

Copyright © 2008 Global Insight, Inc. 21
Large External Assets Can Cushion Any Oil Price Shock…
0.00
0.25
0.50
0.75
1.00
1.25
1.50
1.75
1990 1992 1994 1996 1998 2000 2002 2004 2006 2008
MEN
A E
xter
nal A
sset
Sto
cks,
(tril
lions
of U
.S. d
olla
rs)
MENA, External Asset Stocks

Copyright © 2008 Global Insight, Inc. 22
Region is Overheating, Making a Boom-Bust Worrisome
0
1
2
3
4
5
6
7
8
9
10
2000 2001 2002 2003 2004 2005 2006 2007
CPI
Infla
tion,
(per
cent
)
MENAMiddle EastNorth Africa

Copyright © 2008 Global Insight, Inc. 23
Real GDP Growth in the Middle East and Africa
0.0
2.0
4.0
6.0
8.0
10.0
12.0
Saudi Arabia South Africa Iran UAE Israel Nigeria
Rea
l GD
P, P
erce
nt c
hang
e
20062007200820092010

Copyright © 2008 Global Insight, Inc. 24
Total Construction Regional Review
50
100
150
200
250
300
350
1997 2000 2003 2006 2009 2012
Inde
x, 1
998
= 10
0
WorldAsiaNon-Japan AsiaWestern EuropeEastern EuropeNorth AmericaSouth AmericaMiddle East & Africa

Copyright © 2008 Global Insight, Inc. 25
Asia is Gaining Share from Developed Countries
Asia46%
South America
5%
Western Europe
23%
Eastern Europe
4%
North America
18%
Middle East & Africa
4%Asia39%
South America
5%
Western Europe
28%
Middle East & Africa
4%
North America
21%
Eastern Europe
3%
2007 2017

Copyright © 2008 Global Insight, Inc. 26
Circle Size = Total Nominal Construction Spending in 2006
United StatesJapan
China
Germany
United Kingdom
Italy
France
Spain
Canada
Netherlands
MexicoAustralia
South Korea
Russia
Brazil
India
-2%
0%
2%
4%
6%
8%
10%
12%
14%
5 10 15 20 25 30 35 40 45 50
Construction Risk Score - 5 Year
Tota
l Con
stru
ctio
n Sp
endi
ng G
row
th
(Rea
l 200
0 U
.S. D
olla
rs, C
AG
R %
, 200
7-20
12)
Med
ian
Con
stru
ctio
n R
isk
Average Global Construction Growth
Construction Risk-Reward Outlook

Copyright © 2008 Global Insight, Inc. 27
Total Construction Spending 2000 US$ Billions
2006Growth % 2007-2008
Growth % 2008-2009
Growth, CAGR % 2007-2012
United States 831.4 (-8.8%) +2.4% +2.2%
Japan 771.9 +0.4% +1.2% +1.1%
China 418.2 +16.5% +9.2% +9.2%
United Kingdom 263.5 +0.2% +1.7% +2.7%
France 178.3 +2.2% +2.6% +2.7%
Germany 168.8 +1.4% +1.9% +1.6%
Spain 155.5 +1.7% +1.0% +1.4%
Italy 141.7 (-0.1%) +0.9% +0.8%
Korea 126.0 +2.7% +2.7% +3.3%
Canada 116.9 +0.8% +1.7% +2.8%
India 113.3 +9.9% +9.6% +9.4%
Brazil 94.6 +5.6% +4.2% +4.6%
Mexico 72.7 +5.6% +6.6% +6.1%
Australia 71.5 +4.6% +4.9% +5.1%
Netherlands 58.0 +1.8% +1.9% +1.8%
Saudi Arabia 53.9 +6.7% +5.5% +5.7%
68 Country Total 4,399.3 +2.5% +3.9% +3.9%
Total Real Construction Spending Growth2000 US$
Top 15 Countries by Construction Spending

Copyright © 2008 Global Insight, Inc. 28
Top 15 Countries by Construction Growth
Total Construction Spending 2000 US$ Billions
2006Growth % 2007-2008
Growth % 2008-2009
Growth, CAGR % 2007-2012
Vietnam 11.5 +14.8% +15.0% +14.5%Romania 8.2 +15.6% +12.0% +12.1%Panama 1.8 +9.2% +8.2% +10.1%Venezuela 26.2 +13.5% +10.3% +9.7%India 113.3 +9.9% +9.6% +9.4%China 418.2 +16.5% +9.2% +9.2%Colombia 13.2 +11.8% +9.4% +8.6%Russia 41.6 +11.4% +8.4% +8.4%Senegal 0.9 +8.5% +8.2% +8.1%Peru 8.0 +13.8% +10.1% +8.1%United Arab Emirates 29.2 +11.8% +6.9% +7.8%Tunisia 4.1 +7.3% +7.8% +7.7%Iran 16.7 +8.3% +7.6% +7.1%Indonesia 41.5 +7.4% +7.0% +6.6%Chile 14.1 +6.7% +6.8% +6.5%
68 Country Total 4,399.3 +2.5% +3.9% +3.9%
Total Real Construction Spending Growth2000 US$

Copyright © 2008 Global Insight, Inc. 29
Total Construction Growth by Region
3.2%
2.1%
5.9%
6.0%
6.5%
5.3%
9.3%
3.9%
0.0% 2.0% 4.0% 6.0% 8.0% 10.0%
North America
Western Europe
Middle East & Africa
Eastern Europe
Asia
South America
Non-Japan Asia
World
Compound Annual Growth 2007-2012 (Percent)

Copyright © 2008 Global Insight, Inc. 30
Total Construction Growth Looks Strong
0%
1%
2%
3%
4%
5%
6%
7%
Total NonresidentialStructures
Infrastructure Residential
Com
poun
d A
nnua
l Gro
wth
(Per
cent
)
2002-072007-122012-17

Copyright © 2008 Global Insight, Inc. 31
Nonresidential Growth Outlook is Mixed
0%
1%
2%
3%
4%
5%
6%
7%
8%
9%
NonresidentialStructures
Office Commercial Institutional Industrial
Com
poun
d A
nnua
l Gro
wth
(Per
cent
) 2002-072007-122012-17
Copyright © 2008 Global Insight, Inc. 32
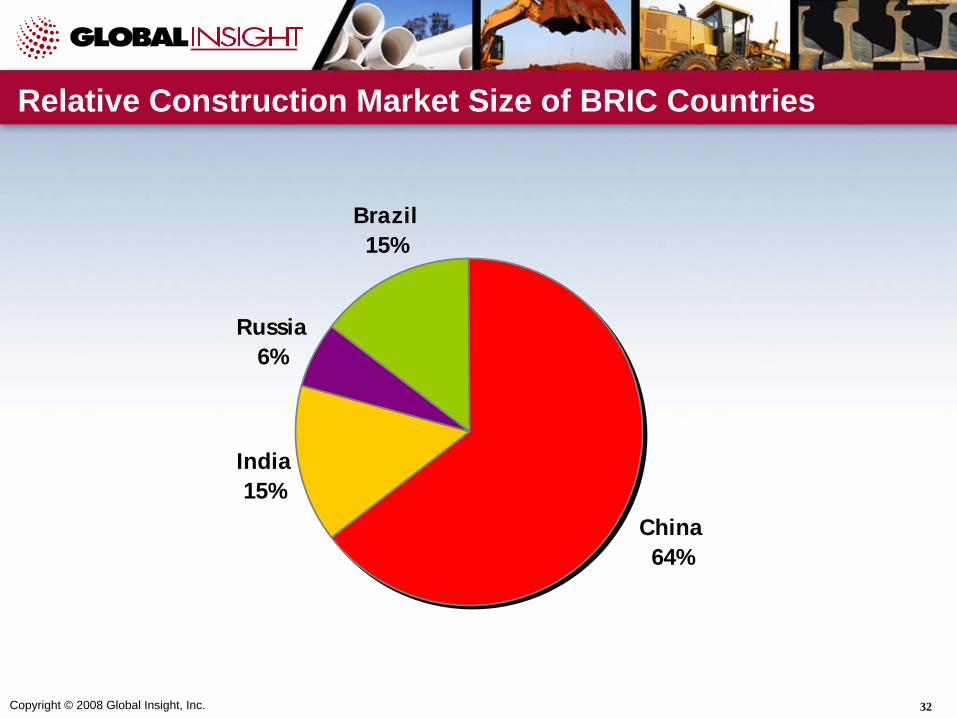
Relative Construction Market Size of BRIC Countries
India15%
China64%
Brazil15%
Russia6%
Copyright © 2008 Global Insight, Inc. 33
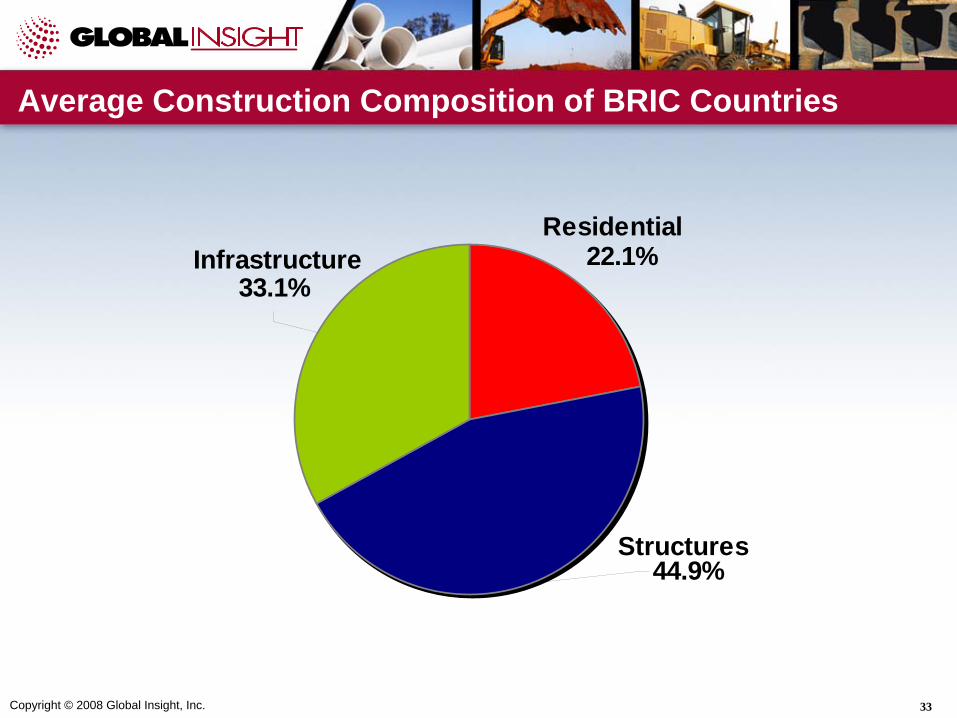
Average Construction Composition of BRIC Countries
22.1%33.1%
44.9%
InfrastructureResidential
Structures

Copyright © 2008 Global Insight, Inc. 34
25%39%
15% 21%
Industrial
Commercial
OfficeInstitutional12%10%
66%
12%
Industrial
Commercial
OfficeInstitutional
10%13%
49%
28%
Industrial
Commercial
OfficeInstitutional
15%44%
25%
16%
Industrial Commercial
Office
Institutional
Composition of Nonresidential Structures
China
India
Brazil
Russia

Copyright © 2008 Global Insight, Inc. 35
Relative Construction Market Size of GCC Countries
Saudi Arabia
55%
Bahrain2%
Qatar4%
United Arab
Emirates31%
Oman2%
Kuwait6%
Copyright © 2008 Global Insight, Inc. 36
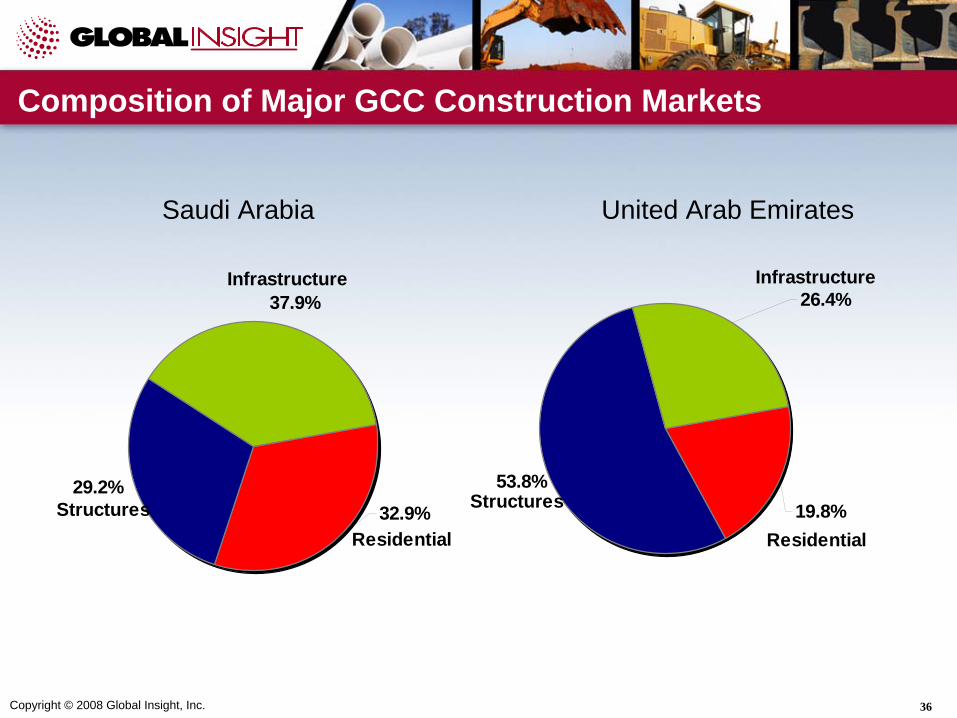
37.9%
32.9%29.2%
Infrastructure
ResidentialStructures
26.4%
53.8%19.8%
Infrastructure
Residential
Structures
Composition of Major GCC Construction Markets
Saudi Arabia United Arab Emirates

Copyright © 2008 Global Insight, Inc. 37
16%
26%
39%
18%
Industrial
Commercial
Office
Institutional
17%
22%
47% 15%
IndustrialCommercial
Office
Institutional
Relative Construction Market Size of GCC Countries
Saudi Arabia United Arab Emirates
Kuwait
16%21%
34%
28%Industrial Commercial
OfficeInstitutional

Copyright © 2008 Global Insight, Inc. 38
Composition of Major GCC Infrastructure Markets
26%
43%
31%Transportation
Energy
Water/Sewer
Saudi Arabia United Arab Emirates
64%
24%12%Transportation
Energy
Water/Sewer

Thank You
Scott HazeltonDirector of Construction Services
E-mail: [email protected]
Presentations are available for download at www.globalinsight.com/events/2008ConstructionChicago