global climate change and children - world … · · 2015-12-21for which you are using this...
TRANSCRIPT

1
1
GLOBAL CLIMATE CHANGE
& CHILD HEALTH
TRAINING FOR THE HEALTH SECTORTRAINING FOR THE HEALTH SECTOR[Date [Date ……Place Place ……EventEvent……SponsorSponsor……Organizer]Organizer]
Children's Health and the EnvironmentWHO Training Package for the Health Sector
World Health Organization
www.who.int/ceh
<<NOTE TO USER: Please add details of the date, time, place and sponsorship of the meeting for which you are using this presentation in the space indicated.>>
<<NOTE TO USER: This is a large set of slides from which the presenter should select the most relevant ones to use in a specific presentation. These slides cover many facets of the problem. Present only those slides that apply most directly to the local situation in the region. It is also very useful if you present regional/local examples of both climate change related health threats and solutions, both adaptation and mitigation.>>

2
2
Global Climate Change and Child HealthGlobal Climate Change and Child Health
�To understand the unique nature of human impact
on the global environment in the 21st Century with
an emphasis on global climate change
�To understand the health consequences to
children from global climate change
�To explore multi-stakeholder, multi-sector
strategies for protecting children's health, now and
in the future, from global climate change
OBJECTIVESOBJECTIVES
<<READ SLIDE>>

3
3
Global Climate Change and Child HealthGlobal Climate Change and Child Health
OUTLINE OUTLINE
�Setting the stage
�Major human trends
�Human impact on global environment
�Climate change as imminent threat
�Effects on children from
�Global climate change
�Prevention and protection of health
UN Special Session on Children
WHO
<<NOTE TO USER: This presentation has three parts. The first part is general and sets the stage by discussing major trends in human activities and their broad impact on the global environment and human health. The second part concentrates climate change as one of the most immanent global public health threats. The last part discusses actions from international to individual level which are needed to protect children’s health in a world of ongoing global environmental changes.>>
Pictures:
•UN Special Session on Children (010321e)
•WHO

4
4
Global Climate Change and Child HealthGlobal Climate Change and Child Health
Earth Observatory, NASA
UNIQUE TIMESUNIQUE TIMES
We live in unique times in human history. This image represents the dramatic changes that have occurred over the past 50 years. Within the span of a single human lifetime we have gone from being
earth bound, to being able to look back at ourselves from space. Satellites now reveal images of shrinking of the tropical rain forests, intensification of agriculture, loss of wetlands, and expansion of
urban centres. New technology can measure changes in global photosynthesis, the water cycle and other major geophysical cycles linked to human activities.
Picture:
•NASA (National Aeronautic and Space Administration, USA)(sealevel.jpl.nasa.gov/overview/images/earth.jpg).

5
5
Global Climate Change and Child HealthGlobal Climate Change and Child Health
EXPONENTIAL POPULATION GROWTHEXPONENTIAL POPULATION GROWTH
Shea K., based on data from Raleigh VS. World population and health transition. BMJ, BMJ, 1999, 319:981.
0
2
4
6
8
10
1750 1800 1850 1900 1950 2000 2050 2100
Siz
e (
bil
lio
ns)
Population Projection
Several major human trends act as forces driving global environmental change. Primary among these trends is the expanding human population.
Humanity is in the steepest portion of an exponential population growth curve. It took hundreds of thousands of years for humans to reach a population of one billion around 1800, but only 130 years to
generate the second billion in 1927. Over the next 70 years, the population tripled to 6 billion in 1999.
In 2009, global population is over 6.8 billion and by 2050 there will be between 8 and 13 billion humans on the planet. Most of the population growth will be in cities in developing nations. Linked to
population rise are 3 major global changes in the way humans live on the planet. These are urbanization, industrialization and globalization. These 3 changes will be discussed on the next 3
slides.
Reference:
•Raleigh VS. World population and health transition. BMJ, BMJ, 1999, 319:981.
Graph:
•Dr. K. Shea.

6
6
Global Climate Change and Child HealthGlobal Climate Change and Child Health
0
10
20
30
40
50
60
70
80
90
100
1880 1900 1920 1940 1960 1980 2000 2020 2040
RURALRURAL
URBANURBAN
NASA
URBANIZATIONURBANIZATION
The first change is urbanization. This composite satellite image shows city lights from space and depicts the degree of urbanization in the world currently. The graph shows that at the beginning of the
20th century over 86% of humans lived in rural areas, now it is about 50%. In 1990, about 14%of humans lived in urban areas, now it is about 50%. Cities and megacities continue to evolve.
Of the 2.18 billion children under age 18 years (618 million under age 5 years) in the world, 1.9 billion
under 18 years (and 552 million under age 5 years) live in developing countries where urbanization is proceeding most rapidly.
References:
•UNICEF. The State of the World's Children 2005. Childhood under Threat. UNICEF, 2004
(www.unicef.org/sowc05/english/statistics.html)
•United Nations Population Division, World Urbanization Prospects: The 2001 Revisions (www.un.org/esa/population/publications/wup2001/wup2001dh.pdf)
Picture:
•NASA

7
7
Global Climate Change and Child HealthGlobal Climate Change and Child Health
� Energy production and use
� Increased resource extraction
� Crowding and pollution
� More goods and services
� Specialization and
productivity
� Epidemiologic transition
� Lower infant mortality
� Fewer infectious disease deaths
� Longer life spans
� Chronic diseases of “prosperity”US EPA
INDUSTRIALIZATIONINDUSTRIALIZATION
The second change is industrialization. Industrialization is interconnected with urbanization and population growth. With it comes increased energy production and use, increased resource extraction,
crowding and pollution. It also produces more goods and services, allows specialization and increased productivity and ultimately produces the epidemiologic transition from high infant mortality and early
death from infectious diseases, to longer life and the morbidity of chronic disease of “prosperity” such as cardiovascular disease, cancer and obesity.
Picture:
•US EPA (US Environmental Protection Agency).

8
8
Global Climate Change and Child HealthGlobal Climate Change and Child Health
�Transportation
�Trade
�Technology
� Information
�Communication
�Loss of frontiers
GLOBALIZATIONGLOBALIZATION
WHO
And the third major trend that marks these times as unique is the phenomenon of globalization. Globalization has brought many advantages including rapid movement of people (transportation),
global movement of goods and services (trade), and wide dissemination of information and communication (technology). Globalization has also imposed some challenges; humans are
numerous and capable of rapid movement and modification of the physical environment. The consequence of population pressure, urbanization, industrialization and globalization is that there are
no longer as many frontiers (large wilderness areas rich in resources). Humanity is distributed across
the globe and extracting resources from land and sea rapidly.
Picture:
•WHO. Cars in a plane. Courtesy of P. Caney. Asia.
9
9
Global Climate Change and Child HealthGlobal Climate Change and Child Health
Earth Observatory, NASA
EARTH IS A CLOSED SYSTEMEARTH IS A CLOSED SYSTEM
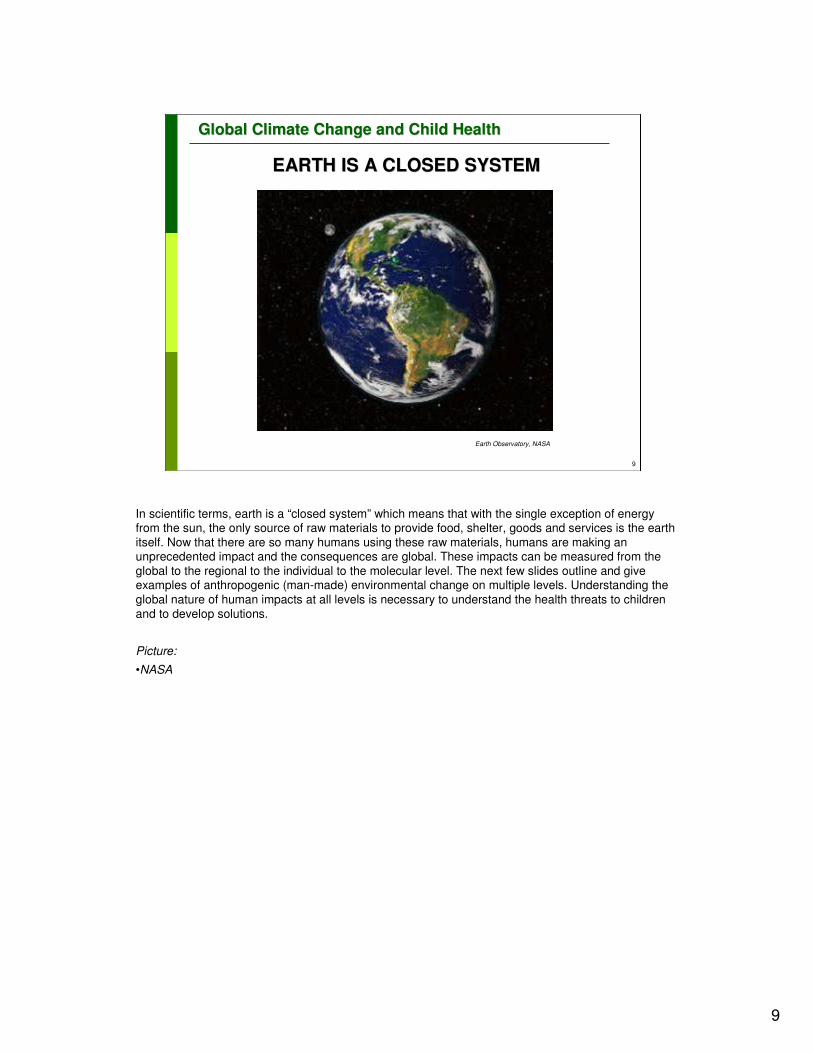
In scientific terms, earth is a “closed system” which means that with the single exception of energy from the sun, the only source of raw materials to provide food, shelter, goods and services is the earth
itself. Now that there are so many humans using these raw materials, humans are making an unprecedented impact and the consequences are global. These impacts can be measured from the
global to the regional to the individual to the molecular level. The next few slides outline and give examples of anthropogenic (man-made) environmental change on multiple levels. Understanding the
global nature of human impacts at all levels is necessary to understand the health threats to children
and to develop solutions.
Picture:
•NASA

10
10
Global Climate Change and Child HealthGlobal Climate Change and Child Health
� Planetary life support systems� Climate change, global
warming
� Stratospheric ozone depletion
� Distribution & abundance of life� Land transformation
� Over hunting/Fishing
� Invasive/Exotics
� Extinction
� Acceleration of Genetic change� Antibiotics, pesticides
� BioengineeringSan Quintin Glacier, Chile. Earth Observatory, NASA
HUMANS DOMINATE PLANETARY SYSTEMSHUMANS DOMINATE PLANETARY SYSTEMS
Scientists now talk about Earth being a “human dominated” system and humans as the major evolutionary force on the planet.
• Humans are making changes in the basic support systems of the planet including depletion of the protective stratospheric
ozone layer and forcing rapid climate change (represented here by the NASA picture of the San Quintin Glacier retreat, in Chile).
• Humans are affecting the distribution and abundance of life on Earth through
-land transformation (deforestation, desertification, urbanization),
-over hunting and over fishing that threatens species by preventing normal replenishment of populations,
-introduction of invasive and exotic plants and animals brought from different parts of the world that may become
pests or thrive because of lack of natural predators or competitors.
-All of these trends, often resulting in massive extinctions (expanded upon in later slide).
•And humans are actively accelerating genetic evolution by the use of chemicals such as antibiotics and pesticides as well as embarking on direct manipulation of plant and animal DNA. (See subsequent slides)
There is also a human-induced global change in the elemental cycles of nitrogen, sulfur and potassium. Various other
environmental changes are now occurring worldwide, in a rather more mosaic fashion. These include depletion of freshwater, degradation of agroecosystems, depletion of fisheries, and the dissemination of chemical pollution (POPs,
pesticides, heavy metals, etc.).
The following slides give examples of a few of these dramatic changes.
Reference:
•Palumbi SR. Humans as the World’s Greatest Evolutionary Force. Science, 2001, 293(5536):1786-90.
In addition to altering global ecology, technology and human population growth also affect evolutionary trajectories, dramatically accelerating evolutionary change in other species, especially in commercially important, pest, and disease organisms. Such changes are apparent in antibiotic and human immunodeficiency virus (HIV) resistance to drugs, plant and insect resistance to pesticides, rapid changes in invasive species, life-history change in commercial fisheries, and pest adaptation to biological engineering products. This accelerated evolution costs at least $33 billion to $50 billion a year in the United States. Slowing and controlling arms races in disease and pest management have been successful in diverse ecological and economic systems, illustrating how applied evolutionary principles can help reduce the impact of humankind on evolution.
Picture:
•NASA
11
11
Global Climate Change and Child HealthGlobal Climate Change and Child Health
IMPACT OF HUMANS ON GLOBAL SYSTEMS IMPACT OF HUMANS ON GLOBAL SYSTEMS
AN ENORMOUS EFFECTAN ENORMOUS EFFECT
0
10
20
30
40
50
60
70P
erc
en
t o
f T
ota
l
Land
Transformton
Degredation
Controlled
Rivers
Impaired Marine
Fisheries
Nitrogen
Fixation
Shea K., based on data from Vitousek PM. Science, 1997, 277(5325):494-99
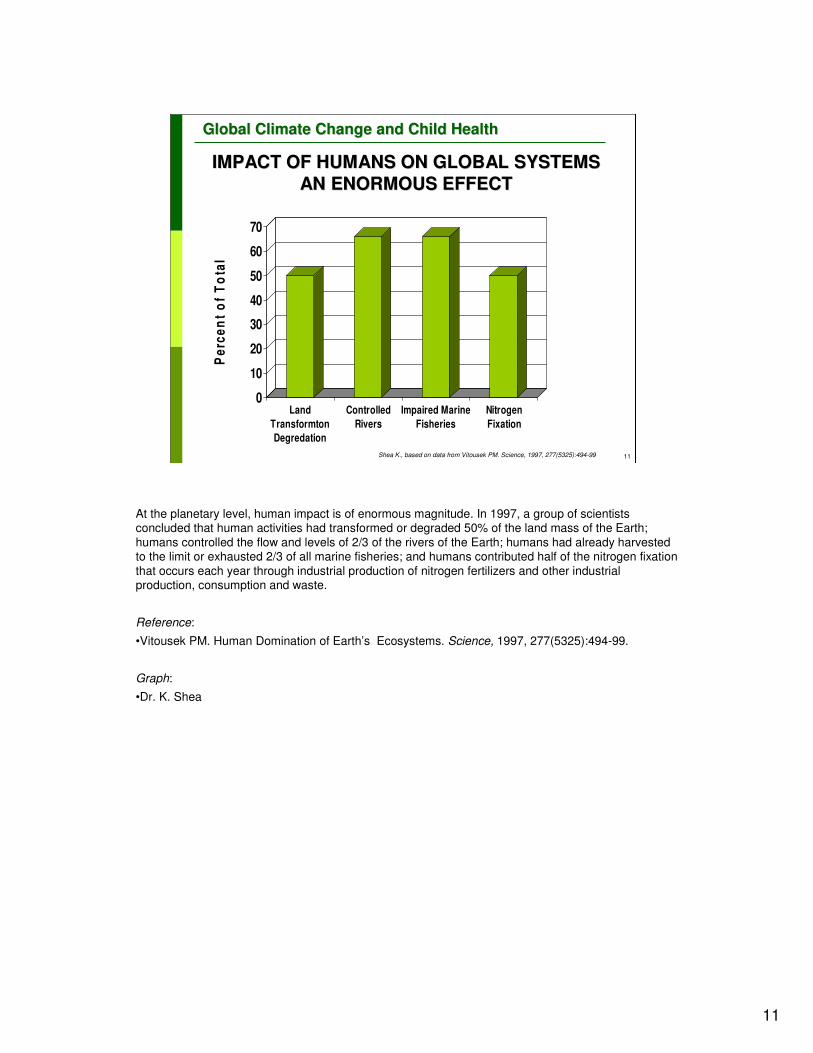
At the planetary level, human impact is of enormous magnitude. In 1997, a group of scientists concluded that human activities had transformed or degraded 50% of the land mass of the Earth;
humans controlled the flow and levels of 2/3 of the rivers of the Earth; humans had already harvested to the limit or exhausted 2/3 of all marine fisheries; and humans contributed half of the nitrogen fixation
that occurs each year through industrial production of nitrogen fertilizers and other industrial production, consumption and waste.
Reference:
•Vitousek PM. Human Domination of Earth’s Ecosystems. Science, 1997, 277(5325):494-99.
Graph:
•Dr. K. Shea

12
12
Global Climate Change and Child HealthGlobal Climate Change and Child Health
SOME ANTHROPOGENIC CHANGES ARE SOME ANTHROPOGENIC CHANGES ARE
IRREVERSIBLEIRREVERSIBLE
Species extinction rate:
Raven PH. Science, 2002, 297(5583):954-58Pitman NCA. Science, 2002, 298(5595):989
NOAA
NOAA
�Previous 65 Million years�1 species per
million per year
�Now�1000 species per
million per year�22-47% plants
endangered
Primarily due to habitat destruction, but also by overhunting, overfishing, industrial pollution and toxic chemicals, humans are causing the most massive extinction of species since the dinosaurs went
extinct 65 million years ago. Whereas the baseline species extinction rate had been about 1 species per million species per year, now it is a thousand fold higher. Some estimate that from ¼ to ½ of all
plant species are endangered. Plants are our primary producers, the basis of the food web, and the only means by which sunlight is transformed into the organic building blocks of life. These changes are
irreversible.
References:
•Pitman NCA. Estimating the Size of the World's Threatened Flora. Science, 2002, 298(5595):989.
•Raven PH. Science, Sustainability and the Human Prospect. Science, 2002, 297(5583):954-58.
Pictures:
•NOAA (National Oceanic and Atmospheric Administration). Florida Keys National Marine Sanctuary(www.photolib.noaa.gov/htmls/reef2584.htm).
•NOAA's Estuarine Research Reserve Collection (www.photolib.noaa.gov/700s/nerr0390.jpg).

13
13
Global Climate Change and Child HealthGlobal Climate Change and Child Health
HUMANS AFFECT THE GENETICS OF HUMANS AFFECT THE GENETICS OF
POPULATIONSPOPULATIONS
3.8
17.8
22.324.6
27.2
34.6
44
0
5
10
15
20
25
30
35
40
45
Perc
en
t
late
1980s
1992 1993 1994 1995 1996 1997
Shea K., based on data from Doern GV. et. al. Clin Inf Dis. 1998, 27(4):764-700
S. pneumoniae resistant to Penicillin1047 isolates, 27 US and 7 Canadian Centres
Humans are also affecting life on Earth at the microscopic and genetic level. This familiar graph of the steady rise of penicillin resistant Streptococcus pneumoniae throughout the last few decades is one of
many examples of how large scale human use of antibiotics has forced the genetic evolution in another species, bacteria.
Reference:
•Doern GV. et al. Prevalence of antimicrobial resistance among respiratory tract isolates of
Streptococcus pneumoniae in North America: 1997 results from the SENTRY antimicrobial surveillance program. Clin Infect Dis. 1998, 27(4):764-70.
As part of the ongoing multinational SENTRY antimicrobial resistance surveillance program, a total of 1,047 respiratory tract isolates of Streptococcus pneumoniae, 845 from 27 United States medical centers and 202 from seven Canadian institutions, were collected between February and June 1997 and characterized in a central laboratory. In the United States, the overall percentages of penicillin-intermediate strains and strains with high-level resistance to penicillin were 27.8% and 16.0%, respectively. In Canada, these values were 21.8% and 8.4%, respectively. Among the 31 centers in the United States and Canada that contributed at least 19 isolates, the combined rate of intermediate plus resistant strains varied between 24.0% and 67.8%. The in vitro activity of 19 other antimicrobials was assessed against all study isolates. Overall rates of resistance among selected agents in the United States and Canada, respectively, were as follows: amoxicillin, 18.1% and 10.5%; cefaclor, 38.3% and 26.2%; cefuroxime, 19.5% and 12.9%; cefpodoxime, 18.6% and 11.4%; cefepime, 8.2% and 4.5%; cefotaxime, 4.0% and 3.0%; macrolides (i.e., erythromycin, azithromycin, and clarithromycin), 11.7%-14.3% and 5.0%-7.4%; clindamycin, 3.5% and 3.5%; chloramphenicol, 3.9% and 4.0%; tetracycline, 10.2% and 10.9%; and trimethoprim-sulfamethoxazole, 19.8% and 15.8%.
Graph:
•Dr. K. Shea

14
14
Global Climate Change and Child HealthGlobal Climate Change and Child Health
ANTHROPOCENE EPOCHANTHROPOCENE EPOCHHumans are the greatest evolutionary force
�Scale of change�Microscopic � Planetary
• Air
• Water
• Food
• Fire
�Rate of change�Decades not millennia
�Inequity�Within & among
nations/regions
�Across generations
City Lights. Visible Earth NASA
Crutzen PJ. Nature, 2002, 415:23
Some scientists are proposing that we name this changing environment the Anthropocene Epoch on the geologic time scale because of the reality of human domination and evolutionary pressure. The
scale of change ranges from microscopic to planetary and affects the basic supports of life – air, water, food and fire. The rate of change is now measured in decades versus the millennia of previous
epochs. Finally, there is wide distributional inequity of these effects of anthropogenic forces within and among nations and regions and across generations. In other words, the countries most responsible for
global environmental degradation have benefited in the short term, but the harms will be felt most
acutely in the poorest countries that had less of a role in causing that same degradation. Similarly, generations in the future will be left to cope with the results of excess resource extraction, pollution
and degradation of ecosystems caused by those living now.
Reference:•Crutzen PJ. Geology of Mankind. Nature, 2002, 415:23.
Picture:
•NASA

15
15
Global Climate Change and Child HealthGlobal Climate Change and Child Health
CHALLENGESCHALLENGES TO HUMAN HEALTH AND TO HUMAN HEALTH AND
DEVELOPMENTDEVELOPMENT
DRIVING FORCES
Population growthUpsurge of urbanization
New industrializationRapid globalizationPervasive poverty and inequity
Non-sustainable consumptionExcessive population growth
Trans-boundary chemical transportIncreased use of biotechnology
Children are disproportionately vulnerable, suffering most of the effects, now…and in the future
GLOBAL ENVIRONMENTAL CHANGE
Climate change
Ozone depletion
Desertification/deforestation
Forest fires
Loss of biodiversity
ENVIRONMENTAL DEGRADATION
These large scale changes caused by human activity create unique problems, especially for children, as is depicted on this summary slide. A number of new driving forces and global environmental
changes pose challenges to human health and to the environment. These challenges contribute to
environmental degradation – and environmental degradation disproportionately affects children.
<<READ SLIDE>>
<<NOTE TO SPEAKER: The driving forces and global environmental changes mentioned are self-explanatory. However, speakers may need to expand on one or two of the points, if considered relevant. An example of this is urbanization as illustrated below.>>
Reference:
•Gracey M. Child health implications of worldwide urbanization. Rev Environ Health. 2003, 18(1):51
The upsurge of urbanization, often poorly planned and uncontrolled, has caused major impacts on human societies for at least two centuries. Urban environments and urbanized lifestyles have strong influences on health and well-being, including on infant and childhood populations in developed and underdeveloped countries, as well as among societies in developmental and environmental transition around the world. Urbanization will inevitably have significant impacts on the health of future generations. Notably, the health consequences of urbanized lifestyles are not confined to residents of cities and large towns but rather are becoming manifest in rapidly changing, previously traditional societies in rural and remote areas because globalization is altering infant feeding practices and the dietary habits and lifestyle patterns of their children. In underdeveloped countries, overcrowding and environmental pollution are huge problems that are exacerbated by undernutrition and infection, particularly respiratory and diarrhoeal diseases. In developed societies, other problems like injuries; poisonings; violence; drug abuse; exposure to chemical, biological, industrial, and atmospheric pollutants, including pesticides; sexually transmissible diseases; and 'lifestyle' diseases, including obesity and cardiovascular disease risk; are of great current and potential importance.

16
16
Global Climate Change and Child HealthGlobal Climate Change and Child Health
GLOBAL CLIMATE CHANGE: GLOBAL CLIMATE CHANGE:
IMPACTS ON CHILDRENIMPACTS ON CHILDREN’’S HEALTHS HEALTH
WHO
The distinctive aspect of global environmental change is its scale. For the first time, humankind is exerting sufficient pressure on the earth’s biophysical systems to cause changes in some
environmental processes and conditions at the global level. Several such environmental changes have now been confirmed, in particular stratospheric ozone depletion and climate change. These large-
scale environmental changes do not necessarily pose qualitatively new risks to health. Rather, they amplify and extend the health risks posed by many existing environmental hazards. Global warming
(climate change) is well studied and provides a good example of a global change with health
consequences that affect everyone, but children more than most.
Picture:
•WHO

17
17
Global Climate Change and Child HealthGlobal Climate Change and Child Health
GREENHOUSE GASES AND GLOBAL WARMINGGREENHOUSE GASES AND GLOBAL WARMING
Earth is covered by a blanket of gases which allows energy from the sun to reach the
earth‘s surface, where some of it is converted to heat energy. Most of the heat is re-radiated towards space, but some is re-radiated towards the ground by
greenhouse gases in the atmosphere. This is a natural effect which keeps the Earth's
temperature at a levelnecessary to support life.
Human activities-particularly burning of fossil fuels (coal,
oil and natural gas), agriculture and land clearing-
are generating more greenhouse gases.
Greater concentrations of greenhouse gases will trap
more heat and raise the Earth’s surface temperature
www.climatechange.gov.au/climate-change/science/greenhouse-effect.aspx
If Earth had no atmosphere, it would be a frozen planet without life. Gases in the atmosphere (including water vapour, carbon dioxide, methane and nitrous oxides) temporarily trap some of the energy from the sun and convert it to heat, which maintains an average surface temperature on earth that is capable of sustaining life. This is known as the greenhouse effect and is necessary for sustained life on earth.
Human activities, particularly the burning of fossil fuels, have increased the concentration of greenhouse gases in the atmosphere dramatically over the last century, forcing increased warming in the lower atmosphere. This enhanced greenhouse effect is changing climate in a variety of ways and has consequences for human health.
<<READ Captions:
BOX ONE-- Earth is covered by a blanket of gases which allows energy from the sun to reach the Earth's surface, where some of it is converted to heat energy. Most of the heat is re-radiated towards space, but some is re-radiated towards the ground by greenhouse gases in the atmosphere. This is a natural effect which keeps the Earth's temperature at a level necessary to support life.
BOX TWO-- Human activities-particularly burning of fossil fuels (coal, oil and natural gas), agriculture and land clearing-are generating more greenhouse gases. Greater concentrations of greenhouse gases will trap more heat and raise the Earth's surface temperature.>>
Pictures:
•‘What is the greenhouse effect’ from Climate Change Science (www.climatechange.gov.au/climate-change/science/greenhouse-effect.aspx). Copyright Commonwealth of Australia used with permission.

18
18
Global Climate Change and Child HealthGlobal Climate Change and Child Health
INDISPUTABLE INCREASES IN INDISPUTABLE INCREASES IN
GREENHOUSE GASESGREENHOUSE GASES
NASA
This graph shows the indisputable increases in carbon dioxide in the Earth’s atmosphere as measured at the top of Mount Mauna Loa on the Island of Hawaii. Human activities are responsible for this
dramatic rise.
This increase in greenhouse gases is causing an increase in the surface temperature and affects weather and climate. Weather is the continuously changing condition of the atmosphere; climate is any
long-term change in the patterns of average weather of a specific region or the Earth as a whole. Climate change reflects abnormal variations to the Earth's climate and subsequent effects on other
parts of the Earth, such as in the ice caps over durations ranging from decades to millions of years.
Over the last few decades, human activity is changing the atmospheric composition and causing rapid global climate changes.
Graph:
•NASA

19
19
Global Climate Change and Child HealthGlobal Climate Change and Child Health
as is now evident as is now evident from observations from observations of increases in of increases in global average air global average air and ocean and ocean temperatures, temperatures, widespread widespread melting of snow melting of snow and ice, and rising and ice, and rising average sea level.average sea level.””
IPCC: 450 1st authors, 800 contributing authors,
2500 expert scientists. International CONSENSUS document
IPCC-AR4, WG I, 2007 (www.ipcc.ch/index.htm)
““Warming of the climate system isWarming of the climate system is
unequivocalunequivocal
This quote from the 4th Assessment Report of the Intergovernmental Panel on Climate Change (IPCC, 2007) could not be more clear.
<<READ:11 of the 12 years between 1995 and 2006 rank among the 11 warmest years in the instrumental record (since 1850), and human activity is causing it. This complex graph summarizes all the human influences on climate, the positive or heating forcings and the negative or cooling forcings are noted in the top section. They overwhelm the natural variation in solar radiation (second to bottom line) and the aggregate effect is that humans are warming the planet (bottom line of graphic).This is the conclusion of the most respected group of international climate scientists in the world who have, in very strong language, come to consensus.>>
Picture:•IPCC (Intergovernmental Panel on Climate Change), WG I, 2007 (www.ipcc.ch/index.htm).Solomon S et al., eds. Contribution of Working Group I to the Fourth Assessment Report of the Intergovernmental Panel on Climate Change. Cambridge University Press, Cambridge, United Kingdom and New York, NY, USA, 2007. (Chapter 2, p. 136, Fig. 2.1).
20
20
Global Climate Change and Child HealthGlobal Climate Change and Child Health
↑↑ Air pollution related illnessAir pollution related illness
↑↑ Injury, death and illness from Injury, death and illness from
extreme weather eventsextreme weather events
↑↑ WaterWater--borne diseasesborne diseases
↑↑ FoodFood--borne diseasesborne diseases
↑↑ VectorVector--borne illnessborne illness
↑↑ Heat Related illnesses and deaths Heat Related illnesses and deaths
↓↓ Cold related deathsCold related deaths
DIRECT HEALTH IMPACTS DIRECT HEALTH IMPACTS
OF GLOBAL WARMINGOF GLOBAL WARMING
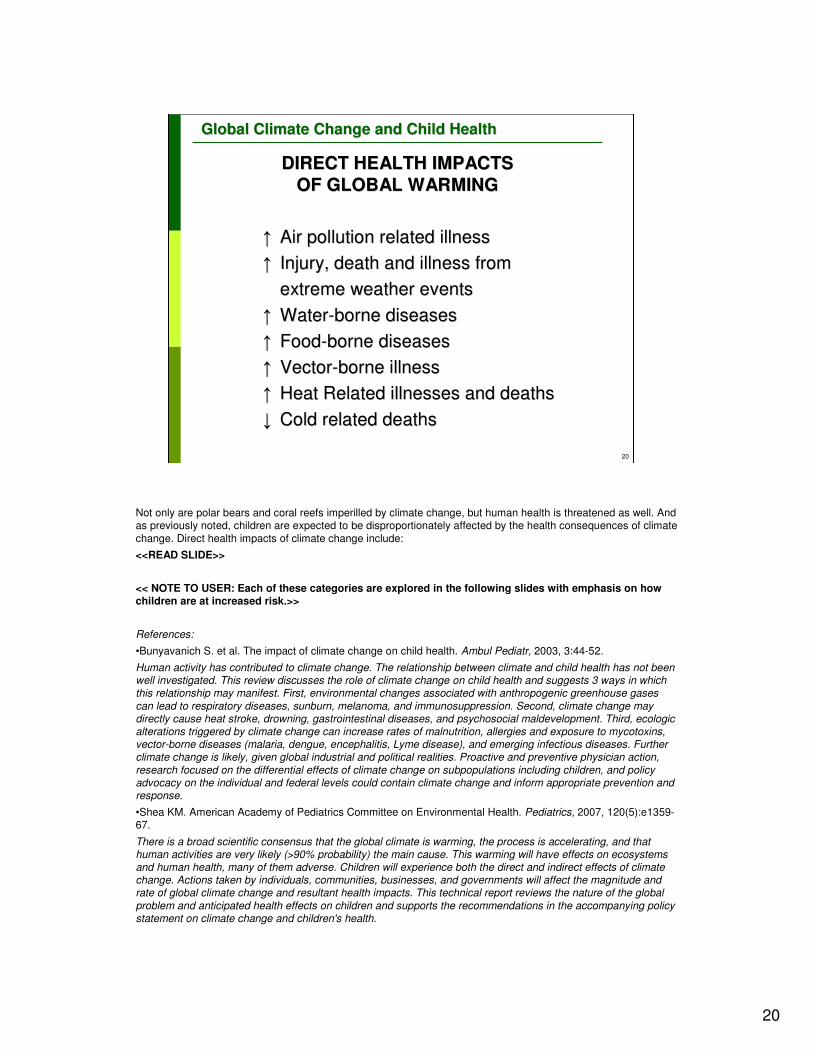
Not only are polar bears and coral reefs imperilled by climate change, but human health is threatened as well. And as previously noted, children are expected to be disproportionately affected by the health consequences of climate
change. Direct health impacts of climate change include:
<<READ SLIDE>>
<< NOTE TO USER: Each of these categories are explored in the following slides with emphasis on how children are at increased risk.>>
References:
•Bunyavanich S. et al. The impact of climate change on child health. Ambul Pediatr, 2003, 3:44-52.
Human activity has contributed to climate change. The relationship between climate and child health has not been well investigated. This review discusses the role of climate change on child health and suggests 3 ways in which this relationship may manifest. First, environmental changes associated with anthropogenic greenhouse gases can lead to respiratory diseases, sunburn, melanoma, and immunosuppression. Second, climate change may directly cause heat stroke, drowning, gastrointestinal diseases, and psychosocial maldevelopment. Third, ecologic alterations triggered by climate change can increase rates of malnutrition, allergies and exposure to mycotoxins, vector-borne diseases (malaria, dengue, encephalitis, Lyme disease), and emerging infectious diseases. Further climate change is likely, given global industrial and political realities. Proactive and preventive physician action, research focused on the differential effects of climate change on subpopulations including children, and policy advocacy on the individual and federal levels could contain climate change and inform appropriate prevention and response.
•Shea KM. American Academy of Pediatrics Committee on Environmental Health. Pediatrics, 2007, 120(5):e1359-67.
There is a broad scientific consensus that the global climate is warming, the process is accelerating, and that human activities are very likely (>90% probability) the main cause. This warming will have effects on ecosystems and human health, many of them adverse. Children will experience both the direct and indirect effects of climate change. Actions taken by individuals, communities, businesses, and governments will affect the magnitude and rate of global climate change and resultant health impacts. This technical report reviews the nature of the global problem and anticipated health effects on children and supports the recommendations in the accompanying policy statement on climate change and children's health.
21
21
Global Climate Change and Child HealthGlobal Climate Change and Child Health
Ground level ozone:
↑ Sensitivity of children at lower levels
↑ Frequency/severity of asthma attacks (strong evidence)
↑ ER visits
↑ Hospitalizations
↑ Incidence (some evidence)
↑ Independently with temperature
US EPA
AIR POLLUTIONAIR POLLUTION--RELATED ILLNESSRELATED ILLNESS
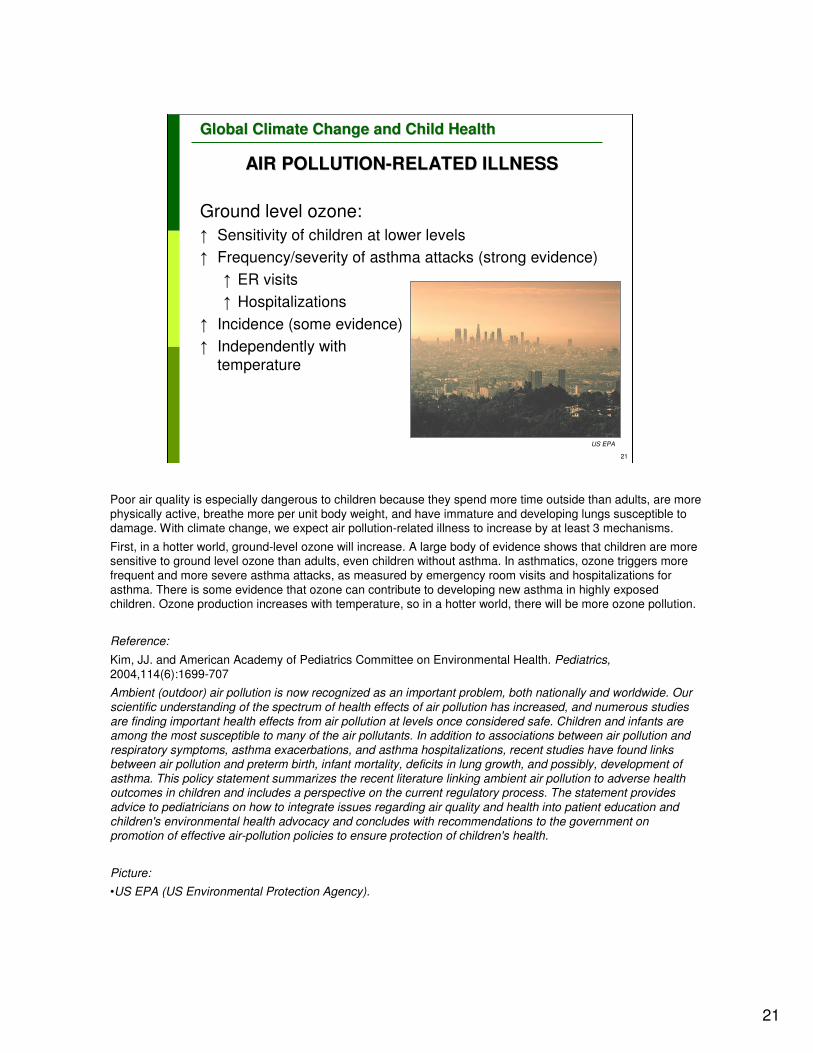
Poor air quality is especially dangerous to children because they spend more time outside than adults, are more
physically active, breathe more per unit body weight, and have immature and developing lungs susceptible to damage. With climate change, we expect air pollution-related illness to increase by at least 3 mechanisms.
First, in a hotter world, ground-level ozone will increase. A large body of evidence shows that children are more sensitive to ground level ozone than adults, even children without asthma. In asthmatics, ozone triggers more
frequent and more severe asthma attacks, as measured by emergency room visits and hospitalizations for
asthma. There is some evidence that ozone can contribute to developing new asthma in highly exposed children. Ozone production increases with temperature, so in a hotter world, there will be more ozone pollution.
Reference:
Kim, JJ. and American Academy of Pediatrics Committee on Environmental Health. Pediatrics,2004,114(6):1699-707
Ambient (outdoor) air pollution is now recognized as an important problem, both nationally and worldwide. Our scientific understanding of the spectrum of health effects of air pollution has increased, and numerous studies are finding important health effects from air pollution at levels once considered safe. Children and infants are among the most susceptible to many of the air pollutants. In addition to associations between air pollution and respiratory symptoms, asthma exacerbations, and asthma hospitalizations, recent studies have found links between air pollution and preterm birth, infant mortality, deficits in lung growth, and possibly, development of asthma. This policy statement summarizes the recent literature linking ambient air pollution to adverse health outcomes in children and includes a perspective on the current regulatory process. The statement provides advice to pediatricians on how to integrate issues regarding air quality and health into patient education and children's environmental health advocacy and concludes with recommendations to the government on promotion of effective air-pollution policies to ensure protection of children's health.
Picture:
•US EPA (US Environmental Protection Agency).

22
22
Global Climate Change and Child HealthGlobal Climate Change and Child Health
↑ Fossil fuel pollution
↑ Population
↑ Demand
↑ PM, NOx, SOx, VOCs, O3
↓ Lung growth
↑ Respiratory infections
↑ Asthma attacks
↑ Infant mortality
↑ Miscarriages, preterm & low
birth weight births
↑ Mercury
↑ Developmental damagePhilip J. Redman, USGS
AIR POLLUTIONAIR POLLUTION--RELATED ILLNESSRELATED ILLNESS
The second category of air pollution related illness derives from population driven increased energy production. If we meet increased demand by burning more fossil fuels, major air pollutants will go
up. We’ll see increased particulates, oxides of nitrogen and sulfur, volatile organic hydrocarbons and, of course, more ozone. There is robust evidence that childhood exposure to these specific air
pollutants is related to decreased lung growth and permanent decrements in pulmonary function as well as increases in respiratory infection, asthma, infant and all age mortality, miscarriages, preterm
and low birth weight births. Mercury, which comes from burning coal, also ends up in the food chain
and threatens the development of the brain and nervous system.
Picture: •Courtesy of Philip J. Redman, USGS (US Geological Survey)
23
23
Global Climate Change and Child HealthGlobal Climate Change and Child Health
� Extreme precipitation, storms and floods↓ water quality by increasing chemical waste
into surface waters
� Drought ↓ water quality by concentration of non-volatile
chemicals and toxic metals
� Increased temperatures ↑ volatile chemicals to disperse more quickly
in the air
WHO
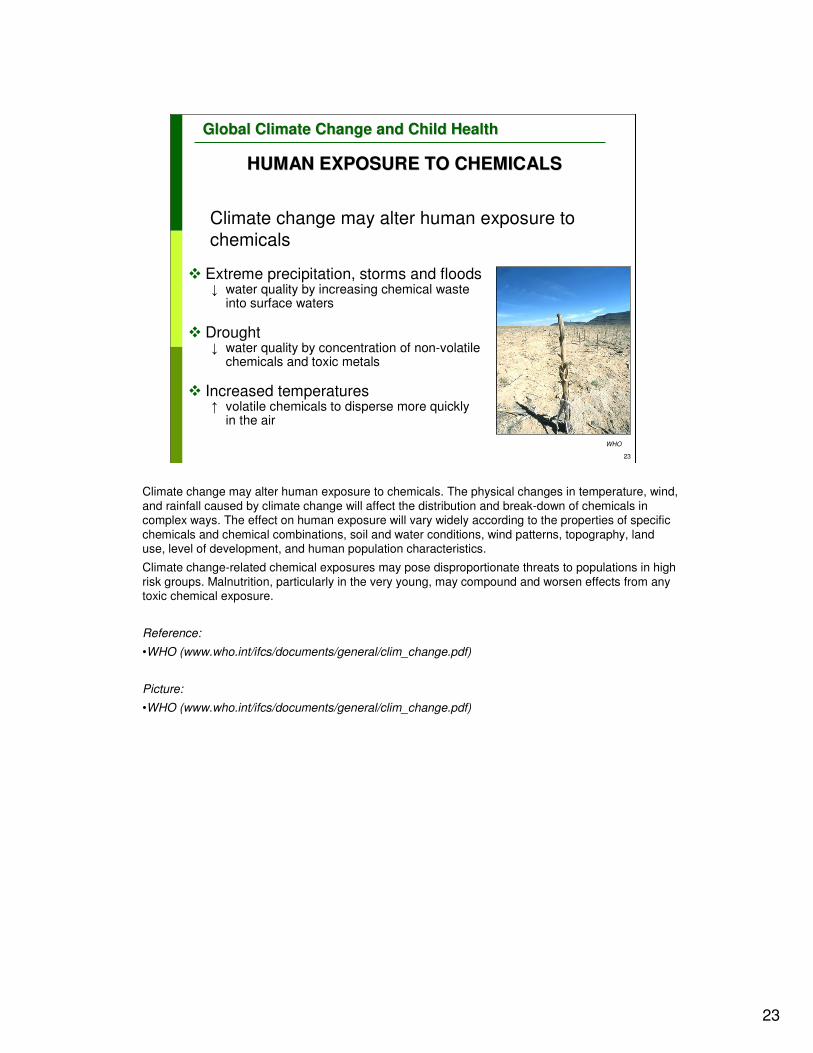
HUMAN EXPOSURE TO CHEMICALSHUMAN EXPOSURE TO CHEMICALS
Climate change may alter human exposure to
chemicals
Climate change may alter human exposure to chemicals. The physical changes in temperature, wind,
and rainfall caused by climate change will affect the distribution and break-down of chemicals in complex ways. The effect on human exposure will vary widely according to the properties of specific
chemicals and chemical combinations, soil and water conditions, wind patterns, topography, land use, level of development, and human population characteristics.
Climate change-related chemical exposures may pose disproportionate threats to populations in high
risk groups. Malnutrition, particularly in the very young, may compound and worsen effects from any toxic chemical exposure.
Reference:
•WHO (www.who.int/ifcs/documents/general/clim_change.pdf)
Picture:
•WHO (www.who.int/ifcs/documents/general/clim_change.pdf)

24
24
Global Climate Change and Child HealthGlobal Climate Change and Child Health
INCREASED AEROALLERGENSINCREASED AEROALLERGENS
0
5
10
15
20
Gra
ms
280 370 600
PPM CO2
Ragweed Pollen and Global Warming
Shea K., based on data from Ziska L.. World Resources Review, 2000, 12:449-457
Human allergic response to airborne plant pollens contributes to hay fever, allergic rhinitis and allergic asthma. Sensitization to allergens in early childhood can cause an allergic (including asthmatic) disposition.
Ambient pollen levels may rise in response to higher atmospheric carbon dioxide concentrations and higher temperatures. Pollen counts have been rising, and this may be partly a result of increased carbon dioxide, warmer winters, the earlier arrival of spring, or excess of nitrogen. Thus, climate change may already be contributing to the increased incidence of hay fever and asthma that has occurred in many parts of the world in recent decades.
The figure shows the results of a recent experiment by Lewis H. Ziska, a plant physiologist at the United States Department of Agriculture, who did the pollen counts on ragweed grown in indoor chambers at various levels of atmospheric CO2, from about the turn-of-the-century levels of 280 parts per million (ppm) to just below today's levels of 370 ppm to future predicted levels of 600 ppm. Pollen production went from 5.5 grams to 10 grams to 20 grams as CO2 moved through these three levels.
References:
•D'Amato G, Liccardi G, D'Amato M. Environmental risk factors (outdoor air pollution and climatic changes) and increased trend of respiratory allergy. Journal of Investigational Allergology and Clinical Immunology, 2000, 10:123-128.
•Wayne P, et al. Production of allergenic pollen by ragweed (Ambrosia artemisiifolia L.) is increased in CO2-enriched atmospheres. Annals of Allergy, Asthma and Immunology, 2002, 8:279-282.
•Wuthrich B. In Switzerland, pollinosis has really increased in the last decade. Allergy and Clinical Immunology News, 1991, 3:41-44.
•Ziska L, Caulfield F. The potential influence of rising atmospheric carbon dioxide on public health: pollen production of common ragweed as a test case. World Resources Review, 2000, 12:449-457.
Graph:
•Dr. K. Shea

25
25
Global Climate Change and Child HealthGlobal Climate Change and Child Health
� Study on the length of the Ambrosia pollen season for the Montreal region between 1994 and 2002
� Relation between high pollen counts and medical consultation � OR 2.69, 95% CI 1.32-5.52 - day of high pollen
counts� OR 2.48, 95% CI 1.26-4.88 - 5 days after high
pollen counts
� Statistically significant increase in the length of the ragweed pollen season with rising temperatures
INCREASED AEROALLERGENS, INCREASED AEROALLERGENS,
INCREASED ILLNESSINCREASED ILLNESS
In addition to increased pollen production in higher ambient CO2, we are already measuring longer pollen seasons with warming and earlier springs. This study from Canada, showed a statistically significant increase in the length of the ragweed pollen season with rising temperatures. On the day of high pollen count, people were 2.69 times as likely to seek medical care as on days of low pollen counts. On 5 days after high pollen count, people were 2.48 times as likely to seek medical care as on days of low pollen counts. A warmer world with more CO2 is likely to create more misery for allergic individuals.
OR = Odds Ratio; CI = Confidence Interval
Reference:
•Breton MC. et al. Relationship between climate, pollen concentrations of Ambrosia and medical consultations for allergic rhinitis in Montreal, 1994-2002. Sci Total Environ, 2006, 15, 370(1):39-50.
The aim of this study is to evaluate the influence of meteorological factors on Ambrosia pollen concentrations and its impact on medical consultations for allergic rhinitis of residents from various socio-economic levels in Montréal (Québec, Canada) between 1994 and 2002. The study was conducted to recognize the sensitivity of pollen productivity to daily climate variability in order to estimate the consequences on human health vulnerability in the context of global climate change. Information related to medical consultations for allergic rhinitis due to pollen comes from the Quebec Health Insurance Board (Régie de l'assurance-maladie du Québec). Ambrosia pollen concentration was measured by the Aerobiology Research Laboratories (Nepean, Ontario). Daily temperature (maximum, minimum, and mean) and precipitation data were obtained from the Meteorological Service of Canada. Socio-economic data come from the 1996 and 2001 census data of Statistics Canada. Between 1994 and 2002, during the Ambrosia pollen season, 7667 consultations for allergic rhinitis due to pollen were recorded. We found a significant association between the number of medical consultations and pollen levels. Significant associations were detected for over-consultation the day of exposure, 1, 2, 3 and 5 days after exposure to high levels of pollen. The consultation rate is higher from low-income residents (3.10 consultations per 10,000 inhabitants) than for high-income (1.65 consultations per 10,000 inhabitants). Considering the demonstrated impact of pollen levels on health, it has become critical to ensure adequate monitoring of Ambrosia and its meteorological sensitivity in the context of the anticipated climate change and its potential consequences on human health.

26
26
Global Climate Change and Child HealthGlobal Climate Change and Child Health
Poison ivy
�Grows faster
�Grows bigger
�Increased
�Photosynthesis
�Water use
�More allergenic
�Higher unsaturated urushiol congeners
Mohan JE. Proc Natl Acad Sci U S A., 2006,13;103(24):9086-9
ALTERED ALLERGENSALTERED ALLERGENS
While not an aeroallergen, this study from Duke University is worth mentioning. It suggests that high
CO2 conditions may have a qualitative impact on some allergens. They grew poison ivy in elevated
CO2 conditions within a full ecosystem and found that it grew faster, bigger and better and produced a
higher proportion of the more allergenic congeners of the noxious oils. If this happens with
aeroallergens as well, individuals with respiratory allergens could be made more ill as atmospheric
CO2 rises.
Reference:
•Mohan JE. et al. Biomass and toxicity responses of poison ivy (Toxicodendron radicans) to elevated
atmospheric CO2. Proc Natl Acad Sci USA, 2006,103 (24):9086-9.
Contact with poison ivy (Toxicodendron radicans) is one of the most widely reported ailments at poison centers in the United States, and this plant has been introduced throughout the world, where it occurs with other allergenic members of the cashew family (Anacardiaceae). Approximately 80% of humans develop dermatitis upon exposure to the carbon-based active compound, urushiol. It is not known how poison ivy might respond to increasing concentrations of atmospheric carbon dioxide (CO(2)), but previous work done in controlled growth chambers shows that other vines exhibit large growth enhancement from elevated CO(2). Rising CO(2) is potentially responsible for the increased vine abundance that is inhibiting forest regeneration and increasing tree mortality around the world. In this 6-year study at the Duke University Free-Air CO(2) Enrichment experiment, we show that elevated atmospheric CO(2) in an intact forest ecosystem increases photosynthesis, water use efficiency, growth, and population biomass of poison ivy. The CO(2) growth stimulation exceeds that of most other woody species. Furthermore, high-CO(2) plants produce a more allergenic form of urushiol. Our results indicate that Toxicodendron taxa will become more abundant and more "toxic" in the future, potentially affecting global forest dynamics and human health.
27
27
Global Climate Change and Child HealthGlobal Climate Change and Child Health
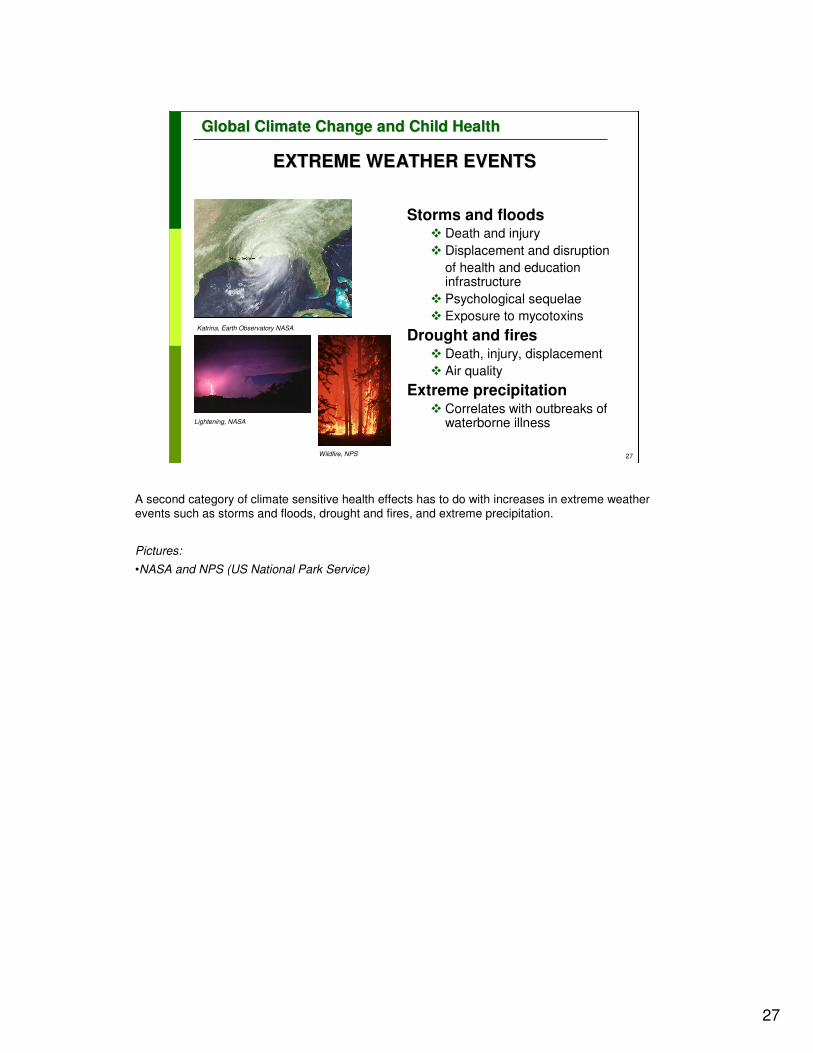
EXTREME WEATHER EVENTSEXTREME WEATHER EVENTS
Storms and floods� Death and injury
� Displacement and disruption
of health and education infrastructure
� Psychological sequelae
� Exposure to mycotoxins
Drought and fires� Death, injury, displacement
� Air quality
Extreme precipitation� Correlates with outbreaks of
waterborne illness
Katrina, Earth Observatory NASA
Wildfire, NPS
Lightening, NASA
A second category of climate sensitive health effects has to do with increases in extreme weather events such as storms and floods, drought and fires, and extreme precipitation.
Pictures:
•NASA and NPS (US National Park Service)

28
28
Global Climate Change and Child HealthGlobal Climate Change and Child Health
STORMS AND FLOODSSTORMS AND FLOODS
�Drowning and injury
�Psychological sequelae
�Post traumatic stress disorder�After Hurricane Andrew
�20-30% adults
�77% children
moderate to severe
(21 months later)
Hurricane Floyd, NOAA
Hurricane Andrew, NOAA
Shaw JA. J Am Acad Child Adolesc Psychiatry, 1996;35(3):359-64.
The hydrological cycle accelerates with global warming. As heat energy accumulates in the deep ocean, more water evaporates, causing increased intensity and frequency of precipitation. Evaporation from soil may also be increased, causing drought. Models indicate that there will be more heavy deluges, with flooding, and more frequent and longer droughts.
Extreme weather events such as heavy precipitation, severe storms, floods, droughts, and cyclones may have increased in frequency, duration, and intensity in some regions over the past century. An increase in the frequency of large floods over the twentieth century has recently been demonstrated, and several-fold increases in the frequency of what are currently considered extreme wet seasons are predicted for various regions, using a range of climate models. Recent climate catastrophes, such as Hurricane Mitch in Honduras, have had major adverse health impact. Over the past decade, floods in Bangladesh, China, various parts of Europe, Mozambique and Venezuela have taken a considerable toll on human life and well-being.
Severe weather events have many effects on child health. Studies of earthquakes indicate that women and young children are more vulnerable to the acute impacts of natural disasters and famines. Floods cause child injuries and death by drowning, and also compromise clean water supplies, fostering epidemics of diarrhoea. In Peru, hospital admissions for paediatric diarrhoea were 50% above the seasonal norm after precipitation and flooding related to the El Niño-Southern Oscillation (ENSO). Following Hurricane Mitch, 30 000 cases of cholera occurred in Central America.
Weather disasters devastate homes, spawning refugee communities that are likely to have poor public health. Basic life support systems, including water, forests and other natural resources, may also be undermined by climate change. Food production and availability are impaired by droughts and floods. Children are especially vulnerable to the emotional trauma caused by sudden changes in living routines and social networks, and the social disruption, economic damage and population displacement caused by weather disasters can impair their psychological and social development.
Studies of Post Traumatic Stress Disorder after Hurricane Andrew in the south-eastern USA found that children are 2-3 times more likely than adults to suffer symptoms of post traumatic stress disorder and that these symptoms endure longer in children than in adults.
<<NOTE TO USER: If you have local data and images, please replace USA example or add additional slide.>>
References:
•Beinin C. An examination of health data following two major earthquakes in Russia. Disasters, 1981, 5 : 142-146.
•Epstein P. Climate and health. Science, 1999, 285:347-348.
•Milly P. et al. Increasing risk of great floods in a changing climate. Nature, 2002, 415:514-517.
•Palmer TN, Ralsanen, J. Quantifying the risk of extreme seasonal precipitation events in a changing climate. Nature, 2002, 415: 512-514.
•Rivers JPW. Women and children last; an essay on sex discrimination in disasters. Disasters, 1982, 6: 256--267.
•Shaw JA, Applegate B, Schorr C. J Am Acad Child Adolesc Psychiatry, 1996, 35(3):359-64.
Pictures:•NOAA

29
29
Global Climate Change and Child HealthGlobal Climate Change and Child Health
EXPOSURE TO MYCOTOXINSEXPOSURE TO MYCOTOXINS
�Drought: weakens seed kernels of plants, allowing greater fungal contamination
�Flooding: causes moist conditions that promote fungal growth
�Aflatoxins are specifically expected to become more prevalent
�Young children among most vulnerable
Bunyavanich S et al. Ambul Pediatr, 2003;3:44-52.
Warmer temperatures and extreme weather events encourage the growth of mycotoxin-producing fungi, including Aspergillus, Claviceps, Stachybotrys, and Fusarium spp. Mycotoxins are implicated in
the pathogenesis of cancers, ergotism, and birth defects. Aspergillus can produce aflatoxin, a potent mycotoxin that has caused much death and disease in Africa and Asia.
Reference:
•Bunyavanich S. et al. The impact of climate change on child health. Ambul Pediatr 2003;3:44-52.
Human activity has contributed to climate change. The relationship between climate and child health has not been well investigated. This review discusses the role of climate change on child health and suggests 3 ways in which this relationship may manifest. First, environmental changes associated with anthropogenic greenhouse gases can lead to respiratory diseases, sunburn, melanoma, and immunosuppression. Second, climate change may directly cause heat stroke, drowning, gastrointestinal diseases, and psychosocial maldevelopment. Third, ecologic alterations triggered by climate change can increase rates of malnutrition, allergies and exposure to mycotoxins, vector-borne diseases (malaria, dengue, encephalitides, Lyme disease), and emerging infectious diseases. Further climate change is likely, given global industrial and political realities. Proactive and preventive physician action, research focused on the differential effects of climate change on subpopulations including children, and policy advocacy on the individual and federal levels could contain climate change and inform appropriate prevention and response.
30
30
Global Climate Change and Child HealthGlobal Climate Change and Child Health
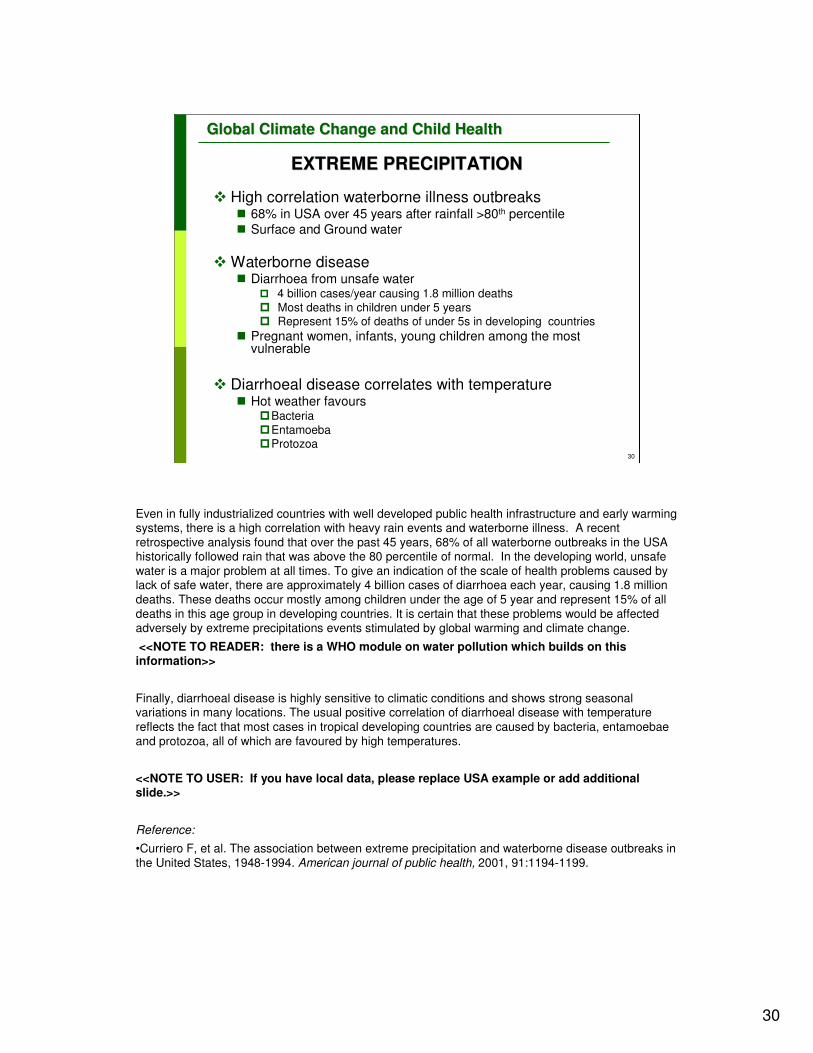
EXTREME PRECIPITATIONEXTREME PRECIPITATION
� High correlation waterborne illness outbreaks� 68% in USA over 45 years after rainfall >80th percentile� Surface and Ground water
� Waterborne disease� Diarrhoea from unsafe water
� 4 billion cases/year causing 1.8 million deaths
� Most deaths in children under 5 years� Represent 15% of deaths of under 5s in developing countries
� Pregnant women, infants, young children among the most vulnerable
� Diarrhoeal disease correlates with temperature� Hot weather favours
�Bacteria
�Entamoeba�Protozoa
Even in fully industrialized countries with well developed public health infrastructure and early warming systems, there is a high correlation with heavy rain events and waterborne illness. A recent
retrospective analysis found that over the past 45 years, 68% of all waterborne outbreaks in the USA historically followed rain that was above the 80 percentile of normal. In the developing world, unsafe
water is a major problem at all times. To give an indication of the scale of health problems caused by lack of safe water, there are approximately 4 billion cases of diarrhoea each year, causing 1.8 million
deaths. These deaths occur mostly among children under the age of 5 year and represent 15% of all
deaths in this age group in developing countries. It is certain that these problems would be affected adversely by extreme precipitations events stimulated by global warming and climate change.
<<NOTE TO READER: there is a WHO module on water pollution which builds on this information>>
Finally, diarrhoeal disease is highly sensitive to climatic conditions and shows strong seasonal variations in many locations. The usual positive correlation of diarrhoeal disease with temperature
reflects the fact that most cases in tropical developing countries are caused by bacteria, entamoebae
and protozoa, all of which are favoured by high temperatures.
<<NOTE TO USER: If you have local data, please replace USA example or add additional slide.>>
Reference:
•Curriero F, et al. The association between extreme precipitation and waterborne disease outbreaks in
the United States, 1948-1994. American journal of public health, 2001, 91:1194-1199.

31
31
Global Climate Change and Child HealthGlobal Climate Change and Child Health
� Higher ambient temperatures
� Different eating behaviour
� Faster growth of food-borne pathogens
� More children hospitalizations for diarrhoea/dehydration
� e.g. 8% increase per °C above normal average during El Niño
Alberta 1992-2000. Reported cases of Campylobacter,
E coli, Salmonella diarrhoea by week and temperature.
Fleury M. Int J Biometerology, 2006,50(6):385-91
Checkley W. Lancet, 2000, 5;355(9202):442-50
FOODFOOD--BORNE INFECTIONBORNE INFECTION
Along with water-borne infections, food-borne infections are also likely to increase with climate change. This is partly because of changes in eating behaviour including more outdoor food preparation and dining, and partly because many food-borne pathogens grow faster in warmer weather. There will be more children with diarrhoea and likely more hospitalizations for dehydration. In one 6-year study from Peru, researchers found an 8% increase in hospitalizations for diarrhoea and dehydration for every degree centigrade above the normal average temperature. This analysis controlled for seasonal variations and long-term trends, thus imparting high confidence to the observed relationship of diarrhoeal disease with temperature.
This chart shows a clear correlation between peak temperatures and peaks in cases of Campylobacter, E coli and Salmonella infections in Alberta, Canada. Hot weather yields more illness.
References:
•Checkley W, et. al. Effect of El Niño and ambient temperature on hospital admissions for diarrhoeal diseases in Peruvian children. Lancet, 2000, 355(9202):442-50.
•Fleury M, et al. A time series analysis of the relationship of ambient temperature and common bacterial enteric infections in two Canadian provinces. Int J Biometeorol, 2006, ;50(6):385-91.
Graph:
•Fleury M, et al. A time series analysis of the relationship of ambient temperature and common bacterial enteric infections in two Canadian provinces. Int J Biometeorol, 2006, 50(6):385-91. Used with copyright permission.

32
32
Global Climate Change and Child HealthGlobal Climate Change and Child Health
GLOBAL WARMING AND GLOBAL WARMING AND
DIARRHOEAL ILLNESSESDIARRHOEAL ILLNESSES
Annual average temperature
and average reporting rates
for diarrheal disease.
Pacific Islands (1986-1994).
r2 = 0.49; p < 0.05.
Singh RB, et al. Environmental Health Perspectives, 2001, 109:155-159.
A similar time series analysis in Fiji assessed the relationship of monthly reported incidence of diarrhoea to variations in temperature and rainfall, allowing for the effects of seasonal variation and long-term trends. The reported incidence increased by approximately 3% for each degree increase in temperature, by 2% per unit increase in rainfall above 5 x 10⁻⁵ kg/m2 per minute (average rainfall conditions), and by 8% per unit decrease in rainfall below this level.
These studies indicate that future changes in mean climatic conditions and in the occurrence of extreme weather events are likely to significantly affect the incidence of diarrhoeal disease in children. As well as meteorological influences on microbial exposures, child diarrhoeal disease may also increase because drinking water becomes contaminated by toxins from warming-induced algal blooms.
Reference:
•Singh RB, et al. The influence of climate variation and change on diarrhoeal disease in the Pacific Islands.Environmental Health Perspectives, 2001, 109:155-159.
Freshwater resources are a high-priority issue in the Pacific region. Water shortage is a serious problem in many small island states, and many depend heavily on rainwater as the source of their water. Lack of safe water supplies is an important factor in diarrheal illness. There have been no previous studies looking specifically at the relationship between climate variability and diarrhea in the Pacific region. We carried out two related studies to explore the potential relationship between climate variability and the incidence of diarrhea in the Pacific Islands. In the first study, we examined the average annual rates of diarrhea in adults, as well as temperature and water availability from 1986 to 1994 for 18 Pacific Island countries. There was a positive association between annual average temperature and the rate of diarrhea reports, and a negative association between water availability and diarrhea rates. In the second study, we examined diarrhea notifications in Fiji in relation to estimates of temperature and rainfall, using Poisson regression analysis of monthly data for 1978-1998. There were positive associations between diarrhea reports and temperature and between diarrhea reports and extremes of rainfall. These results are consistent with previous research and suggest that global climate change is likely to exacerbate diarrheal illness in many Pacific Island countries.
Graph:
•Singh RB, et al. The influence of climate variation and change on diarrhoeal disease in the Pacific Islands.Environmental Health Perspectives, 2001, 109:155-159. Used with copyright permission.

33
33
Global Climate Change and Child HealthGlobal Climate Change and Child Health
VECTORVECTOR--BORNE ILLNESSBORNE ILLNESS
�Enhanced infection prevalence
�Prolonged transmission season
�Extended range
CDC
Global warming is also likely to change the pattern of vector-borne illness because insects and rodents respond quickly to changes in temperature and moisture by migrating and increasing numbers.
The reproduction and survival of blood-feeding vector organisms, such as mosquitoes and ticks, are greatly affected by climate and other ecological factors. Higher temperatures, changes in precipitation, and altered climate variability may therefore change the distribution of vector-borne diseases, both spatially and seasonally.
Immunologically naive populations may thus face unfamiliar pathogens. In some locations, climate change may actually lead to decreased vector-borne disease transmission because of reduced rainfall or excessively high temperatures.
In general, without strong public health defences, the anticipated increases in range and seasonality of pathogens and their vector organisms will cause a greater incidence of various infectious diseases. Children are particularly
susceptible to malaria, dengue fever and various forms of encephalitis. For example, the prevalence of vector-borne illness is likely to increase with global warming because increases in temperature: 1) accelerate vector life cycle 2) shorten incubation time of the parasite in the vector and 3) prolong transmission seasons. Furthermore, higher temperatures will change the range of vectors both in latitude and altitude.
References:
•Epstein P. Emerging diseases and ecosystem instability: new threats to public health. American Journal of Public Health, 1995, 85:168-172.
•Patz J, Reisen W. Immunology, climate change and vector-bome diseases. Trends in Immunology, 2001, 22:171-172.
•Patz J, et al. Effects of environmental change on emerging parasitic diseases. International Journal of Parasitology, 2000, 30:1395-1405.
•Rogers D, Randolph S. The global spread of malaria in a future, warmer world. Science, 2000, 289:1763-1765.
•Sutherst R. The vulnerability of animal and human health to parasites under global change. International Journal of Parasitology, 2001, 31:933-948.
Picture:
•CDC (Centers for Disease Control and Prevention) (www.cdc.gov/malaria/biology/mosquito/index.htm)

34
34
Global Climate Change and Child HealthGlobal Climate Change and Child Health
MALARIAMALARIA
WHO
Malaria is the world's most serious vector-borne disease. About 40% of the world's population currently live in malaria-endemic areas. Various mathematical modelling studies have estimated that increased temperatures will expand the geographical range of conditions conducive to malaria transmission, both to higher altitudes and higher latitudes. Further, elevated temperatures, in combination with conducive patterns of rainfall and surface water, will extend the transmission season in some locations. Some data suggest that global warming may have already exacerbated malaria incidence, especially in areas where transmission is limited by low temperatures or high altitude.
Children experience disproportionately high levels of both morbidity and mortality from malaria. Young children have little specific immunity to malarial species and may therefore suffer yearly attacks of debilitating and potentially fatal disease. Children are also more susceptible to cerebral malaria and to the hypoglycaemia that is secondary to malaria, both of which can lead to neurological damage and, often, death.
While excessive heat kills mosquitoes, warmer average temperatures within their survival range increase their reproduction, biting activity, and the rate at which pathogens mature within them, including the malaria parasite, Plasmodium. Furthermore, warm nights and warm winters in particular favour insect maturation and survival. This is the specific warming pattern that climate change induces, and mosquitoes will therefore probably mature faster and live longer with climate change.
References:
•Epstein P et al. Biological and physical signs of climate change: focus on mosquito-borne infectious diseases. Bulletin of the American Meteorological Society, 1998, 79:409-417.
•Krause P. Malaria (Plasmodium). In: Behrman RE, Kliegman R, Nelson WE, Arvin AM, eds. Nelson Textbook of Pediatrics, WB Saunders and Co., Philadelphia, 2000.
•Martens P. How will climate change affect human health?. American Scientist, 1999, 87:534-541.
•Reiter P. Climate change and mosquito-borne disease. Environmental Health Perspectives, 2001, 109:141-161.
•Sutherst RW. Arthropods as disease vectors in a changing environment. Environmental Change and Human Health, 1993, 175:124-145.
Picture:
•WHO (mosquito.who.int/cmc_upload/0/000/015/372/RBMInfosheet_1.htm)

35
35
Global Climate Change and Child HealthGlobal Climate Change and Child Health
LYME DISEASE IN USALYME DISEASE IN USA
CDC, MMWR, 2003, 52(31);741-750
Greater climate variability will increase the incidence and geographical distribution of other vector-borne diseases, including mosquito-borne encephalitis, tick-borne encephalitis, and Lyme disease.
Children are especially vulnerable to mosquito and tick bites, because they tend to play outside and are closer to the ground where ticks and mosquitoes can be found. The reported incidence of Lyme
disease in the USA is highest among children aged 5–10 years, almost twice that among older children and adults.
Warm winters encourage the overwintering of ticks. Global climate change will therefore foster the
geographical spread of tick-borne diseases. A recent study in Sweden showed that a decade of milder winters and earlier springs in the 1980s was related to a significant increase in the range and
incidence of tick-borne encephalitis.
In the USA, there has been increases in a number of vector-borne illnesses. Lyme disease is one of these. The case rate per thousand has increased almost 20 fold in 20 years. While rarely fatal, Lyme
disease has the potential for long term morbidity. The population at risk is people who work or play outside, including children.
Graph:
•CDC. MMWR. August 8, 2003 , 52(31);741-750

36
36
Global Climate Change and Child HealthGlobal Climate Change and Child Health
LYME DISEASE IN SCANDINAVIA LYME DISEASE IN SCANDINAVIA
Lindgren E. Environ Health Perspect, 2000;108(2):119-23
1980s 1990s
Lyme Disease vector,Ixodes ricinus, moving north as
winters get warmer
CDC
Warm winters encourage the overwintering of ticks. Global climate change will therefore foster the geographical spread of tick-borne diseases. This study from Sweden shows that a decade of milder
winters and earlier springs in the 1980s was related to a significant increase in the range and incidence of tick-borne encephalitis. These maps show the increased tick reservoir. More recently,
Canada has reported Ixodes encroaching on their southern provinces linked to climate change.
Reference:
•Lindgren E. et al. Impact of climatic change on the northern latitude limit and population density of the disease-transmitting European tick Ixodes ricinus. Environ Health Perspect. 2000, 108(2):119-23.
•Ogden NH. et. al. Risk maps for range expansion of the Lyme disease vector, Ixodes scapularis, in
Canada now and with climate change. Int J Health Geogr. 2008, 22;7:24.
Picture:
•Lindgren E. et al. Environ Health Perspect. 2000,108(2):119-23. Used with copyright permission.
•CDC (www.cdc.gov/healthypets/diseases/lyme.htm).

37
37
Global Climate Change and Child HealthGlobal Climate Change and Child Health
THERMAL EXTREMES: HEATTHERMAL EXTREMES: HEAT--RELATED DEATHSRELATED DEATHS
� Decline in winter deaths
� Vulnerable populations
� Elderly
� Debilitated
� Very young
� Urban dwellers
� Economically disadvantaged
CDC, MMWR, 2002, 51(26);567-570
The good news about global warming is that there will be a decline in cold related deaths. The bad news is that there will be more deaths due to heat. It is predicted that small changes in mean climate
conditions will trigger relatively large changes in the frequency and severity of heat waves. Heat waves are therefore expected to increase in number and intensity in the future.
By extrapolation from many prior studies, any future increase in the frequency and severity of heat
waves will increase the risks of death and serious illness. The very old, the very young and the sick are particularly vulnerable to thermal stress. Children are less able than adults to modify their local
(usually domestic) climate, especially if a heat wave is sudden and severe. In children, heat stroke is the most serious outcome of central or peripheral impairment of body temperature regulation, and may
result in death.
For example, the slide shows average annual deaths due to hot weather in US as deaths/million population. While this is clearly more of a problem for the elderly, you can see that the death rate
curve is really a check mark curve with a higher rates at the both extremes of age. Vulnerable populations include also those with debilitating conditions, urban dwellers and the poor. Children can
be in multiple high risk categories.
<<NOTE TO USER: Please substitute local data on health related illness if available.>>
References:
•CDC. MMWR. 5 July 2002, 51(26);567-570 .
During 1979-1999, over 8,015 deaths in the United States was associated with excessive heat exposure†, 3,829 (48%) were "due to weather conditions," 377 (5%) were "of man-made origins" (i.e., heat generated in vehicles, kitchens, boiler rooms, furnace rooms, and factories), and 3,809 (48%) were "of unspecified origin" (3); 182 deaths per year (range: 54-651) were associated with excessive heat due to weather conditions. Of the 3,764 (98%) deaths specified as due to weather conditions with a reported age (3), 142 (4%) occurred among children aged <4 years, and 1,068 (28%) occurred among persons aged >75 years.
•Intergovernmental Panel on Climate Change. Climate change 2007. Impacts, adaptation, and
vulnerability. Fourth Assessment Report, Cambridge, Cambridge University Press, 2007.

38
38
Global Climate Change and Child HealthGlobal Climate Change and Child Health
GLOBAL CLIMATE CHANGE: GLOBAL CLIMATE CHANGE:
INDIRECT (FUTURE) THREATS TO INDIRECT (FUTURE) THREATS TO
CHILDRENCHILDREN’’S HEALTHS HEALTH
Children inherit societies created today�Unequal burden of disease
�Loss of food and water security
�Loss of biological capital
�Forced migration �Sea level rise
�Redistribution of crops
�Desertification, drought
�Reduced economic capacity
�Depression, mental illness
�Violence and terrorismWHO
It is crucial to consider future health effects which may result from global environmental change. Indeed children will inherit the world and societies created now. As world population grows, that
growth is projected to be almost entirely in developing nations. 90% of disaster victims live in developing nations. The effects of global change are likely to be disproportionately felt in these poor
countries with least capacity to respond. Food and water security will become issues of concern, biodiversity is clearly threatened, forced human migration from sea level rise will likely occur and there
are concerns about reduced economic capacity. The WHO and the Harvard University Global Burden
of Disease project suggests that by 2020 one of the two leading causes of morbidity in the world will be depression. And we understand better than ever the spectre of increasing violence and terrorism in
a stressed world.
Picture:
•WHO
39
39
Global Climate Change and Child HealthGlobal Climate Change and Child Health
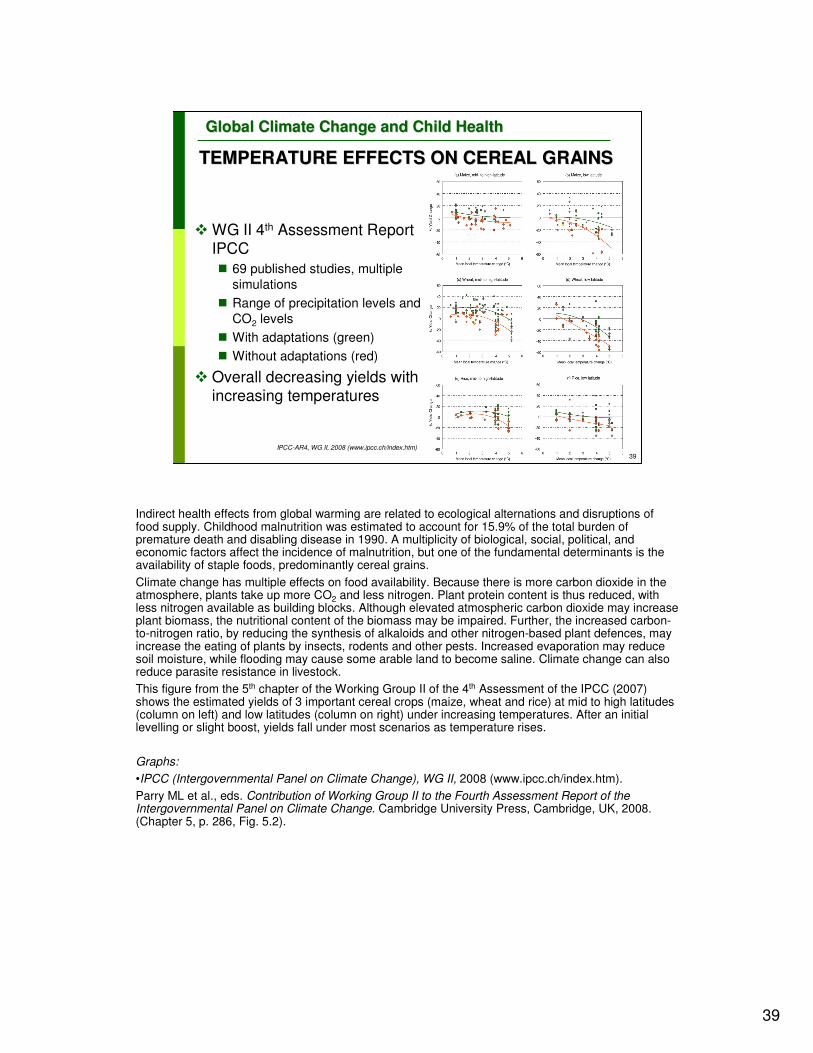
� WG II 4th Assessment Report IPCC
� 69 published studies, multiple
simulations
� Range of precipitation levels and
CO2 levels
� With adaptations (green)
� Without adaptations (red)
� Overall decreasing yields with increasing temperatures
TEMPERATURE EFFECTS ON CEREAL GRAINSTEMPERATURE EFFECTS ON CEREAL GRAINS
IPCC-AR4, WG II, 2008 (www.ipcc.ch/index.htm)
Indirect health effects from global warming are related to ecological alternations and disruptions of food supply. Childhood malnutrition was estimated to account for 15.9% of the total burden of premature death and disabling disease in 1990. A multiplicity of biological, social, political, and economic factors affect the incidence of malnutrition, but one of the fundamental determinants is the availability of staple foods, predominantly cereal grains.
Climate change has multiple effects on food availability. Because there is more carbon dioxide in the atmosphere, plants take up more CO2 and less nitrogen. Plant protein content is thus reduced, with less nitrogen available as building blocks. Although elevated atmospheric carbon dioxide may increase plant biomass, the nutritional content of the biomass may be impaired. Further, the increased carbon-to-nitrogen ratio, by reducing the synthesis of alkaloids and other nitrogen-based plant defences, may increase the eating of plants by insects, rodents and other pests. Increased evaporation may reduce soil moisture, while flooding may cause some arable land to become saline. Climate change can also reduce parasite resistance in livestock.
This figure from the 5th chapter of the Working Group II of the 4th Assessment of the IPCC (2007) shows the estimated yields of 3 important cereal crops (maize, wheat and rice) at mid to high latitudes (column on left) and low latitudes (column on right) under increasing temperatures. After an initial levelling or slight boost, yields fall under most scenarios as temperature rises.
Graphs:
•IPCC (Intergovernmental Panel on Climate Change), WG II, 2008 (www.ipcc.ch/index.htm).
Parry ML et al., eds. Contribution of Working Group II to the Fourth Assessment Report of the Intergovernmental Panel on Climate Change. Cambridge University Press, Cambridge, UK, 2008. (Chapter 5, p. 286, Fig. 5.2).

40
40
Global Climate Change and Child HealthGlobal Climate Change and Child Health
WHAT IS MOST LIKELY?WHAT IS MOST LIKELY?
IPCC-AR4, WG II, 2008 (hwww.ipcc.ch/index.htm)
Of the many possible health consequences of climate change, the Intergovernmental Panel on Climate Change has tried to project within the large uncertainties at the global level, what health
effects are most likely. Here you see that almost all health impacts are negative, and all of them <<CLICK>> are likely to hit children harder than other groups.
Picture:
•IPCC (Intergovernmental Panel on Climate Change), WG II, 2008 (www.ipcc.ch/index.htm).
Parry ML et al., eds. Contribution of Working Group II to the Fourth Assessment Report of the Intergovernmental Panel on Climate Change. Cambridge University Press, Cambridge, UK, 2008. (Chapter 8, p. 418, Fig. 8.3).

41
41
Global Climate Change and Child HealthGlobal Climate Change and Child Health
MODELS WORK TO REGIONAL LEVELMODELS WORK TO REGIONAL LEVEL
IPCC-AR4, WG I, 2007 (www.ipcc.ch/index.htm)
What can be done to address health threats from climate change and prevent future threats? What will the future bring? What tools do we have to help us plan and act responsibly?
Climate models are now tested and useful at the global to continental level. This figure shows the historical record in the black line. The blue shaded areas show model predictions without human
influence or forcings. Notice that these blue areas fail to predict the recent temperature rises,
indicating they are missing some crucial cause of temperature, namely the influence of humans. The pink areas show full model predictions with both “natural” and human forcings taken into account.
The models reproduce within standard confidence what we have measured historically. This is important, because the ability of the models to predict the temperatures in the past gives us greater
confidence that they will also be able to predict temperatures in the future (within the broad band of predictions show as the pink swaths in the Figures).
Picture:•IPCC (Intergovernmental Panel on Climate Change), WG I, 2007 (www.ipcc.ch/index.htm).
Solomon S et al., eds. Contribution of Working Group I to the Fourth Assessment Report of the Intergovernmental Panel on Climate Change. Cambridge University Press, Cambridge, United
Kingdom and New York, NY, USA, 2007 (Fig. SMP5).

42
42
Global Climate Change and Child HealthGlobal Climate Change and Child Health
WHAT DO MODELS PREDICT?WHAT DO MODELS PREDICT?
IPCC-AR4, WG I, 2007 (www.ipcc.ch/index.htm)
This slide shows a predicted range of trajectories for the global average surface temperature. The orange line represents the energy stored in the system based on greenhouse gases already in the air
as of 2000. In other words, if we had magically stopped all emissions as of 2000, warming would continue throughout the century due to carbon dioxide stored in oceans and heat stored in the
oceans and land. The far right bar is more or less status quo with a central prediction of 4 °C rise by 2100, and a 90% confidence range of 2.4 degrees to 6.4 degrees. The intermediate predictions are
based on different scenarios of population growth, social cohesion, technological change and fuel
choices.
There is alarming overlap between these indicators of dangerous climate change and all of the
predictions for temperature change this century. Status quo would put us well above the realm of 4-6 meter sea level rise and into the “massive extinctions” projected by the Intergovernmental Panel on
Climate Change 4th report.
Picture:•IPCC (Intergovernmental Panel on Climate Change), WG I, 2007 (www.ipcc.ch/index.htm).Solomon S et al., eds. Contribution of Working Group I to the Fourth Assessment Report of the Intergovernmental Panel on Climate Change. Cambridge University Press, Cambridge, United
Kingdom and New York, NY, USA, 2007. (Chapter 9, p. 703, Fig. 9.2).

43
43
Global Climate Change and Child HealthGlobal Climate Change and Child Health
Changes Changes ““irreversibleirreversible”” in human timein human time
� Sea level rise (ice behaviour poorly understood)
� Partial melting of Greenland and West Antarctic are expected from temperatures rises 1-4o C above 1990 resulting in 4-6 meter rise in ocean levels
�Total melting is possible within centuries leading to 15 meter rise
�� Species extinctionsSpecies extinctions
� 20-30% of plant and animal species at risk of extinction with >1.5-2.5o C average rise
�Massive extinctions likely with 4-5o C rise
IPCC-4, WG II, www.ipcc.ch/SPM13apr07.pdf
WHAT IS "DANGEROUS CLIMATE CHANGE"? WHAT IS "DANGEROUS CLIMATE CHANGE"?
So, what does this mean in terms of impacts? In 1992, 192 countries signed the UN Framework Convention on Climate Change which commits countries to “prevent dangerous anthropogenic
interference with the climate system”. One way to define this, is as harmful changes that are irreversible on the human time scale. These can be encapsulated in 2 crucial endpoints – sea level rise and species
extinctions. The Intergovernmental Panel on Climate Change predictions are conservative in that they acknowledge the poor level of understanding of ice behaviour and exclude possible effects of the melting
of the big ice sheets of Greenland and Antarctica in their predictions; they do caution that there is
moderate confidence that some melting of these sheets would happen with temperatures between 1 and 4 degree C and result in a 4-6 meter (12-15 foot) sea level rise. This could increase to 15 meters (45 feet)
within a few centuries if both completely melt. It adds up to being a dangerous unknown in the ability to predict the future.
Species extinctions are anticipated, indeed occurring, and as much as 30% of plants and animals are
considered at risk of extinction with as little as 1.5-2.5 °C rise in temperature. Massive extinctions are likely, according to IPCC, with 4-5 °C.

44
44
Global Climate Change and Child HealthGlobal Climate Change and Child Health
PROGRESS CAN BE MADEPROGRESS CAN BE MADE
…… MUSTMUST BE MADEBE MADE
“For all those concerned about the environmental health of children, the time to translate knowledge into action is now.”
WHO WHO
Progress can and must be made in addressing current and future threats to children’s health from global climate change. This quotation <<READ SLIDE>> is from the Bangkok Statement and
emphasizes the urgent need to begin now working to safeguard children’s environmental public health.
Reference:
•WHO. The Bangkok Statement. Bangkok, Thailand: March 2, 2002
(www.who.int/docstore/peh/ceh/Bangkok/bangkstatement.htm).
Pictures:
•WHO

45
45
Global Climate Change and Child HealthGlobal Climate Change and Child Health
� GOAL: ADAPT to warming already assured
� Public Health Infrastructure
� Focus on vulnerable groups and local conditions
ADAPTATION ~ SECONDARY PREVENTIONADAPTATION ~ SECONDARY PREVENTION
� GOAL: AVOID “Dangerous Climate Change”
� Dramatic sea level rise & massive extinctions
� Limit temperature rise to 1-2oC this century
MITIGATION ~ PRIMARY PREVENTIONMITIGATION ~ PRIMARY PREVENTION
““Individual and collective Individual and collective
actions can succeedactions can succeed””Dr. R.K. Pachauri, Chair IPCC
SIMULTANEOUS AND URGENT ACTIONSIMULTANEOUS AND URGENT ACTION
WHO
The chair of the Intergovernmental Panel on Climate Change assures us that individual and collective actions can succeed.
We must focus on 2 goals urgently and simultaneously. We must adapt to the warming that is
already guaranteed. This means giving infusions of resource support to our public health infra-structure and disaster preparedness programs and always remembering a specific focus on
vulnerable populations, the needs of children and future generations. This is a familiar territory and analogous to secondary prevention in health.
We must also engage in effective global mitigation strategies to “prevent dangerous anthropogenic
interference with the climate system”; also familiar territory – primary prevention.
Picture:
•WHO

46
46
Global Climate Change and Child HealthGlobal Climate Change and Child Health
“…“…the largest health inequity of our time.the largest health inequity of our time.””
50 years of 50 years of
Carbon EmissionsCarbon Emissions
Mortality from 4 climateMortality from 4 climate--
sensitive conditionssensitive conditions
Patz JA. EcoHealth, 2007, 4(4):397-405.
GLOBAL RESPONSE: COMMON BUT GLOBAL RESPONSE: COMMON BUT
DIFFERENTIATED RESPONSIBILITYDIFFERENTIATED RESPONSIBILITY
These goals must be pursued globally -- but as the UN Framework Convention on Climate Change stresses-- there is common but differentiated responsibility. This map compares 50 years of carbon emissions <<CLICK>> and mortality from 4 climate sensitive conditions (malaria, diarrhoea, malnutrition and inland flooding). <<CLICK>> As the author, Jonathan Patz, phrases it <<CLICK >> this is the largest health inequity of our time.
So a global response with common but differentiated responsibilities according to capacities.
Reference:
•Patz JA, et. al. Climate change and global health: Quantifying a growing ethical crisis. EcoHealth, 2007, 4(4):397-405.
Climate change, as an environmental hazard operating at the global scale, poses a unique and “involuntary exposure” to many societies, and therefore represents possibly the largest health inequity of our time. According to statistics from the World Health Organization (WHO), regions or populations already experiencing the most increase in diseases attributable to temperature rise in the past 30 years ironically contain those populations least responsible for causing greenhouse gas warming of the planet. Average global carbon emissions approximate one metric ton per year (tC/yr) per person. In 2004, United States per capita emissions neared 6 tC/yr (with Canada and Australia not far behind), and Japan and Western European countries range from 2 to 5 tC/yr per capita. Yet developing countries’ per capita emissions approximate 0.6 tC/yr, and more than 50 countries are below 0.2 tC/yr (or 30-fold less than an average American). This imbalance between populations suffering from an increase in climate-sensitive diseases versus those nations producing greenhouse gases that cause global warming can be quantified using a “natural debt” index, which is the cumulative depleted CO2 emissions per capita. This is a better representation of the responsibility for current warming than a single year’s emissions. By this measure, for example, the relative responsibilities of the U.S. in relation to those of India or China is nearly double that using an index of current emissions, although it does not greatly change the relationship between India and China. Rich countries like the U.S. have caused much more of today’s warming than poor ones, which have not been emitting at significant levels for many years yet, no matter what current emissions indicate. Along with taking necessary measures to reduce the extent of global warming and the associated impacts, society also needs to pursue equitable solutions that first protect the most vulnerable population groups; be they defined by demographics, income, or location. For example, according to the WHO, 88% of the disease burden attributable to climate change afflicts children under age 5 (obviously an innocent and “nonconsenting” segment of the population), presenting another major axis of inequity. Not only is the health burden from climate change itself greatest among the world’s poor, but some of the major mitigation approaches to reduce the degree of warming may produce negative side effects disproportionately among the poor, for example, competition for land from biofuels creating pressure on food prices. Of course, in today’s globalized world, eventually all nations will share some risk, but underserved populations will suffer first and most strongly from climate change. Moreover, growing recognition that society faces a nonlinear and potentially irreversible threat has deep ethical implications about humanity’s stewardship of the planet that affect both rich and poor.
Picture:
•Patz JA, et. al. Climate change and global health: Quantifying a growing ethical crisis. EcoHealth, 2007, 4(4):397-405. Used with copyright permission.

47
47
Global Climate Change and Child HealthGlobal Climate Change and Child Health
REGIONAL AND NATIONAL STRATEGIESREGIONAL AND NATIONAL STRATEGIES
�Improved public health infrastructure
�Water safety
�Sanitation
� Infection surveillance
� Immunization
�Vector control
�Improved housing
�Improved nutrition
�Development and dissemination of clean
technologies
Given that the process of climate change is already underway – as are other global environmental changes – and that the world is committed to the continuation of such change over at least several
decades, societies must now also seek adaptations that will lessen its adverse health impacts. Many
of the climate-amplified risks to children’s health would be lessened by strengthening public health infrastructure and environmental management – including sanitation, fresh water provision,
immunization programmes, mosquito control, improved housing quality, and better and more secure nutrition.

48
48
Global Climate Change and Child HealthGlobal Climate Change and Child Health
LOCAL STRATEGIESLOCAL STRATEGIES
�Educate individuals and communities about
sustainability
�Primary and secondary schoolchildren
�Community leaders
�Sustainable local practices
�Coastal Communities
� Inland Communities
�Urban versus Rural Communities
<<NOTE TO USER: Please complete this slide with actions appropriate for your audience/region>>
There is also a need for increased education of primary and secondary schoolchildren about the need for communities to think and act in ecologically sustainable ways, and about the ways of lessening
personal and family exposure to environmental hazards consequent upon global environmental changes. Finally, there are some risk-reducing responses that are specific to the hazards of
environmental change – such as strengthening coastal defences against rising seas, managing local
and regional fisheries sustainably in order to maintain nutritional (especially protein) supplies, and altering clothing and recreational behaviour to reduce exposure of children to ultraviolet radiation.

49
49
Global Climate Change and Child HealthGlobal Climate Change and Child Health
� Direct patient care� Optimize immunizations and access to care� Teach use of UV, heat, air quality indices, early warning systems and
responses� Identify vulnerable individuals in the practice
� Work with local public health officials� Develop a local “climate-related health risk profile”� Include vulnerable groups’ issues in disaster planning� Develop low toxicity vector control programs� Improve disease reporting and surveillance
� In the Community� Protect drinking water supply and quality� Support local agriculture� Develop broad partnerships and programs across sectors
ROLE OF HEALTH SECTORROLE OF HEALTH SECTORADAPTATION ADAPTATION -- PREPARE FOR THE UNAVOIDABLEPREPARE FOR THE UNAVOIDABLE
The role of the health sector is crucial.
We need to respond in direct patient care by actions like <<READ FIRST BULLET>>.
We need to work at the local public health level to <<READ SECOND BULLET>>.
We need to work directly in the community to do things like <<READ THIRD BULLET>>.

50
50
Global Climate Change and Child HealthGlobal Climate Change and Child Health
HEALTH LEADERSHIPHEALTH LEADERSHIP
Frumkin H. Am J Public Health, 2008, 98(3):435-45.
The good news is that this is really NOTHING NEW – already within standard operating procedures - the 10 essential services of public health - and disaster preparedness and preparations for pandemic flu. We
just need to identify and highlight regional and local conditions likely to worsen with climate change, the most vulnerable populations, and develop protocols and approaches to minimize health impacts.
Reference:
•Frumkin H, et al. Climate change: the public health response. Am J Public Health. 2008, 98(3):435-45.
There is scientific consensus that the global climate is changing, with rising surface temperatures, melting ice and snow, rising sea levels, and increasing climate variability. These changes are expected to have substantial impacts on human health. There are known, effective public health responses for many of these impacts, but the scope, timeline, and complexity of climate change are unprecedented. We propose a public health approach to climate change, based on the essential public health services, that extends to both clinical and population health services and emphasizes the coordination of government agencies (federal, state, and local), academia, the private sector, and nongovernmental organizations.
Picture:
•Frumkin H, et al. Climate change: the public health response. Am J Public Health. 2008, 98(3):435-45.
Used with copyright permission.
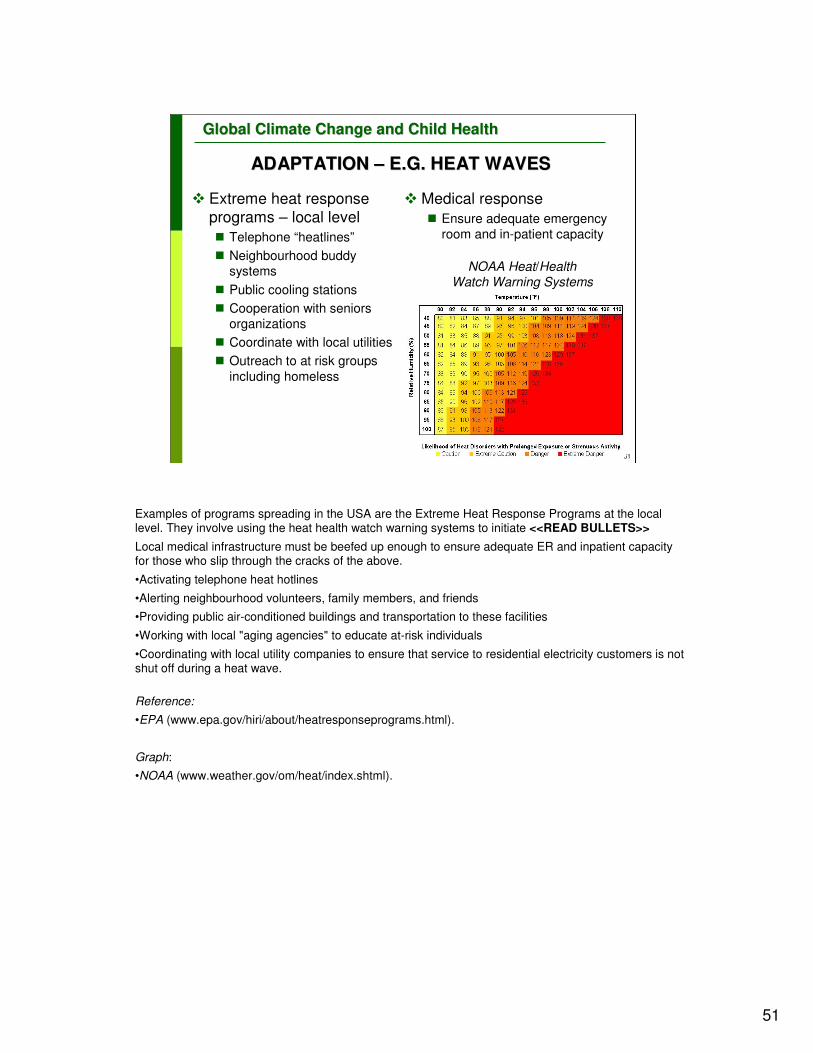
51
51
Global Climate Change and Child HealthGlobal Climate Change and Child Health
ADAPTATION ADAPTATION –– E.G. HEAT WAVESE.G. HEAT WAVES
� Medical response
� Ensure adequate emergency room and in-patient capacity
NOAA Heat/Health Watch Warning Systems
� Extreme heat response programs – local level
� Telephone “heatlines”
� Neighbourhood buddy systems
� Public cooling stations
� Cooperation with seniors organizations
� Coordinate with local utilities
� Outreach to at risk groups
including homeless
Examples of programs spreading in the USA are the Extreme Heat Response Programs at the local level. They involve using the heat health watch warning systems to initiate <<READ BULLETS>>
Local medical infrastructure must be beefed up enough to ensure adequate ER and inpatient capacity for those who slip through the cracks of the above.
•Activating telephone heat hotlines
•Alerting neighbourhood volunteers, family members, and friends
•Providing public air-conditioned buildings and transportation to these facilities
•Working with local "aging agencies" to educate at-risk individuals
•Coordinating with local utility companies to ensure that service to residential electricity customers is not shut off during a heat wave.
Reference:
•EPA (www.epa.gov/hiri/about/heatresponseprograms.html).
Graph:
•NOAA (www.weather.gov/om/heat/index.shtml).
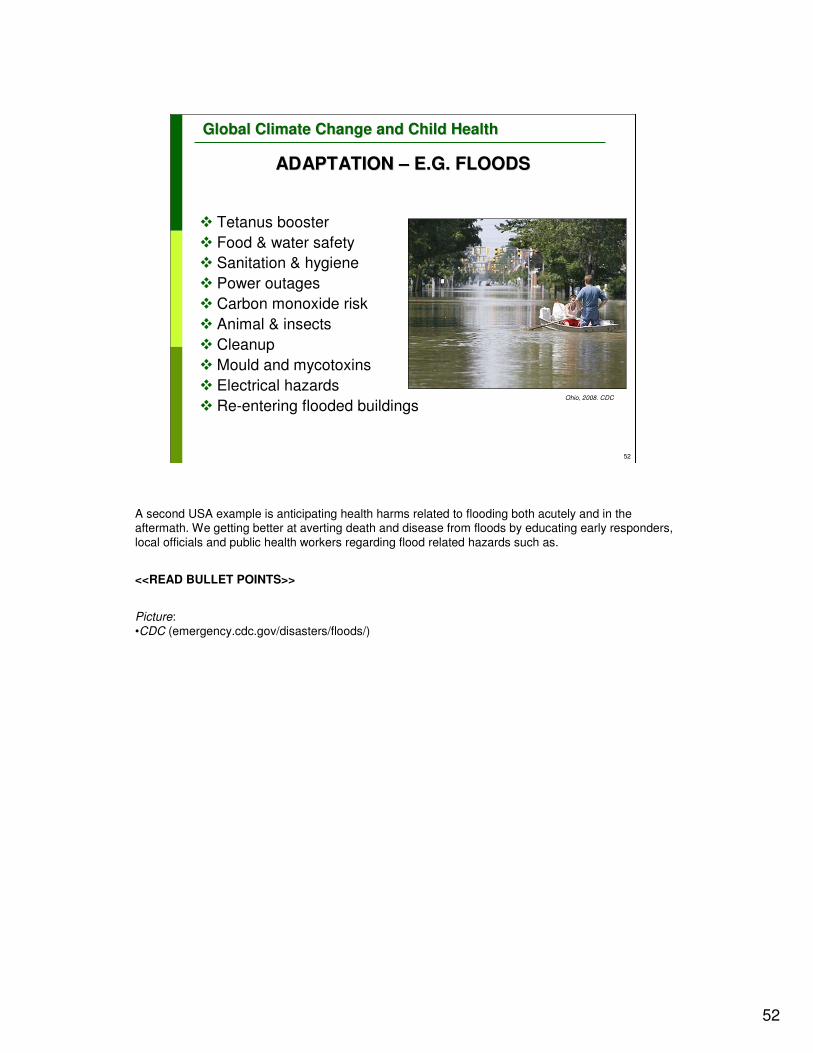
52
52
Global Climate Change and Child HealthGlobal Climate Change and Child Health
ADAPTATION ADAPTATION –– E.G. FLOODSE.G. FLOODS
� Tetanus booster
� Food & water safety
� Sanitation & hygiene
� Power outages
� Carbon monoxide risk
� Animal & insects
� Cleanup
� Mould and mycotoxins
� Electrical hazards
� Re-entering flooded buildingsOhio, 2008. CDC
A second USA example is anticipating health harms related to flooding both acutely and in the aftermath. We getting better at averting death and disease from floods by educating early responders,
local officials and public health workers regarding flood related hazards such as.
<<READ BULLET POINTS>>
Picture:
•CDC (emergency.cdc.gov/disasters/floods/)

53
53
Global Climate Change and Child HealthGlobal Climate Change and Child Health
GENERAL APPROACH TO ADAPTATIONGENERAL APPROACH TO ADAPTATION
1. Determine the scope of the assessment
2. Describe current burden of climate-related
diseases
3. Describe current strategies and approaches to
these diseases
4. Review health impacts in other sectors
5. Assess future potential health impacts
6. Synthesize in report or profile
7. Identify adaptation options and evaluation tools
Ebi KL. Environ Health Perspect, 2006;114(12):1930-4.
Kris Ebi has developed a general approach to climate change adaptation that can be used to develop locally relevant climate risk profiles for adaptation purposes. There are 7 basic steps. It is logical, straightforward, not
overwhelming – but it does require attention and multi-sector cooperation.
Reference:
•Ebi KL, et al. An approach for assessing human health vulnerability and public health interventions to adapt to climate change. Environ Health Perspect, 2006, 114(12):1930-4.

54
54
Global Climate Change and Child HealthGlobal Climate Change and Child Health
LOCAL HEALTH DEPARTMENTS IN USA LOCAL HEALTH DEPARTMENTS IN USA
Representative national sample: 217 local HD directors
with 61% response rate
� CC is (70%) or will be (78%) a significant local health problem
� Only 19% listed CC as a top 10 priority
� 77% perceived lack of local expertise to cope
� Similar or higher numbers for perceived state and federal expertise
� Some programs established on CC-related health problems
� Most common: active transport, food & water safety, and vector control
� Least attention to mental health problems
� Mitigation programs at fewer than 20%
� Least attention to reducing GHG emissions and energy use
Maibach EW. PLoS ONE, 2008;3(7):e2838
Unfortunately, at least in the US, local health departments (HD) are not yet ready for climate change related problems. This paper by Maibach is of a nationally-representative sample of health
department directors. Interestingly, most of them believed climate change was already or would definitely cause health problems for them, but under 1/5 listed it has a top 10 priority. Most believed
they lacked local expertise to cope and more believed there was a lack of state level and federal level expertise to help them cope. Some health departments had programs already established,
which address climate related health conditions, but very few had any mitigation programs going.
There is fertile ground for work at the local health department level on this issue.
Reference:
•Maibach EW, et al. Climate change and local public health in the United States: preparedness, programs and perceptions of local public health department directors. PLoS ONE, 2008,
3(7):e2838.

55
55
Global Climate Change and Child HealthGlobal Climate Change and Child Health
� GOAL: ADAPT to warming already assured
� Public Health Infrastructure
� Focus on vulnerable groups and local conditions
ADAPTATION ~ SECONDARY PREVENTIONADAPTATION ~ SECONDARY PREVENTION
� GOAL: AVOID “Dangerous climate change”
� Dramatic sea level rise & massive extinctions
� Limit temperature rise to 1-2oC this century
MITIGATION ~ PRIMARY PREVENTIONMITIGATION ~ PRIMARY PREVENTION
““Individual and collective Individual and collective
actions can succeedactions can succeed””Dr. R.K. Pachauri, Chair IPCC
SIMULTANEOUS AND URGENT ACTIONSIMULTANEOUS AND URGENT ACTION
WHO
The chair of the Intergovernmental Panel on Climate Change assures us that individual and collective actions can succeed.
We must focus on 2 goals urgently and simultaneously. We must adapt to the warming that is
already guaranteed. This means giving infusions of resource support to our public health infra-structure and disaster preparedness programs and always remembering a specific focus on
vulnerable populations, the needs of children and future generations. This is a familiar territory and analogous to secondary prevention in health.
We must also engage in effective global mitigation strategies to “prevent dangerous anthropogenic
interference with the climate system”; also familiar territory – primary prevention.
Pictures:
•WHO

56
56
Global Climate Change and Child HealthGlobal Climate Change and Child Health
MITIGATION: AVOID THE UNMANAGEABLEMITIGATION: AVOID THE UNMANAGEABLE
�Everyone’s responsibility�CO2 is the main problem
�Action must be individual to international
�Options vary greatly�By regional climate
�By level of development�By institutional organization
��Good for health!Good for health!��Health professionals natural leadersHealth professionals natural leaders
Mitigation is for everyone, at all levels, according to our abilities. Carbon dioxide is the major and growing greenhouse gas and is the logical place to begin mitigation strategies. (See IPCC AR4 reports at
www.ipcc.ch/ipccreports/assessments-reports.htm for further details, graphics and explanations)
<<READ SLIDE>>
The really good thing is that many mitigation strategies are good for health, making health professionals natural
leaders.

57
57
Global Climate Change and Child HealthGlobal Climate Change and Child Health
HEALTH COHEALTH CO--BENEFITS OF MITIGATIONBENEFITS OF MITIGATION
++++++++Infectious Infectious
diseasesdiseases
++++++++++++++Mental healthMental health
++++++++++ObesityObesity--
relatedrelated
++++++++++++++++++++++RespiratoryRespiratory
DiseasesDiseases
++++++++++++++++++++CardiovasculCardiovascul
ar diseasear disease
Improve Improve
transporttransportSustainable Sustainable
urban urban
designdesign
Urban Urban
Heat Heat
IslandIsland
Preserve Preserve
forest forest
sinkssinks
Fossil Fossil
fuel usefuel use
+++ very good evidence, ++ good evidence, + some evidence
Shea K., based on data from Patz J. Annu Rev Public Health, 2008;29:27-39.
And it is even evidence based. Here are standard mitigation strategies and major categories of disease. Look at all the plus signs where improved health and mitigation converge and are supported
by the scientific literature.
Urban Heat Island is a US metropolitan area which is significantly warmer than its surrounding rural
areas.
Reference:
•Patz J. et al. Health impact assessment of global climate change: expanding on comparative risk
assessment approaches for policy making. Annu Rev Public Health. 2008;29:27-39.
Table:
•Dr. K. Shea

58
58
Global Climate Change and Child HealthGlobal Climate Change and Child Health
� 45% average per capita carbon footprint is individual activity – under personal control� Much higher individual footprints in most industrialized nations
� Much lower individual footprints in developing nations
� Mitigation in developed countries – contraction and transition to low/no-carbon energy
� Mitigation in developing countries – “climate proofing” with clean energy and sustainable development as initial strategies
Recognizing this -- World Health Day 2008 was organized around the theme of Protecting Health from climate change. Here’s the astonishing and empowering reality. Globally 45% of per capita
carbon footprint comes from individual activities, choices under our personal control. In the highly industrialized nations the per capita footprint is much higher (eg. 60% in the USA) compared to
footprints in OECD or developing nations. So mitigation in the most developed countries will mean using less energy (contraction), eliminating waste and over consumption and making a rapid
transition to low/no carbon energy. In still developing countries, it means climate proofing the
country by developing with clean energy and sustainable practices as initial strategies.

59
59
Global Climate Change and Child HealthGlobal Climate Change and Child Health
MITIGATION STRATEGIESMITIGATION STRATEGIES
�Personal choices MATTER
�Calculate your carbon footprint
�Reduce it iteratively and tell the stories
�Practice choices MATTER
� “Green” your office and institution
�Educate and innovate
�Political choices MATTER
�Make change locally
�Educate decision makers
�Participate fully in the local political process
www.healthandenvironment.org/?module=uploads&func=download&fileId=418
Mitigation, particularly in the industrialized world, must include changes in personal actions and choices. The Health Community, accustomed to anticipatory guidance, primary prevention and health
values can be leaders at the local level in mitigation. There are many ways to proceed. Some ideas include at the personal level:
1) Calculate your carbon footprint, work to reduce it and tell the stories.
2) At the medical practice level: green your medical offices and institutions (www.gghc.org), educate colleagues, staff and patients about climate change and effective mitigation strategies. Enjoy being
innovative and creative in ways to reduce carbon footprints in the community. Individuals acting collectively through individual changes can make great differences, but political action is also
necessary.
3) Educate local decision makers on the potential health threats from unchecked climate change in your area and the importance of proactive, preventive measures. Become politically engaged to
champion mitigation and adaptation strategies that require government assistance.
The website at the bottom of the slide will guide you to a paper that has lots of ideas and resources
for mitigation strategies.

60
60
Global Climate Change and Child HealthGlobal Climate Change and Child Health
FIND THE WINFIND THE WIN--WIN CHOICES WIN CHOICES –– E.G. USAE.G. USA
�“Burn calories instead of carbon”
�More active transport cleans the air and fights obesity (muscle power is carbon neutral - on the right diet)
�Social time instead of “screen” time
�More interactive family and group time combats isolation and depression
�Eat fresh, local and lower on the food chain
�Supports local farms/economy, improved nutritional quality, lower risk of chronic diseases
�Energy efficiency saves money
�Wealth supports health
From the health perspective, the urgent need for mitigation of greenhouse gases provides opportunities for health co-benefits from major mitigation strategies. The next 2 slides have
examples of possible positives strategies that benefit health and reduce climate change in 2
different examples of fully developed and rapidly developing countries.
In the USA, becoming less car dependent will help fight the obesity epidemic and clean the air of
major pollutants. Moving away from electronic entertainment reduces demand for energy and reinvigorates social interactions which reduces social isolation and fights epidemic depression.
Supporting local agriculture to reduce the long distance transportation of food, as well as eating
fresh and low on the food chain will reduce emissions from production and distribution of food, improve nutrition, reduce the risk of a number of serious health conditions, and support the local
economy. Energy efficiency at home and in the office makes sense because it saves money –liberating wasted dollars for other uses including medicines and medical care for those in need. The
health community can be leaders in finding these Win-Win scenarios and encouraging action at all
levels in order to capitalize on them.

61
61
Global Climate Change and Child HealthGlobal Climate Change and Child Health
FIND THE WINFIND THE WIN--WIN CHOICES WIN CHOICES –– E.G. INDIAE.G. INDIA
� Replace biomass with clean renewable energy and develop “smart” local electrical grids� Reduces emissions and prevents new emissions, prevents
cardiopulmonary diseases and death, gets necessary energy to households
� Improve public transport, create bike lanes� Reduces need for personal vehicle, decreases congestion, noise,
and air pollution, promotes active transport
� Promote solar hot-water and water conservation� Reduces air pollution, promotes health, saves money
� Strengthen traditional diet – continue to eat low on the food chain, local and organic when available� Supports local farms/economy, improved nutritional quality,
prevents obesity, lower risk of chronic diseases
Mitigation in a country like India might include
<<READ BULLETS>>

62
62
Global Climate Change and Child HealthGlobal Climate Change and Child Health
WINWIN--WINWIN--WIN: THE TRIPLE BOTTOM LINEWIN: THE TRIPLE BOTTOM LINE
1. Sustainable communities (Planet)
2. Strong economy (Profit)
3. Health (People)
� Alternative energy – wind, wave, solar� Carbon neutral
� New green jobs, keep energy profits local
� Clean air
� Green buses, more bikes� Reduced cars and emissions
� New “green jobs”
� Clean air, fewer accidents, more physical activity
And many communities are talking about the triple bottom line Planet, Profit, and People – there are triple wins in mitigation strategies.
<<READ BULLETS>>

63
63
Global Climate Change and Child HealthGlobal Climate Change and Child Health
PREVENTION OPTIONSPREVENTION OPTIONS
�International
�Regional/National
�Community
�Individual
WHO
Prevention is always preferred in public health. This applies particularly in this setting, where environmental change processes may acquire momentum and may induce irreversible changes in
important components of the biosphere’s life-support systems. Climate change is a global public health threat of unprecedented scale and urgency. It will require cooperation and leadership at all
levels to discover and implement all the solutions necessary to prevent dangerous climate change. The health sector has an important leadership role to play.
Reference:
•United Nations Framework Convention on Climate Change. New York, United Nations(www.unfccc.int).
Picture:
•WHO (www.who.int/globalchange/en/)

64
64
Global Climate Change and Child HealthGlobal Climate Change and Child Health
We hold our future in our hands
Poster Contest by HRIDAY with support from WHO SEARO
The impacts of global environmental change on child health span a wide spectrum, covering respiratory health, temperature regulation, trauma, nutrition, development, allergy, infectious disease,
mental health, skin cancer, and immunological changes. Nevertheless, there remains a serious lack ofempirical data on how climate change specifically affects child health. Much of this knowledge gap
reflects the fact that global climate change is a recent and inherently slow process. Furthermore, scientific and popular consensuses have only recently converged in recognizing that climate change
and the other global environmental changes require both research and policy attention.
We need more research on how changes in temperature, precipitation and extreme weather events, and their resultant ecological changes, affect children's health. Because many aspects of the
physiology and metabolism of children differ markedly from those of adults, several of the health impacts in children, of climate change and other global environmental changes are likely to be
distinctive.
To protect children fully from these health consequences will require a substantial change in our pattern of economic activities and in our technology choices. By understanding better the range and
extent of risks posed to by climate change and other global environmental changes, we will strengthen the contribution of the health sciences to the ongoing public debate over the future, sustainable,
management of the biosphere.
We must urgently to address the threats to health from climate change because we hold our future in our hands—and it is our children.

65
65
Global Climate Change and Child HealthGlobal Climate Change and Child Health
AcknowledgementsAcknowledgements
WHO and its partners are grateful to the US EPA Office of ChildrWHO and its partners are grateful to the US EPA Office of Childrenen’’s Health s Health Protection for the financial support that made this project possProtection for the financial support that made this project possible and for ible and for some of the data, graphics and text used in preparing these matesome of the data, graphics and text used in preparing these materials for rials for
a broad audience.a broad audience.
First draft prepared by: Katherine M. Shea, MD, MPH (USA)
With the advice of the Working Group Members on Training Packagefor Health Care Providers: Cristina Alonzo, MD (Uruguay); Yona Amitai, MD, MPH (Israel); Stephan Boese-O’Reilly, MD, MPH (Germany); Stephania Borgo, MD (ISDE, Italy); Irena Buka, MD (Canada); Lilian Corra, MD (Argentina); Ligia Fruchtengarten, MD, (Brazil); Amalia Laborde, MD (Uruguay); Leda Nemer, TO (WHO/EURO); R. Romizzi, MD (ISDE, Italy); Katherine M. Shea, MD,MPH (USA).
Reviewers:WHO CEH Training Project Coordination: Jenny Pronczuk, MDMedical Consultant: Ruth A. Etzel, MD, PhD Technical Assistance: Marie-Noël Bruné, MSc
Latest update: December 2009 (C. Espina, PhD)

66
66
Global Climate Change and Child HealthGlobal Climate Change and Child Health
DISCLAIMERDISCLAIMER
� The designations employed and the presentation of the material in this publication do not imply the expression of any opinion whatsoever on the part of the World Health Organization concerning the legal status of any country, territory, city or area or of its authorities, or concerning the delimitation of
its frontiers or boundaries. Dotted lines on maps represent approximate border lines for which there may not yet be full agreement.
� The mention of specific companies or of certain manufacturers’ products does not imply that they are endorsed or recommended by the World Health Organization in preference to others of a similar nature that are not mentioned. Errors and omissions excepted, the names of proprietary products are
distinguished by initial capital letters.
� The opinions and conclusions expressed do not necessarily represent the official position of the World Health Organization.
� This publication is being distributed without warranty of any kind, either express or implied. In no event shall the World Health Organization be liable for damages, including any general, special, incidental, or consequential damages, arising out of the use of this publication
� The contents of this training module are based upon references available in the published literature
as of its last update. Users are encouraged to search standard medical databases for updates in the science for issues of particular interest or sensitivity in their regions and areas of specific concern.
� If users of this training module should find it necessary to make any modifications (abridgement, addition or deletion) to the presentation, the adaptor shall be responsible for all modifications made. The World Health Organization disclaims all responsibility for adaptations made by others. All
modifications shall be clearly distinguished from the original WHO material.