global business aviation tracker may 2020
TRANSCRIPT

GLOBAL BUSINESS AVIATION TRACKER
May 2020
WINGXIntroduction
5/29/2020 | 2© 2020 by WINGX ADVANCE GMBH
› Purpose of this document is to illustrate and explain main features of the Global Daily Tracker
› Screenshots of the Tracker, going down the available scroll
› With filters shown on right hand side
› And illustrations of each pivot table and chart
› With examples below of which data points and insights can be activated
Any questions:

WINGX
5/29/2020 | 3
Global Daily Tracker: view 1
1. Total departures flown during the selected period2. Total hours flown during the selected period3. Difference between departures this vs same period previous4. Difference between hours this vs same period previous5. Day-Day # departures during selected period and in previous period6. Day-Day 7 day rolling average daily flight activity 7. Filters include: time-frame, departure region, state, country, airport
Click here to reset all filters
1
• All charts on the dashboard are instantly responsive to any click on any other chart on the dashboard.
• Underlying data behind any chart can be downloaded to csv file.
• All filters can be de-selected, or all filters re-set at the same time.
Clic
k h
ere
to u
nfo
ld r
igh
t h
and
mar
gin
filt
ers
2 3 4
5 6
7
Login / Logout

WINGX
5/29/2020 | 4
Global Daily Tracker: view 2
1. Data table: Departure Region* / Departures / Trend / Daily #2. Data table: Operator Type* / Departures / Trend / Daily #3. Pie chart splitting activity by flight origin region4. Pie chart splitting activity by operator type5. Filters
*See definitions for Regions and for Operator Type
1
• All charts on the dashboard are instantly responsive to any click on any other chart on the dashboard.
• Underlying data behind any chart can be downloaded to csv file.
• All filters can be de-selected, or all filters re-set at the same time.
Clic
k h
ere
to u
nfo
ld r
igh
t h
and
mar
gin
filt
ers
2
5
2
3
4

WINGX
5/29/2020 | 5
Global Daily Tracker: view 3
1. Column chart showing # of aircraft actively employed for selected time period also compared to the # of aircraft active on the same date in previous period
2. Day-Day # flights and trend vs same date in previous period3. Filters
*See definitions for Regions and for Operator Type
1
• All charts on the dashboard are instantly responsive to any click on any other chart on the dashboard.
• Underlying data behind any chart can be downloaded to csv file.
• All filters can be de-selected, or all filters re-set at the same time.
Clic
k h
ere
to u
nfo
ld r
igh
t h
and
mar
gin
filt
ers
Download options
2
2
3

WINGX
5/29/2020 | 6
Global Daily Tracker: view 4
1. Table showing day-day number of flights and YOY trend in flights2. Opportunity to zoom into more filters3. More filters including
• Fuel uplift• Fuel trend• MTOW• MTOW trend• Hours• Hours Trend
• All charts on the dashboard are instantly responsive to any click on any other chart on the dashboard.
• Underlying data behind any chart can be downloaded to csv file.
• All filters can be de-selected, or all filters re-set at the same time.
Clic
k h
ere
to u
nfo
ld r
igh
t h
and
mar
gin
filt
ers
Expand screens
2
2
3Download data
1
2
3

WINGX
5/29/2020 | 7
Global Daily Tracker: view 5
1. Map to show global distribution of flight departures for selected period by country2. Data table showing flights and flight hours and associated trends by country3. Distribution of global flights by arrival region4. Data table showing flights by arrival region5. Filters
*See Definitions for Regions and for Operator Type
1
• All charts on the dashboard are instantly responsive to any click on any other chart on the dashboard.
• Underlying data behind any chart can be downloaded to csv file.
• All filters can be de-selected, or all filters re-set at the same time.
Clic
k h
ere
to u
nfo
ld r
igh
t h
and
mar
gin
filt
ers
2
3
5
3

WINGX
5/29/2020 | 8
Global Daily Tracker: view 7
1. Opportunity to right-click and select one indicator from Pivot table2. Alternatively, select this from RHS filter
• All charts on the dashboard are instantly responsive to any click on any other chart on the dashboard.
• Underlying data behind any chart can be downloaded to csv file.
• All filters can be de-selected, or all filters re-set at the same time.
1
2

WINGX
5/29/2020 | 9
Global Daily Tracker: view 8
1. Map to show global distribution of flight departures for selected period by airport2. Data table showing flights and flight hours and associated trends by country3. Distribution of global flights by arrival region4. Data table showing flights by arrival region5. Filters
*See definitions for Regions and for Operator Type
1
• All charts on the dashboard are instantly responsive to any click on any other chart on the dashboard.
• Underlying data behind any chart can be downloaded to csv file.
• All filters can be de-selected, or all filters re-set at the same time.
Clic
k h
ere
to u
nfo
ld r
igh
t h
and
mar
gin
filt
ers
2
3
2
3
WINGX
5/29/2020 | 10
Global Daily Tracker: view 9
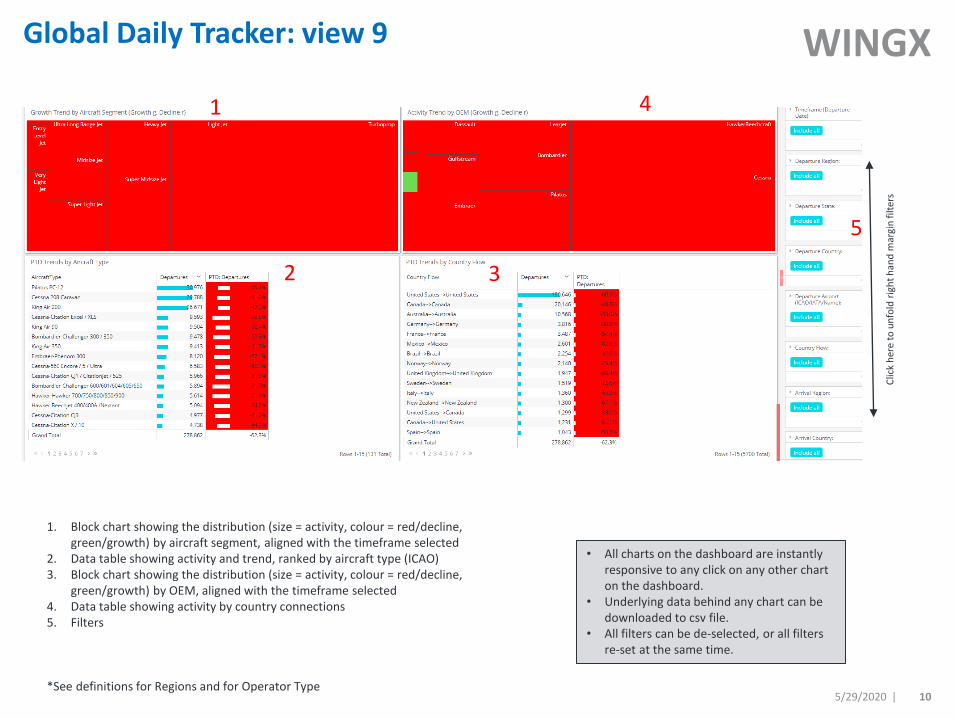
1. Block chart showing the distribution (size = activity, colour = red/decline, green/growth) by aircraft segment, aligned with the timeframe selected
2. Data table showing activity and trend, ranked by aircraft type (ICAO)3. Block chart showing the distribution (size = activity, colour = red/decline,
green/growth) by OEM, aligned with the timeframe selected4. Data table showing activity by country connections5. Filters
*See definitions for Regions and for Operator Type
1
• All charts on the dashboard are instantly responsive to any click on any other chart on the dashboard.
• Underlying data behind any chart can be downloaded to csv file.
• All filters can be de-selected, or all filters re-set at the same time.
Clic
k h
ere
to u
nfo
ld r
igh
t h
and
mar
gin
filt
ers2
12
2 3
4
5

WINGX
5/29/2020 | 11
Global Daily Tracker: view 10
1. Block chart showing the distribution (size = activity, colour = red/decline, green/growth) by aircraft segment, aligned with the timeframe selected
2. Data table showing activity and trend, ranked by aircraft type (ICAO)3. Block chart showing the distribution (size = activity, colour = red/decline,
green/growth) by OEM, aligned with the timeframe selected4. Data table showing activity by country connections5. Filters
*See definitions for Regions and for Operator Type
• All charts on the dashboard are instantly responsive to any click on any other chart on the dashboard.
• Underlying data behind any chart can be downloaded to csv file.
• All filters can be de-selected, or all filters re-set at the same time.
Clic
k h
ere
to u
nfo
ld r
igh
t h
and
mar
gin
filt
ers
5

WINGXDefinitions 1
5/29/2020 | 12© 2020 by WINGX ADVANCE GMBH
› The charts illustrated in this analysis source data from global flight activity sources including Air Traffic Control (such as
Eurocontrol, FAA) and ADSB-networks (such as Flight Radar 24).
› All data analysis is carried out by WINGX Advance through our proprietary data harvesting, cleaning and processing
methodology, and through our design of dashboards via our licensed data visualisation platform.
› Business aviation is defined by a specific fleet of business aviation jet, prop and piston platforms, for non-scheduled
activity only. Where shown, scheduled activity reflects passenger airline traffic, cargo represents activity of dedicated
freight carriers, and hybrid activity is the remainder. Unless otherwise noted, only fixed wing activity is included.
› Timeframe filters allow the selection of periods by hour, day, date, month and year. Trends are shown year-on-year,
comparing to same exact dates as previous year, and year-to-date, for the calendar year selected vs previous period.
› The business aviation aircraft fleet is categorised by cabin size, weight and range, with the following segments:
Bizliner, Ultra Long Range, Heavy Jet, Super Mid-size Jet, Mid-size Jet, Super Light Jet, Light Jet, Entry Level Jet, Very
Light Jet.
› Aircraft Types are identified by ICAO code/name. Dashboards may also allow for filter by the variant of a Type (the
‘model’). Where a type (EG Embraer 135/ERJ has scheduled and business aviation use, the scheduled activity is
excluded.
› Fuel utilisation is measured by the implied uplift of Jet A1 fuel (represented by the city pair sector operated, in terms
of flight hours, distance and specific aircraft type consumption).

WINGXDefinitions 2
5/29/2020 | 13© 2020 by WINGX ADVANCE GMBH
› Operator Types have been defined as follows:
▪ Aircraft Management – Operators mainly managing aircraft on behalf of private owners
▪ Ambulance – Operators known to be dedicated to medical/hospital related purposes
▪ Branded Charter – Pperators known to be primarily focused on chartering (including hours programs)
▪ Cargo – Operators known to be specialist freight carriers
▪ Fractional – Operators operating fleet on behalf of fractional owners
▪ Private – Flight departments operating aircraft on behalf of Owners and Companies
▪ Training/Demo/Maintenance – Flights to and from same airport, and flights from known dedicated Training schools
› Regions are categorised by: North America (includes Mexico), South America, Europe, Oceania (Australia, New
Zealand and Pacific Islands), Asia (includes Middle East, Turkey, Russia), Africa, Europe.

GLOBAL BUSINESS AVIATION TRACKERActionable Business Intelligence
May 2020
WINGX
WINGX ADVANCE GMBH
CONVENTSTR. 8-10 | BUILDING A | 22089 HAMBURG | GERMANY
PHONE +49-40-32 84 69 78
E-MAIL [email protected]
FOLLOW US ON TWITTER @WINGXBIZAV
WWW.WINGX-ADVANCE.COM