global and china tire industry report, 2016- · pdf fileglobal and china tire industry report,...
TRANSCRIPT

Global and China Tire Industry Report,
2016-20202016 2020
Jan.2017
METHODOLOGY
Both primary and secondary research methodologies were used
STUDY GOAL AND OBJECTIVES
This report provides the industry executives with strategically significant Both primary and secondary research methodologies were used
in preparing this study. Initially, a comprehensive and exhaustive
search of the literature on this industry was conducted. These
sources included related books and journals, trade literature,
This report provides the industry executives with strategically significant
competitor information, analysis, insight and projection on the
competitive pattern and key companies in the industry, crucial to the
development and implementation of effective business, marketing and
marketing literature, other product/promotional literature, annual
reports, security analyst reports, and other publications.
Subsequently, telephone interviews or email correspondence
R&D programs.
REPORT OBJECTIVES
T t bli h h i f t l ll d t d d t was conducted with marketing executives etc. Other sources
included related magazines, academics, and consulting
companies.
To establish a comprehensive, factual, annually updated and cost-
effective information base on market size, competition patterns,
market segments, goals and strategies of the leading players in the
market, reviews and forecasts.
INFORMATION SOURCES
The primary information sources include Company Reports,
and National Bureau of Statistics of China etc.
To assist potential market entrants in evaluating prospective
acquisition and joint venture candidates.
To complement the organizations’ internal competitor information
gathering efforts with strategic analysis, data interpretation and
insight.
To suggest for concerned investors in line with the current
development of this industry as well as the development tendencydevelopment of this industry as well as the development tendency.
To help company to succeed in a competitive market, and
understand the size and growth rate of any opportunity.Room 502, Block 3, Tower C, Changyuan Tiandi Building, No. 18, Suzhou Street, Haidian District, Beijing, China 100080 Phone: +86 10 82600828 ● Fax: +86 10 82601570 ● www.researchinchina.com ● [email protected]
Copyright 2012 ResearchInChina

AbstractIn 2016 the steady growth in the global automobile market and the rapid growth of Chinese automobile market stimulated the tire market toIn 2016, the steady growth in the global automobile market and the rapid growth of Chinese automobile market stimulated the tire market to recover slightly. The global tire shipment increased by 2% year on year to 1.963 billion, while China's automotive tire output edged up 1.2% to 572 million. In 2017-2020, Chinese automotive tire market is expected to grow by approximately 4%.
The operating rate of the Chinese market rebounded significantly in 2016, especially showed an uptrend in the off-season after October; in early December the operating rates of all steel tire and semi steel tire plants stayed at 72 7% and 73 4% respectively 10 5 and 7 5early December, the operating rates of all-steel tire and semi-steel tire plants stayed at 72.7% and 73.4% respectively, 10.5 and 7.5 percentage points higher than the same period last year each.
Under the impact of rising natural rubber (which is a raw material) price, China’s tire price has stopped falling to stabilize since the second half of 2016. Most tire companies announced to raise prices, for instance, Michelin, Bridgestone, Continental, Pirelli, Goodyear and other international first-tier brand manufacturers declared price hike at the end of December Along with the bullish trend of the natural rubber priceinternational first tier brand manufacturers declared price hike at the end of December. Along with the bullish trend of the natural rubber price, tires will see a new round of price increase in 2017.
Due to anti-dumping and countervailing investigations launched by the United States, China's tire export suffered a serious setback in 2015, and the annual export volume of automotive tires dropped 4.12% year on year. The figure restored in 2016, and increased by 7.3% year on year from January to November, but the export to the US market declined. The United States will make the final ruling about anti-dumping andyear from January to November, but the export to the US market declined. The United States will make the final ruling about anti dumping and countervailing investigations on China's trucks and buses as well as the austerity policy of the President-elect will put pressure on China's tire export in January 2017, so the export to the US market in 2017 is still not optimistic.
As for enterprises, Bridgestone, Michelin, Goodyear, Continental and Pirelli rank the top five in the world. Amid the fast-growing Chinese automobile market, the world's major tire giants have deployed production bases in China and further increased investment in expansion over , j g p y p pthe recent two years, for example, Continental started its Phase III project in Hefei in November 2015 so as to level up the capacity in China to 14 million tyres/a, Goodyear conducted the expansion of Dalian Plant in November 2016 with a new capacity of 5 million tyres/a.
In a bid to avoid the influence of anti-dumping and countervailing investigations launched as well as trade friction by the United States on export, China's major local manufacturers have accelerated the overseas layout, such as the world's 10th-ranked and China's first-ranked Hangzhou Zhongce Rubber has set up a tire factory in Thailand, Linglong Tire’s Thai Factory Phase I was put into operation in 2016 and Phase II is under construction, Double Coin opened its first overseas factory in Thailand in July 2016.
Room 502, Block 3, Tower C, Changyuan Tiandi Building, No. 18, Suzhou Street, Haidian District, Beijing, China 100080 Phone: +86 10 82600828 ● Fax: +86 10 82601570 ● www.researchinchina.com ● [email protected]
Copyright 2012ResearchInChina

Room 502, Block 3, Tower C, Changyuan Tiandi Building, No. 18, Suzhou Street, Haidian District, Beijing, China 100080 Phone: +86 10 82600828 ● Fax: +86 10 82601570 ● www.researchinchina.com ● [email protected]
Copyright 2012ResearchInChina

In addition, the mergers and restructurings of global and Chinese tire companies swelled in 2016, like: Yokohama Rubber acquiredATG Aeol s Tire took o er Yello Sea R bber and Do ble Happiness T re Ind strial Hengfeng Tires bo ght the assets of DerebaoATG; Aeolus Tire took over Yellow Sea Rubber and Double Happiness Tyre Industrial; Hengfeng Tires bought the assets of Derebaoand Shandong Haolong Rubber Tire. In 2017, the corporate integration trend will be more obvious.
The report highlights the following:Development, trend, etc. of global automobile industry and market; p g yDevelopment, trend, etc. of Chinese automobile industry and market;Development of global tire market, ranking of top 30 companies, development trend, etc.;Tire market size, ranking of top 10 enterprises by revenue and output, import and export, radial tire market development and trend, etc. in China and the United States;Market de elopment price trend and de elopment trend of major tire ra materials s ch as nat ral r bber s nthetic r bber carbonMarket development, price trend and development trend of major tire raw materials such as natural rubber, synthetic rubber, carbon black and the like;Operation and development strategies of 27 key tire enterprises.
Room 502, Block 3, Tower C, Changyuan Tiandi Building, No. 18, Suzhou Street, Haidian District, Beijing, China 100080 Phone: +86 10 82600828 ● Fax: +86 10 82601570 ● www.researchinchina.com ● [email protected]
Copyright 2012ResearchInChina
1 Global Automobile Market and Industry1.1 Global Automobile Market
Table of contents3.10 Top 10 Tire Vendors in China3.11 Tire Anti-dumping in China and the United States
5.14 Nokian5.15 Cheng Shin Tire5 16 Hang ho Zhongce R bber1.2 Automobile Market in the United States
1.3 Automobile Market in Japan and Brazil 1.4 Automobile Market in Britain, France and Germany1.5 Automobile Market in South Korea and Italy
4. Raw Material Market4.1 Natural Rubber4.1.1 Global Natural Rubber Market
5.16 Hangzhou Zhongce Rubber5.17 Triangle Tire5.18 Linglong Tire5.19 Aeolus Tire5.20 Double Coin
2 Chinese Automobile Market and Industry2.1 Overview2.2 Developments2.3 Analysis
4.1.2 Chinese Natural Rubber Market4.1.3 Natural Rubber Price 4.1.4 Layout of Chinese Tire Enterprises in Natural
Rubber4.2 Synthetic Rubber
5.21 Jiangsu General Science Technology 5.22 Guizhou Tire5.23 Qingdao Double Star5.24 Xingyuan5.25 Sailun Jinyu
3. Global Tire Market3.1 Market Size3.2 Ranking 3.3 American Tire Market 3 3 1 M k t Si
4.3 Carbon Black
5. Leading Tire Vendors Worldwide5.1 Michelin5.2 Bridgestone
5 5 S J y5.26 Giti Tire5.27 Shengtai
3.3.1 Market Size3.3.2 Ranking of Tire Dealers3.3.3 Market Share of Major Tire Vendors3.3.4 Market Share of Major OTR Vendors3.3.5 OE Tire Market Analysis
5.2 Bridgestone5.3 Goodyear5.4 Continental5.5 Sumitomo Rubber Group5.6 Pirelli5 7 Y k h R bb3.3.6 North American Automotive Tire Industry
3.4 Chinese Tire Market3.5 China Tire Industry3.6 China's Tire Export3 7 China All-steel Radial Tire Industry
5.7 Yokohama Rubber5.8 Hankook5.9 Cooper5.10 Kumho Tire5.11 Toyo Tire & Rubber3.7 China All steel Radial Tire Industry
3.8 China's Tire Price 3.9 Market Share of Major Tire Vendors in China
Room 502, Block 3, Tower C, Changyuan Tiandi Building, No. 18, Suzhou Street, Haidian District, Beijing, China 100080 Phone: +86 10 82600828 ● Fax: +86 10 82601570 ● www.researchinchina.com ● [email protected]
5.12 Apollo Tyres5.13 MRF
• Global Automobile Output, 2010-2016 • Global Vehicle Sales by Region Jan-Nov 2016
Selected Charts
Global Vehicle Sales by Region, Jan-Nov 2016• Global Monthly Automobile Sales Volume, 2015-2016 • Global Automobile Sales Volume, 2010-2016• Geographical Distribution of Global Light Vehicle Output, 2003-2016• Geographical Distribution of Global Light Vehicle Output, 2016-2023Eg p g p• Automobile Sales Volume in the United States (by Model), 2015-2016• Monthly Automobile Output in the United States, 2015-2016 • Monthly Light Vehicle Sales Volume in the United States, 2015-2016• Accumulative Light Vehicle Sales Volume in the United States (by Manufacturer), 2016 • Automobile Output and Sales Volume in Brazil, 2016• Automobile Sales Volume in Germany, 2016• Automobile Sales Volume in United Kingdom, 2016• Passenger Car Sales Volume in France (by Brand), 2016• S l V l f A t k i S th K 2016• Sales Volume of Automakers in South Korea, 2016• New Car Sales Volume in Italy, 2016• China’s Automobile Sales Volume, 2005-2016• China’s Monthly Automobile Sales Volume, 2016• YoY Growth Rate of China’s Annual Automobile Sales Volume 2008-2016YoY Growth Rate of China s Annual Automobile Sales Volume, 2008 2016 • China’s Automobile Sales Volume and Market Share (by Series), 2009-2016• China's New Energy Vehicle Sales Volume, 2011-2016• China's New Energy Passenger Car Sales Volume, 2012-2016• China's Monthly Automobile Sales Volume, 2010-2016• China's Passenger Car Sales Volume, 2006-2016• China's Commercial Vehicle Sales Volume, 2006-2016
Room 502, Block 3, Tower C, Changyuan Tiandi Building, No. 18, Suzhou Street, Haidian District, Beijing, China 100080 Phone: +86 10 82600828 ● Fax: +86 10 82601570 ● www.researchinchina.com ● [email protected]
• Global Tire Market Size, 2013-2020E• Automotive Tire Market Size, 2014-2020E
Selected Charts
,• Geographical Distribution of Global Tire Shipment, 2017• Global Top 30 Tire Manufacturers by Revenue, 2010-2015• Operating Margin of Global Major Tire Manufacturers, 2011-2015 • Passenger Car OE and Replacement Tire Shipment in the United States, 2004-2016 • Light Truck OE and Replacement Tire Shipment in the United States, 2004-2016 • Medium/Heavy Truck OE and Replacement Tire Shipment in the United States, 2004-2016• Replacement Tire Sales in the United States, 2015• Truck Tire Replacement Market Breakdown, 2000-2015
C Ti Di t ib ti b Ch l d M k t Sh i th U it d St t 1995 2015• Consumer Tire Distribution by Channel and Market Share in the United States, 1995-2015• Distribution of Tire Sales Channels in the United States, 2011 • Share of Replacement Consumer Tire Brands in the United States, 2014-2015• Share of Replacement Consumer Tire Brands in the United States, 2013• Share of Replacement Medium/Heavy Truck Tire Brands in the United States 2015Share of Replacement Medium/Heavy Truck Tire Brands in the United States, 2015• Share of Replacement Medium/Heavy Truck Tire Brands in the United States, 2014• Share of Replacement Medium/Heavy Truck Tire Brands in the United States, 2013• Market Share of Retreaded Truck Tires in the United States, 2015• Most Popular Domestic OE Passenger and LT Tire Sizesp g• Tire Average Price in the United States, 2014-2015 • OE Farm Tire Market Share in the United States, 2014-2015• Replacement Farm Tire Market Share in the United States, 2013• Market Share of OE Tire Suppliers for Chrysler/Fiat, 2014-2015• Market Share of OE Tire Suppliers for BMW, 2014-2015• Market Share of OE Tire Suppliers for Nissan, 2014-2015
Room 502, Block 3, Tower C, Changyuan Tiandi Building, No. 18, Suzhou Street, Haidian District, Beijing, China 100080 Phone: +86 10 82600828 ● Fax: +86 10 82601570 ● www.researchinchina.com ● [email protected]

• Market Share of OE Tire Suppliers for Ford, 2014-2015• Market Share of OE Tire Suppliers for GM, 2014-2015
Selected Charts
pp ,• Market Share of OE Tire Suppliers for TOYOTA , 2014-2015• Market Share of OE Tire Suppliers for HONDA, 2014-2015• Market Share of OE Tire Suppliers for Mercedes-Benz, 2014-2015• Market Share of OE Tire Suppliers for VW, 2014-2015• Ranking of Automobile Tire Manufacturers in North America by Revenue, 2013-2015 • Output of Tire Manufacturers in North America, 2016• China’s Automobile Tire Market Size, 2010-2020E • China’s Automobile Tire OE and Replacement Market Size, 2009-2017
Ti M t hi d R l t A t b T• Tire Matching and Replacement Amount by Type • China’s Automobile Tire Output, 2007-2016• Monthly Operating Rate of Chinese All-steel Tires, 2015-2016• Monthly Operating Rate of Chinese Semi-steel Tires, 2015-2016 • Geographical Distribution of China’s Tire Output 2014Geographical Distribution of China s Tire Output, 2014• Distribution of Chinese Tire Manufacturers • Capacity of First-tier Tire Manufacturers in China • Capacity of Second-tier Tire Manufacturers in China • New Capacity of Chinese Tire Outer Covers, 2006-2016 p y• Output of China’s Top 15 Tire Enterprises, 2013-2016• China’s Automotive Tire Export Volume, 2008-2016 • Share of China’s PCR Tire Major Export Destinations by Export Volume, 2015-2016 • China’s TBR Export Volume and Share of Major Export Destinations, Nov 2016• Monthly Tire Export Volume of China’s Major Provinces, 2016• Top 10 Enterprises in Shandong Province by Tire Export, 2015
Room 502, Block 3, Tower C, Changyuan Tiandi Building, No. 18, Suzhou Street, Haidian District, Beijing, China 100080 Phone: +86 10 82600828 ● Fax: +86 10 82601570 ● www.researchinchina.com ● [email protected]
• U.S. Consumer Tire Imports from China, 2003-2015 • U S Truck Tire Imports from China 2011 2015
Selected Charts
• U.S. Truck Tire Imports from China, 2011-2015• Export Value of Chinese Inflatable Rubber Tires to the United States, 2012-2016• Export Volume of Chinese Rubber Tires to the United States, 2013-2016 • China’s Tire Meridianization Rate, 2004-2016• China’s All-steel Radial Tire Output, 2005-2016p ,• Top 10 All-steel Tire Enterprises in China by Output 2008-2015 • Tire Price Hike of Major Tire Enterprises in China, 2016 • Capacity Distribution of Semi-steel Tire Enterprises in China, 2016 • Capacity Distribution of All-steel Tire Enterprises in China, 2016 • Market Share of Major Sedan Tire OE Manufacturers in China, 2015• Market Share of Major Cross-type Passenger Car Tire Manufacturers in China, 2015• Market Share of Major Truck Tire Manufacturers in China, 2015• Top 10 Tire Manufacturers in China by Tire Revenue, 2013-2016
Si US Ti A ti d i d R lt b th d f 2016• Sino-US Tire Anti-dumping process and Result, by the end of 2016• Statistics of Chinese Bankrupt Tire Enterprises Since 2015• Overseas Layout of Chinese Tire Enterprises • Main Mergers and Acquisitions of Chinese Major Tire Enterprises • Tire Cost StructureTire Cost Structure • Global Natural Rubber Output and YoY Growth, 2008-2016• Global Natural Rubber Output by Country, 2013-2015• Global Natural Rubber Consumption and YoY Growth, 2008-2016• China’s Natural Rubber Output and YoY Growth, 2008-2016p ,• China’s Natural Rubber Self-sufficiency Rate, 2005-2016• China’s Natural Rubber Consumption and YoY Growth, 2008-2016
Room 502, Block 3, Tower C, Changyuan Tiandi Building, No. 18, Suzhou Street, Haidian District, Beijing, China 100080 Phone: +86 10 82600828 ● Fax: +86 10 82601570 ● www.researchinchina.com ● [email protected]

• Import Volume and YoY Growth of Natural Rubber in China, 2004-2016• Natural Rubber Output and Consumption in China, 2015-2020E
Selected Charts
Natural Rubber Output and Consumption in China, 2015 2020E• International Natural Rubber Trend, 2014-2016 • China’s Natural Rubber Price Trend, 2016• Natural Rubber Layout of Chinese Major Tire Enterprises • Synthetic Rubber Output and Consumption in China, 2003-2020E• China’s Butadiene Rubber Price Trend, 2012-2016• China’s Styrene-butadiene Rubber Price Trend, 2012-2016• China’s Carbon Black Capacity, 2007-2016 • China’s Carbon Black Price Trend, 2016
C ’ C 200 2016• China’s Carbon Black Import and Export Volume, 2004-2016• Michelin’s Revenue and Operating Margin, 2004-2016• Michelin’s Operating Income and Margin, 2007-2016• Michelin’s Passenger Car Tire Operating Income and Margin, 2007-H1 2016 • Michelin’s Strong Truck Tire Operating Income and Margin 2007 2016• Michelin s Strong Truck Tire Operating Income and Margin, 2007-2016 • Michelin’s Operating Income Structure by Division, 2010-2016• Michelin’s Revenue by Division, 2009-2016 • Michelin’s Operating Margin by Division, 2009-2016 • Michelin’s Net Sales by Drivers, 2015y ,• Michelin’s Revenue by Region, 2014-H1 2016• Michelin’s Net Sales by Currency, 2015-H1 2016• Michelin’s Quarterly Volumes and Price-mix, 2015-2016• Michelin’s Development Goals, 2017-2020E• Michelin’s Capital Expenditure and Depreciation, 2015-2020E• Michelin’s Financial Goals, 2020E
Room 502, Block 3, Tower C, Changyuan Tiandi Building, No. 18, Suzhou Street, Haidian District, Beijing, China 100080 Phone: +86 10 82600828 ● Fax: +86 10 82601570 ● www.researchinchina.com ● [email protected]
• Michelin’s Operating Margin Goals by Product, 2016-2020E • Michelin’s Brand Passenger Car Volume Growth, 2010-2015
Selected Charts
g ,• Michelin’s Tire Shipment by Size, 2013-2015 • Layout of Michelin’s Passenger Car and Light Truck Tire Factories, 2005-2016• Michelin’s New Light Vehicle Tire Factories in Mexico• Michelin’s PC/LT Tire Capacity and Capacity Utilization, 2012-2020E• Revenue of Michelin China by Region • Distribution of Michelin in China • Distribution of Michelin’s Dealers in China • Accumulative Investment of Shenyang Michelin, 2009-2019E
R f Sh Mi h li 2010 2019E• Ramp-up of Shenyang Michelin, 2010-2019E • Bridgestone’s Revenue and Operating Margin, 2007-2016• Bridgestone’s Revenue by Region, 2004-2016• Bridge Diagram of Bridgestone’s Operating Income, 2016• Bridgestone’s Tire Revenue and Capital Expenditure 2012-2015Bridgestone s Tire Revenue and Capital Expenditure, 2012-2015• Distribution of Bridgestone’s Global Factories, Dec 2016 • Bridgestone’s Tire Output (by Region), 2011-2015 • Bridgestone’s Brand Value, 2010-2016• Distribution of Bridgestone in China g• Goodyear’s Revenue and Operating Margin, 2004-2016• Goodyear’s Sales Volume, 2007-2016• Goodyear’s Sales Volume by Application, 2016-2015 • Goodyear’s Revenue by Region, 2008-2016• Goodyear’s Operating Margin by Region, 2008-2015 • Sales Ratio of Goodyear’s Replacement Tires by Region, 2006-2013
Room 502, Block 3, Tower C, Changyuan Tiandi Building, No. 18, Suzhou Street, Haidian District, Beijing, China 100080 Phone: +86 10 82600828 ● Fax: +86 10 82601570 ● www.researchinchina.com ● [email protected]
• Goodyear’s Tire Sales Volume by Region, 2006-2016 • Goodyear’s Tire Capacity Expansion Project
Selected Charts
y p y p j• Goodyear’s Branded Retail Expansion by Store Type in China, 2010-2015• Goodyear’s Branded Retail Expansion by City Tier in China, 2010-2015• Goodyear’s Tire Layout in China’s Third- and Fourth-tier Cities, 2015-2020E• Continental’s Revenue and Net Income, 2000-2016 • Distribution of Continental’s Subsidiaries, 2015 • Continental’s Revenue by Region and Business Distribution, 2010-2015 • Key Figures of Continental’s Tire Business, 2013-2015• Continental’s Tire Brands
C ti t l’ Ti R b R i 2010&2015• Continental’s Tire Revenue by Region, 2010&2015 • Continental’s PLT Tire Additional Capacity by Region, 2018E • Continental’s Tire Business Development Goals, 2025E • Continental’s PLT Tire Capacity by Region (excluding Europe), 2013-2015• Continental’s PLT Tire Capacity in Europe by Region 2013-2015Continental s PLT Tire Capacity in Europe by Region, 2013-2015• Continental's CV Tire Capacity by Region, 2013-2015• Continental's PLT Tire Sales Volume, 2010-2014• Continental's CV Tire Sales Volume, 2010-2015• Distribution of Continental's Tire factories, 2015• Labor Costs of Continental's Tire factories, 2015• Continental's Tire Business Goals, 2025E • Revenue and Operating Margin of Sumitomo Rubber, 2004-2016 • Operating Income of Sumitomo Rubber, 2011-2015 • Revenue of Sumitomo Rubber by Region, 2007-2015 • Revenue of Sumitomo Rubber by Product, 2007-2016
Room 502, Block 3, Tower C, Changyuan Tiandi Building, No. 18, Suzhou Street, Haidian District, Beijing, China 100080 Phone: +86 10 82600828 ● Fax: +86 10 82601570 ● www.researchinchina.com ● [email protected]

• Operating Income of Sumitomo Rubber by Product, 2007-2016 • Tire Sales Volume of Sumitomo Rubber, 2011-2015
Selected Charts
,• Tire OE/RT Sales Volume of Sumitomo Rubber (by Region), 2014-2016• Tire Sales Volume of Sumitomo Rubber outside Japan by Region, 2009-2016 • Tire Capacity of Sumitomo Rubber by Region, 2011-2016• Tire Output of Sumitomo Rubber, 2009-2016• Output and Capacity Utilization of Sumitomo Rubber, 2006-2016• Pirelli's Revenue and Operating Margin, 2006-2016• Pirelli's Tire Sales by Channel, 2006-2016• Pirelli's Tire Sales by Business, 2012-2015
Pi lli' Ti S l b S t 2013 2015• Pirelli's Tire Sales by Segment, 2013-2015• Pirelli's Tire Sales by Region, 2012-2015• Pirelli's Tire Raw Material Costs, Jan-Sep 2016• Pirelli's Tire Raw Material Costs, 2015• Pirelli's Tire Raw Material Costs 2013Pirelli s Tire Raw Material Costs, 2013• Pirelli's Tire Raw Material Costs, 2014• Geographical Distribution of Pirelli's Employees, 2016• Pirelli's Global Distribution• Revenue and Operating Margin of Yokohama Rubber, 2006-2016 p g g• Tire Revenue of Yokohama Rubber by Region, 2006-2015 • Tire Revenue Distribution of Yokohama Rubber, 2006-2015• Revenue of Yokohama Rubber by Business, 2016 • Capacity of Global Factories of Yokohama Rubber, 2011-2014 • Tire Capacity of Yokohama Rubber, 2014-2020E• Global Layout of Yokohama Rubber
Room 502, Block 3, Tower C, Changyuan Tiandi Building, No. 18, Suzhou Street, Haidian District, Beijing, China 100080 Phone: +86 10 82600828 ● Fax: +86 10 82601570 ● www.researchinchina.com ● [email protected]

• Expansion Plan of Yokohama Rubber, 2014-2020• Hankook’s Tire Revenue and Operating Margin, 2003-2016
Selected Charts
p g g ,• Hankook’s Revenue by Region, Q4 2013-Q4 2014• Hankook’s Tire Revenue by Region, 2015• Hankook’s Expanding TBR OE and Fleet Business in Europe, 2016• Hankook’s Tire Output by Region, 2005-2015 • Quarterly Revenue and Gross Margin of Hankook China, 2015-2016• Cooper’ Facts• Cooper’s Revenue and Operating Margin, 2004-2016• Cooper’s Revenue by Region, 2006-2016
C ’ R b P d t 2012• Cooper’s Revenue by Product, 2012 • Cooper’s Factory Distribution, 2015 • Cooper’s Capex, M&A and Dividend, 2013-2016• Facts of Qingdao GRT• Revenue and Operating Margin of Kumho Tire 2005-2016Revenue and Operating Margin of Kumho Tire, 2005-2016 • Capacity Distribution of Kumho Tire • Revenue of Kumho Tire by Region, 2013-2015 • Shipment and ASP of Kumho Tire, 2009-2013 • Global Sales Trend of High-inch Tires of Kumho Tire, 2010-Q3 2016g• Output of Kumho Tire by Region, 2012-2016 • Trend of Quarterly Raw Material Costs (Based on Input Costs) of Kumho Tire, 2014-2016• Revenue and Operating Margin of Kumho Tire China, Q4 2013-Q1 2016 • Quarterly Output of Kumho Tire in China, 2015-2016• Revenue and Operating Margin of Toyo Tire & Rubber, 2007-2016 • Operating Income of Toyo Tire & Rubber, 2015-2016
Room 502, Block 3, Tower C, Changyuan Tiandi Building, No. 18, Suzhou Street, Haidian District, Beijing, China 100080 Phone: +86 10 82600828 ● Fax: +86 10 82601570 ● www.researchinchina.com ● [email protected]

• Revenue of Toyo Tire & Rubber by Region, 2007-2016 • Output of Toyo Tire & Rubber by Region, 2011-2016
Selected Charts
p y y g ,• Sales Volume of Toyo Tire & Rubber by Region, 2011-2016 • Apollo Tyres at a Glance, 2016• Regional Distribution of Apollo Tyres, 2016• Development Course of Apollo Tyres• Revenue and Net Profit Margin of Apollo Tyres, FY2007-FY2016• Revenue of Apollo Tyres by Product, FY2015 • Major Copartners of Apollo Tyres, 2016• Revenue and Capacity of Apollo Tyres by Region, FY2012
R f A ll T b R i• Revenue of Apollo Tyres by Region • Operating Income of Apollo Tyres by Region • MRF’s Revenue and Profit, FY2006-FY2016• Nokian’s Revenue and Operating Margin, 2004-2016• Nokian’s Revenue by Region 2013-2016Nokian s Revenue by Region, 2013-2016• Nokian’s Revenue by Business, 2012-2016 • Nokian’s EBIT Margin by Division, 2013-2016• Nokian’s Raw Material Cost Development, 2010-2016• Nokian’S Raw Material Consumption, 2016p• Nokian’s Global Distribution, 2016 • Revenue and Operating Margin of Cheng Shin Tire, 2003-2016 • Rubber Capacity of Cheng Shin Tire, 2016 • Global Distribution of Factories of Cheng Shin Tire, 2016 • Introduction to Factories of Cheng Shin Tire• Revenue of Major Subsidiaries of Cheng Shin Tire, 2015-H1 2016
Room 502, Block 3, Tower C, Changyuan Tiandi Building, No. 18, Suzhou Street, Haidian District, Beijing, China 100080 Phone: +86 10 82600828 ● Fax: +86 10 82601570 ● www.researchinchina.com ● [email protected]

• Revenue of Cheng Shin Tire by Subsidiary, H1 2016• Revenue of Cheng Shin Tire by Region, 2011-2015
Selected Charts
g y g ,• Revenue of Cheng Shin Tire by Product, 2012-2016 • Revenue of Cheng Shin Tire by Product and Shipment, H1 2016 • Revenue of Cheng Shin Tire by Region, H1 2016 • Raw Material Cost Structure of Cheng Shin Tire, H1 2016• CST’s Revenue by OE & RE Customer, H1 2016• Vehicle Models Supported by Cheng Shin Tire in China• Hangzhou Zhongce Rubber, 2016 • Revenue and Operating Margin of Hangzhou Zhongce Rubber, 2007-2016
R d O t t f H h Zh R bb 2007 2016• Revenue and Output of Hangzhou Zhongce Rubber, 2007-2016 • Tire Brands of Hangzhou Zhongce Rubber• Organizational Structure of Hangzhou Zhongce Rubber• Revenue and Operating Margin of Triangle Tire, 2013-2016 • Revenue and Output of Triangle Tire 2013-2016Revenue and Output of Triangle Tire, 2013-2016• Capacity, Output and Sales Volume of Triangle Tire (by Application), 2013-2016• Capacity, Output and Sales Volume of Triangle Tire (by Product), 2013-2016• Revenue and Structure of Triangle Tire (by Application), 2013-2016• Revenue and Structure of Triangle Tire (by Product), 2013-2016g ( y )• Replacement & OEM Revenue and Percentage of Triangle Tire, 2013-2016• Overseas Revenue and Structure of Triangle Tire (by Region), 2013-2016• All-steel Tire Revenue and Gross Margin of Triangle Tire, 2013-2016• Semi-steel Tire Revenue and Gross Margin of Triangle Tire, 2013-2016• Bias Tire Revenue and Gross Margin of Triangle Tire, 2013-2016• Distribution of Triangle Tire’s Subsidiaries
Room 502, Block 3, Tower C, Changyuan Tiandi Building, No. 18, Suzhou Street, Haidian District, Beijing, China 100080 Phone: +86 10 82600828 ● Fax: +86 10 82601570 ● www.researchinchina.com ● [email protected]

• Revenue and Operating Margin of Linglong Tire, 2007-2016 • Revenue and Output of Linglong Tire, 2007-2016
Selected Charts
p g g ,• Revenue of Linglong Tire (by Region), 2013-2016 • Sales Volume and Revenue of Linglong Tire (by Product), 2013-2015• Gross Margin and Revenue Structure of Linglong Tire (by Product), 2013-2015• Capacity, Output and Sales Volume of Linglong Tire (by Product), 2013-2016• Distribution of Linglong Tire’s Subsidiaries • Linglong Tire’s Major Projects under Construction, 2016• Revenue and Operating Margin of Aeolus Tire, 2006-2016 • Output and Sales Volume of Aeolus Tire, 2014-2016
O i ti l St t f A l Ti• Organizational Structure of Aeolus Tire• Revenue and Operating Margin of Double Coin, 2005-2014 • Revenue and Operating Margin of Shanghai Huayi Group, 2013-2016 • Output of Double Coin (by Product), 2010-2016• Tire Revenue and Operating Costs of Shanghai Huayi Group 2015-2016Tire Revenue and Operating Costs of Shanghai Huayi Group, 2015-2016 • Revenue and Structure of Jiangsu General Science Technology (by Product/Sales Model), 2013-2016• Tire Capacity and Output of Jiangsu General Science Technology by Type, 2013-2016 • Tire Output and Sales Volume of Jiangsu General Science Technology by Type, 2013-2016• Revenue and Structure of Jiangsu General Science Technology (by Product), 2013-2016g gy ( y )• All-steel Tire Revenue and Structure of Jiangsu General Science Technology (by Region), 2013-2016• Bias Tire Revenue and Structure of Jiangsu General Science Technology (by Region), 2013-2016• Gross Margin of Jiangsu General Science Technology (by Product), 2013-2016• Tire Cost Structure of Jiangsu General Science Technology, 2016 • Equity Structure of Jiangsu General Science Technology • Revenue and Operating Margin of Guizhou Tire, 2006-2016
Room 502, Block 3, Tower C, Changyuan Tiandi Building, No. 18, Suzhou Street, Haidian District, Beijing, China 100080 Phone: +86 10 82600828 ● Fax: +86 10 82601570 ● www.researchinchina.com ● [email protected]

• Tire Output of Guizhou Tire by Type, 2013-2016• Tire Output and Sales Volume of Guizhou Tire 2013 2016
Selected Charts
• Tire Output and Sales Volume of Guizhou Tire, 2013-2016 • Sales Volume and Revenue of Guizhou Tire (by Product), 2015• Export Volume and Value of Guizhou Tire, 2013-2015• Revenue and Operating Margin of Qingdao Double Star, 2004-2016 • Tire Capacity, Output and Sales Volume of Qingdao Double Star (by Product), 2013-2015Tire Capacity, Output and Sales Volume of Qingdao Double Star (by Product), 2013 2015• Export Volume and Value of Qingdao Double Star, 2013-2015• Xingyuan’sRevenue and Operating Margin, 2007-2013 • Revenue and Operating Margin of Sailun Jinyu, 2009-2016• Revenue of Sailun Jinyu by Product, 2013-2016 • Gross Profit and Gross Margin of Sailun Jinyu by Product, 2013-2016 • Tire Revenue of Sailun Jinyu (by Region), 2013-2015 • Tire Capacity, Output and Sales Volume of Sailun Jinyu, 2013-2015• Tire Cost Structure of Sailun Jinyu, 2013-2015• SailunJinyu’s Major Projects under Construction, 2016• Revenue by Geographical Location, 2012• Revenue and Operating Income of Giti Tire, 2006-2015
Room 502, Block 3, Tower C, Changyuan Tiandi Building, No. 18, Suzhou Street, Haidian District, Beijing, China 100080 Phone: +86 10 82600828 ● Fax: +86 10 82601570 ● www.researchinchina.com ● [email protected]
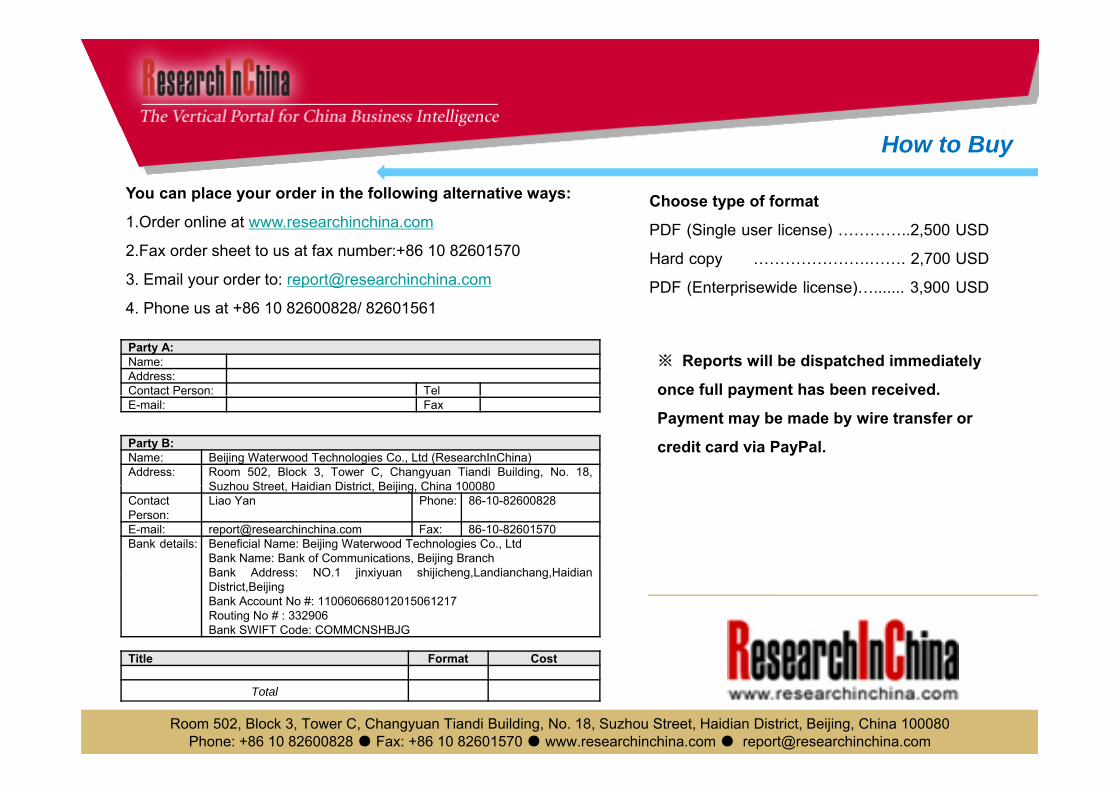
You can place your order in the following alternative ways:
1 O d li hi hiChoose type of format
How to Buy
1.Order online at www.researchinchina.com
2.Fax order sheet to us at fax number:+86 10 82601570
3. Email your order to: [email protected]
4 Phone us at +86 10 82600828/ 82601561
PDF (Single user license) …………..2,500 USD
Hard copy ………………….……. 2,700 USD
PDF (Enterprisewide license)…....... 3,900 USD4. Phone us at +86 10 82600828/ 82601561
Party A:Name:Address:Contact Person: Tel
※ Reports will be dispatched immediately
once full payment has been received. E-mail: Fax
Party B:Name: Beijing Waterwood Technologies Co., Ltd (ResearchInChina)Address: Room 502, Block 3, Tower C, Changyuan Tiandi Building, No. 18,
Suzhou Street Haidian District Beijing China 100080
p y
Payment may be made by wire transfer or
credit card via PayPal.
Suzhou Street, Haidian District, Beijing, China 100080ContactPerson:
Liao Yan Phone: 86-10-82600828
E-mail: [email protected] Fax: 86-10-82601570Bank details: Beneficial Name: Beijing Waterwood Technologies Co., Ltd
Bank Name: Bank of Communications, Beijing BranchBank Address: NO 1 jinxiyuan shijicheng Landianchang HaidianBank Address: NO.1 jinxiyuan shijicheng,Landianchang,HaidianDistrict,BeijingBank Account No #: 110060668012015061217Routing No # : 332906Bank SWIFT Code: COMMCNSHBJG
Title Format Cost
Total
Room 502, Block 3, Tower C, Changyuan Tiandi Building, No. 18, Suzhou Street, Haidian District, Beijing, China 100080 Phone: +86 10 82600828 ● Fax: +86 10 82601570 ● www.researchinchina.com ● [email protected]
About ResearchInChina
RICDB service
ResearchInChina (www.researchinchina.com) is a leading independent provider of China business intelligence. Our research is designed to meet the diverse planning and information needs of businesses, institutions, and professional investors worldwide. Our services are used in a variety of ways, including strategic planning, product and sales forecasting,risk and sensitivity management, and as investment research.Our Major Activities
Multi-users market reports
Database-RICDB
Custom Research
Company Search
RICDB (http://www researchinchina com/data/database html ) is a visible financial data base presented by map and graphRICDB (http://www.researchinchina.com/data/database.html ), is a visible financial data base presented by map and graph covering global and China macroeconomic data, industry data, and company data. It has included nearly 500,000 indices (based on time series), and is continuing to update and increase. The most significant feature of this base is that the vast majority of indices (about 400,000) can be displayed in map.
After purchase of our report, you will be automatically granted to enjoy 2 weeks trial service of RICDB for free.
After trial, you can decide to become our formal member or not. We will try our best to meet your demand. For more information, please find at www.researchinchina.com
For any problems, please contact our service team at:Room 502, Block 3, Tower C, Changyuan Tiandi Building, No. 18, Suzhou Street, Haidian District, Beijing, China 100080
Phone: +86 10 82600828 ● Fax: +86 10 82601570 ● www.researchinchina.com ● [email protected]