global 500 financial brands 2008
TRANSCRIPT

8/9/2019 Global 500 Financial Brands 2008
http://slidepdf.com/reader/full/global-500-financial-brands-2008 1/45
Contents
Foreword 3
Brand Finance Banking 500
A review of the top
financial service brands in the world
January 2008

8/9/2019 Global 500 Financial Brands 2008
http://slidepdf.com/reader/full/global-500-financial-brands-2008 2/45
--------------------------------------------------------------------------------------------------------------------
2007 - Brand Finance Banking 500 © Brand Finance plc 2008 2
About Brand Finance 4
Executive Summary 5
1. Introduction: A review of the global financial services industry in 2007 6
2. The Global 500 Financial Brands Index (1‐100) 8
3. Commentary on the top 20 banking brands 8
4. Top five banks by segment 20
5. What role does ‘brand’ play in consumer and business banking? 22
6. Accounting and tax implications of banks’ brand values 26
(i) The Impact of IFRS3 on banking businesses 26
(ii) Key requirements of IFRS 3 with implications for brand and other intangible
asset valuation 27
(iii) Tax planning: IP‐holding companies 29
Appendix 30
(i) The growth of intangible assets 30
(ii) Explanation of Brand Valuation Methodology 32
(iii) Notes on the Global 500 Financial Brands Index 35
(iv) The Global 500 Financial Brands Index (101 ‐500) 36

8/9/2019 Global 500 Financial Brands 2008
http://slidepdf.com/reader/full/global-500-financial-brands-2008 3/45
--------------------------------------------------------------------------------------------------------------------
2007 - Brand Finance Banking 500 © Brand Finance plc 2008 3
Foreword This report, initially published in 2006, was the first publicly available table analysing the financial value of the world’s top one hundred banking brands. It is published
annually and incorporates data from the world’s thirty ‐two largest stock markets. This year we have also extended our analysis to the top 500 global brands. Each brand has been accorded a Brand Rating: a benchmarking study of the strength, risk and future potential of a brand relative to its competitor set, and a Brand Value: a summary measure of the financial strength of the brand.
Since the late 1990s, the banking industry has entered a wave of mergers and acquisitions in which brands are
being
combined,
consolidated
and
created.
Brand
Finance’s league tables take into consideration a sector approach in which brands are compared against their peers and provide an aggregate finding of the value generated by these businesses and their brand strategies.
Among the latest developments in the financial services industry clearly the sub ‐prime crisis stands out, and has had considerable influence on this year’s rankings. The crisis has resulted in significantly adjusted expectations of future financial performance, enterprise values and brand values. In addition we have seen the emergence of powerful financial institutions from the Chinese market in the top 20 most valuable brands in the sector, indicating significant changes in the global financial market power base.
This report serves to provide an opinion as to point ‐in‐time valuations of the biggest banking brands, and also illustrates how the methodology and findings can be used to determine the impact of brand equity on business performance.
David Haigh Chief Executive Brand Finance Plc

8/9/2019 Global 500 Financial Brands 2008
http://slidepdf.com/reader/full/global-500-financial-brands-2008 4/45
--------------------------------------------------------------------------------------------------------------------
2007 - Brand Finance Banking 500 © Brand Finance plc 2008 4
About Brand FinanceBrand Finance is an independent consultancy focused on the management and valuation of brands and of branded businesses. Since 1996, Brand Finance has
performed hundreds
of
brand
valuations
with
an
aggregate
value
of
over
$150
billion.
The valuations have been in support of a variety of business needs including:
• Technical valuations for accounting, tax and legal purposes • Valuations in support of commercial transactions (acquisitions, divestitures,
licensing and joint ventures) involving different forms of intellectual property • Valuations as part of a wider mandate to deliver value ‐based marketing strategy
and tracking, thereby bridging the gap between marketing and finance.
Brand Finance is headquartered in London and has representative offices in Toronto,
New York,
Santiago,
São
Paulo,
Madrid,
Amsterdam,
Paris,
Zagreb,
Moscow,
Dubai,
Bangalore, Colombo, Singapore, Hong Kong, Sydney, Istanbul, Cape Town and Geneva.
www.brandfinance.com
Please note that all figures in this report are in US dollars unless stated otherwise.

8/9/2019 Global 500 Financial Brands 2008
http://slidepdf.com/reader/full/global-500-financial-brands-2008 5/45
--------------------------------------------------------------------------------------------------------------------
2007 - Brand Finance Banking 500 © Brand Finance plc 2008 5
Executive Summary
•
Only two bank brands: HSBC and American Express receive triple ‘A’ (AAA‐ to AAA) brand ratings.
• Among the top 20 brands, American Express has one of the highest percentage of brand value to market capitalisation (31%) and the second lowest market capitalisation ($51,455 million).
• On average consumer banks display a higher brand value to market capitalisation than investment banks. This is the result of the fact that consumer banking involves more emotional and image related factors than business and wholesale
banking. • As we forecast in our 2006 report, Chinese banks have emerged as significant
players on the global stage. Three Chinese banks now appear as part of the top 25 brands: Industrial & Commercial Bank of China, China Construction Bank and Bank of China did not feature in our valuation last year due to lack of data, but are now among the top players following IPOs.
• The merger between Banca Intesa and Sanpaolo IMI in Italy led to a combined brand ranked 19th this year. Banca Intesa ranked 49th last year, and Sanpaolo IMI
was not
part
of
the
top
100
brands.
We
expect
this
trend
to
continue
with
a focus
on emerging markets brands in the future.
• Banks that are domiciled in large and rapidly emerging markets, such as Brazil, Russia, India and China (the ‘BRIC’ countries) continue to benefit from rapid economic growth in their territories. For example, Brazil has three banks among the top 60 brands: Banco Bradesco ($4,106 million), Banco do Brasil ($4,008 million), and Banco Itau ($3,500 million), ranked 42nd, 45th and 53rd respectively, China has three banks: Industrial & Commercial Bank of China ($8,427 million), China Construction Bank ($7,786 million) and Bank of China ($6,741 million),
ranked 16th,
18th
and
23rd
respectively,
Russia
has
one
bank:
Sberbank
($3,418
million) ranked 55th, and India’s State Bank of India ($2,852 million) is ranked 59th.
• The sub ‐prime mortgage financial crisis that started in the American market and became a global financial crisis in 2007 has affected revenues, market capitalisation, and therefore brand values of many financial institutions.

8/9/2019 Global 500 Financial Brands 2008
http://slidepdf.com/reader/full/global-500-financial-brands-2008 6/45
--------------------------------------------------------------------------------------------------------------------
2007 - Brand Finance Banking 500 © Brand Finance plc 2008 6
1. Introduction: A review of the global financialservices industry in 2007
2007 was characterised by a global financial crisis that had its inception with the sub ‐
prime mortgage crisis in the United States. Defaults and foreclosure activity in the U.S. housing market grew significantly in the second semester, leading to serious instability in the global financial market.
Mortgage lenders were the first to be hit by the crisis. Through securitization many of these lenders had passed related default risk on mortgage payments to third party investors through MBS – mortgage backed securities – and these investors incurred significant losses. Furthermore, collaterised debt obligations – CDOs (an asset ‐backed security and structured credit product) and structured investment vehicles – SIVs (another type of structured credit product) also held significant amounts of MBS,
leading to decreases in value in these products.
As the crisis widened and the risk of default impacted financial markets globally, banks either reduced the number of loans to other banks or increased interest rates charged for lending money. Liquidity became a worldwide issue, leading central banks to take action and support member banks in lending funds to credible borrowers.
Impact on Financial Corporations
Major banks have been affected by the sub ‐prime crisis in a number of ways:
• Increase in the cost of capital; • Earnings were hit by defaults on mortgages that banks issued and retained; • Since mortgage assets or receivables are valued based on estimates of collections,
this led to an increase in bad debt reserves, and a decrease in earnings; • Changes in asset valuation led to volatility in earnings and stock prices.
The combination of default risk and liquidity risk in this case caused various corporations and hedge funds to go bankrupt. There were significant stock market declines in financial corporations, led mainly by major losses due to the holding of
MBS.
Sovereign wealth funds from the United Arab Emirates, China and the Middle East have been playing a significant role in “rescue refinancing” of the write ‐downs and losses caused by the sub ‐prime crisis. This could become a cause for concerns due to the exercising control and influence these funds might have in the U.S. financial system.
As of December 2007, an estimated $80 billion of sub ‐prime related losses or write ‐downs had been reported, with Citigroup’s loss accounting for approximately $18
billion, followed
by
UBS
(over
$13
billion).
According
to
Wall
Street
analyst’s
further
write ‐downs are expected.

8/9/2019 Global 500 Financial Brands 2008
http://slidepdf.com/reader/full/global-500-financial-brands-2008 7/45
--------------------------------------------------------------------------------------------------------------------
2007 - Brand Finance Banking 500 © Brand Finance plc 2008 7
Our previous ranking used reported financial information through 31/12/05. To ensure this year’s ranking included the effects of the sub ‐prime crisis, we have used IBES (Institutional Brokers Estimate System) consensus forecast data to estimate 2007 results, and our ranking compares brand value with market capitalisation as at 31/12/07.
The Northern Rock Crisis
The biggest event in the British market associated to the credit crunch has been the Northern Rock crisis. Northern Rock faced significant problems raising funds in the money market and applied to the Bank of England for emergency funds in 2007. Many customers aware of this situation withdrew money from their accounts. By January 2008 the loan from the Bank of England amounted to £26 billion. Throughout this period various takeover offers have been discussed and public and private ownership options are currently being considered, which will require a significant financing to pay
down outstanding taxpayer money. The government is pushing for a private sector solution.
Banking and Investment in Emerging Markets
Emerging markets have played a strategic role in business growth for many financial institutions, in spite of the volatility usually inherent in these markets. Short ‐term fluctuations have been seen in these markets as a result of the credit crunch in the U.S., however, long ‐term prospects for these economies remain strong. Most recently some institutions, such as HSBC, have benefited from their high ‐growth market
businesses by being able to offset their losses with strong revenue results from these areas.
Investing in emerging market banks allows for diversification in the ongoing financial crisis. Furthermore, there’s significant growth potential in markets such as China and India where retail banking penetration is very low.
According to the World Bank “resilient emerging markets are cushioning the global economy amid the US slowdown”.

8/9/2019 Global 500 Financial Brands 2008
http://slidepdf.com/reader/full/global-500-financial-brands-2008 8/45
--------------------------------------------------------------------------------------------------------------------
2007 - Brand Finance Banking 500 © Brand Finance plc 2008 8
2. The Brand Finance Banking 500 (1-100)
Rank 2007
Rank 2005
CompaniesCountry
of Domicile
Brand Value (US$M)
2007
Market Cap (US$M)
31/12/07
Brand Value / Market
Cap(%) 2007
Brand Rating (based on BrandBeta
analysis) 2007
Brand Value (US$M)
2005
Market Cap (US$M)
31/12/05
Market Cap (US$M)
31/12/06
Brand Rating (based on BrandBeta
analysis) 20051 2 HSBC UK 35,456 188,466 19% AAA ‐ 181,703 210,831 AAA
2 1 CITI US 27,817 147,041 19% AA ‐ 245,512 273,598 AAA ‐
3 3 BANK OF AMERICA US 25,417 170,875 15% AA+ ‐ 185,342 238,021 AAA ‐
4 5 SANTANDER ES 20,718 67,214 31% AA ‐ ‐ 47,156 80,401 AA ‐
5 4 AMERICAN EXPRESS US 16,183 51,455 31% AAA ‐ 63,897 72,743 AAA ‐
6 8 BNP PARIBAS FR 14,637 97,501 15% A+ ‐ 67,796 95,780 A
7 10 CHASE US 13,674 76,973 18% A+ ‐ 79,336 100,197 AA ‐
8 7 WELLS FARGO & CO US 13,130 94,593 14% AA ‐ 105,067 120,078 AA
9 16 GOLDMAN SACHS US 12,520 84,564 15% AA ‐ 59,263 87,425 A+
10 11 CREDIT SUISSE CH 12,140 66,377 18% A ‐ ‐ 61,851 74,245 A ‐
11 9 BARCLAYS UK 11,582 60,197 19% A ‐ ‐ 67,955 93,355 A
12 6 UBS CH 11,339 92,476 12% A+ ‐ 103,522 117,805 AA ‐
13 13 WACHOVIA CORP US 8,686 72,120 12% AA ‐ ‐ 82,116 108,433 AA ‐
14 17 DEUTSCHE BANK DE 8,585 66,220 13% A ‐ 53,605 70,402 A ‐
15 n/a ICBC CN 8,427 343,424 2% A ‐ ‐ 336,300 265,329 ‐
16 19 BBVA ES 8,411 85,145 10% AA ‐ ‐ 60,507 85,249 A+
17 n/a CHINA CONSTRUCTION BANK CN 7,786 198,124 4% A ‐ ‐ 78,242 142,974 ‐
18 n/a INTESA SANPAOLO IT 7,779 99,411 8% A+ ‐ 36,621 98,617 ‐
19 24 NATWEST UK 7,259 45,910 16% A ‐ 48,634 67,111 A
20 18 SOCIETE GENERALE FR 7,197 67,099 11% BBB ‐ 53,300 74,372 A ‐
21 15 MORGAN STANLEY US 7,129 48,095 15% A ‐ 60,012 79,882 A
22 n/a BANK OF CHINA CN 6,741 204,152 3% A ‐ ‐ 147,880 165,437 ‐
23 20 JP MORGAN US 6,461 47,576 14% A+ ‐ 49,037 61,931 A
24 32 STANDARD CHARTERED UK 6,270 49,035 13% AA ‐ 29,295 40,409 AA ‐
25 26 ING NL 6,137 85,281 7% AA ‐ ‐ 75,104 97,690 A+
26 28 ROYAL BANK OF SCOTLAND UK 6,117 39,429 16% A ‐ 48,533 57,637 A
27 27 NATIONAL AUSTALIA BANK AU 6,102 56,065 11% A ‐ ‐ 37,959 43,363 BBB
28 23 CREDIT AGRICOLE FR 5,927 55,575 11% A ‐ ‐ 47,147 62,281 A ‐
29 21 LLOYDS TSB UK 5,844 36,625 16% A+ ‐ 46,029 55,432 A+
30 14 MERRILL LYNCH US 5,702 46,816 12% A ‐ 62,241 80,808 A+
31 31 ROYAL BANK OF CANADA CA 5,235 75,138 7% A+ ‐ 50,561 56,611 A+
32 n/a BANK OF NEW YORK MELLON US 4,757 55,878 9% AA+ ‐ 24,560 29,758 ‐
33 12 ABN AMRO NL 4,734 103,107 5% AA ‐ ‐ 49,919 59,535 AA ‐
34 36 UNICREDIT IT 4,627 112,425 4% BBB ‐ 71,520 90,651 BBB
35 40 FORTIS BE 4,400 56,242 8% A ‐ ‐ 50,641 55,079 A ‐
36 n/a MBNA CORP US 4,367 38,420 11% A ‐ ‐ N/A N/A ‐
37 37 COMMONWEALTH BANK OF AUSTRALIA AU 4,349 60,730 7% A+ ‐ 40,412 41,924 A
38 25 CAPITAL ONE US 4,321 16,415 26% A+ ‐ 25,877 31,490 AA+
39 33 US BANCORP US 4,271 54,847 8% A+ ‐ 54,290 63,865 A
40 29 HALIFAX UK 4,234 29,121 15% A+ ‐ 36,471 43,821 A+
41 22 MIZUHO FINANCIAL JP 4,151 74,923 6% A ‐ 95,242 95,136 AA
42 50 BRADESCO BR 4,106 58,874 7% AA ‐ ‐ 28,004 39,736 AA
43 47 TORONTO ‐DOMINION BANK CA 4,041 53,908 7% A+ ‐ 37,485 41,626 A
44 30 LEHMAN BROS US 4,015 30,822 13% A ‐ ‐ 34,785 39,293 A+
45 52 BANCO DO BRASIL BR 4,008 42,671 9% AA ‐ ‐ 14,722 24,732 A+
46 48 CANADIAN IMPERIAL BANK OF COMMERCE CA 3,756 35,962 10% A ‐ ‐ 21,956 26,233 A ‐
47 46 NORDEA SE 3,605 40,989 9% BBB ‐ 28,086 39,988 BBB
48 38 COMMERZBANK DE 3,560 24,679 14% A+ ‐ 20,223 24,919 A
49 43 ANZ AU 3,559 49,056 7% A+ ‐ 32,172 36,823 A ‐
50 57 SCOTIABANK CA 3,552 55,378 6% A ‐ 39,304 43,481 A ‐
For groups with multiple brands market cap has been allocated to each brand pro ‐rata based on revenues.

8/9/2019 Global 500 Financial Brands 2008
http://slidepdf.com/reader/full/global-500-financial-brands-2008 9/45
--------------------------------------------------------------------------------------------------------------------
2007 - Brand Finance Banking 500 © Brand Finance plc 2008 9
Rank 2007
Rank 2005
CompaniesCountry
of Domicile
Brand Value (US$M)
2007
Market Cap (US$M)
31/12/07
Brand Value / Market
Cap(%) 2007
Brand Rating (based on BrandBeta
analysis) 2007
Brand Value (US$M)
2005
Market Cap (US$M)
31/12/05
Market Cap (US$M)
31/12/06
Brand Rating (based on BrandBeta
analysis) 200551 34 B ANK OF TOKYO‐MITSUBISHI UFJ JP 3,540 115,457 3% A ‐ ‐ 135,769 149,224 A
52 35 SUMITOMO MITSUI JP 3,529 68,840 5% BBB ‐ 77,387 82,071 A ‐
53 54 BANCO ITAU BR 3,500 59,565 6% AA ‐ ‐ 25,156 40,573 AA ‐
54 41 HYPOVEREINSBANK DE 3,465 51,815 7% A ‐ ‐ 22,749 32,792 BBB
55 59 SBERBANK RU 3,418 88,938 4% A ‐ ‐ 25,978 65,550 BBB
56 45 WESTPAC AU 3,229 47,085 7% A ‐ 30,559 31,110 A
57 n/a FANNIE MAE US 3,159 35,938 9% A ‐ ‐ 47,372 57,734 ‐
58 39 B ANK OF SCOTLAND UK 3,024 22,895 13% A ‐ 29,175 35,455 A ‐
59 61 S TATE BANK OF INDIA IN 2,852 12,021 24% AA ‐ 10,601 11,418 AA ‐
60 53 B ANK OF IRELAND IE 2,765 20,630 13% A ‐ 14,853 17,663 AA ‐
61 n/a ORIX JP 2,699 23,820 11% A+ ‐ 11,144 28,038 ‐
62 n/a BANK OF COMMUNICATIONS CN 2,664 88,007 3% BBB ‐ 20,824 55,584 ‐
63 66 ICICI IN 2,603 17,649 15% AA+ ‐ 11,148 11,750 AA
64 n/a MASTERCARD US 2,600 23,005 11% A+ ‐ N/A 13,293 ‐
65 65 B ANK OF MONTREAL CA 2,555 33,061 8% A ‐ ‐ 27,972 30,996 A
66 n/a OTPBANK HU 2,496 13,543 18% A ‐ ‐ 8,545 12,047 ‐
67 71 B ANK AUSTRIA CREDITANSTALT AT 2,478 41,917 6% A+ ‐ 16,367 23,233 A ‐
68 55 ALLIED IRISH BANK IE 2,473 19,549 13% A ‐ ‐ 18,675 27,242 A ‐
69 n/a SAMPO FI 2,437 16,289 15% A+ ‐ 9,951 15,053 ‐
70 n/a ERSTE BANK AT 2,371 20,224 12% A ‐ ‐ 13,539 24,161 ‐
71 n/a F IRST NATIONAL BANK ZA 2,358 16,556 14% A ‐ ‐ 10,776 16,210 ‐
72 n/a NATIXIS FR 2,312 23,386 10% A+ ‐ 7,882 34,237 ‐
73 44 STANDARD BANK OF SOUTH AFRICA ZA 2,239 19,279 12% A ‐ ‐ 16,177 18,427 A ‐
74 63 KBC BE 2,224 49,239 5% B ‐ 34,115 42,565 B
75 n/a STATE STREET US 2,186 31,366 7% A+ ‐ 18,496 22,420 ‐
76 70 ST GEORGE BANK AU 2,142 16,685 13% AA ‐ ‐ 11,344 11,879 AA ‐
77 72 MACQUARIE AU 2,103 17,031 12% AA ‐ ‐ 11,582 10,770 AA ‐78 n/a CITI SMITHBARNEY US 2,068 15,609 13% A ‐ 19,974 24,339 ‐
79 60 CITIZENS UK 2 ,007 17,439 12% A ‐ ‐ 18,833 25,988 A
80 n/a ABSA ZA 1,996 10,449 19% A ‐ ‐ 7,915 12,030 ‐
81 58 SUNTRUST BANKS US 1,989 21,606 9% BBB ‐ 26,296 29,972 BB
82 42 FREDDIE MAC US 1,975 19,033 10% A ‐ 45,131 44,899 A ‐
83 75 DEXIA BE 1,937 32,206 6% BB ‐ 25,286 31,820 BB
84 n/a NATIONAL BANK OF GREECE GR 1,916 31,732 6% BBB ‐ 14,339 21,863 ‐
85 n/a PNC BANK US 1,904 14,536 13% A ‐ 18,116 22,188 ‐
86 82 DEUTSCHE POSTBANK DE 1,893 15,605 12% BB ‐ 9,509 13,748 A ‐
87 62 KOOKMIN BANK KR 1,881 21,923 9% BB ‐ 25,495 27,091 BBB
88 80 CAPITALIA IT 1,871 19,207 10% BBB ‐ 12,872 24,544 BB
89 n/a DISCOVER US 1,864 6,032 31% BBB ‐ N/A N/A ‐
90 68 SHINHAN BANK KR 1,800 19,461 9% A ‐ 14,609 19,489 A ‐
91 n/a CHINA MERCHANTS BANK CN 1,794 82,082 2% A ‐ ‐ 8,458 30,818 ‐
92 67 ABBEY ES 1,792 10,476 17% A+ ‐ 8,574 14,618 A+
93 n/a SWEDBANK SE 1,783 13,827 13% A ‐ 14,036 18,714 ‐
94 n/a NATIONAL CITY US 1,719 9,647 18% A ‐ ‐ 20,647 23,120 ‐
95 n/a CIC FR 1,671 12,485 13% A+ ‐ 6,499 13,230 ‐
96 73 CHARLES SCHWAB US 1,663 26,089 6% A+ ‐ 18,916 24,469 A+
97 n/a MUFG JP 1 ,613 13,526 12% A+ ‐ 27,137 19,772 ‐
98 n/a F UBON FINANCIAL TW 1,611 7,180 22% BBB ‐ N/A N/A ‐
99 n/a SUNCORP METWAY AU 1,575 15,859 10% A ‐ ‐ 8,363 7,996 ‐
100 77 DBS SG 1,564 21,031 7% A ‐ ‐ 14,864 22,254 A ‐
For groups with multiple brands market cap has been allocated to each brand pro ‐rata based on revenues.

8/9/2019 Global 500 Financial Brands 2008
http://slidepdf.com/reader/full/global-500-financial-brands-2008 10/45
--------------------------------------------------------------------------------------------------------------------
2007 - Brand Finance Banking 500 © Brand Finance plc 2008 10
3. Commentary on the top 20 banking brands
1. HSBC 2005 ranking: 2 Brand Value: $35,456m Brand Rating: AAA Country: Great Britain 2005: $33,495m 2005: AAAThe most valuable banking brand in the world also achieves the highest Brand Rating of AAA.
HSBC portrays itself as a large, powerful global bank, and has opted for a uniform brand identity. Brand building has been supported by high profile advertising to ensure global awareness and appeal. The bank projects a universal image with the help of the tagline “The world’s local bank.”
The bank’s strategic plan has led to its position as the world’s largest and most profitable emerging markets bank, driving revenue growth while investing in organic expansion. Key to these results has been HSBC’s focus on seeking out growth markets.
HSBC has been among the banks hit by the sub ‐prime crisis in 2007, with reported losses of approximately $3.4 billion. The bank also announced the closure of its mortgage ‐backed securities trading department in the U.S. as an effort to cut costs due to the crisis.
2. Citi (Citigroup) 2005 ranking: 1 Brand Value: $27,817m Brand Rating: AA Country: USA2005: $35,148m 2005: AAA-
The drop in the Citi brand rating, from AAA‐ in 2005 to AA this year, has led to its slip to second place in our league table. This is largely due to the dent in its reputation resulting from the sub ‐prime crisis.
Citigroup was the first financial services company in the U.S. to bring together banking, insurance and investments under one umbrella. Over the years the bank has been challenged to grow the consumer brand through revitalisation of the Citibank brand and appeal to new segments beyond banking. In February of 2007 Citigroup announced a corporate branding change to unite its businesses under the “Citi” name and its red arc
design to serve its clients as “one company”. Concurrently, the company also announced the sale of its trademark red umbrella to The St. Paul Travelers Companies, Inc., as research showed its close association with insurance.
Citigroup has been hit hardest by the financial crisis. Write downs in the value of its investment portfolio amounted to $18.1 billion in the fourth quarter, and the bank is expected to raise as much as $12.5 billion in new capital from Chinese and public market investors, with approximately $3 billion from the Kuwait Investment Authority and $6.88 billion from Singapore’s investment arm (Government of Singapore Investment Corporation). This is in addition to the $7.5 billion already injected by the Abu Dhabi Investment Authority in November, representing a stake of 4.9% in the group.

8/9/2019 Global 500 Financial Brands 2008
http://slidepdf.com/reader/full/global-500-financial-brands-2008 11/45
--------------------------------------------------------------------------------------------------------------------
2007 - Brand Finance Banking 500 © Brand Finance plc 2008 11
3. Bank of America 2005 ranking: 3 Brand Value: $25,456m Brand Rating: AA+ Country: USA 2005: $31,426m 2005: AAA-
Bank of America (BofA) is one of the largest U.S. banks by market
capitalisation. In 2007 the bank announced its new campaign “Bank of Opportunity” seeking to articulate a value proposition of “helping individuals, businesses and communities around the world realize opportunities to achieve their goals”.
In 2006 the bank acquired MBNA Corporation for $34 billion, creating one of the largest credit card issuers in the American market. In 2007 BofA acquired LaSalle Bank for $21 billion, representing a unique opportunity to capture leadership positions in key regions within the U.S. market. LaSalle will be rebranded Bank of America throughout 2008.
BofA has just announced the purchase of Countrywide Financial for $4 billion, making it the largest mortgage lender and loan servicer in America. We have not included Countrywide as part of the BofA brand valuation, since the brand strategy for this acquisition has not yet been announced.
To date the bank has incurred a $3 billion write ‐down due to the sub ‐prime crisis.
4. Santander 2005 ranking: 5
Brand Value: $20,718m Brand Rating: AA- Country: Spain2005: $17,063m 2005: AA-
In 2007 Santander acquired ABN AMRO in a consortium with Fortis and Royal Bank of Scotland, specifically its operations in Latin America and Italy.
Santander is already ranked sixth in the Brazilian market (in terms of deposits and loans), and after the integration of ABN it will become the third largest bank in that country by assets.
The bank sold ABN’s Italian operations (Banca Antonveneta) in November 2007, one month after acquiring it from ABN AMRO, to Banca Monte dei Paschi di Siena in a transaction valued at €9 billion, except for its corporate banking unit Interbanca.
The bank’s expansion strategy, which includes setting up alliances, acquiring local banks, and converging these into the Santander brand through a gradual migration process, with periods of dual branding, has shown to contribute to the high value of the brand.

8/9/2019 Global 500 Financial Brands 2008
http://slidepdf.com/reader/full/global-500-financial-brands-2008 12/45
--------------------------------------------------------------------------------------------------------------------
2007 - Brand Finance Banking 500 © Brand Finance plc 2008 12
5. American Express 2005 ranking: 4 Brand Value: $16,183m Brand Rating: AAA Country: USA2005: $18,109m 2005: AAA-
The American Express (AmEx) brand value of $16,183 million represents 31% of the company’s market capitalisation, the highest brand value to market capitalisation ratio of the top 20 brands.
AmEx’s “Spend ‐Centric” Business Model focuses primarily on generating revenues by driving spending on Cards, and secondarily by finance charges and fees. Coupled with its strong distribution and international brand appeal, this model continues to drive business leadership among publicly listed credit card companies.
In September 2007 the company announced the sale of its international banking subsidiary (American Express Bank Ltd.) and investment certificates subsidiary (American Express International Deposit Company) to Standard Chartered PLC, valued at approximately $1.1 billion.
The effect of the sub ‐prime crisis has yet to spill over into the credit card market, although it is generally accepted that this is a likely next stage. However, due to effective marketing of AmEx as a premium brand, its customers are largely drawn from a high‐income demographic, which might limit the company’s exposure.
6. BNP Paribas 2005 ranking: 8 Brand Value: $14,637m Brand Rating: A+ Country: France2005: $12,278m 2005: A
BNP Paribas has one of the largest international banking networks, including strong positions in Asia and a considerable presence in the United States. It is the largest French bank by market capitalisation.
The creation of the BNP Paribas group in 1999 resulted from Banque Nationale de Paris (BNPs) takeover of Paribas.
In August 2007 the bank froze three funds exposed to the U.S. sub ‐
prime mortgage market, claiming issues in the U.S. sub ‐prime sector prevented the bank from calculating the funds’ values. This led to an immediate fall in the bank’s shares.
Latest financial results for BNP Paribas indicate limited effect of the sub ‐prime crisis due to its growth success and internationalisation strategy, as claimed by the group.

8/9/2019 Global 500 Financial Brands 2008
http://slidepdf.com/reader/full/global-500-financial-brands-2008 13/45
--------------------------------------------------------------------------------------------------------------------
2007 - Brand Finance Banking 500 © Brand Finance plc 2008 13
7. Chase 2005 ranking: 10 Brand Value: $13,674m Brand Rating: A+ Country: USA2005: $12,083m 2005: AA-
The Chase brand has moved from 10th position in last year’s
league table up to 7th.
Chase is part of JPMorgan Chase & Co., a leading global financial services firm, formed by the merger in 2000 of JPMorgan & Co. and Chase Manhattan Corporation, bringing together four of the largest and oldest banking institutions in New York City.
Chase is used as the brand for credit card services in the United States and Canada and the bank's retail banking activities in the United States. In 2004 the bank merged with Bank One, making it one of the largest credit card issuers in the U.S., with the fourth largest network of agencies in commercial and retail banking in America.
Chase’s parent company JPMorgan Chase has suffered less from the sub ‐prime crisis than most banking groups in the top 20, due to limited exposure to the American sub ‐prime mortgage market (as compared to its peers).
The bank’s strong financial position has led to speculation of potential U.S. acquisitions to grow its consumer business. Possible candidates include Washington Mutual and SunTrust.
8. Wells Fargo 2005 ranking: 7
Brand Value: $13,130m Brand Rating: AA Country: USA2005: $14,277m 2005: AA
In spite of a fall in brand value from $14,277 million last year, Wells Fargo has remained true to its steadfast, conservative brand image and maintains a significant position in the top 20.
Wells Fargo is the fourth largest diversified financial services in the U.S. by market value, and the fifth in assets. The Wells Fargo brand capitalizes on the company’s 150 ‐year history; In the early 1900s Wells Fargo owned and operated the largest stagecoach company in the world, and the legendary stagecoach image has associated
the
bank
with
its
heritage
and
values.
The
bank
uses
the
stagecoach as its “living logo” on parades and events across the United States.
The bank’s financial results for the fourth quarter 2007 indicate a net income of $1.36 billion, its lowest quarterly profit in six years, or 38% less than the $2.18 billion earned in 2006. The bank has set aside $2.6 billion as provision for future loan losses.

8/9/2019 Global 500 Financial Brands 2008
http://slidepdf.com/reader/full/global-500-financial-brands-2008 14/45
--------------------------------------------------------------------------------------------------------------------
2007 - Brand Finance Banking 500 © Brand Finance plc 2008 14
9. Goldman Sachs 2005 ranking: 16 Brand Value: $12,520m Brand Rating: AA Country: USA2005: $8,712m 2005: A+
The Goldman Sachs brand is the most valuable of the non ‐retail focused banks, with a value of $12,520 million and receiving an AA brand rating.
Goldman Sachs was founded over 130 years ago, and has grown to become the leading global investment banking, securities and investment management firm. The bank’s performance has been very strong in the past years, with significant increases in net revenues and earnings.
Its 2007 brand value represents an increase of $3,808 million or 44% from 2005, allowing the Goldman Sachs brand to climb seven places in this year’s league table.
The bank has been among the few financial institutions that showed significant gains in 2007 by shorting the sub ‐prime market. The company reported record results in the Americas, Europe and Asia in 2007.
10. Credit Suisse 2005 ranking: 11 Brand Value: $12,140m Brand Rating: A- Country: Switzerland2005: $11,519m 2005: A-
Credit Suisse’s origins date back to 1856. In 2000, the bank acquired Donaldson, Lufkin & Jenrette (DLJ), an investment bank headquarted in New York City.
In 2004 the bank’s organisational structure was focussed into three business units: 1) Credit Suisse, 2) Credit Suisse First Boston and 3) Winterthur.
In 2006 Credit Suisse divested its insurance business (Winterthur)
to AXA, and renamed the bank as Credit Suisse, dropping both the First Boston and CSFB names.
Credit Suisse combines over 150 years of Swiss banking heritage and innovation in investment banking, private banking and asset management. The bank’s strategy is to expand through organic growth, select acquisitions, joint ventures and alliances.
The bank reported net profits of $1.12 billion for the third quarter of 2007, 11% lower than its 2006 result, however a significantly better achievement than that of its Swiss rival UBS.

8/9/2019 Global 500 Financial Brands 2008
http://slidepdf.com/reader/full/global-500-financial-brands-2008 15/45
--------------------------------------------------------------------------------------------------------------------
2007 - Brand Finance Banking 500 © Brand Finance plc 2008 15
11. Barclays 2005 ranking: 9 Brand Value: $11,582m Brand Rating: A- Country: Great Britain2005: $12,182 2005: A
Barclays’ brand rating had a slight drop from A to A‐ this year, but easily remains among the top 20.
Barclay’s traces its roots back to the 17 th century and is now one of the largest financial services groups in the United Kingdom. Approximately fifty percent of its profit comes from outside the UK. The decision made in 2006 to re ‐brand Woolwich branches as Barclays has contributed to the increase the financial value of the Barclay’s brand.
The sub ‐prime crisis has led the bank to write ‐down $2.6 billion in the third quarter of 2007, due to its investment banking exposure to the credit market problems. Whilst a significant amount, it
remains relatively small in comparison to many of the American banks.
12. UBS 2005 ranking: 6
Brand Value: $11,339m Brand Rating: A+ Country: Switzerland2005: $15,137m 2005: AA-
In 2004 the bank’s decision to consolidate its portfolio into a consistent brand across all markets resulted in the “You and Us” campaign, one that addresses a close relationship between customers and professionals, representing an integrated branded business model.
In 2007 the bank announced the acquisition of Caisse Centrale de Réescompte (CCR) Group – an asset and wealth manager in France – from Commerzbank, for approximately €435 million.
Most recently UBS has been affected by the sub ‐prime crisis, with approximately $14 billion in write ‐downs. It is the biggest victim of the U.S. sub ‐prime crisis to date among major European banks. The bank has raised $9.75 billion from the Government of Singapore Investment Corporation (Singapore’s investment arm), representing a 9% stake, and also $1.77 billion (1.5% stake) from an undisclosed strategic investor in the Middle East.

8/9/2019 Global 500 Financial Brands 2008
http://slidepdf.com/reader/full/global-500-financial-brands-2008 16/45
--------------------------------------------------------------------------------------------------------------------
2007 - Brand Finance Banking 500 © Brand Finance plc 2008 16
13. JPMorgan 2005 ranking: 20 Brand Value: $9,064m Brand Rating: A+ Country: USA2005: $6,383m 2005: A
JPMorgan is the other major brand within the JPMorgan Chase group, its brand value being 66% of Chase’s brand value.
The JPMorgan brand offers services in investment banking, asset management, worldwide securities services and private banking.
The JPMorgan Chase group’s performance in 2007 was strong. The bank avoided the worst of the sub ‐prime problems by offsetting falls in investment banking, against gains in other divisions. Net revenue in investment banking fell from $18.8 billion in 2006 to $18.2 billion in 2007 and net income fell from $3.7 billion to $3.1 billion in the same period.
14. Wachovia Corporation 2005 ranking: 13 Brand Value: $8,686m Brand Rating: AA- Country: USA 2005: $9,430m 2005: AA-
Wachovia Corporation is one of the largest banks in the U.S., and was formed by the merger between Wachovia and First Union in 2001. It was ranked as the 46th company in the 2007 Fortune 500 ranking of America’s largest corporations.
The strength and heritage of the Wachovia brand led to a new corporate brand launched in 2002, currently valued at $8,686 million.
In 2006 Wachovia acquired Golden West Financial for $25.5 billion, adding a 285 ‐branch network to its base and significantly increasing its presence in the state of California.
In 2007 the bank acquired A.G. Edwards for $6.8 billion, becoming the second largest retail brokerage in the U.S. market.

8/9/2019 Global 500 Financial Brands 2008
http://slidepdf.com/reader/full/global-500-financial-brands-2008 17/45
--------------------------------------------------------------------------------------------------------------------
2007 - Brand Finance Banking 500 © Brand Finance plc 2008 17
15. Deutsche Bank 2005 ranking: 17 Brand Value: $8,585m Brand Rating: A Country: Germany2005: $8,240 2005: A-
The Deutsche Bank brand has climbed three places in this year’s
league table. Improvement of the bank’s brand rating has allowed the brand to consolidate its position in the top 20.
Deutsche Bank is a leading global investment bank. Its brand connects businesses, regions and markets, effectively delivering one bank. Since 1974 the bank has used the company name Deustche Bank and the square ‐shaped logo as its worldwide brand.
The bank has a consolidated position in the European market, and strong bases in all major emerging markets, therefore providing good growth prospects in fast ‐growing economies around the world.
In October 2007 Deutsche Bank announced the need to write ‐down $3.2 billion due to markdowns in the value of investments, and it recently announced the decision to cut costs after the value of investments associated with the U.S. housing market declined.
16. Industrial & Commercial Bank of China 2005 ranking: n/a Brand Value: $8,427m Brand Rating: A- Country: China2005: n/a 2005: n/a
Founded in 1984, ICBC is one of China's “Big Four” state ‐owned commercial banks. In 2005 ICBC purchased the Hong Kong subsidiary of Fortis Bank and rebranded it as ICBC Asia, and then in October 2007 it acquired 20% of Standard Bank of South Africa for $5.5 billion, representing the biggest foreign acquisition by a Chinese commercial bank. Earlier that year ICBC overtook Citigroup as the world’s most valuable bank, with a market capitalisation of $254 billion.
ICBC – Industrial and Commercial Bank of China – began trading simultaneously on the Hong Kong and Shanghai stock exchanges in October 2006, and as a result is the new entrant with the highest brand value in this league table.
The brand value represents only 2% of ICBC’s market capitalisation, the smallest ratio observed in the top 20. As the Chinese banking market invests in building global brands, we expect brand value to grow accordingly.

8/9/2019 Global 500 Financial Brands 2008
http://slidepdf.com/reader/full/global-500-financial-brands-2008 18/45
--------------------------------------------------------------------------------------------------------------------
2007 - Brand Finance Banking 500 © Brand Finance plc 2008 18
17. BBVA 2005 ranking: 19 Brand Value: $8,411m Brand Rating: AA- Country: Spain2005: $7,553m 2005: A+
BBV and Argentaria merged in 1999 to form BBVA Group, a global banking group with origins in Spain. In 2000 a single brand “BBVA” was launched to generate a strong image and unique identity for the group. The bank is a key player in the Spanish market and has a leading role in Latin America.
In 2004 the bank acquired Valley Bank in California to develop basic banking services and remittances, in an effort to support its growth in the American market, more specifically in the state of Texas. BBVA acquired Laredo National Bancshares in 2005, and Texas Regional Bancshares and State National Bancshares in 2006 for €2.1 billion, becoming the top regional banking group in that state.
In 2007 the bank acquired Compass Bancshares for $9.6 billion, a further support to its growth strategy in the U.S. This was the largest acquisition announced in the history of the bank.
18. China Construction Bank 2005 ranking: n/a Brand Value: $7,786m Brand Rating: A- Country: China2005: n/a 2005: n/a
China Construction Bank (CCB) is the second newly listed bank to make it into the top 20 most valuable banking brands.
In late 2005 CCB made an initial public offering on the Hong Kong Stock Exchange. Then in 2007, it made China's second ‐largest initial public offering of $7.6 billion on the Shanghai Stock Exchange. Its brand value of $7,786 million means that this year two Chinese banks have entered into the list of top brands.
As with ICBC, CCB’s brand value represents only a fraction of its market capitalisation (4%). We expect this value to increase in the medium term as Chinese banks devote more time and resources to build their global brands.

8/9/2019 Global 500 Financial Brands 2008
http://slidepdf.com/reader/full/global-500-financial-brands-2008 19/45
--------------------------------------------------------------------------------------------------------------------
2007 - Brand Finance Banking 500 © Brand Finance plc 2008 19
19. Intesa Sanpaolo 2005 ranking: n/a Brand Value: $7,779m Brand Rating: A+ Country: Italy2005: n/a 2005: n/a
Intesa Sanpaolo is the result of the merger between Banca Intesa and Sanpaolo IMI effective January 2007, making it the largest retail bank in Italy at the time of merger, with $700 billion in assets. Its international presence is focussed on Central ‐Eastern Europe and the Mediterranean basin.
Its international subsidiary banks reported positive results in the first three quarters of 2007, with further growth expected in sectors such as credit cards, leasing and consumer lending.
The group has also announced a re ‐branding programme for its international division, where names of subsidiaries will remain unchanged, however brands will be restyled with the colours, lettering and logo of the group, leading to a new visual identity. The aim is to ensure subsidiaries are immediately recognised as being part of the same group.
Intesa Sanpaolo has also made its entrance into the Chinese market in 2007 by acquiring a 19.99% stake in Qingdao City Commercial Bank, by purchasing 19.9% interest in the capital of Union Life and by signing an agreement for the acquisition of a 49% stake in Penghua Fund Management, one of the leading asset management companies in that market.
20. NatWest 2005 ranking: 24 Brand Value: $7,259m Brand Rating: A Country: Great Britain2005: $5,705m 2005: A
National Westminster Bank (NatWest), a commercial bank operating in Great Britain, was established in 1968 from the merger of National Provincial Bank and Westminster Bank. In 2000 the bank was acquired by the Royal Bank of Scotland in the biggest takeover in British history.
According to the “Forbes 2000 Global” report published in 2007, The Royal Bank of Scotland is the second largest bank in Great Britain, the fifth largest in the world, and the 13th largest company in the world.
Since the bank operates a multi ‐channel distribution model, it employs marketing techniques that are appropriate to each channel. As an example the NatWest brand that operates in the retail banking sector is a mainstream lender that does a lot of mortgage business with its banking customers and also attracts many customers on the back of its well‐known brand.
8/9/2019 Global 500 Financial Brands 2008
http://slidepdf.com/reader/full/global-500-financial-brands-2008 20/45
--------------------------------------------------------------------------------------------------------------------
2007 - Brand Finance Banking 500 © Brand Finance plc 2008 20
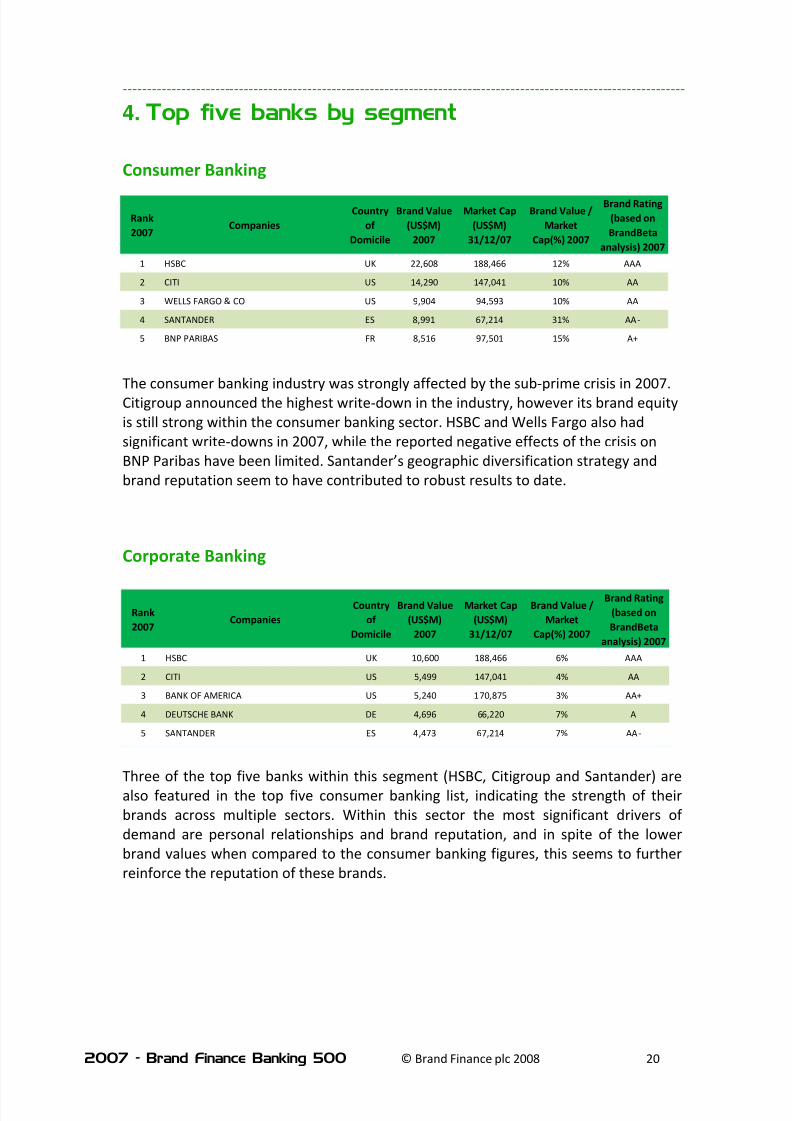
4. Top five banks by segment
Consumer Banking
The consumer banking industry was strongly affected by the sub ‐prime crisis in 2007. Citigroup announced the highest write ‐down in the industry, however its brand equity is still strong within the consumer banking sector. HSBC and Wells Fargo also had significant write ‐downs in 2007, while the reported negative effects of the crisis on BNP Paribas have been limited. Santander’s geographic diversification strategy and brand reputation seem to have contributed to robust results to date.
Corporate Banking
Three of the top five banks within this segment (HSBC, Citigroup and Santander) are also featured in the top five consumer banking list, indicating the strength of their brands across multiple sectors. Within this sector the most significant drivers of demand are personal relationships and brand reputation, and in spite of the lower brand values when compared to the consumer banking figures, this seems to further reinforce the reputation of these brands.
Rank 2007
CompaniesCountry
of Domicile
Brand Value (US$M)
2007
Market Cap (US$M)
31/12/07
Brand Value / Market
Cap(%) 2007
Brand Rating (based on BrandBeta
analysis) 20071 HSBC UK 22,608 188,466 12% AAA
2 CITI US 14,290 147,041 10% AA
3 WELLS FARGO & CO US 9,904 94,593 10% AA
4 SANTANDER ES 8,991 67,214 31% AA ‐
5 BNP PARIBAS FR 8,516 97,501 15% A+
Rank 2007
CompaniesCountry
of Domicile
Brand Value (US$M)
2007
Market Cap (US$M)
31/12/07
Brand Value / Market
Cap(%) 2007
Brand Rating (based on BrandBeta
analysis) 20071 HSBC UK 10,600 188,466 6% AAA
2 CITI US 5,499 147,041 4% AA
3 BANK OF AMERICA US 5,240 170,875 3% AA+
4 DEUTSCHE BANK DE 4,696 66,220 7% A
5 SANTANDER ES 4,473 67,214 7% AA ‐

8/9/2019 Global 500 Financial Brands 2008
http://slidepdf.com/reader/full/global-500-financial-brands-2008 21/45
--------------------------------------------------------------------------------------------------------------------
2007 - Brand Finance Banking 500 © Brand Finance plc 2008 21
Investment Banking
The investment banking industry was also hit hard by the financial crisis in 2007. UBS had the biggest write ‐down of the top five banks in this list, followed by Morgan Stanley. Goldman Sachs, the most valuable investment ‐banking brand in contrast, posted a $4 billion profit from betting on the crash of the U.S. sub ‐prime market, and its high brand value is associated to increasing revenues and enhanced reputation as a result of its performance during the financial crisis.
Credit Cards
The credit card industry led by American Express with the highest brand value is also likely to suffer from the sub ‐prime crisis as a next stage. Higher consumer credit costs coupled with increased balances on consumer’s credit cards could lead to credit card
delinquencies.
Various
credit
card
companies
have
already
increased
their
loss
reserves for the near and medium term. It is expected that delinquencies will rise as consumers who have until recently used home equity lines of credit to pay off their debts, will start carrying higher card debts instead.
Note: Visa (Visa Inc.) is not included in this list because it is a private company. In November 2007 the company announced the filing of a registration statement with the U.S. Securities and Exchange Commission (SEC) relating to a proposed initial public offering of its class A common stock, and is expected to go public sometime in 2008. Therefore we expect Visa to be included in next year’s league table.
Rank 2007
CompaniesCountry
of Domicile
Brand Value (US$M)
2007
Market Cap (US$M)
31/12/07
Brand Value / Market
Cap(%) 2007
Brand Rating (based on BrandBeta
analysis) 2007
1 GOLDMAN SACHS US 11,790 84,564 14% AA
2 JP MORGAN US 7,988 65,244 12% A+
3 MORGAN STANLEY US 6,504 48,095 14% A
4 CREDIT SUISSE CH 4,714 66,377 7% A ‐
5 UBS CH 4,491 92,476 5% A+
Rank 2007
CompaniesCountry
of Domicile
Brand Value (US$M)
2007
Market Cap (US$M)
31/12/07
Brand Value / Market
Cap(%) 2007
Brand Rating (based on BrandBeta
analysis) 2007
1 AMERICAN EXPRESS US 13,986 51,455 27% AAA2 CITI US 6,161 147,041 4% AA
3 CHASE US 5,291 86,865 6% A+
4 MBNA CORP US 4,991 38,420 13% A ‐
5 CAPITAL ONE US 3,290 16,415 20% A+

8/9/2019 Global 500 Financial Brands 2008
http://slidepdf.com/reader/full/global-500-financial-brands-2008 22/45
--------------------------------------------------------------------------------------------------------------------
2007 - Brand Finance Banking 500 © Brand Finance plc 2008 22
5. What role does ‘brand’ play in consumer andbusiness banking?
The world economy has a significant over ‐supply of products and services in all sectors. As a result differentiation through strong branding is becoming more and more important. This is as true in financial services as in consumer products.
Even non ‐traditional financial services companies, like Virgin, have created an array of well‐designed, differentiated, financial
products. Both consumer and wholesale markets are saturated and with so many alternatives, branding is becoming a deciding factor.
As such, there is an increasing onus on each brand’s to communicate why it is uniquely able to satisfy customer needs.
Banks need to provide a consistent brand
experience
to
prevent
customers
from
switching to rival banks.
There are significant differences in priorities for customers between the developed and developing world. In the developing world, the emphasis is on trustworthiness and for financial strength and stability.
Decisions are often made on more practical issues such as price and network.
Consumer banks have traditionally invested more in marketing activities than their wholesale counterparts. This is changing as Executive Boards are realising the value of brands in driving business. Consequently many banks are developing Brand Scorecards to track and correlate the impact of marketing expenditure with business performance.
However,
many
banks
remain
poor
at
analysing the effectiveness of their marketing investment across both their product and service offering.
How do brands affect financial performance?
Linking brand and marketing metrics to financial performance is often a complex process.
However, using market research (targeting customer and key stakeholders) combined with competitor benchmarking as inputs, it is possible to evaluate the effectiveness of marketing activities, and to establish the brand contribution to each segment of a banking business.
The varying levels of brand involvement in
the purchasing decisions across a bank’s product and service portfolio are governed
by the ‘Drivers of Demand’ – the critical factors affecting purchasing decisions.
The exact nature of the drivers varies according to the specifics of each particular market, although there are fundamental differences between Consumer and Business banking.
Figure 1 and Figure 2 provide an overview of the relationship between marketing actions and business performance, which are linked by the resulting changes in
perceived attributes and their impact on customer behaviour.

8/9/2019 Global 500 Financial Brands 2008
http://slidepdf.com/reader/full/global-500-financial-brands-2008 23/45
--------------------------------------------------------------------------------------------------------------------
2007 - Brand Finance Banking 500 © Brand Finance plc 2008 23
Consumer Banking
In consumer banking functional drivers of demand, like the quality of product and service, are the start point for customer choice.
For most complex and high ‐value products, consumers prefer a face ‐to ‐face exchange, a fact that is reflected by many leading banks returning to their retail branch roots.
Increasing consumer access to the internet – allowing potential customers to compare and review a wide range of financial products – means that price and product fundamentals are scrutinised in more detail.
But for the majority of consumers image attributes often swing the final decision.
Figure 1 ‐ Linking marketing actions to financial performance (Consumer)

8/9/2019 Global 500 Financial Brands 2008
http://slidepdf.com/reader/full/global-500-financial-brands-2008 24/45
--------------------------------------------------------------------------------------------------------------------
2007 - Brand Finance Banking 500 © Brand Finance plc 2008 24
Corporate Banking
A business ‐to ‐business purchasing decision should theoretically be more rational and informed than a consumer purchasing decision. However the brand and reputation are still extremely important.
In our experience ‘hygiene factors’ include price and technical capability. But the two most significant drivers of demand in business banking are personal relationships and brand reputation.
This is because a degree of practical competence is assumed to be present across the competitor set.
A typical brand valuation analysis would incorporate data sets taken from market research including areas such as relationship depth, product penetration, share of mind, satisfaction and quality indices and an assessment of recent marketing activity.
Figure 2 ‐ Linking marketing actions to financial performance (Corporate)

8/9/2019 Global 500 Financial Brands 2008
http://slidepdf.com/reader/full/global-500-financial-brands-2008 25/45
--------------------------------------------------------------------------------------------------------------------
2007 - Brand Finance Banking 500 © Brand Finance plc 2008 25
Quantifying the brand’s impact
For the purposes of this global valuation study Brand Finance has created a simplified Brand
Index methodology, which draws on publicly available data to score each brand in each product and service area.
The Brand Index is expressed on a scale of 0 to 100. It quantifies the strength of the bank’s brand relative to its main competitors, with reference to key business and brand attributes.
Each competitor is scored out of 100 on each chosen attribute. The attributes are weighted
and aggregated into an index for each brand. The exact weighting varies by product and service area, as the importance of each attribute fluctuates according to the specific drivers of demand.
Within this study, the Brand Index used both quantitative and qualitative data:
I. Input measures: • Quality of Brand Management • Brand Presence
II. Brand Equity: • Familiarity • Functional Performance • Emotional Connection • Brand Preference
III. Output measures: • Revenue Growth • Market Share • Profitability • Consensus Analyst Ratings
The quantitative data has been taken from Bloomberg, annual reports and Investor
Relations materials. The qualitative data was compiled by Brand Finance via secondary research.
In a more detailed project we would rely on internally available market research information in addition to the sources mentioned above.
The Brand Index score is used to pinpoint the exact rate within the predetermined royalty
range.
Figure 3 – Example Brand Index (Consumer Banking)
71
Brand Index
5.0% 100
4.5%
4.0%
3.5%
3.0%
2.5% 2.0%
1.5% 0

8/9/2019 Global 500 Financial Brands 2008
http://slidepdf.com/reader/full/global-500-financial-brands-2008 26/45
--------------------------------------------------------------------------------------------------------------------
2007 - Brand Finance Banking 500 © Brand Finance plc 2008 26
6. Accounting and tax implications of banks’brand values
(i) The Impact of IFRS3 on banking businesses
The introduction of IFRS represents a major shift in the way that companies undertake their financial reporting.
Although differences remain, the new standards in this area achieve a high degree of convergence with US GAAP. FAS 141 “Business Combinations” and FAS 142 “Goodwill and Other Intangible
Assets” in the US have already had important implications for brand owners and the way trademarks are valued and accounted for.
For the first time, trademarks and other acquired intangibles had to be separately recognised on the balance sheet following an acquisition. 1
IFRS 3 also requires identifiable assets to be recognised on the balance sheet of the acquiring entity, provided that certain conditions are met. This is a significant change from most existing (non ‐US) national accounting standards.
These and other significant new disclosures in respect of the cost of acquisition and the main classes of assets and liabilities will mean greater transparency and will require a much more detailed due diligence process.
Following recognition, the requirements of the new standards are
more onerous than before. Goodwill and intangible assets with indefinite useful economic lives will need to be tested at least annually for impairment. Assets with finite useful lives are required to be restated where there is evidence of impairment to the particular asset.
It seems likely that many companies
will require independent specialist valuation assistance in order to withstand the market scrutiny that greater transparency will bring and to satisfy the need for objectivity and auditor independence.
1 Internally generated brands cannot be put on a company’s balance sheet
IFRS 3 OverviewMethod The purchase method of accounting (or acquisition accounting) must be used.
Assets and liabilities acquired Recognition of more intangible assets and contingent liabilities at fair value at acquisition date.
Goodwill Not amortised but tested for impairment at least annually.
Negative goodwill Recognised in the profit and loss account immediately.
Impairment testing Detailed disclosures about transactions, useful economic life and impairment testing are required.
Historic transactions
Adopters of IFRS 3 can choose to restate past dea ls.

8/9/2019 Global 500 Financial Brands 2008
http://slidepdf.com/reader/full/global-500-financial-brands-2008 27/45
--------------------------------------------------------------------------------------------------------------------
2007 - Brand Finance Banking 500 © Brand Finance plc 2008 27
(ii) Key requirements of IFRS 3 with implications for brand and other intangible asset valuation
Allocating the cost of a business combination
At the date of acquisition, the acquirer must measure the cost of the business combination by recognising the acquiree’s identifiable assets, liabilities and contingent liabilities (including any proportion attributable to minority interests) at their fair value. Any difference between the total of net assets acquired and cost of acquisition is treated as goodwill or negative goodwill.
Intangible assets
All identifiable intangible assets of the acquired business must be recorded at their fair values.
To be recognised as an intangible asset, it must meet the following criteria:
• Separately identifiable (an asset is identifiable when it either arises from contractual or other legal rights or is separable. An asset is separable if it could be sold, on its own or with other assets)
• Controlled by the entity • A source of future economic benefits • It can be reliably measured in terms of
its fair value
IFRS 3 includes a list of assets that are expected to be separately recognised from goodwill. In many instances the valuation of such assets is a complex undertaking and companies may prefer to outsource this activity to independent
specialists.
Goodwill
After initial recognition of goodwill, IFRS 3 requires that goodwill be recorded at cost less accumulated impairment charges. Whereas previously under IAS 22 goodwill was amortised over its useful economic life (presumed not to exceed 20 years), it is now subject to impairment testing at least once a year. Amortisation is not permitted.
Impairment of Assets
A revised IAS 36 “Impairment of Assets” was issued at the same time as IFRS 3. Previously an impairment test was only required if a triggering event indicated
that impairment might have occurred. Under the new rules, an annual impairment test is required for certain assets, namely:
• Goodwill – tested annually and at any other time when an indicator of impairment exists
• Intangible assets with an indefinite useful economic life and intangible
assets not yet available for use
The recoverable amount of these assets must be measured annually (regardless of the existence or otherwise of an indicator of impairment) and at any other time when an indicator of impairment exists.
8/9/2019 Global 500 Financial Brands 2008
http://slidepdf.com/reader/full/global-500-financial-brands-2008 28/45
--------------------------------------------------------------------------------------------------------------------
2007 - Brand Finance Banking 500 © Brand Finance plc 2008 28
Brands are one type of intangible asset, which are frequently claimed to have indefinite useful economic lives. Where acquired brands are recognised on the balance sheet post ‐acquisition it will be important to establish a robust and supportable valuation model using best practice valuation techniques that can be consistently applied at each annual impairment review.
The revised IAS 36 also introduces new disclosure requirements, the principle one being the disclosure of the key
assumptions used in the calculation.
Increased disclosure is required where a reasonably possible change in a key assumption would result in actual impairment.
The requirement for separate balance sheet recognition of intangible assets, together with impairment testing of those assets and also goodwill, is expected to result in a significant increase in the involvement of independent specialist valuers to assist with actual valuation and also on appropriate disclosure.
Implications for intellectual property managers
Greater transparency, rigorous impairment testing and additional disclosure will result in more scrutiny by the market and will have a significant impact on the way companies plan their acquisitions.
Intellectual property managers must ensure that they have the necessary skills to satisfy the new requirements and to withstand market scrutiny.
More regular impairment testing is likely to result in a greater volatility in financial results. Analysts will need to be convinced that a company’s impairment
review process is robust.
In the case of brand and other intangible asset valuation, where a high degree of subjectivity can exist, it will be important to demonstrate that best practice techniques are being applied.
The use of independent experts may help convince analysts that the impairment testing process is not overtly subjective.
In terms of planning prior to acquisition,
a detailed analysis of all potential assets and liabilities is recommended to assess the impact on the consolidated group balance sheet and P&L post ‐acquisition.
For further information on goodwill impairment reviews or Purchase Price Allocations, please contact your local Brand Finance office or visit: www.brandfinance.com

8/9/2019 Global 500 Financial Brands 2008
http://slidepdf.com/reader/full/global-500-financial-brands-2008 29/45
--------------------------------------------------------------------------------------------------------------------
2007 - Brand Finance Banking 500 © Brand Finance plc 2008 29
(iii) Tax planning: IP‐holding companies
As well as impacting on M&A, strategic planning and ROI analysis, the rise in importance of marketing intangibles can often mean there is a strong business case for setting up a central IP‐holding company (IPCo)
Most of the banks within the Global 500 Index are active in multiple territories. Therefore locating and managing the IPCo from one central location, potentially in a low tax jurisdiction, makes a compelling commercial case.
The size and authority of the IPCo are variable and dependent on the requirements of the bank in question. The benefits include greater IP protection and consistency and improved resource allocation ‐ see below for more detailed explanation of benefits.
It is important that genuine commercial drivers for the establishment of IPCo can be demonstrated.
Examples of established IPCo’s from other sectors include:
• BATMark (in UK, US, Switzerland & Netherlands)
• Shell Brand International AG (Switzerland)
• Société des Produits Nestlé (Switzerland)
• Philip Morris Products SA (Switzerland)
This can have the following results:
A. Accumulation of profits in a low tax jurisdiction
B. Tax deductions for the amortization of intangible in IPCo
C. Tax deductions in high tax jurisdictions
D. Depending on double tax treaties,
the elimination or reduction of withholding taxes on income flows resulting from the exploitation of the IP
Commercial benefits of central IPCo’s include
Governance and controls - more effective, efficient IPprotection
− This reduces the risk of infringement or loss of a trademark in key categories and jurisdictions
Higher return on brand investment− Internal licenses should be used to clarify the
rights and responsibilities of the IPCo and operating units. The adoption of consistent and coherent brand strategy, marketing investment and brand control improves brand performance
Better resource allocation− Internal royalties result in greater visibility of
the true economic performance of operating companies
Improved earnings streams from external licenses− Clarity of the strength, value and ownership of
the IP ensures that full value is gained from third party agreements
Tax savings can be achieved in certain circumstances
Key tax issues include:
• CFC rules• Capital Gains Tax on
transfer to IPCo:− economic versus
legal ownership − ‘Wither on the vine’
approach to minimise CGT
• Local income tax andWHT
• Substance of IPCo• Transfer pricing
(affected by functionsand risks taken byIPCo)
• Intangible assetvaluation

8/9/2019 Global 500 Financial Brands 2008
http://slidepdf.com/reader/full/global-500-financial-brands-2008 30/45
--------------------------------------------------------------------------------------------------------------------
2007 - Brand Finance Banking 500 © Brand Finance plc 2008 30
Appendix
(i) The growth of intangible assets
In order to better understand the changing nature of intangible assets, Brand Finance has undertaken a global review of the world’s 32 largest stock markets. The “Global Intangible Tracker” study is available on our website (www.brandfinance.com). The analysis deconstructed each company’s enterprise value into the following constituent parts: Tangible assets, Disclosed intangible assets and Undisclosed intangible assets/ ‘’Undisclosed Value’’. Below are some highlights from this study for the banking and diversified financial services sector:
Enterprise Value/ ‘EV’ (% of global stock market)
‐Tangible
Assets
‐ Disclosed Intangible Assets
‐ “Undisclosed Value”
$8,086 billion (17%)
$3,178 billion (7%)
$757 billion (2%)
$4,151 billion (9%)
The enterprise value of the banking and diversified financial services sector has risen considerably over the last six years.
Most of the increase has come from an increase in the premium to net asset value, with EV/Tangible assets increasing to 2.54x versus 1.9x at the end of 2002.
Sector value split ($ billion)
0
1,000
2,000
3,000
4,000
5,000
6,000
7,000
8,000
9,000
10,000
2001 2002 2003 2004 2005 2006 2007HY
Tangible Net Assets Disclosed Intangibles (ex Goodw ill)
Goodw ill Undisclosed Value

8/9/2019 Global 500 Financial Brands 2008
http://slidepdf.com/reader/full/global-500-financial-brands-2008 31/45
--------------------------------------------------------------------------------------------------------------------
2007 - Brand Finance Banking 500 © Brand Finance plc 2008 31
The following charts show a breakdown of value by major markets:
Geographic breakdown of value ($ billion)
Breakdown of value by major market ($ billion)
Largest Disclosed Intangible Assets ($ billion)
Group Value
Bank of America 75.1 JPMorgan Chase 52.5
Citigroup Inc. 49.3
Largest deals announced in 2006 ($ billion)
Buyer Target Announced Deal Value
Intesa Sanpaolo Sanpaolo IMI Spa 26‐Aug‐06 35.4
Wachovia Corp Golden West Financial Corp 07‐May‐06 24.6 Bank of NY Mellon Corp Mellon Financial Corp 04‐Dec‐06 16.5
M&A, 2002 ‐2006 2002 2003 2004 2005 2006
Number of deals 770 638 669 745 779
Value of deals ($ billion) 186.6 100.1 128.2 225.7 190.1
Value of deals/ Sector Value 6.1% 2.4% 2.6% 4.2% 2.6%
0 500 1000 1500 2000 2500 3000
US
UK
Japan
China
HongKong
Italy
Spain
France
Canada
Australia
Tangible Invested Capital Disclosed Intangibles (ex Goodw ill)
Goodw ill Unrecorded Value
0% 20% 40% 60% 80% 100%
US
UK
Japan
China
HongKong
Italy
Spain
France
Canada
Australia
Tangible Invested Capital Disclosed Intangibles (ex Goodwill)
Goodw ill Unrecorded Value

8/9/2019 Global 500 Financial Brands 2008
http://slidepdf.com/reader/full/global-500-financial-brands-2008 32/45
--------------------------------------------------------------------------------------------------------------------
2007 - Brand Finance Banking 500 © Brand Finance plc 2008 32
(ii) Explanation of Brand Valuation Methodology
Brand Finance's methodology uses a Discounted Cash Flow (DCF) technique to discount estimated future royalties, at an appropriate discount rate, to arrive at a Net Present Value (NPV) – the value of the trademark and associated intellectual property (the ‘brand value’). The basic steps are outlined below:
1. Obtain brand ‐specific financial and revenue data (insurance revenues have been stripped out).
In 2007 we have analysed every revenue stream for all 500 brands (e.g.: retail banking, commercial banking, corporate banking, investment banking, asset management). For purposes of this study each revenue stream was then classified into four main groups: 1) corporate banking, 2) investment banking, 3) consumer banking and 4) credit cards.
2. Model the market (to identify market demand and the position of individual brands in the context of all other market competitors). Usually the valuation model is segmented to reflect the relevant competitive framework within which the brand operates.
3. Establish the royalty rate for each brand:
• Calculate brand strength score (Brand Index) – see page 25 for further details. • Determine royalty rate range: Identify a royalty rate range and pinpoint a
royalty rate for each of the four revenue streams. We determine the royalty rate ranges through a sector wide analysis of profit margins, and pinpoint a final royalty rate using the brand index for each bank.
4. Calculate future royalty income stream.
5. Calculate discount rate specific to each bank incorporating size, international presence, reputation, gearing and ßrandßeta ® (see below).
6. Discount future royalty stream (explicit forecast and perpetuity periods) to a net present value = brand value.
Brand Finance has used three forecast periods :
I. We estimated the historic results for 2007 using Institutional Brokers Estimate System (IBES) consensus forecast
II. A subsequent four ‐year forecast period (2008 ‐2011) based on an average of available IBES figures, historic growth and GDP growth expectations weighted by geographic split of revenues
III. A perpetuity growth figure based on a combination of IBES and GDP growth expectations weighted by geographic split of revenues

8/9/2019 Global 500 Financial Brands 2008
http://slidepdf.com/reader/full/global-500-financial-brands-2008 33/45
--------------------------------------------------------------------------------------------------------------------
2007 - Brand Finance Banking 500 © Brand Finance plc 2008 33
Royalty Relief Approach
The Brand Finance model uses a "relief from royalty" methodology for two reasons. Firstly, it is the valuation methodology that is favoured by the tax authorities and the courts because it calculates brand values by reference to documented, third ‐party transactions; and secondly, because it can be performed on the basis of mostly publicly available financial information.
This is an economic use approach which determines the value of the brand in relation to the royalty rate that would be payable for its use were it owned by a third party. The royalty rate is applied to future revenue to determine an earnings stream that is attributable to the brand. The brand earnings stream is then discounted back to a net present value.
Brand Finance determines the appropriate royalty rate using a variety of means. Initially a comparative study of publicly available royalty agreements is undertaken to determine a range of royalty rates for the banking sector, differentiating between Consumer Banking, Business Banking, Investment Banking and Credit Cards. In a full valuation project, each business unit within a bank is likely to be charged a different royalty rate, depending on its strengths versus the competitor set.
This range is then substantiated through a margin analysis of comparable companies. Finally, a competitive benchmarking study (Brand Index) is conducted in order to determine the position of the bank’s brand along the royalty rate range.
ßrandßeta ®
‘ßrandßeta ®’ analysis is a benchmarking study of the strength, risk and future potential of a brand relative to its competitor set. It is conceptually similar to a credit rating, which companies are awarded based on their strength, risk and future earning potential.
It serves the following purposes: • Quantifies the strength and performance of the brand being valued • Provides an indication of the risk attached to future earnings of the brand, and
can be used in the determination of an appropriate discount rate for valuation purposes
• Provides basis for value ‐based brand tracking
The brand rating incorporates both quantitative and qualitative data. For this study quantitative data has been taken from Bloomberg, annual reports and Investor Relations materials. The qualitative data was compiled by Brand Finance via secondary research:
• Input measures (Quality of Brand Management and Brand Presence). • Brand Equity (Familiarity, Functional Performance, Emotional Connection and
Brand Preference). • Output measures (Revenue Growth, Market Share, Profitability and Consensus
Analyst Ratings).

8/9/2019 Global 500 Financial Brands 2008
http://slidepdf.com/reader/full/global-500-financial-brands-2008 34/45
--------------------------------------------------------------------------------------------------------------------
2007 - Brand Finance Banking 500 © Brand Finance plc 2008 34
Brand Ratings Definitions
Rating Definition
AAA Extremely strong AA Very strong
A Strong
BBB Average
BB Under ‐performing
B Weak
CCC Very weak
CC Extremely weak
C Failing
The results
in
this
report
have
been
prepared
using
publicly
available
data
and
using
Brand Finance’s judgement where necessary.
The ratings from AA to CCC can be altered by including a plus (+) or minus (‐) sign to show their more detailed positioning in comparison with the general rating group

8/9/2019 Global 500 Financial Brands 2008
http://slidepdf.com/reader/full/global-500-financial-brands-2008 35/45
--------------------------------------------------------------------------------------------------------------------
2007 - Brand Finance Banking 500 © Brand Finance plc 2008 35
(iii) Notes on the Brand Finance Banking 500
Sub ‐brands:
In the case of major sub ‐brands, the Global 500 has stripped out brand ‐specific revenues in order to list them separately within the table. This has only been possible where the financial data is available from annual reports, investor or analyst presentations/reports, Bloomberg or an assessment based on a combination of these data providers.
For groups with multiple brands market cap has been allocated to each brand pro ‐rata based on revenues.

8/9/2019 Global 500 Financial Brands 2008
http://slidepdf.com/reader/full/global-500-financial-brands-2008 36/45
--------------------------------------------------------------------------------------------------------------------
2007 - Brand Finance Banking 500 © Brand Finance plc 2008 36
(iv) The Brand Finance Banking 500 (101 ‐500)
The Brand Finance Banking 500 (101 ‐150)
Rank 2007
Rank 2005
CompaniesCountry
of Domicile
Brand Value (US$M)
2007
Market Cap (US$M)
31/12/07
Brand Value / Market
Cap(%) 2007
Brand Rating (based on BrandBeta
analysis) 2007
Brand Value (US$M)
2005
Market Cap (US$M)
31/12/05
Market Cap (US$M)
31/12/06
Brand Rating (based on BrandBeta
analysis) 2005101 64 BB&T CORPORATION US 1,558 16,782 9% BBB ‐ 22,728 23,787 A ‐
102 79 SEB SE 1,539 16,446 9% BB ‐ 14,116 21,557 BB
103 85 HANG SENG BANK HK 1,522 39,424 4% A+ ‐ 24,953 26,125 A
104 n/a DNB NOR NO 1,484 20,335 7% A ‐ ‐ 14,262 18,906 ‐
105 n/a RAIFFEISEN BANK AT 1,445 20,417 7% A ‐ ‐ 9,378 21,710 ‐
106 n/a UBI BANCA IT 1,442 16,677 9% A ‐ 7,540 17,551 ‐
107 83 NOMURA JP 1,393 39,816 3% BBB ‐ 37,662 42,555 BBB
108 n/a BEAR STEARNS US 1,391 11,552 12% A ‐ ‐ 16,252 22,215 ‐
109 86 DANSKE BANK DK 1,328 26,530 5% BB ‐ 22,472 30,381 BBB
110 n/a SNS REAAL NL 1,304 5,580 23% A ‐ ‐ N/A 5,087 ‐
111 69 AL ‐RAJHI BANKING SA 1,300 48,350 3% A ‐ 64,898 34,737 A+
112 84 SVENSKA HANDELSBANKEN SE 1,297 19,631 7% BBB ‐ 16,593 19,183 BBB
113 81 REGIONS FINANCIAL US 1,287 14,229 9% A ‐ ‐ 15,643 27,305 A ‐
114 76 KEYCORP US 1,280 9,264 14% A ‐ ‐ 13,428 15,180 A ‐
115 n/a NEDBANK ZA 1,276 7,972 16% A ‐ ‐ 6,987 8,614 ‐
116 n/a EUROBANK EFG GR 1,270 16,025 8% BBB ‐ 9,937 13,868 ‐
117 87 UNITED OVERSEAS SG 1,268 19,941 6% A ‐ 13,504 19,260 A ‐
118 88 MONTE PASCHI IT 1,220 15,496 8% B ‐ 14,053 19,542 B
119 74 FIFTH THIRD BANK US 1,205 12,975 9% BBB ‐ 20,929 22,767 BBB
120 n/a CHINA MINSHENG BANK CN 1,182 32,339 4% A ‐ ‐ 5,112 13,287 ‐
121 n/a JULIUS BAER GROUP CH 1,170 1 6,588 7% A ‐ 7,752 12,198 ‐
122 n /a EMIRATES NBD AE 1,156 5,882 20% A ‐ ‐ N/A N/A ‐
123 n/a BANESTO ES 1,101 13,477 8% AA ‐ ‐ 10,363 15,342 ‐
124 n/a NORTHERN TRUST US 1,093 16,894 6% A+ ‐ 11,303 13,273 ‐
125 n/a ALPHA BANK GR 1,052 14,946 7% BBB ‐ 8,511 12,323 ‐
126 n/a K AUPTHING BANK IS 1,012 8,809 11% A ‐ ‐ 7,845 8,665 ‐
127 78 WOORI FINANCE KR 1,000 15,991 6% A ‐ ‐ 16,051 19,154 BBB
128 n/a UNIBANCO BR 974 29,012 3% BB ‐ 9,475 15,372 ‐
129 n/a SALLIE MAE US 954 10,304 9% AA ‐ ‐ 22,760 20,026 ‐
130 n/a LG CARD KR 949 5,654 17% A ‐ ‐ 6,268 8,344 ‐
131 95 BANCA ANTONVENETA IT 944 11,170 8% A ‐ ‐ 9,605 16,329 BB
132 n/a BANCA POPOLARE DI VERONA IT 944 11,462 8% B ‐ 7,542 10,752 ‐
133 92 NATIONAL BANK OF CANADA CA 924 9,078 10% A ‐ ‐ 8,601 8,817 A
134 n/a SAISON CARD JP 923 5,926 16% A ‐ ‐ 6,299 9,916 ‐
135 n/a BANK PEKAO PL 902 22,990 4% A ‐ ‐ 8,940 13,013 ‐
136 n/a PKO BANK POLSKI PL 891 19,136 5% A ‐ ‐ 8,924 16,159 ‐
137 n/a BANK HAPOALIM IL 873 6,066 14% BBB ‐ 5,839 5,894 ‐
138 n/a DAIWA SECURITIES JP 859 16,891 5% BBB ‐ 8,763 17,754 ‐
139 n/a GRUPO BANCO POPULAR ES 851 19,579 4% BBB ‐ 14,814 22,008 ‐
140 n/a ALLIANCE & LEICESTER UK 846 6,158 14% A ‐ 7,669 9,752 ‐
141 93 OCBC SG 843 17,532 5% BBB ‐ 12,548 15,690 BB
142 91 MALAYAN BANKING MY 837 13,518 6% A ‐ ‐ 11,105 11,057 BBB
143 n /a MILLENNIUM BCP PT 836 14,075 6% A ‐ ‐ 9,893 13,336 ‐
144 n/a NICOS JP 825 3,124 26% A ‐ ‐ 1,385 9,571 ‐
145 n/a CHUO MITSUI TRUST JP 824 8,944 9% A+ ‐ 8,182 12,051 ‐
146 n/a INVESTEC UK 821 4,943 17% A ‐ ‐ 2,192 3,817 ‐
147 n/a BANK ALJAZIRA SA 816 3,984 20% A ‐ 6,346 3,930 ‐
148 n/a EUROHYPO DE 793 14,118 6% A ‐ ‐ 9,003 10,197 ‐
149 n/a UNION BANK OF CALIFORNIA US 788 6,309 12% A ‐ 9,910 8,520 ‐
150 89 M&T BANK US 784 8,967 9% A+ ‐ 12,254 13,475 A

8/9/2019 Global 500 Financial Brands 2008
http://slidepdf.com/reader/full/global-500-financial-brands-2008 37/45
--------------------------------------------------------------------------------------------------------------------
2007 - Brand Finance Banking 500 © Brand Finance plc 2008 37
The Brand Finance Banking 500 (151 ‐200)
Rank 2007
Rank 2005
CompaniesCountry
of Domicile
Brand Value (US$M)
2007
Market Cap (US$M)
31/12/07
Brand Value / Market
Cap(%) 2007
Brand Rating (based on BrandBeta
analysis) 2007
Brand Value (US$M)
2005
Market Cap (US$M)
31/12/05
Market Cap (US$M)
31/12/06
Brand Rating (based on BrandBeta
analysis) 2005151 n/a COUNTRYWIDE US 783 3,663 21% BB ‐ 20,515 24,841 ‐
152 n/a BANK OF CYPRUS GROUP CY 782 9,897 8% A ‐ 2,743 7,538 ‐
153 n/a ARAB NATIONAL BANK SA 781 15,627 5% A ‐ ‐ 13,266 9,468 ‐
154 n/a NATIONAL BANK OF ABU DHABI AE 775 10,619 7% A ‐ 14,984 6,916 ‐
155 n/a NBK KW 762 19,984 4% A ‐ 12,257 14,576 ‐
156 n/a BANCO ESPIRITO SANTO PT 755 10,003 8% A ‐ ‐ 4,705 8,880 ‐
157 n/a BNL IT 717 8,625 8% BB ‐ 10,141 12,871 ‐
158 n/a CIT US 709 4,561 16% AA ‐ ‐ 10,310 11,059 ‐
159 n/a ZIONS BANCORP US 704 4,705 15% A ‐ ‐ 7,945 8,798 ‐
160 n/a KEB KR 700 9,631 7% BBB ‐ 9,003 8,911 ‐
161 n/a LAZARD BM 693 3,729 19% A ‐ ‐ 3,178 5,091 ‐
162 n/a QNB QA 692 12,080 6% A ‐ 10,609 8,477 ‐
163 n/a HYPO REAL ESTATE GROUP DE 681 9,894 7% A ‐ 6,977 8,438 ‐
164 n/a ACOM JP 675 6,698 10% BBB‐
10,706 9,244‐
165 n/a COMMERCE BANCORP US 669 7,234 9% BBB ‐ 6,148 6,649 ‐
166 n/a AIFUL JP 666 4,396 15% BBB ‐ 11,334 9,389 ‐
167 n/a POPULAR PR 659 2,666 25% BBB ‐ 5,836 5,003 ‐
168 n/a PIRAEUS BANK GR 653 12,094 5% BBB ‐ 4,602 8,549 ‐
169 n/a COMPASS BANK US 650 4,323 15% A ‐ 5,961 7,759 ‐
170 n/a SUMITOMO TRUST JP 647 17,503 4% B ‐ 10,864 19,388 ‐
171 n/a SYNOVUS US 647 3,870 17% A ‐ ‐ 8,444 10,037 ‐
172 n/a TD AMERITRADE US 646 10,835 6% A ‐ 8,718 11,454 ‐
173 n/a BANCO SABADELL ES 645 11,863 5% A ‐ ‐ 8,024 13,686 ‐
174 n/a COMERICA US 641 6,529 10% A ‐ ‐ 9,246 9,246 ‐
175 n/a SABB SA 640 16,036 4% A ‐ ‐ 21,993 11,774 ‐
176 n/a PROMISE JP 638 4,789 13% BBB ‐ 9,222 7,685 ‐
177 n/a ANGLO IRISH BANK IE 635 14,254 4% A ‐ ‐ 9,243 11,850 ‐178 n/a AKBANK TR 631 20,844 3% A ‐ 14,670 13,354 ‐
179 n/a AMSOUTH BANK US 626 5,576 11% A ‐ ‐ 9,123 8,309 ‐
180 n/a DUBAI ISLAMIC BANK AE 612 9,262 7% A ‐ 11,863 6,160 ‐
181 n/a BANCA POPOLARE DELL'EMILIA ROMAGNA IT 610 5,654 11% BBB ‐ 3,914 5,737 ‐
182 n/a BANQUE SAUDI FRANSI SA 608 17,139 4% A ‐ ‐ 16,195 12,419 ‐
183 n/a VOLKSBANK AT 602 19,411 3% A ‐ ‐ 10,994 16,831 ‐
184 n/a HOKUHOKU FINANCIAL GROUP JP 586 4,801 12% A ‐ ‐ 3,897 5,657 ‐
185 94 NORTH FORK BANC CORP US 582 7,153 8% A ‐ ‐ 13,015 9,149 A ‐
186 90 MIZUHO TRUST & BANKING JP 580 11,152 5% BBB ‐ 17,037 16,291 BBB
187 n/a LANDSBANKI IS 562 5,717 10% A ‐ ‐ 4,254 4,110 ‐
188 100 ISBANK TR 557 16,802 3% B ‐ 17,119 12,646 B
189 n/a BANCA POPOLARE DI MILANO IT 552 5,496 10% BBB ‐ 4,541 7,191 ‐
190 96 SAMBA SA 547 28,304 2% BBB ‐ 31,109 22,358 A ‐191 n/a BANK OF YOKOHAMA JP 537 10,408 5% A ‐ 8,609 11,525 ‐
192 n/a M&I BANK US 526 3,891 14% A ‐ ‐ 5,874 6,540 ‐
193 n/a BANGKOK BANK TH 516 7,302 7% BBB ‐ 4,887 5,820 ‐
194 n/a ATEBANK GR 516 5,233 10% A ‐ ‐ 5,400 4,642 ‐
195 n/a MEDIOBANCA IT 506 18,658 3% BBB ‐ 14,923 15,961 ‐
196 n/a RIYAD BANK SA 505 16,036 3% A ‐ ‐ 22,659 10,749 ‐
197 n/a LBB HOLDING AG DE 504 8,797 6% A ‐ ‐ 3,536 10,478 ‐
198 n/a EMPORIKI BANK GR 497 3,924 13% A ‐ ‐ 4,496 4,068 ‐
199 99 NIKKO CORDIAL JP 496 13,823 4% BBB ‐ 15,434 15,993 A ‐
200 n/a BRD GROUPE SOCIETE GENERALE RO 494 6,429 8% A ‐ ‐ 3,067 5,029 ‐

8/9/2019 Global 500 Financial Brands 2008
http://slidepdf.com/reader/full/global-500-financial-brands-2008 38/45
--------------------------------------------------------------------------------------------------------------------
2007 - Brand Finance Banking 500 © Brand Finance plc 2008 38
The Brand Finance Banking 500 (201 ‐250)
Rank 2007
Rank 2005
CompaniesCountry
of Domicile
Brand Value (US$M)
2007
Market Cap (US$M)
31/12/07
Brand Value / Market
Cap(%) 2007
Brand Rating (based on BrandBeta
analysis) 2007
Brand Value (US$M)
2005
Market Cap (US$M)
31/12/05
Market Cap (US$M)
31/12/06
Brand Rating (based on BrandBeta
analysis) 2005
201 n/a DEPFA BANK IE 493 2,937 17% BB ‐ 5,217 6,300 ‐202 n/a THE SAUDI INVESTMENT BANK SA 487 6,166 8% A ‐ ‐ 8,935 5,678 ‐
203 n/a HUNTINGTON US 485 4,566 11% BBB ‐ 5,323 5,593 ‐
204 n/a BANCO DE CHILE CL 481 5,843 8% A ‐ ‐ 4,570 5,941 ‐
205 n/a AEON CREDIT SERVICE JP 471 2,982 16% BBB ‐ 3,515 4,154 ‐
206 n/a GARANTI TR 469 16,597 3% BB ‐ 7,624 6,937 ‐
207 n/a CIMBGROUP MY 466 12,114 4% BB ‐ 4,157 6,995 ‐
208 n/a YAPIKREDI TR 460 11,310 4% BB ‐ 3,512 5,457 ‐
209 n/a ADCB AE 455 7,648 6% A ‐ 12,033 6,338 ‐
210 n/a FIRST HORIZON NATIONAL CORPORATION US 455 2,209 21% BBB ‐ 4,852 5,217 ‐
211 n/a BANK OF GREECE GR 433 2,121 20% AAA ‐ ‐ 1,776 2,030 ‐
212 n/a RAYMOND JAMES US 429 3,948 11% BBB ‐ 2,425 3,414 ‐
213 n/a SIAM COMMERCIAL BANK TH 428 5,083 8% BBB ‐ 2,295 3,044 ‐
214 n/a TAKEFUJI CORPORATION JP 426 5,660 8% BB ‐ 9,477 8,873 ‐215 n/a ESPIRITO SANTO FINANCIAL GROUP LU 424 1,822 23% A ‐ ‐ 1,403 1,915 ‐
216 n/a IBK KR 422 7,520 6% B ‐ 7,039 7,470 ‐
217 n/a BEA HK 421 9,992 4% A ‐ ‐ 4,568 8,778 ‐
218 n/a KB CZ 418 8,982 5% A ‐ 5,318 5,645 ‐
219 n/a EFG INTERNATIONAL CH 407 5,135 8% A ‐ ‐ 3,903 5,524 ‐
220 n/a BANCA CR FIRENZE IT 406 8,118 5% A ‐ ‐ 3,364 4,630 ‐
221 n/a NOSSA CAIXA BR 404 1,575 26% A ‐ ‐ 1,599 2,406 ‐
222 n/a METAVANTE US 400 2,974 13% A ‐ ‐ 4,229 5,000 ‐
223 n/a CHIBA BANK JP 396 7,907 5% A ‐ 5,447 7,941 ‐
224 n/a BANK RAKYAT INDONESIA ID 393 10,188 4% A ‐ ‐ 3,700 7,036 ‐
225 n/a SHIZUOKA BANK JP 391 7,560 5% A ‐ 7,157 7,161 ‐
226 n/a KASIKORNBANK TH 390 6,427 6% BBB ‐ 4,051 4,061 ‐
227 n/a PROVIDENT FINANCIAL UK 388 1,963 20% A ‐ ‐ 2,404 3,516 ‐
228 97 SHINSEI BANK JP 387 6,617 6% BBB ‐ 7,854 9,527 BBB
229 n/a ORICO JP 386 1,478 26% BB ‐ 2,627 3,162 ‐
230 n/a BABCOCK & BROWN AU 383 5,978 6% A ‐ ‐ 2,905 5,249 ‐
231 n/a GROUPO BANCOLOMBIA CO 375 6,553 6% A ‐ ‐ 6,465 5,647 ‐
232 n/a SHINKIN CENTRAL BANK JP 374 10,234 4% A+ ‐ 11,023 12,020 ‐
233 n/a QIB QA 371 5,724 6% A ‐ ‐ 6,643 4,235 ‐
234 n/a HDFC BANK IN 368 6,883 5% A ‐ N/A 5,428 ‐
235 n/a VAKIFBANK TR 366 8,034 5% BB ‐ 6,775 6,003 ‐
236 n/a BANKINTER ES 362 6,987 5% A ‐ ‐ 4,271 6,176 ‐
237 n/a KTB TH 361 3,501 10% BB ‐ 2,999 3,688 ‐
238 n/a GULF BANK KW 357 7,668 5% BBB ‐ 3,955 5,641 ‐
239 n/a BPI PT 356 5,012 7% A ‐ ‐ 3,419 5,827 ‐
240 n/a WBK PL 351 6,161 6% A ‐ ‐ 3,177 5,644 ‐
241 n/a BASLER KANTON‐PC CH 343 3,122 11% AA ‐ 2,434 2,697 ‐
242 n/a CATTLES UK 342 1,781 19% A ‐ ‐ 1,861 2,834 ‐
243 n/a GLITNIR IS 341 4,791 7% BBB ‐ 3,594 4,644 ‐
244 n/a E TRADE FINANCIAL US 333 1,422 23% B ‐ 8,690 9,558 ‐
245 n/a AFRICAN BANK ZA 331 2,275 15% A ‐ ‐ 1,667 1,418 ‐
246 n/a JYSKE BANK DK 326 4,040 8% A ‐ 3,043 4,026 ‐
247 n/a AMERICREDIT US 323 3,150 10% BB ‐ 3,714 3,555 ‐
248 n/a CLOSE BROTHERS GROUP UK 321 2,443 13% A ‐ ‐ 1,927 2,365 ‐
249 n/a LAIKI GROUP CY 320 9,114 4% BBB ‐ 1,506 7,567 ‐
250 n/a BANK OF MOSCOW RU 319 6,838 5% A ‐ ‐ 2,383 5,428 ‐

8/9/2019 Global 500 Financial Brands 2008
http://slidepdf.com/reader/full/global-500-financial-brands-2008 39/45
--------------------------------------------------------------------------------------------------------------------
2007 - Brand Finance Banking 500 © Brand Finance plc 2008 39
The Brand Finance Banking 500 (251 ‐300)
Rank 2007
Rank 2005
CompaniesCountry
of Domicile
Brand Value (US$M)
2007
Market Cap (US$M)
31/12/07
Brand Value / Market
Cap(%) 2007
Brand Rating (based on BrandBeta
analysis) 2007
Brand Value (US$M)
2005
Market Cap (US$M)
31/12/05
Market Cap (US$M)
31/12/06
Brand Rating (based on BrandBeta
analysis) 2005251 n/a BCV CH 316 3,590 9% A+ ‐ 2,448 4,120 ‐
252 n/a BANCO PASTOR ES 316 3,762 8% A ‐ ‐ 3,129 5,068 ‐
253 n/a AMBANK GROUP MY 314 2,317 14% A ‐ ‐ 1,575 1,637 ‐
254 n/a TAISHIN HOLDINGS TW 313 2,304 14% A ‐ ‐ N/A N/A ‐
255 n/a US TRUST US 308 1,991 15% AA ‐ ‐ 2,327 3,275 ‐
256 n/a OMC CARD JP 308 1,560 20% BB ‐ 2,474 3,406 ‐
257 n/a ASSOCIATED BANK US 302 3,059 10% BBB ‐ 4,416 4,495 ‐
258 n/a JOYO BANK JP 300 5,004 6% A ‐ ‐ 4,465 5,791 ‐
259 n/a MANDIRI ID 300 7,499 4% B ‐ 3,376 6,653 ‐
260 n/a ZAG REBACK A BANKA HR 299 8,240 4% BBB ‐ 1,868 3,584 ‐
261 n/a CREDEM IT 299 3,582 8% A ‐ ‐ 3,107 3,985 ‐
262 n/a BCA ID 296 9,472 3% A ‐ ‐ 4,257 7,128 ‐
263 n/a TCF US 295 2,056 14% A ‐ ‐ 3,631 3,576 ‐
264 n/a COMMERCIAL BANK KUWAIT KW 294 7,189 4% BBB ‐ 3,910 4,390 ‐
265 n/a AHLI UNITED BANK BH 292 6,239 5% A ‐ ‐ 2,444 3,221 ‐
266 n/a COMMERCIAL BANK QA 290 7,767 4% A ‐ ‐ 5,903 3,773 ‐
267 n/a JEFFERIES US 287 2,303 12% BBB ‐ 2,614 3,206 ‐
268 n/a COLONIAL BANK US 287 1,756 16% BBB ‐ 3,674 3,934 ‐
269 n/a FINANSBANK TR 282 6,384 4% A ‐ ‐ 4,223 5,205 ‐
270 n/a CREDICORP BM 279 6,130 5% A ‐ ‐ 1,818 3,265 ‐
271 n/a GROUPO BANCA CARIGE IT 277 6,845 4% A ‐ ‐ 4,342 6,528 ‐
272 n/a BRE BANK PL 275 5,151 5% A ‐ ‐ 1,507 3,410 ‐
273 n/a GLOBAL INVESTMENT HOUSE KW 271 3,400 8% A ‐ 2,544 2,616 ‐
274 n/a ROSBANK RU 269 4,970 5% B ‐ N/A 4,913 ‐
275 n/a PFPC US 266 1,951 14% A ‐ 1,868 2,978 ‐
276 n /a ATTIJARIWAFA BANK MA 263 8,380 3% BB ‐ 2,585 5,256 ‐
277 n/a PBZ HR 261 6,841 4% A‐ ‐
1,552 3,832‐
278 n/a COMMERCE BANK US 259 3,221 8% A ‐ 3,528 3,391 ‐
279 n/a SYDBANK DK 256 2,754 9% A ‐ ‐ 1,637 3,292 ‐
280 n/a MEGA HOLDINGS TW 253 6,813 4% BB ‐ N/A N/A ‐
281 n/a CHINATRUST TW 253 6,035 4% BB ‐ N/A N/A ‐
282 n/a CITY NATIONAL BANK US 253 2,758 9% A ‐ ‐ 3,601 3,409 ‐
283 n/a VONTOBEL CH 249 2,764 9% A ‐ ‐ 1,968 2,758 ‐
284 n/a DGB KR 249 2,022 12% A ‐ ‐ 2,002 2,259 ‐
285 n/a BANK BPH PL 249 1,124 22% A ‐ ‐ 6,632 9,147 ‐
286 n/a DAEWOO SECURITIES KR 248 3,405 7% A‐ ‐ 1,189 3,003 ‐
287 n/a THE STUDENT LOAN CORPORATION US 248 2,200 11% A ‐ ‐ 4,185 4,146 ‐
288 n/a PUSAN BANK KR 248 2,183 11% A ‐ ‐ 1,924 1,830 ‐
289 n/a HIROSHIMA BANK JP 247 3,445 7% BBB ‐ 3,251 3,714 ‐
290 n/a ABK KW 243 4,797 5% BBB ‐ 2,253 2,483 ‐291 n/a SAUDI HOLLANDI BANK SA 242 4,243 6% A ‐ ‐ 6,987 4,454 ‐
292 n/a CHUGOKU BANK JP 241 3,063 8% A ‐ 2,952 3,580 ‐
293 n/a CREDITO VALTELLINESE IT 241 2,074 12% A‐ ‐ 1,042 1,466 ‐
294 n/a BRADFORD & BINGLEY UK 239 3,102 8% BBB ‐ 4,474 5,838 ‐
295 n/a THE GUNMA BANK JP 238 3,537 7% A ‐ ‐ 2,866 3,773 ‐
296 n/a OKO BANK FI 236 3,677 6% A+ ‐ 2,823 3,406 ‐
297 n/a VAN LANSCHOT BANKIERS NL 236 3,726 6% A ‐ ‐ 2,388 3,078 ‐
298 n/a CITI HANDLOWY PL 234 4,383 5% A ‐ ‐ 2,674 3,899 ‐
299 n/a IYO BANK JP 232 3,248 7% A ‐ ‐ 2,856 3,477 ‐
300 n/a FROST BANK US 229 2,761 8% A ‐ ‐ 2,925 3,340 ‐

8/9/2019 Global 500 Financial Brands 2008
http://slidepdf.com/reader/full/global-500-financial-brands-2008 40/45
--------------------------------------------------------------------------------------------------------------------
2007 - Brand Finance Banking 500 © Brand Finance plc 2008 40
The Brand Finance Banking 500 (301 ‐350)
Rank 2007
Rank 2005
CompaniesCountry
of Domicile
Brand Value (US$M)
2007
Market Cap (US$M)
31/12/07
Brand Value / Market
Cap(%) 2007
Brand Rating (based on BrandBeta
analysis) 2007
Brand Value (US$M)
2005
Market Cap (US$M)
31/12/05
Market Cap (US$M)
31/12/06
Brand Rating (based on BrandBeta
analysis) 2005301 n/a BANK OF KYOTO JP 222 4,066 5% A‐ ‐ 2,860 4,242 ‐
302 n/a WILMINGTON TRUST US 220 2,392 9% A‐ ‐ 2,642 2,887 ‐
303 n/a 77 BANK JP 219 2,482 9% A‐ ‐ 2,755 2,933 ‐
304 n/a BANCA POPOLARE DI SONDRIO IT 216 4,566 5% A‐ ‐ 3,188 4,215 ‐
305 n/a PEOPLE'S UNITED BANK US 214 5,360 4% A‐ ‐ 4,398 6,345 ‐
306 n/a BPI PH 212 5,012 4% A ‐ ‐ 2,314 5,827 ‐
307 n/a BOK FINANCIAL CORPORATION US 209 3,253 6% BBB ‐ 3,030 3,687 ‐
308 n/a BASELLANDSCHAFTLICHE KANTONALBANK CH 207 2,126 10% AA+ ‐ 1,845 1,975 ‐
309 n/a MILLENNIUM BANK PL 206 3,059 7% A‐ ‐ 1,372 2,321 ‐
310 n/a FIRST CITIZENS US 203 1,528 13% A‐ ‐ 1,829 2,114 ‐
311 n/a ST GALLER KANTONALBANK CH 203 2,463 8% A‐ ‐ 1,645 2,329 ‐
312 n/a NANTO BANK JP 202 1,478 14% BBB ‐ 1,649 1,756 ‐
313 n/a BANCO DE VALENCIA ES 199 5,950 3% A‐ ‐ 3,105 5,166 ‐
314 n/a KOTAK IN 199 3,599 6% A‐ ‐ 960 1,927 ‐315 n/a SAPPORO HOKUYO HOLDINGS JP 198 4,004 5% A‐ ‐ 2,996 4,516 ‐
316 n/a ITG US 198 1,945 10% A ‐ 1,516 1,879 ‐
317 n/a VUB BANKA SK 197 2,231 9% A‐ ‐ 1,520 1,961 ‐
318 n/a GETIN HOLDING PL 197 4,000 5% A‐ ‐ 1,036 2,805 ‐
319 n/a CARNEGIE SE 194 1,233 16% A‐ ‐ 997 1,498 ‐
320 n/a BANKMUSCAT OM 193 5,057 4% BBB ‐ 1,753 2,482 ‐
321 n/a THE FIRST MARBLEHEAD CORPORATION US 189 3,607 5% A ‐ 2,275 3,590 ‐
322 n/a BANCO DE CREDITO (BCP) PE 188 4,804 4% BB ‐ 2,139 3,664 ‐
323 n/a SHINKO SECURITIES JP 188 3,924 5% BBB ‐ 2,596 4,283 ‐
324 n/a MIZUHO JP 185 3,027 6% A‐ ‐ 2,574 4,182 ‐
325 n/a WEBSTER US 184 1,476 12% BBB ‐ 2,517 2,747 ‐
326 n /a BANCORPSOUTH US 182 1,762 10% BBB ‐ 1,749 2,122 ‐
327 n/a OKASAN SECURITIES JP 182 1,613 11% A‐ ‐ 1,163 2,364 ‐
328 n/a ACCREDITED HOME LENDERS US 181 1,580 11% BBB ‐ 1,057 684 ‐
329 n/a BANCO DE BOGOTA CO 180 3,839 5% A‐ ‐ 2,957 3,520 ‐
330 n/a BANCO DE ANDALUCIA ES 177 1,932 9% A‐ ‐ 2,048 2,641 ‐
331 n/a WOORI INVESTMENT & SECURITIES KR 176 2,782 6% A‐ ‐ 1,265 2,887 ‐
332 n/a SAMSUNG SECURITIES KR 175 3,557 5% A‐ ‐ 1,660 3,546 ‐
333 n/a DENIZBANK TR 175 3,514 5% A‐ ‐ 2,049 3,101 ‐
334 n/a LUZERNER KANTONALBANK CH 174 1,992 9% AA‐ ‐ 1,538 1,796 ‐
335 n/a INVESTORS BANK US 172 1,810 10% A‐ ‐ 2,318 2,800 ‐
336 n/a HACHIJUNI BANK JP 172 3,669 5% A‐ ‐ 3,547 4,215 ‐
337 n/a AAREAL BANK DE 172 1,746 10% BBB ‐ 1,622 1,954 ‐
338 n/a VALIANT HOLDING CH 169 2,679 6% A‐ ‐ 1,431 1,852 ‐
339 n/a MIRAE ASSET KR 167 7,234 2% A‐ ‐ N/A 1,659 ‐
340 n/a HOUSING DEVELOPMENT FINANCE IN 166 8,848 2% A ‐ 4,138 7,472 ‐
341 n/a URALSIB FINANCIAL CORPORATION RU 165 4,472 4% B ‐ 3,353 6,683 ‐
342 n/a BANIF PT 165 1,315 13% A‐ ‐ 772 1,748 ‐
343 n/a NISHI‐NIPPON CITY BANK JP 164 3,539 5% A‐ ‐ 2,965 3,861 ‐
344 n/a RHB MY 162 4,031 4% A‐ ‐ 1,066 1,768 ‐
345 n/a JACCS JP 160 602 27% BBB ‐ 1,019 1,460 ‐
346 n/a BANK OF HAWAII US 159 2,237 7% A‐ ‐ 2,643 2,686 ‐
347 n/a BANK OF IKEDA JP 157 1,218 13% A‐ ‐ 1,076 1,296 ‐
348 n/a DOHA BANK QA 154 3,434 4% A‐ ‐ 5,981 3,408 ‐
349 n/a TOKAI TOKYO SECURITIES JP 154 1,580 10% A‐ ‐ 913 1,978 ‐
350 n/a TMB TH 153 1,828 8% B ‐ 1,396 1,206 ‐

8/9/2019 Global 500 Financial Brands 2008
http://slidepdf.com/reader/full/global-500-financial-brands-2008 41/45
--------------------------------------------------------------------------------------------------------------------
2007 - Brand Finance Banking 500 © Brand Finance plc 2008 41
The Brand Finance Banking 500 (351 ‐400)
Rank 2007
Rank 2005
CompaniesCountry
of Domicile
Brand Value (US$M)
2007
Market Cap (US$M)
31/12/07
Brand Value / Market
Cap(%) 2007
Brand Rating (based on BrandBeta
analysis) 2007
Brand Value (US$M)
2005
Market Cap (US$M)
31/12/05
Market Cap (US$M)
31/12/06
Brand Rating (based on BrandBeta
analysis) 2005351 n/a SINOPAC HOLDINGS TW 153 2,655 6% BB ‐ N/A N/A ‐
352 n/a GULF FINANCE HOUSE BH 152 2,592 6% BBB ‐ 1,725 1,534 ‐
353 n/a PACIFIC CAPITAL BANCORP US 152 814 19% A ‐ ‐ 1,661 1,574 ‐
354 n/a BKME KW 152 2,661 6% A ‐ ‐ 1,476 1,710 ‐
355 n/a ARAB BANKING CORPORATION BH 152 2,700 6% BBB ‐ 1,150 1,350 ‐
356 n/a IBC BANK US 152 1,384 11% A ‐ ‐ 1,871 1,945 ‐
357 n/a SHIGA BANK JP 150 1,738 9% A ‐ ‐ 1,798 2,004 ‐
358 n/a BERNER KANTONALBANK CH 147 1,818 8% A‐ ‐ 1,285 1,554 ‐
359 n/a DANAMON ID 146 4,080 4% B ‐ 2,375 3,712 ‐
360 n/a FULTON FINANCIAL CORPORATION US 146 1,812 8% BBB ‐ 2,764 2,900 ‐
361 n/a WHITNEY US 145 1,504 10% BBB ‐ 1,746 2,151 ‐
362 n/a GREEK POSTAL SAVINGS BANK GR 145 2,401 6% A ‐ ‐ N/A 3,318 ‐
363 n/a FIRST REPUBLIC BANK US 144 995 15% A ‐ ‐ 976 1,210 ‐364 n/a THE SOUTH FINANCIAL GROUP US 144 984 15% A ‐ ‐ 2,058 2,003 ‐
365 n/a CENTRAL FINANCE JP 143 516 28% A ‐ ‐ 423 899 ‐
366 n/a CREDITO BERGAMASCO IT 143 2,482 6% A ‐ ‐ 1,857 2,467 ‐
367 n/a MCB PK 142 3,800 4% A ‐ ‐ 1,197 2,208 ‐
368 n/a TRUSTMARK US 142 1,283 11% BBB ‐ 1,532 1,919 ‐
369 n/a INVESTCORP BH 141 2,103 7% BB ‐ 1,494 1,762 ‐
370 n/a DAH SING BANK HK 141 2,530 6% A ‐ ‐ 1,739 2,265 ‐
371 n/a VTB NORTH‐WEST RU 141 2,163 7% A ‐ ‐ 1,237 2,331 ‐
372 n/a BOSTON PRIVATE US 140 848 17% A ‐ ‐ 1,059 1,032 ‐
373 n/a IKB DE 140 3,511 4% BBB ‐ 2,369 3,257 ‐
374 n/a KREDYT BANK PL 139 2,419 6% A ‐ ‐ 1,179 1,876 ‐
375 n/a AXIS BANK IN 138 3,175 4% BB ‐ N/A 2,226 ‐
376 n/a BHW DE 138 3,732 4% A ‐ ‐ 3,014 3,414 ‐
377 n/a TAIWAN COOPERATIVE BANK TW 138 3,460 4% BBB ‐ 1,551 3,341 ‐
378 n/a BANCO DI SARDEGNA IT 136 1,178 12% A ‐ ‐ 1,001 1,231 ‐
379 n/a 16BANK JP 135 2,074 6% BBB ‐ 1,977 2,477 ‐
380 n/a HYUNDAI FUND KR 133 1,838 7% A ‐ ‐ 908 1,855 ‐
381 n/a EAST WEST BANK US 133 1,341 10% A ‐ ‐ 2,062 2,176 ‐
382 n /a FIRSTMERIT BANK US 132 1,512 9% BB ‐ 2,133 1,934 ‐
383 n/a NEUE AARGAUER BANK CH 132 1,992 7% A ‐ ‐ N/A 1,767 ‐
384 n/a CHB TW 131 2,629 5% A ‐ ‐ 2,403 3,357 ‐
385 n/a BANCA ITALEASE IT 131 1,794 7% A‐ ‐ 1,949 4,865 ‐
386 n/a CITIZENS REPUBLIC BANCORP US 131 959 14% BBB ‐ 1,192 2,005 ‐
387 n/a SANYO SHINPAN FINANCE JP 129 966 13% BBB ‐ 2,568 2,356 ‐
388 n/a UCB US 128 1,309 10% A ‐ 1,681 1,746 ‐
389 n/a THE SENSHU BANK JP 128 1,164 11% A ‐ ‐ 1,181 1,695 ‐
390 n/a STERLING SAVINGS BANK US 124 703 18% A ‐ ‐ 871 1,421 ‐
391 n/a IDBI BANK IN 123 1,292 10% BBB ‐ 1,360 1,270 ‐
392 n/a SPAR NORD DK 122 1,204 10% A ‐ ‐ 841 1,348 ‐
393 n/a KNIGHT US 120 1,322 9% A ‐ ‐ 1,018 1,987 ‐
394 n /a LAURENTIAN BANK CA 120 1,095 11% BB ‐ 605 612 ‐
395 n/a FIRST FINANCIAL TW 120 4,690 3% BB ‐ N/A 3,599 ‐
396 n/a BANCO DESIO IT 119 1,277 9% A ‐ ‐ 963 1,456 ‐
397 n/a UMB US 117 1,604 7% BBB ‐ 1,373 1,543 ‐
398 n/a OLB DE 117 1,694 7% A ‐ ‐ 1,410 1,549 ‐
399 n/a SAN ‐IN GODO BANK JP 116 1,309 9% A ‐ ‐ 1,736 1,804 ‐
400 n/a WINTRUST FINANCIAL US 113 735 15% A ‐ ‐ 1,314 1,222 ‐

8/9/2019 Global 500 Financial Brands 2008
http://slidepdf.com/reader/full/global-500-financial-brands-2008 42/45
--------------------------------------------------------------------------------------------------------------------
2007 - Brand Finance Banking 500 © Brand Finance plc 2008 42
The Brand Finance Banking 500 (401 ‐450)
Rank 2007
Rank 2005
CompaniesCountry
of Domicile
Brand Value (US$M)
2007
Market Cap (US$M)
31/12/07
Brand Value / Market
Cap(%) 2007
Brand Rating (based on BrandBeta
analysis) 2007
Brand Value (US$M)
2005
Market Cap (US$M)
31/12/05
Market Cap (US$M)
31/12/06
Brand Rating (based on BrandBeta
analysis) 2005401 n/a DAISHIN SECURITIES KR 112 1,170 10% A‐ ‐ 658 993 ‐
402 n/a OGAKI KYORITSU BANK JP 111 1,320 8% A ‐ ‐ 1,765 1,629 ‐
403 n/a APLUS JP 110 356 31% A ‐ ‐ 630 1,008 ‐
404 n/a CHINA DEVELOPMENT FINANCIAL TW 110 4,102 3% BB ‐ N/A N/A ‐
405 n/a VALLEY NATIONAL BANK US 110 2,193 5% A ‐ ‐ 2,683 3,058 ‐
406 n/a TONG YANG INVESTMENT BANK KR 108 1,116 10% A ‐ ‐ 297 993 ‐
407 n/a DAH SING BANK HK 108 2,530 4% A ‐ ‐ 1,706 2,265 ‐
408 n/a COMPUCREDIT US 107 416 26% A ‐ ‐ 1,883 1,967 ‐
409 n/a EON BANK GROUP MY 107 1,351 8% A ‐ ‐ 926 1,297 ‐
410 n/a 1FIRST BANK PR 105 762 14% A ‐ ‐ 1,004 793 ‐
411 n/a FBR US 105 501 21% A ‐ ‐ 1,711 1,398 ‐
412 n/a SUSQUEHANNA US 104 1,451 7% BBB ‐ 1,109 1,400 ‐
413 n/a UNITED COMMUNITY BANK US 104 712 15% A ‐ ‐ 1,067 1,386 ‐
414 n/a CATHAY BANK US 103 1 ,173 9% A ‐ ‐ 1,804 1,792 ‐
415 n/a CORPBANCA CL 103 1,476 7% BBB ‐ 1,236 1,200 ‐
416 n/a CIFH HK 99 3,488 3% BBB ‐ 1,186 4,507 ‐
417 n/a SPAREBANK 1 MIDT‐NOGE NO 98 744 13% A ‐ ‐ 585 663 ‐
418 n/a BBK BH 96 1,196 8% A ‐ ‐ 1,071 1,189 ‐
419 n/a BCGE CH 96 913 11% BBB ‐ 520 708 ‐
420 n/a UNITED BANK US 94 1,176 8% A ‐ ‐ 1,480 1,587 ‐
421 n/a BANCO GUIPUZCOANO ES 94 2,304 4% A ‐ ‐ 1,500 2,259 ‐
422 n/a FIRST COMMUNITY BANCORP US 93 1,012 9% A ‐ ‐ 998 1,549 ‐
423 n/a FIRST MIDWEST BANK US 93 1,304 7% BBB ‐ 1,591 1,935 ‐
424 n/a SPAREBANK 1 NO 93 874 11% A ‐ ‐ 769 684 ‐
425 n/a ROSKILDE BANK DK 92 679 14% A‐ ‐ 849 1,326 ‐
426 n/a BANK QUEENSLAND AU 91 1,714 5% BBB ‐ 887 1,241 ‐
427 n/a BANCA ETRURIA IT 90 721 12% A‐ ‐ 899 1,103 ‐
428 n/a DVB BANK DE 90 1,632 5% A‐ ‐ 839 1,089 ‐
429 n/a AMBANK GROUP MY 88 2,317 4% A ‐ ‐ N/A 1,637 ‐
430 n/a E.SUN FINANCIAL TW 87 1,689 5% A‐ ‐ N/A N/A ‐
431 n/a PROVIDENT BANK US 85 536 16% A ‐ ‐ 1,112 1,155 ‐
432 n/a MB FINANCIAL US 85 1,002 9% A‐ ‐ 1,007 1,379 ‐
433 n/a GLACIER BANK US 85 856 10% A ‐ ‐ 967 1,278 ‐
434 n/a SVB US 84 1,557 5% BBB ‐ 1,644 1,604 ‐
435 n/a GREENHILL US 84 1,554 5% A ‐ ‐ 1,642 2,124 ‐
436 n/a THE HYAKUJUSHI BANK JP 83 1,879 4% A ‐ ‐ 2,008 2,191 ‐
437 n/a OBERBANK AT 83 2,161 4% A ‐ ‐ 841 1,242 ‐
438 n/a BANK COOP CH 82 1,215 7% A ‐ ‐ 920 1,118 ‐439 n/a ALABAMA NATIONAL BANCORPORATION US 80 1,562 5% A ‐ ‐ 1,109 1,413 ‐
440 n/a PARK NATIONAL CORPORATION US 80 815 10% A ‐ ‐ 1,446 1,378 ‐
441 n/a COLLEGIATE FUNDING SERVICES US 80 605 13% A‐ ‐ 632 884 ‐
442 n/a PARAGON UK 80 744 11% A ‐ ‐ 1,132 1,532 ‐
443 n/a BERLIN HYP DE 79 3,390 2% A ‐ ‐ 2,704 3,109 ‐
444 n/a SOUTHWEST SECURITIES US 79 594 13% A‐ ‐ 287 428 ‐
445 n/a ADELAIDE BNK AU 76 723 11% BBB ‐ 911 1,033 ‐
446 n/a NORTHERN ROCK UK 76 720 11% B ‐ 6,827 9,710 ‐
447 n/a ZUGER KANTONALBANK CH 75 882 8% A‐ ‐ 761 879 ‐
448 n/a IMPERIAL BANK ZA 74 4,354 2% A‐ ‐ N/A 3,998 ‐
449 n/a FIRST CHARTER US 72 953 8% A‐ ‐ 727 859 ‐
450 n/a AMAGERBANKEN DK 71 483 15% A ‐ ‐ 472 727 ‐
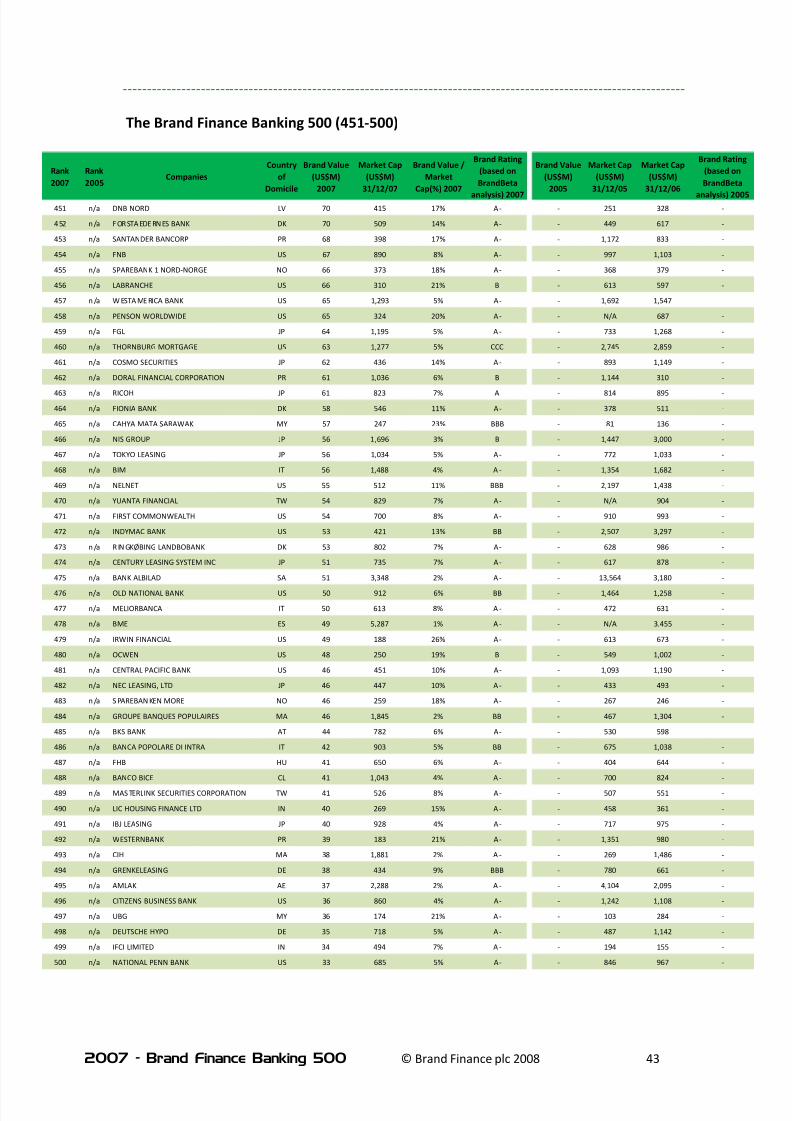
8/9/2019 Global 500 Financial Brands 2008
http://slidepdf.com/reader/full/global-500-financial-brands-2008 43/45
--------------------------------------------------------------------------------------------------------------------
2007 - Brand Finance Banking 500 © Brand Finance plc 2008 43
The Brand Finance Banking 500 (451 ‐500)
Rank 2007
Rank 2005
CompaniesCountry
of Domicile
Brand Value (US$M)
2007
Market Cap (US$M)
31/12/07
Brand Value / Market
Cap(%) 2007
Brand Rating (based on BrandBeta
analysis) 2007
Brand Value (US$M)
2005
Market Cap (US$M)
31/12/05
Market Cap (US$M)
31/12/06
Brand Rating (based on BrandBeta
analysis) 2005451 n/a DNB NORD LV 70 415 17% A‐ ‐ 251 328 ‐
452 n /a FORSTAEDERNES BANK DK 70 509 14% A‐ ‐ 449 617 ‐
453 n/a SANTANDER BANCORP PR 68 398 17% A‐ ‐ 1,172 833 ‐
454 n/a FNB US 67 890 8% A‐ ‐ 997 1,103 ‐
455 n/a SPAREBANK 1 NORD‐NORGE NO 66 373 18% A‐ ‐ 368 379 ‐
456 n/a LABRANCHE US 66 310 21% B ‐ 613 597 ‐
457 n /a W ESTA ME RICA BANK US 65 1,293 5% A‐ ‐ 1,692 1,547 ‐
458 n/a PENSON WORLDWIDE US 65 324 20% A‐ ‐ N/A 687 ‐
459 n/a FGL JP 64 1,195 5% A ‐ ‐ 733 1,268 ‐
460 n/a THORNBURG MORTGAGE US 63 1,277 5% CCC ‐ 2,745 2,859 ‐
461 n/a COSMO SECURITIES JP 62 436 14% A‐ ‐ 893 1,149 ‐
462 n/a DORAL FINANCIAL CORPORATION PR 61 1,036 6% B ‐ 1,144 310 ‐
463 n/a RICOH JP 61 823 7% A ‐ 814 895 ‐464 n/a FIONIA BANK DK 58 546 11% A‐ ‐ 378 511 ‐
465 n/a CAHYA MATA SARAWAK MY 57 247 23% BBB ‐ 81 136 ‐
466 n/a NIS GROUP JP 56 1,696 3% B ‐ 1,447 3,000 ‐
467 n/a TOKYO LEASING JP 56 1,034 5% A‐ ‐ 772 1,033 ‐
468 n/a BIM IT 56 1,488 4% A ‐ ‐ 1,354 1,682 ‐
469 n/a NELNET US 55 512 11% BBB ‐ 2,197 1,438 ‐
470 n/a YUANTA FINANCIAL TW 54 829 7% A‐ ‐ N/A 904 ‐
471 n/a FIRST COMMONWEALTH US 54 700 8% A‐ ‐ 910 993 ‐
472 n/a INDYMAC BANK US 53 421 13% BB ‐ 2,507 3,297 ‐
473 n /a R IN GKØBING LANDBOBANK DK 53 802 7% A‐ ‐ 628 986 ‐
474 n/a CENTURY LEASING SYSTEM INC JP 51 735 7% A‐ ‐ 617 878 ‐
475 n/a BANK ALBILAD SA 51 3,348 2% A‐ ‐ 13,564 3,180 ‐
476 n/a OLD NATIONAL BANK US 50 912 6% BB ‐ 1,464 1,258 ‐
477 n/a MELIORBANCA IT 50 613 8% A‐ ‐ 472 631 ‐
478 n/a BME ES 49 5,287 1% A ‐ ‐ N/A 3,455 ‐
479 n/a IRWIN FINANCIAL US 49 188 26% A‐ ‐ 613 673 ‐
480 n/a OCWEN US 48 250 19% B ‐ 549 1,002 ‐
481 n/a CENTRAL PACIFIC BANK US 46 451 10% A‐ ‐ 1,093 1,190 ‐
482 n/a NEC LEASING, LTD JP 46 447 10% A‐ ‐ 433 493 ‐
483 n /a S PAREBAN KEN MORE NO 46 259 18% A‐ ‐ 267 246 ‐
484 n/a GROUPE BANQUES POPULAIRES MA 46 1,845 2% BB ‐ 467 1,304 ‐
485 n/a BKS BANK AT 44 782 6% A‐ ‐ 530 598 ‐
486 n/a BANCA POPOLARE DI INTRA IT 42 903 5% BB ‐ 675 1,038 ‐
487 n/a FHB HU 41 650 6% A‐ ‐ 404 644 ‐
488 n/a BANCO BICE CL 41 1,043 4% A‐ ‐ 700 824 ‐
489 n /a MAS TERLINK SECURITIES CORPORATION TW 41 526 8% A‐ ‐ 507 551 ‐
490 n/a LIC HOUSING FINANCE LTD IN 40 269 15% A‐ ‐ 458 361 ‐
491 n/a IBJ LEASING JP 40 928 4% A‐ ‐ 717 975 ‐
492 n/a WESTERNBANK PR 39 183 21% A‐ ‐ 1,351 980 ‐
493 n/a CIH MA 38 1,881 2% A ‐ ‐ 269 1,486 ‐
494 n/a GRENKELEASING DE 38 434 9% BBB ‐ 780 661 ‐
495 n/a AMLAK AE 37 2,288 2% A‐ ‐ 4,104 2,095 ‐
496 n/a CITIZENS BUSINESS BANK US 36 860 4% A‐ ‐ 1,242 1,108 ‐
497 n/a UBG MY 36 174 21% A‐ ‐ 103 284 ‐
498 n/a DEUTSCHE HYPO DE 35 718 5% A‐ ‐ 487 1,142 ‐
499 n/a IFCI LIMITED IN 34 494 7% A‐ ‐ 194 155 ‐
500 n/a NATIONAL PENN BANK US 33 685 5% A‐ ‐ 846 967 ‐

8/9/2019 Global 500 Financial Brands 2008
http://slidepdf.com/reader/full/global-500-financial-brands-2008 44/45
--------------------------------------------------------------------------------------------------------------------
2007 - Brand Finance Banking 500 © Brand Finance plc 2008 44
The Global 500 Financial Brands Index (451 ‐500)
For further enquiries relating to this report, please contact:
For further information on Brand Finance’s services and valuation experience, please contact your local representative as listed below:
Name of contact Email address
Australia Tim Heberden [email protected]
Brazil Gilson Nunes [email protected]
Canada Andrew Zimakas [email protected]
Croatia Borut Zemljic [email protected]
France Florence Hussenot [email protected]
Germany Ferdy de Smeth [email protected]
Holland Marc Cloosterman [email protected]
Hong Kong Rupert Purser [email protected]
India Unni Krishnan [email protected]
Portugal Victor Mirabet [email protected]
Russia Alexander Eremenko [email protected]
Singapore Lucy Gwee [email protected]
South Africa Ollie Schmitz [email protected]
Spain Victor Mirabet [email protected]
Sri Lanka Ruchi Gunewardene [email protected]
Switzerland Jeff Turner [email protected]
Turkey Muhterem Ilguner [email protected]
UK David Haigh [email protected]
USA Hampton Bridwell [email protected]
David Haigh, CEO [email protected]
Mike Rocha, Managing Director [email protected]
Brand Finance is the leading independent intangible asset valuation and brand strategy firm, helping companies to manage their brands more intelligently for improved business results.

8/9/2019 Global 500 Financial Brands 2008
http://slidepdf.com/reader/full/global-500-financial-brands-2008 45/45
--------------------------------------------------------------------------------------------------------------------
For all other countries, please [email protected]
www.brandfinance.com