glass fiber lw bw report 041916 - department of … fiber... · bandwidth study on energy use and...
TRANSCRIPT

Bandwidth Study on Energy Use and Potential Energy Saving Opportunities in the Manufacturing of Lightweight Materials: Glass Fiber Reinforced Polymer Composites
March 15, 2016
Prepared for: National Renewable Energy Laboratory and U.S. Department of Energy, Advanced Manufacturing Office
Prepared by: Energetics Incorporated
DRAFT REPORT
DRAFT

(This page intentionally left blank)
DRAFT
Preface ii
Preface Reducing energy consumption through investment in advanced technologies and practices can enhance American manufacturing competitiveness. Energy bandwidth studies of U.S. manufacturing sectors serve as general data references to help understand the range (or bandwidth) of potential energy savings opportunities. 1 The U.S. Department of Energy (DOE)’s Advanced Manufacturing Office (AMO) has commissioned a series of bandwidth studies to analyze the manufacturing of products that can be used for lightweighting applications, and provide hypothetical, technology-based estimates of potential energy savings opportunities in the manufacturing process. The consistent methodology used in the bandwidth studies provides a framework to evaluate and compare energy savings potentials within and across manufacturing sectors at the macro-scale.
AMO is releasing this energy bandwidth study in draft form in order to solicit input from the public as part of the peer review process. This study is being released as part of a series of six studies focusing on energy use in the manufacture of the following lightweight structural materials: carbon fiber reinforced polymer composites, glass fiber reinforced polymer composites, advanced high-strength steel, aluminum, magnesium, and titanium. Reviewer feedback will be used to update the bandwidth reports with the best available data and assumptions prior to final publication, and to generate input to support further analysis. In the next phase of work, data will be integrated and compared across all six materials, including a comparison of manufacturing energy intensity on a material performance (e.g., effective weight) basis for key applications.
1 The concept of an energy bandwidth, and its use as an analysis tool for identifying potential energy saving opportunities,
originated in AMO in 2002 (when it was called the Office of Industrial Technologies). Most recently, revised and consistent versions of bandwidth studies for the Chemicals, Petroleum Refining, Iron and Steel, and Pulp and Paper sectors were published in 2015.
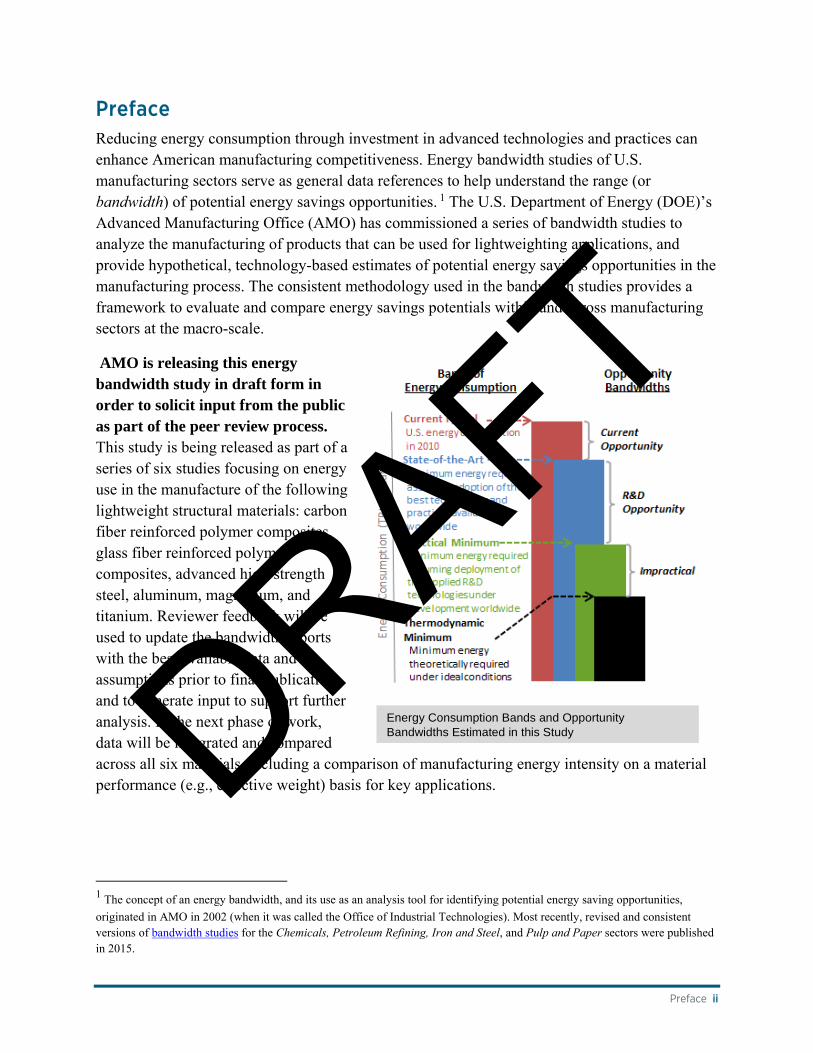
Energy Consumption Bands and Opportunity Bandwidths Estimated in this Study DRAFT
Bandwidth Study on Energy Use and Potential Energy Saving Opportunities in the Manufacturing of Lightweight Materials: Glass Fiber Reinforced Polymer Composites
iii Preface
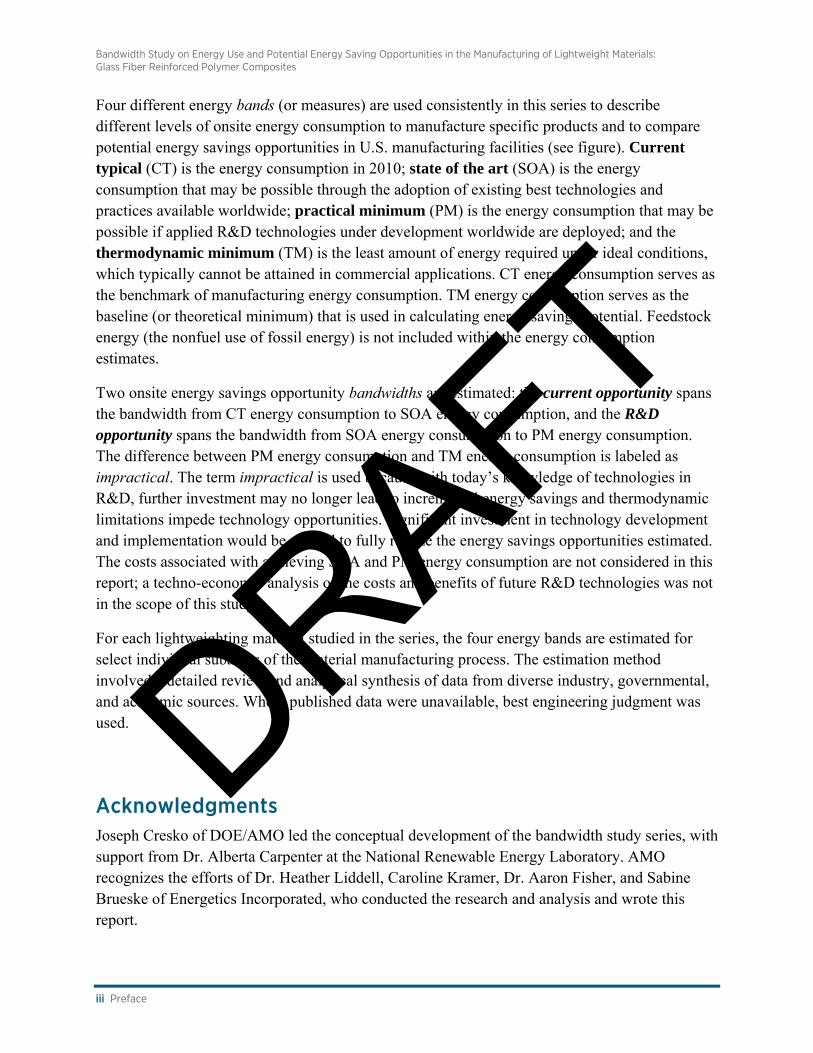
Four different energy bands (or measures) are used consistently in this series to describe different levels of onsite energy consumption to manufacture specific products and to compare potential energy savings opportunities in U.S. manufacturing facilities (see figure). Current typical (CT) is the energy consumption in 2010; state of the art (SOA) is the energy consumption that may be possible through the adoption of existing best technologies and practices available worldwide; practical minimum (PM) is the energy consumption that may be possible if applied R&D technologies under development worldwide are deployed; and the thermodynamic minimum (TM) is the least amount of energy required under ideal conditions, which typically cannot be attained in commercial applications. CT energy consumption serves as the benchmark of manufacturing energy consumption. TM energy consumption serves as the baseline (or theoretical minimum) that is used in calculating energy savings potential. Feedstock energy (the nonfuel use of fossil energy) is not included within the energy consumption estimates.
Two onsite energy savings opportunity bandwidths are estimated: the current opportunity spans the bandwidth from CT energy consumption to SOA energy consumption, and the R&D opportunity spans the bandwidth from SOA energy consumption to PM energy consumption. The difference between PM energy consumption and TM energy consumption is labeled as impractical. The term impractical is used because with today’s knowledge of technologies in R&D, further investment may no longer lead to incremental energy savings and thermodynamic limitations impede technology opportunities. Significant investment in technology development and implementation would be needed to fully realize the energy savings opportunities estimated. The costs associated with achieving SOA and PM energy consumption are not considered in this report; a techno-economic analysis of the costs and benefits of future R&D technologies was not in the scope of this study.
For each lightweighting material studied in the series, the four energy bands are estimated for select individual subareas of the material manufacturing process. The estimation method involved a detailed review and analytical synthesis of data from diverse industry, governmental, and academic sources. Where published data were unavailable, best engineering judgment was used.
Acknowledgments Joseph Cresko of DOE/AMO led the conceptual development of the bandwidth study series, with support from Dr. Alberta Carpenter at the National Renewable Energy Laboratory. AMO recognizes the efforts of Dr. Heather Liddell, Caroline Kramer, Dr. Aaron Fisher, and Sabine Brueske of Energetics Incorporated, who conducted the research and analysis and wrote this report.
DRAFT

Executive Summary iv
Executive Summary With their high strength-to-weight ratios, glass fiber reinforced polymer (GFRP) composites have strong technical potential for lightweighting in structural applications. Also known as fiberglass, GFRP composites are used in applications such as pipes and tanks, boat hulls, wind turbine blades, and automobile bodies. However, the use of GFRP composites in many commercial applications continues to be limited by manufacturing challenges such as high costs, variable performance, poor repairability, and low process throughput. One of the most significant challenges for composite materials is their high energy intensity compared to other structural materials such as steel and aluminum. In this report, the manufacturing energy consumption associated with the production of GFRP composites is investigated in detail. This study is limited to four energy-critical structural application areas (automotive, wind energy, aerospace, and pressure vessels), which together comprise about 47% of the total glass fiber market.
This study explores the energy intensity and energy consumption associated with GFRP manufacturing, breaking down energy use by sub-process. Energy savings opportunities are identified and quantified for each of the six manufacturing sub-processes considered:
Batching: the preparation of the glass batch, including measuring, grinding and mixing the constituent materials (silica and additives);
Melting: the process of melting the glass mixture and refining the molten glass to remove impurities and air bubbles;
Fiberization: the process of extruding the molten glass through a bushing and attenuating the extruded material into long, thin filaments;
Finishing: the application of surface treatments and coatings (called “sizing”) to protect the fibers and promote bonding with the plastic matrix, and the spooling of the fibers;
Polymer Production: the manufacture of the polymer resin that will serve as a matrix material in the final composite product; and
Composite Production: the process of integrating the fibers into the polymer matrix and producing a finished composite product.
The purpose of this data analysis is to provide macro-scale estimates of energy savings opportunities for each GFRP manufacturing subarea. This is a step toward understanding the processes that could most benefit from technology and efficiency improvements to realize energy savings.
Study Organization and Approach: After providing an overview of the methodology and boundaries in Chapter 1, the 2010 production volumes for GFRP composites are estimated in Chapter 2. Current typical (CT) energy intensity and consumption are estimated for six sub-processes in Chapter 3. The state of the art (SOA) energy intensity and consumption for these processes (assuming the adoption of best technologies and practices available worldwide) is estimated in Chapter 4, and the practical minimum (PM) energy intensity and consumption for
DRAFT

Bandwidth Study on Energy Use and Potential Energy Saving Opportunities in the Manufacturing of Lightweight Materials: Glass Fiber Reinforced Polymer Composites
v Executive Summary
these processes (assuming the deployment of the applied research and development (R&D) technologies available worldwide) is assessed in Chapter 5. The thermodynamic minimum (TM) energy (that is, the minimum amount of energy theoretically required for these processes assuming ideal conditions) is estimated in Chapter 6; in some cases, this is less than zero. The difference between the energy consumption bands (CT, SOA, PM, TM) are the estimated energy savings opportunity bandwidths. These opportunity bandwidths are presented in Chapter 7.
Study Results: Two energy savings opportunity bandwidths—current opportunity and R&D opportunity—are shown in Table ES-1 and Figure ES-1.2 The current opportunity is the difference between the 2010 current typical (CT) energy consumption and the state of the art (SOA) energy consumption; the R&D opportunity is the difference between the SOA energy consumption and the practical minimum (PM) energy consumption. Potential energy savings opportunities are presented as a total and broken down by manufacturing sub-process. Note that the energy savings opportunities presented reflect the estimated production of GFRP composites for selected application areas in baseline year 2010. Lightweight composite materials have seen enormous growth in the past several years, especially in energy-critical applications such as automotive and wind energy. Therefore, it is important to note that the total energy opportunities would scale with increasing production.
Table ES-1. Potential Energy Savings Opportunities for GRFP Composite Manufacturing in the U.S. (Considering Production for Selected Lightweighting Application Areas only)*
Opportunity Bandwidths
Estimated Energy Savings Opportunity for GFRP Composite Manufacturing
(per year)
Current Opportunity – energy savings if the best technologies and practices available are used to upgrade production3,4
14 TBtu
(a 33% savings**)
R&D Opportunity – additional energy savings if applied R&D technologies under development worldwide are successfully deployed5,6
25 TBtu
(a further 56% savings**)
* Calculated using the production values for lightweight structural application areas considered in this study only (see Section 1.4), and not all glass fiber composites. ** Energy savings are measured from the current typical energy consumption. Note that the thermodynamic minimum (TM) is used as the baseline (rather than zero) for energy savings percent calculations.
2 The energy estimates presented in this study are for macro-scale consideration; energy intensities and energy consumption values do not represent energy use in any specific facility or any particular region in the United States. The costs associated with achieving energy savings are not considered in this study. All estimates are for onsite energy use (i.e., energy consumed within the facility boundary). Energy used as feedstocks (non-fuel inputs) to production is excluded. 3 Current opportunity savings calculation: 43 TBtu – 29 TBtu = 14 TBtu. 4 Current opportunity savings percentage = [(CT – SOA)/(CT – TM)]x100. 5 R&D opportunity savings calculation: 29 TBtu – 4 TBtu = 25 TBtu. 6 R&D opportunity savings percentage = [(SOA – PM)/(CT – TM)]x100
DRAFT

Executive Summary vi
The top three current energy savings opportunities for GFRP composites are as follows:
Composite Production, representing 54% of the Current Opportunity (7.61 TBtu/yr);
Resin Production, representing 26% of the Current Opportunity (3.73 TBtu/yr);
Glass Melting, representing 7% of the Current Opportunity (1.01 TBtu/yr).
The top three R&D energy savings opportunities are as follows:
Resin Production, representing 74% of the R&D Opportunity (18.10 TBtu/yr).
Composite Production, representing 22% of the R&D Opportunity (5.44 TBtu/yr);
Glass Melting, representing 3% of the R&D Opportunity (0.62 TBtu/yr).
Figure ES-1. Current and R&D Energy Savings Opportunities for GFRP Composite Manufacturing by Process, Based on 2010 Glass Fiber Production for Structural Applications DRAFT
Bandwidth Study on Energy Use and Potential Energy Saving Opportunities in the Manufacturing of Lightweight Materials: Glass Fiber Reinforced Polymer Composites
vii Executive Summary
For both current and R&D energy savings, a large majority of the energy opportunity arises from composite production and resin production. This result reflects the fact that while glass fiber manufacturing techniques are fairly mature, composite production techniques are still undergoing rapid development. Fundamental changes in processes and materials for composite production are being actively pursued by commercial manufacturers and R&D laboratories to drastically reduce processing energy in these steps. For example, a major opportunity to reduce composite production energy is to utilize out-of-autoclave consolidation techniques. A major opportunity to reduce resin production energy in composites is to switch out conventional thermosetting resins such as epoxy with thermoplastic resins such as polypropylene. Not only do thermoplastic resins have low embodied energies compared to thermosetting resins, they also increase recyclability of the composite product and eliminate the need for a curing step. These opportunities are further explored in this report.
DRAFT

List of Acronyms and Abbreviations viii
List of Acronyms and Abbreviations ACC American Chemistry Council
AMO Advanced Manufacturing Office
Btu British thermal unit
GF Glass fiber
GFRP Glass fiber reinforced polymer
CT Current typical energy consumption or energy intensity
DOE U.S. Department of Energy
EERE DOE Office of Energy Efficiency and Renewable Energy
EIA U.S. Energy Information Administration
EPA U.S. Environmental Protection Agency
HDPE High-density polyethylene
IEA International Energy Agency
K Kelvin
LBNL Lawrence Berkeley National Laboratory
NREL National Renewable Energy Laboratory
PM Practical minimum energy consumption or energy intensity
PP Polypropylene
PS Polystyrene
PU Polyurethane
PVC Polyvinyl chloride
R&D Research and development
SOA State of the art energy consumption or energy intensity
TBtu Trillion British thermal units
TM Thermodynamic minimum energy consumption or energy intensity
TP Thermoplastic (resin)
TS Thermoset (resin)
VSD Variable speed drive (motor)
DRAFT

Bandwidth Study on Energy Use and Potential Energy Saving Opportunities in the Manufacturing of Lightweight Materials: Glass Fiber Reinforced Polymer Composites
ix Table of Contents
Table of Contents Preface ............................................................................................................................................. ii Acknowledgments.......................................................................................................................... iii Executive Summary ....................................................................................................................... iv List of Acronyms and Abbreviations ........................................................................................... viii Table of Contents ........................................................................................................................... ix List of Tables .................................................................................................................................. x List of Figures ................................................................................................................................ xi 1. Introduction .......................................................................................................................... 1
1.1 Overview .......................................................................................................................... 1 1.2 Definitions of Energy Consumption Bands and Opportunity Bandwidths ...................... 1 1.3 Bandwidth Analysis Method ............................................................................................ 2 1.4 Boundaries of the Study ................................................................................................... 4
2. Glass Fiber Reinforced Polymer Composite Production ..................................................... 6 2.1 Manufacturing Overview ................................................................................................. 6 2.2 Production Values ............................................................................................................ 8
3. Current Typical Energy Intensity and Energy Consumption ............................................. 10 3.1 Current Typical Energy Intensity ................................................................................... 10 3.2 Current Typical Energy Consumption ........................................................................... 12
4. State of the Art Energy Intensity and Energy Consumption.............................................. 14 4.1 State of the Art Energy Intensity .................................................................................... 14 4.2 State of the Art Energy Consumption ............................................................................ 16
5. Practical Minimum Energy Intensity and Energy Consumption ....................................... 19 5.1 Practical Minimum Energy Intensity ............................................................................. 19 5.2 Practical Minimum Energy Consumption ...................................................................... 22
6. Thermodynamic Minimum Energy Intensity and Energy Consumption ........................... 25 6.1 Thermodynamic Minimum Energy Intensity ................................................................. 25 6.2 Thermodynamic Minimum Energy Consumption ......................................................... 27
7. Current and R&D Opportunity Analysis/Bandwidth Summary ........................................ 29 8. References .......................................................................................................................... 32 Appendix A1. Master GFRP Composite Summary Tables .......................................................... 35 Appendix A2. Fiber Ratios in Structural Lightweighting Applications ....................................... 37 Appendix A3. Energy Mix Assumptions ...................................................................................... 38 Appendix A4. Practical Minimum (R&D) Technologies Considered .......................................... 40
DRAFT

Table of Contents x
List of Tables Table ES-1. Potential Energy Savings Opportunities for GRFP Composite Manufacturing in the U.S. (Considering Production for Selected Lightweighting Application Areas only)* ................. v Table 2-1. Glass Fiber Reinforced Composites Manufacturing Process Subareas and Sub-Processes Considered in the Bandwidth Analysis .......................................................................... 8 Table 2-2. Global and U.S. Production of Glass Fiber Reinforced Polymer Composites in 2010 (Glass Rovings Only) ...................................................................................................................... 9 Table 3-1. Current Typical Energy Intensity for Production of Glass Fibers ............................... 10 Table 3-2. Current Typical Energy Intensity for Production of Polymer Matrix Resins ............. 11 Table 3-3. Current Typical Energy Intensity for Composite Production ...................................... 12 Table 3-4. Calculated Current Typical Energy Consumption for Glass Fiber Reinforced Polymer Composite Manufacturing – Application Areas Considered ........................................................ 13 Table 4-1. State of the Art Energy Intensity for Production of Glass Fibers ................................ 14 Table 4-2. State of the Art Energy Intensity for Production of Polymer Matrix Resins .............. 15 Table 4-3. State of the Art Energy Intensity for Composite Production ...................................... 16 Table 4-4. Calculated State of the Art Energy Consumption for Glass Fiber Reinforced Polymer Composite Manufacturing – Application Areas Considered ........................................................ 17 Table 4-5. Calculated State of the Art Energy Savings for Glass Fiber Reinforced Polymer Composite Manufacturing ............................................................................................................ 18 Table 5-1. Practical Minimum Energy Intensity for Production of Glass Fibers ......................... 20 Table 5-2. Practical Minimum Energy Intensity for Production of Polymer Matrix Resins ........ 21 Table 5-3. Practical Minimum Energy Intensity for Composite Production ................................ 22 Table 5-4. Calculated Practical Minimum Energy Consumption for Glass Fiber Reinforced Polymer Composite Manufacturing – Application Areas Considered ......................................... 23 Table 5-5. Calculated Practical Minimum Energy Savings for Glass Fiber Composite Manufacturing ............................................................................................................................... 24 Table 6-1. Thermodynamic Minimum Energy Intensity for Production of Glass Fibers ............. 26 Table 6-2. Thermodynamic Minimum Energy Intensity for Production of Polymer Matrix Resins....................................................................................................................................................... 27 Table 6-3. Thermodynamic Minimum Energy Intensity for Composite Production .................... 27 Table 6-4. Calculated Thermodynamic Minimum Energy Consumption for Glass Fiber Reinforced Polymer Composite Manufacturing – Application Areas Considered ....................... 28 Table 7-1. Current and R&D Opportunities for GFRP Manufacturing (Onsite Energy Consumption) ................................................................................................................................ 29 Table 7-2. Manufacturing Process Assumptions for Current Typical, State of the Art, and Practical Minimum Energy Bands ................................................................................................ 29 Table A1-1. Onsite Energy Intensity and Energy Consumption Estimates for GFRP Composite Manufacturing for the Four Bandwidth Measures, Based on 2010 Production of GFRP Composites for Structural Application Areas ............................................................................... 35
DRAFT

Bandwidth Study on Energy Use and Potential Energy Saving Opportunities in the Manufacturing of Lightweight Materials: Glass Fiber Reinforced Polymer Composites
xi Table of Contents
Table A1-2. Primary Energy Intensity and Energy Consumption Estimates for GFRP Composite Manufacturing for the Four Bandwidth Measures, Based on 2010 Production of GFRP Composites for Structural Application Areas ............................................................................... 36 Table A2-1. Fiber / Matrix Polymer Ratios: Automotive Case Studies ....................................... 37 Table A3-1. Energy Mix Assumptions for GFRP Composite Manufacturing Processes ............. 38 Table A4-1. Details of Practical Minimum Technologies Considered ......................................... 40
List of Figures Figure ES-1. Current and R&D Energy Savings Opportunities for GFRP Composite Manufacturing by Process, Based on 2010 Glass Fiber Production for Structural Applications .. vi Figure 1-1. Estimated Makeup of the Glass Fiber Market in 2010. ............................................... 5 Figure 2-1. Process Flow Diagram for Glass Fiber Reinforced Polymer Composite Manufacturing ................................................................................................................................. 7 Figure 7-1. Current and R&D Energy Savings Opportunities for GFRP Composite Manufacturing by Process, Based on 2010 Glass Fiber Production for Structural Applications . 31
DRAFT

DRAFT
Introduction 1
1. Introduction
1.1 Overview
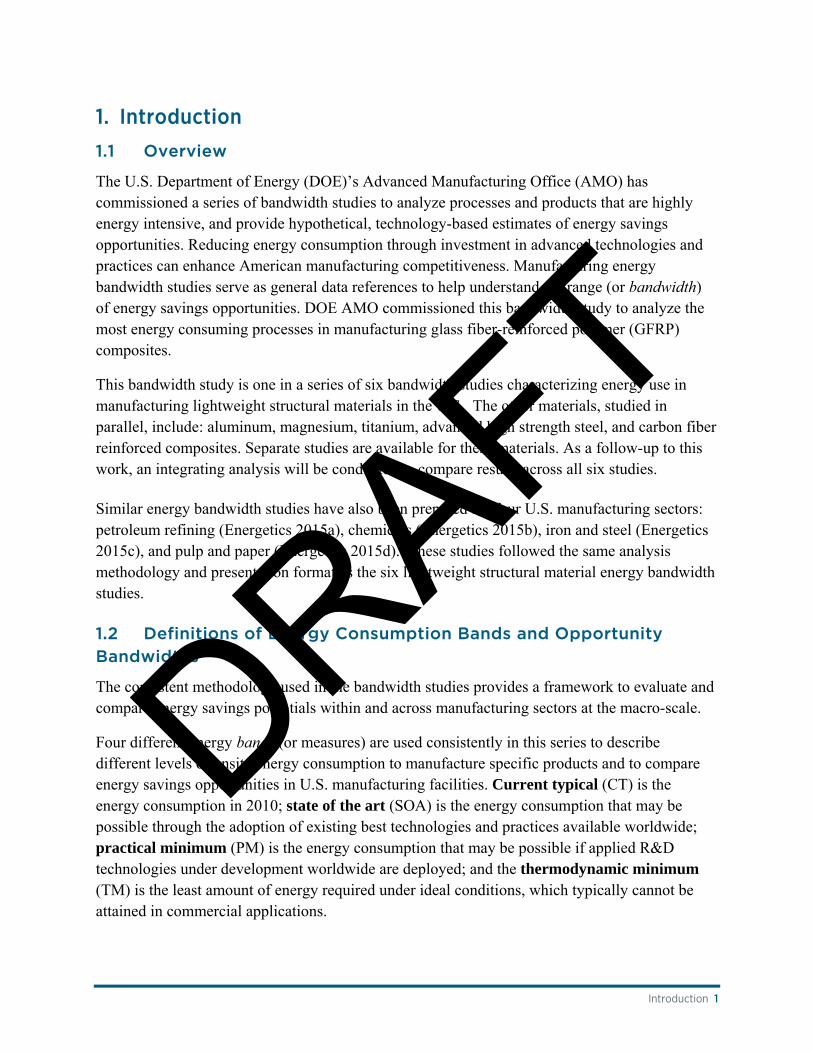
The U.S. Department of Energy (DOE)’s Advanced Manufacturing Office (AMO) has commissioned a series of bandwidth studies to analyze processes and products that are highly energy intensive, and provide hypothetical, technology-based estimates of energy savings opportunities. Reducing energy consumption through investment in advanced technologies and practices can enhance American manufacturing competitiveness. Manufacturing energy bandwidth studies serve as general data references to help understand the range (or bandwidth) of energy savings opportunities. DOE AMO commissioned this bandwidth study to analyze the most energy consuming processes in manufacturing glass fiber-reinforced polymer (GFRP) composites.
This bandwidth study is one in a series of six bandwidth studies characterizing energy use in manufacturing lightweight structural materials in the U.S. The other materials, studied in parallel, include: aluminum, magnesium, titanium, advanced high strength steel, and carbon fiber reinforced composites. Separate studies are available for these materials. As a follow-up to this work, an integrating analysis will be conducted to compare results across all six studies.
Similar energy bandwidth studies have also been prepared for four U.S. manufacturing sectors: petroleum refining (Energetics 2015a), chemicals (Energetics 2015b), iron and steel (Energetics 2015c), and pulp and paper (Energetics 2015d). These studies followed the same analysis methodology and presentation format as the six lightweight structural material energy bandwidth studies.
1.2 Definitions of Energy Consumption Bands and Opportunity Bandwidths
The consistent methodology used in the bandwidth studies provides a framework to evaluate and compare energy savings potentials within and across manufacturing sectors at the macro-scale.
Four different energy bands (or measures) are used consistently in this series to describe different levels of onsite energy consumption to manufacture specific products and to compare energy savings opportunities in U.S. manufacturing facilities. Current typical (CT) is the energy consumption in 2010; state of the art (SOA) is the energy consumption that may be possible through the adoption of existing best technologies and practices available worldwide; practical minimum (PM) is the energy consumption that may be possible if applied R&D technologies under development worldwide are deployed; and the thermodynamic minimum (TM) is the least amount of energy required under ideal conditions, which typically cannot be attained in commercial applications.
DRAFT

Bandwidth Study on Energy Use and Potential Energy Saving Opportunities in the Manufacturing of Lightweight Materials: Glass Fiber Reinforced Polymer Composites
2 Introduction
CT energy consumption serves as the benchmark of manufacturing energy consumption. TM energy consumption serves as the baseline (or theoretical minimum) that is used in calculating energy savings potential. Feedstock energy (the nonfuel use of fossil energy) is not included in the energy consumption estimates.
Two onsite energy savings opportunity bandwidths are estimated: the current opportunity spans the bandwidth from CT energy consumption to SOA energy consumption, and the R&D opportunity spans the bandwidth from SOA energy consumption to PM energy consumption. These bandwidths are estimated for processes and products studied and for all manufacturing within a sector based on extrapolated data. The difference between PM energy consumption and TM energy consumption is labeled as impractical. The term impractical is used because with today’s knowledge of technologies in R&D, further investment may no longer lead to incremental energy savings and thermodynamic limitations impede technology opportunities. Significant investment in technology development and implementation would be needed to fully realize the energy savings opportunities estimated. The costs associated with achieving SOA and PM energy consumption are not considered in this report; a techno-economic analysis of the costs and benefits of future technologies was not within the scope of this study.
1.3 Bandwidth Analysis Method
This section describes the method used in this bandwidth study to estimate the four bands of energy consumption and the two corresponding energy savings opportunity bandwidths. This section can also be used as a guide to understanding the structure and content of this report.
In this study, U.S. energy consumption is labeled as either “onsite energy” or “primary energy” and defined as follows:
Onsite energy (sometimes referred to as site or end use energy) is the energy consumed within the manufacturing plant boundary (i.e., within the plant gates). Non-fuel feedstock energy is not included in the onsite energy consumption values presented in this study.
Energy Consumption Bands and Opportunity Bandwidths Estimated in this Study
DRAFT

Introduction 3
Primary energy (sometimes referred to as source energy) includes energy that is consumed both offsite and onsite during the manufacturing process. Offsite energy consumption includes generation and transmission losses associated with bringing electricity and steam to the plant boundary. Non-fuel feedstock energy is not included in the primary energy values. In some cases, references do not differentiate steam from fuel as an energy source, and without a better estimate it is difficult to determine what portion of steam losses should be accounted for in primary energy. Primary energy is frequently referenced by governmental organizations when comparing energy consumption across sectors.
The four bands of energy consumption described above were quantified for process subareas and for the material total. The bands of energy consumption and the opportunity bandwidths presented herein consider onsite energy consumption; feedstocks7 are excluded. To determine the total annual CT, SOA, PM, and TM energy consumption (TBtu per year), energy intensity values per unit weight (Btu per pound of material manufactured) were estimated and multiplied by the annual production total (pounds of material manufactured per year). The year 2010 was used as a base year since it is the most recent year for which consistent energy consumption and production data were available for all six lightweight materials analyzed in this series of bandwidth studies. Unless otherwise noted, 2010 production data were used.
Chapter 2 presents the U.S. production (million pounds per year) for 2010, including an overview of major application areas. Four structural application areas for GFRP composites are included within the scope of this bandwidth report. The production volumes for these application areas are estimated from market data.
Chapter 3 presents the estimated onsite CT energy intensity (Btu per pound) and CT energy consumption (TBtu per year) for the process subareas studied and material total (along with sources and assumptions).
Chapter 4 presents the estimated onsite SOA energy intensity (Btu per pound) and SOA energy consumption (TBtu per year) for the process subareas studied and material total (along with sources and assumptions).
Chapter 5 presents the estimated onsite PM energy intensity (Btu per pound) and PM energy consumption (TBtu per year) for the process subareas studied and material total (along with sources and assumptions).
Chapter 6 presents the estimated onsite TM energy intensity (Btu per pound) and TM energy consumption (TBtu per year) for the process subareas studied and material total (along with sources and assumptions).
7 Feedstock energy is the nonfuel use of combustible energy.
DRAFT

Bandwidth Study on Energy Use and Potential Energy Saving Opportunities in the Manufacturing of Lightweight Materials: Glass Fiber Reinforced Polymer Composites
4 Introduction
Chapter 7 provides a summary of current and R&D opportunity analysis based on bandwidth study results.
1.4 Boundaries of the Study
The U.S. manufacturing sector is the physical boundary of this study. It is recognized that the major benefits of lightweight materials often occur outside of the manufacturing sector—for example, the energy benefits of a lightweight automobile component are typically realized primarily through fuel savings during the vehicle’s use phase. Economic impacts are also important: an advanced lightweight aerospace component may be more expensive than the conventional choice. While such impacts are recognized as important, they will not be quantified as this is not a life cycle assessment study. Instead, this report focuses exclusively on the energy use directly involved in the production of glass fiber composites from the relevant input materials. The focus of this bandwidth study is thus the onsite use of process energy (including purchased energy and onsite generated steam and electricity) that is directly applied to GFRP manufacturing at a production facility.
This study does not consider life cycle energy consumed during raw material extraction, off-site treatment, transportation of materials, product use, or disposal. For consistency with previous bandwidth studies, feedstock energy and the energy associated with delivering feedstocks to the plant gate (e.g., producing, conditioning, and transporting feedstocks) are excluded from the energy consumption bands in this analysis.
Glass fibers and fiber-reinforced composites are used in many diverse applications that differ substantially in product use, performance requirements, and relevance to energy use. GFRP materials have strong lightweighting potential in transportation applications, where mass reductions can provide substantial energy savings through improved fuel economy. These applications are of high relevance to the DOE because of the potential life cycle energy savings. Other applications, however, are less relevant to the DOE; for example, glass fibers are used in products such as reinforced cement, insulation, sporting equipment, and electrical devices. In order to focus exclusively on structural applications with strong relevance to energy use, this study was limited to four key application areas:
1) Automotive lightweighting (e.g., vehicle chassis, body, doors); 2) Compressed gas storage (e.g., hydrogen fuel tanks for electric vehicles); 3) Wind turbines (e.g., lighter and longer turbine blades); and 4) Aerospace (e.g., aircraft fairings, fuselages, floor panels).
The first three of these application areas are consistent with the areas of interest outlined in the DOE Composite Materials and Structures Funding Opportunity Announcement (DOE 2014). The last application area (aerospace) is an additional high value-add market for lightweight
DRAFT

Introduction 5
structural materials. Together, the four application areas considered in this study account for approximately 47% of overall glass fiber production in the U.S., as shown in Figure 1-1.8
Production of GFRP composites for applications that are outside of the boundaries of this study will be discussed briefly in Chapter 2, but energy consumption will not be quantified. These other applications may include medical devices, electronics and communications, computers and electrical equipment, construction and infrastructure materials, and consumer goods and packaging.
8 Data sources: JEC 2011 for production data; JEC 2012 for application breakdown data. Note that Figure 1-1 shows production data for glass rovings only (and excludes glass yarns). Glass yarns are generally woven into fabrics and are not used in structural composites. For further discussion, see Section 2.2.
Automotive485.9 million lbs
Wind Energy62.7 million lbs
Aerospace94.0 million lbs
Pressure Vessels94.0 million lbs
Rest of Glass Fiber Market*
830.8 million lbs
*Rest of market includes civil infrastructure, consumer goods, marine, electrical, and other
Figure 1-1. Estimated Makeup of the Glass Fiber Market in 2010.
DRAFT

Bandwidth Study on Energy Use and Potential Energy Saving Opportunities in the Manufacturing of Lightweight Materials: Glass Fiber Reinforced Polymer Composites
6 Glass Fiber Reinforced Polymer Composite Production
2. Glass Fiber Reinforced Polymer Composite Production
2.1 Manufacturing Overview
Figure 2-1 shows the GFRP composite manufacturing process schematically. The manufacturing process can be divided into six main process steps:
Batching: the preparation of the glass batch, including measuring, grinding and mixing the constituent materials (silica and additives);
Melting: the process of melting the glass mixture and refining the molten glass to remove impurities and air bubbles;
Fiberization: the process of extruding the molten glass through a bushing and attenuating the extruded material into long, thin filaments;
Finishing: the application of surface treatments and coatings (called “sizing”) to protect the fibers and promote bonding with the plastic matrix, and the spooling of the fibers;
Polymer Production: the manufacture of the polymer resin that will serve as a matrix material in the final composite product; and
Composite Production: the process of integrating the fibers into the polymer matrix and producing a finished composite product.
DRAFT

Glass Fiber Reinforced Polymer Composite Production 7
These process steps are further identified in Table 2-1, noting that the first four process steps listed (batching, melting, fiberization, and finishing) are sub-processes of glass fiber production. Six different polymer matrix materials were considered in this study, including two thermosetting polymers (epoxy9 and polyurethane10) and four thermoplastic polymers
9 The epoxy system considered was bisphenol-A and epichlorohydrin. Epoxy hardeners were not considered. 10 The polyurethane material considered was rigid polyurethane foam.
Figure 2-1. Process Flow Diagram for Glass Fiber Reinforced Polymer Composite Manufacturing DRAFT

Bandwidth Study on Energy Use and Potential Energy Saving Opportunities in the Manufacturing of Lightweight Materials: Glass Fiber Reinforced Polymer Composites
8 Glass Fiber Reinforced Polymer Composite Production
(polypropylene, high-density polyethylene, polyvinyl chloride,11 and polystyrene12). Twelve composite production techniques were considered, including two semi-finished production techniques (pre-impregnated fabric or “prepreg,” and sheet or bulk molding compounds), four open forming methods (hand lay-up, spray up, filament winding, and pultrusion), and six closed forming methods (injection molding, compression molding, resin transfer molding, vacuum-assisted resin infusion, autoclave forming, and cold press).
Table 2-1. Glass Fiber Reinforced Composites Manufacturing Process Subareas and Sub-Processes Considered in the Bandwidth Analysis
Subareas Sub-processes / products
Glass Fiber Production (four sequential steps)
- Batching - Melting - Fiberization - Finishing
Resin Production
- Epoxy resin - Polyurethane resin - Polypropylene - High-density polyethylene - Polyvinyl chloride - Polystyrene
Composite Production
- Prepreg - Sheet or bulk molding compound - Hand lay-up - Spray up - Filament winding - Pultrusion - Injection molding - Compression molding - Resin transfer molding - Vacuum-assisted resin infusion - Autoclave forming - Cold press
Energy intensity and consumption are evaluated by process area and sub-process for CT, SOA, PM, and TM in Chapters 3 through 6 of this report. Appendix A1 provides a summary of all data. To determine the total energy consumption for a given composite product, it is necessary to first sum the energy consumption for all four sequential glass fiber production steps, then add the energy consumption for the selected resin material and composite production technique in a “mix-and-match” fashion. In this report, the choice of resin material and composite production technique will be clearly noted anywhere a total energy intensity or consumption is presented.
2.2 Production Values
Production data for 2010 are summarized in Table 2-2, which shows the global production, U.S. production, and estimated U.S. production for the boundary applications. In 2010, United States
11 The polyvinyl chloride material considered was produced via bulk polymerization. 12 The polystyrene material considered was general-purpose polystyrene (GPPS) produced via continuous-mass radical polymerization.
DRAFT

Glass Fiber Reinforced Polymer Composite Production 9
manufacturers produced an estimated total of 1,930 million pounds of glass fibers,13 representing about 18% of global production (JEC 2011). About 81% of the fibers produced were glass rovings (large-diameter [≥10 µm] filaments that can be used as a reinforcement in structural composites), while the remaining 19% were glass yarns (flexible, small-diameter [<10 µm] filaments that are generally woven into fabrics). Glass yarns were excluded in this study as they are not used in structural composites. For glass rovings only, estimated production totals were 1,570 million pounds for U.S. manufacturers and 8,470 million pounds globally in 2010. Total fiber production was broken down by application area using data from a market report (JEC 2012) to estimate the quantity of glass fibers produced for the four boundary applications (automotive, wind energy, compressed gas storage, and aerospace). An estimated 740 million pounds of glass fibers were used in these boundary applications, as shown in Figure 1-1.
Resin and composite production values were calculated by assuming a 50:50 weight ratio of fiber reinforcement to polymer matrix.14 The resin production numbers, therefore, are an estimate of the production of polymer resins for use in glass fiber composites only, and do not reflect the total production of these materials in the U.S. for all applications. Global and U.S. production values for resins and composites were calculated only for the boundary applications, as some glass fibers outside of the boundary applications were not used in the production of fiber-reinforced polymer composites. For example, glass fibers are used in the construction industry for cement reinforcement and insulation; such fibers would never be integrated into a polymer matrix and thus are not included in the production totals.
Table 2-2. Global and U.S. Production of Glass Fiber Reinforced Polymer Composites in 2010 (Glass Rovings Only)
Subarea Product
2010 Total Global
Production (million lbs/yr)
2010 Total U.S.
Production (million lbs/yr)
2010 Estimated U.S. Production for
Boundary Applications
(million lbs/ yr) Glass Fiber Production Glass fiber 8,470 1,570 740
Resin Production Matrix resin n/a* n/a* 740
Composite Production** Composite product n/a* n/a* 1,470 * Not calculated because some fibers outside of the boundary applications were not used in the production of fiber-reinforced polymer composites. ** Composite production represents the sum of glass fiber production (for boundary applications) and resin production (for boundary applications, assuming a 50:50 weight ratio of fibers to polymer); independent rounding explains why the values do not sum in this summary table.
13 Assumes that 90% of North American production occurs in the U.S. Note that his production total includes fiber production only (not the production of GFRP composites, which would utilize the glass fibers as an input). 14 It is noted that fiber ratio in a GFRP composite can vary widely depending on the specific performance requirements in the application, but a 50:50 weight ratio is considered representative of structural lightweighting applications. This weight ratio was the median value in seven lightweighting case studies for automotive applications identified in a literature review (see Appendix A2 for details).
DRAFT

Bandwidth Study on Energy Use and Potential Energy Saving Opportunities in the Manufacturing of Lightweight Materials: Glass Fiber Reinforced Polymer Composites
10 Current Typical Energy Intensity and Energy Consumption
3. Current Typical Energy Intensity and Energy Consumption This chapter presents energy intensity and consumption data for GFRP manufacturing processes, based on 2010 production data for the boundary application areas. It is noted that energy consumption in a manufacturing process can vary widely for diverse reasons, including differences in equipment and processing techniques employed. The energy intensity estimates reported herein are considered representative of typical processes used to produce GFRP composites in the U.S. today; they do not represent energy consumption in any specific facility or any particular region in the United States.
3.1 Current Typical Energy Intensity
Table 3-1 presents the estimated CT energy intensities for glass fibers. Energy intensities for all sub-processes are presented in terms of Btu per pound (Btu/lb) of finished glass fibers. Data were drawn from a 2008 report out of Lawrence Berkeley National Laboratory, Energy Efficiency Improvement and Cost Savings Opportunities for the Glass Industry (Worrell 2008), which quantified the average energy intensity of major glassmaking process steps for four different glass industry segments (flat glass, container glass, specialty glass, and glass fibers). Onsite CT energy intensity data were converted to primary energy data using process-specific energy mix assumptions, taking into account the relative use of electricity and fuel in each sub-process. Primary energy includes offsite energy generation and transmission losses. These assumptions are described in Appendix A3.
Table 3-1. Current Typical Energy Intensity for Production of Glass Fibers
Glass Fiber Production Sub-Process Onsite CT Energy
Intensity (Btu/lb)
Primary* CT Energy Intensity
(Btu/lb) Data Source
Batching 550 1,020 Worrell (2008)
Melting15 2,800 2,860 Worrell (2008)
Fiberization 1,880 2,850 Worrell (2008)
Finishing 1,650 1,820 Worrell (2008)
Total Energy Intensity for Glass Fibers** 6,880 8,550 Current Typical (CT) * Primary energy accounts for offsite electricity generation and transmission losses, assuming a grid efficiency of 33.3%. Process-specific energy mix data were used to determine the ratio of fuel and electricity consumed onsite. See Appendix A3 for energy mix assumptions. ** Totals may not sum due to independent rounding.
15 Note that for glass melting, the use of an oxy-fuel furnace (rather than a recuperative furnace) was assumed as the current typical process. Oxy-fuel furnaces account for an estimated 75% of production of textile and reinforcement fibers (Rue 2007, Worrell 2008). Recuperative furnaces, while still in use at many facilities, represent older technology and have not been considered in this analysis.
DRAFT

Current Typical Energy Intensity and Energy Consumption 11
Table 3-2 presents the estimated CT energy intensities for the six matrix polymer materials studied. Energy intensities are presented in terms of Btu per pound (Btu/lb) of polymer material. For polypropylene (PP), high-density polyethylene (HDPE), and polyvinyl chloride (PVC), data were drawn from the 2011 American Chemistry Council report, Cradle-to-Gate Life Cycle Inventory of Nine Plastic Resins and Four Polyurethane Precursors. This report quantified average energy use for plastics manufacturing based on primary energy data submitted by 80 different resin/precursor manufacturing plants in North America. These data are considered very high quality, and representative of U.S. production. For epoxy resin, polyurethane resin, and polystyrene, ACC data were not available. For these materials, data were drawn from the PlasticsEurope Eco-Profiles. The energy data reported in the Eco-Profiles are representative of average production processes in Europe, and are similarly high quality. Where data were available from both sources, ACC and PlasticsEurope energy intensity data were in excellent agreement (≤10% difference between values for PP, HDPE, and PVC). Note that feedstock energy is not included in the energy intensities reported here for consistency with past bandwidth reports.16
Table 3-2. Current Typical Energy Intensity for Production of Polymer Matrix Resins
Matrix Polymer Onsite CT Energy
Intensity (Btu/lb)
Primary* CT Energy
Intensity (Btu/lb) Data Source
Thermosetting Resins
Epoxy resin 31,940 40,490 PlasticsEurope (2006)
Polyurethane resin 20,140 27,690 PlasticsEurope (2005b)
Thermoplastic Resins
Polypropylene (PP) 5,370 11,840 ACC (2011)
High density polyethylene (HDPE) 5,710 11,900 ACC (2011)
Polyvinyl chloride (PVC) 9,710 15,270 ACC (2011)
Polystyrene (PS) 10,500 17,360 PlasticsEurope (2012) Current Typical (CT) * Primary energy accounts for offsite electricity generation and transmission losses, assuming a grid efficiency of 33.3%. Process-specific energy mix data were used to determine the ratio of fuel and electricity consumed onsite. See Appendix A3 for energy mix assumptions.
Current typical energy intensity values for composite production are presented in Table 4-3, along with the sources used. Energy intensities are presented in terms of Btu per pound (Btu/lb) of composite product (fibers and resin).
16 Feedstock energies were given in both ACC and PlasticsEurope data, but were subtracted from the totals in this analysis.
DRAFT

Bandwidth Study on Energy Use and Potential Energy Saving Opportunities in the Manufacturing of Lightweight Materials: Glass Fiber Reinforced Polymer Composites
12 Current Typical Energy Intensity and Energy Consumption
Table 3-3. Current Typical Energy Intensity for Composite Production
Production Method Onsite CT Energy
Intensity (Btu/lb)
Primary* CT Energy Intensity
(Btu/lb) Data Source
Semi-Finished Production Methods
Prepreg 17,200 51,640 Suzuki & Takahashi (2005)
Sheet or bulk molding compound 1,510 4,520 Suzuki & Takahashi (2005)
Open Forming Methods
Hand lay-up 8,250 24,790 Suzuki & Takahashi (2005)
Spray up 6,410 19,240 Suzuki & Takahashi (2005)
Filament winding 1,160 3,490 Suzuki & Takahashi (2005)
Pultrusion 1,330 4,000 Suzuki & Takahashi (2005)
Closed Molding Methods
Injection molding 4,830 14,490 Schepp (2006)
Compression molding 4,910 14,730 Schepp (2006)
Resin transfer molding 5,500 16,530 Suzuki & Takahashi (2005)
Vacuum-assisted resin infusion 4,390 13,170 Suzuki & Takahashi (2005)
Autoclave forming 9,570 28,730 Schepp (2006)
Cold press 5,070 15,230 Suzuki & Takahashi (2005) Current Typical (CT) * Primary energy accounts for offsite electricity generation and transmission losses, assuming a grid efficiency of 33.3%. Process-specific energy mix data were used to determine the ratio of fuel and electricity consumed onsite. See Appendix A3 for energy mix assumptions.
3.2 Current Typical Energy Consumption
Table 3-4 presents the calculated onsite and primary CT energy consumption for the GFRP production subareas studied. In these summary data, epoxy resin was assumed as the polymer matrix material and autoclave forming was assumed as the composite production method. These selections are considered representative of current typical fiber-reinforced polymer composite systems for structural applications. Energy consumption values were calculated by multiplying energy intensity (Btu/lb) by 2010 production (lbs). As described in the previous section, onsite energy intensities were converted to primary (and vice versa) using process-specific energy mix data, as described in Appendix 3. Some data sources provided primary values and others provided onsite values; offsite losses attributed to electricity generation and transmission are accounted for in the conversion between the onsite and primary.
DRAFT

Current Typical Energy Intensity and Energy Consumption 13
Table 3-4. Calculated Current Typical Energy Consumption for Glass Fiber Reinforced Polymer Composite Manufacturing – Application Areas Considered
Subarea (product)
Onsite CT Energy
Intensity (Btu/lb)
Primary CT Energy Intensity (Btu/lb)
Production (million lbs)
Onsite CT Energy
Consumption (TBtu/yr)
Offsite Losses,
Calculated (TBtu/yr)
Primary CT Energy
Consumption (TBtu/yr)
Glass Fiber Production (glass fibers)
Batching Melting Fiberization Finishing
550 2,800 1,880 1,650
1,020 2,860 2,850 1,820
740 740 740 740
0.41 2.06 1.38 1.22
0.35 0.04 0.72 0.12
0.75 2.11 2.10 1.34
Resin Production* (matrix polymer)
31,940 40,490 740 23.53 6.30 29.83
Composite Production** (composite product) 9,570 28,730 1,470 14.10 28.24 42.33
Total*** 42.70 35.76 78.46 Current Typical (CT) * Assumes thermosetting epoxy resin. ** Assumes autoclave forming. ***Note: totals may not sum due to independent rounding.
DRAFT

Bandwidth Study on Energy Use and Potential Energy Saving Opportunities in the Manufacturing of Lightweight Materials: Glass Fiber Reinforced Polymer Composites
14 State of the Art Energy Intensity and Energy Consumption
4. State of the Art Energy Intensity and Energy Consumption This chapter estimates the energy savings possible if U.S. glass fiber, resin, and composites manufacturers were to adopt the best technologies and practices available worldwide. State of the art (SOA) energy intensity is considered the minimum amount of energy needed for a specific process, assuming use of best-available commercial technologies and practices.
4.1 State of the Art Energy Intensity
Table 4-1 presents the estimated SOA energy intensities for glass fibers. Energy intensities for all sub-processes are presented in terms of Btu per pound (Btu/lb) of finished glass fibers. Data sources are shown in the rightmost column. Onsite data were converted to primary data using process-specific energy mix assumptions, taking into account the relative use of electricity and fuel in each sub-process. These assumptions are described in Appendix A3.
Table 4-1. State of the Art Energy Intensity for Production of Glass Fibers
Glass Fiber Production Sub-Process Onsite SOA
Energy Intensity (Btu/lb)
Primary* SOA Energy Intensity
(Btu/lb) Data Source
Batching 140 410 Pellegrino (2002)
Melting 1,430 1,460 Beerkens (2011)
Fiberization 750 1,140 Rue (2007)
Finishing 750 830 Rue (2007)
Total Energy Intensity for Glass Fibers** 3,070 3,840 State of the Art (SOA) * Primary energy accounts for offsite electricity generation and transmission losses, assuming a grid efficiency of 33.3%. Process-specific energy mix data were used to determine the ratio of fuel and electricity consumed onsite. See Appendix A3 for energy mix assumptions. ** Totals may not sum due to independent rounding.
For polymer production, SOA energy intensity values were estimated by assuming a 20% energy savings over the lower of the current average primary energy intensity values reported for U.S. plants (based on ACC data) and European plants (based on PlasticsEurope data). The 20% savings figure is consistent with the ACC report (ACC 2011), which stated that “individual plant results varied as much as 25 percent on either side of the average total energy.” Table 4-2 presents the estimated SOA energy intensities for the six matrix polymer materials studied. Note that feedstock energy is not included in the energy intensities reported here for consistency with past bandwidth reports.17
17 Feedstock energies were given in both ACC and PlasticsEurope data, but were subtracted from the totals in this analysis.
DRAFT

State of the Art Energy Intensity and Energy Consumption 15
Table 4-2. State of the Art Energy Intensity for Production of Polymer Matrix Resins
Matrix Polymer Onsite SOA
Energy Intensity, (Btu/lb)
Primary* SOA Energy Intensity,
(Btu/lb) Data Source
Thermosetting Resins
Epoxy resin 26,880 32,390
Best engineering judgment (20% savings),
ACC (2011), PlasticsEurope (2006)
Polyurethane resin 17,330 22,150
Best engineering judgment (20% savings),
ACC (2011), PlasticsEurope (2005a)
Thermoplastic Resins
Polypropylene (PP) 4,290 9,470 Best engineering
judgment (20% savings), ACC (2011)
High density polyethylene (HDPE) 4,570 9,520 Best engineering
judgment (20% savings), ACC (2011)
Polyvinyl chloride (PVC) 7,180 11,290
Best engineering judgment (20% savings),
ACC (2011), PlasticsEurope (2005b)
Polystyrene (PS) 8,400 13,890
Best engineering judgment (20% savings),
ACC (2011), PlasticsEurope (2012)
State of the Art (SOA) * Primary energy accounts for offsite electricity generation and transmission losses, assuming a grid efficiency of 33.3%. Process-specific energy mix data were used to determine the ratio of fuel and electricity consumed onsite. See Appendix A3 for energy mix assumptions.
SOA energy intensity values for composite production are presented in Table 4-3. For injection molding, a best practice energy intensity was available from a literature source. For the other processes, no best practice / best plant values were available in the literature; for these processes, the SOA intensity was assumed to be 20% lower than the current typical intensity. This assumption is in line with the findings of ACC (ACC 2011) and represents the authors’ best engineering judgment.
DRAFT

Bandwidth Study on Energy Use and Potential Energy Saving Opportunities in the Manufacturing of Lightweight Materials: Glass Fiber Reinforced Polymer Composites
16 State of the Art Energy Intensity and Energy Consumption
Table 4-3. State of the Art Energy Intensity for Composite Production
Production Method Onsite SOA
Energy Intensity, (Btu/lb)
Primary* SOA Energy Intensity,
(Btu/lb) Data Source
Semi-Finished Production Methods
Prepreg 13,760 41,310 Best engineering judgment (20% savings)
Sheet or bulk molding compound 1,200 3,620 Best engineering judgment
(20% savings)
Open Forming Methods
Hand lay-up 6,600 19,830 Best engineering judgment (20% savings)
Spray up 5,120 15,390 Best engineering judgment
(20% savings)
Filament winding 930 2,790 Best engineering judgment
(20% savings)
Pultrusion 1,070 3,200 Best engineering judgment
(20% savings)
Closed Molding Methods
Injection molding 960 2,880 Thiriez (2006)
Compression molding 3,920 11,780 Best engineering judgment (20% savings)
Resin transfer molding 4,400 13,220 Best engineering judgment
(20% savings)
Vacuum-assisted resin infusion 3,510 10,530 Best engineering judgment (20% savings)
Autoclave forming 7,650 22,990 Best engineering judgment (20% savings)
Cold press 4,060 12,190 Best engineering judgment (20% savings)
State of the Art (SOA) * Primary energy accounts for offsite electricity generation and transmission losses, assuming a grid efficiency of 33.3%. Process-specific energy mix data were used to determine the ratio of fuel and electricity consumed onsite. See Appendix A3 for energy mix assumptions.
4.2 State of the Art Energy Consumption
Table 4-4 presents the calculated onsite and primary SOA energy consumption for the GFRP production subareas studied. In these summary data, epoxy resin was assumed as the polymer matrix material and resin transfer molding was assumed as the composite production method. These selections are considered representative of current state of the art composite systems for structural applications. Energy consumption values were calculated by multiplying energy intensity (Btu/lb) by 2010 production (lbs). Onsite energy intensities were converted to primary (and vice versa) using process-specific energy mix data, as described in Appendix 3. Some data sources provided primary values and others provided onsite values; offsite losses attributed to electricity generation and transmission are accounted for in the conversion between the onsite and primary.
DRAFT

State of the Art Energy Intensity and Energy Consumption 17
Table 4-4. Calculated State of the Art Energy Consumption for Glass Fiber Reinforced Polymer Composite Manufacturing – Application Areas Considered
Subarea (product)
Onsite SOA
Energy Intensity (Btu/lb)
Primary SOA
Energy Intensity (Btu/lb)
Production (million lbs)
Onsite SOA Energy
Consumption (TBtu/yr)
Offsite Losses,
Calculated (TBtu/yr)
Primary SOA Energy
Consumption (TBtu/yr)
Glass Fiber Production (glass fibers)
Batching Melting Fiberization Finishing
140 1,430 750 750
410 1,460 1,140 830
740 740 740 740
0.10 1.06 0.55 0.55
0.20 0.02 0.29 0.06
0.30 1.08 0.84 0.61
Resin Production* (matrix polymer)
26,880 32,390 740 19.80 4.06 23.86
Composite Production** (composite product) 4,400 13,220 1,470 6.49 12.99 19.48
Total*** 28.55 17.62 46.17 State of the Art (SOA) * Assumes thermosetting epoxy resin. ** Assumes resin transfer molding ***Note: totals may not sum due to independent rounding.
Table 4-5 presents a comparison of the onsite CT energy consumption and SOA energy consumption for each process subarea and as a total. The difference between the CT and SOA energy consumption values is presented as the SOA energy savings (or current opportunity). The SOA energy savings percent in Table 4-5 is the percent of energy saved with SOA energy consumption compared to CT energy consumption, while referencing the thermodynamic minimum as the baseline energy consumption. Thermodynamic minimum (TM), discussed further in Chapter 6, is considered to be equal to zero in an ideal case with perfect efficiency (i.e., energy input to a system is considered fully recoverable with no friction losses or change in surface energy). For manufacturing processes where there is an irreversible change to the material, resulting in a change to the embodied free energy content of the material (i.e., chemical reaction or permanent crystalline change due to deformation), TM is not necessarily equal to zero; in some cases the change in theoretical free energy content of the material requires energy input (TM > 0) and in other cases the change creates a theoretical free energy gain (TM < 0). Referencing TM as the baseline in comparing bandwidths of energy consumption and calculating energy savings percent provides the most accurate measure of absolute savings potential. The equation for calculating onsite SOA energy savings percent is:
% = −−
It is useful to consider both TBtu energy savings and energy savings percent when comparing energy savings opportunities. Both are good measures of opportunity; however, the conclusions are not always the same. A small percent energy reduction in a process that consumes a large
DRAFT

Bandwidth Study on Energy Use and Potential Energy Saving Opportunities in the Manufacturing of Lightweight Materials: Glass Fiber Reinforced Polymer Composites
18 State of the Art Energy Intensity and Energy Consumption
amount of energy may result in a larger total savings than a large percent reduction in a process that consumes a relatively smaller amount of energy. Among the processes studied, the greatest current opportunity in terms of percent energy savings is glass melting at 58.6% energy savings; the greatest current opportunity in terms of TBtu savings is composite production at 7.61 TBtu per year savings.
Table 4-5. Calculated State of the Art Energy Savings for Glass Fiber Reinforced Polymer Composite Manufacturing
Subarea (product)
Onsite CT Energy
Consumption, Calculated (TBtu/yr)
Onsite SOA Energy
Consumption, Calculated (TBtu/yr)
SOA Energy Savings*
(CT – SOA) (TBtu/yr)
SOA Energy Savings
Percent** (CT-SOA)/
(CT-TM) Glass Fiber Production (glass fibers)
Batching Melting Fiberization Finishing
0.41 2.06 1.38 1.22
0.10 1.06 0.55 0.55
0.31 1.01 0.83 0.66
75.5% 58.6% 48.1% 54.5%
Resin Production* (matrix polymer)
23.53 19.80 3.73 15.3%
Composite Production** (composite product) 14.10 6.49 7.61 54.0%
Total*** 42.70 28.55 14.15 32.5% Current Typical (CT), State of the Art (SOA), Thermodynamic Minimum (TM) * SOA energy savings is also called Current Opportunity. ** SOA energy savings percent is the SOA energy savings opportunity from transforming glass fiber composite production processes through the adoption of state of the art equipment and practices. Energy savings percent is calculated using the TM energy consumption shown in Table 6-4 as the minimum energy consumption. The energy savings percent, with TM as the minimum, is calculated as follows: SOA Energy Savings Percent = (CT-SOA)/(CT-TM) ***Note: totals may not sum due to independent rounding.
If all U.S. glass fiber, resin, and composites producers (based on the 2010 production level of GFRP composites for application areas considered) were able to attain SOA energy intensities, it is estimated that a total of 14.2 TBtu of onsite energy could be saved annually, corresponding to a 32.5% energy savings overall. This energy savings estimate is based on adopting available SOA technologies and practices without accounting for future gains in energy efficiency from R&D. This is a simple estimate for potential savings; not all existing plants could necessarily achieve these state of the art values. No assessment was made in this study regarding whether the improvements would prove to be cost effective in all cases. DRAFT

Practical Minimum Energy Intensity and Energy Consumption 19
5. Practical Minimum Energy Intensity and Energy Consumption
Technology innovation is the driving force for economic growth. Across the globe, R&D is underway to make GFRP composites in new ways, improving energy efficiency as well as composite performance. Commercialization of these improvements will drive the competitiveness of U.S. GFRP composites manufacturing. In this chapter, the energy savings possible through R&D advancements in GFRP composites manufacturing are estimated. Practical minimum (PM) is the minimum amount of energy required assuming the successful deployment of applied R&D technologies under development worldwide.
5.1 Practical Minimum Energy Intensity
R&D progress is difficult to predict, and the realization of potential gains in energy efficiency can depend on financial investments and market priorities. To estimate PM energy consumption for this bandwidth analysis, a review of R&D activities in glass fiber manufacturing, polymer resin manufacturing, and composites production techniques was conducted. The focus of this search was applied research, defined as the investigation and development of new technologies with the intent of accomplishing a particular commercial objective. Basic science research, involving experimentation and modeling to expand understanding of fundamental mechanisms and principles without a direct link to commercial objectives, was not considered. Further, applied R&D technologies without a clear connection to manufacturing energy consumption (improved damage detection or multi-material joining techniques, for example) were not considered in this study.
PM energy intensity was estimated for glass fibers by applying assumed energy savings percentages for applicable PM technologies to the baseline SOA energy intensities for each manufacturing sub-process. The PM technologies included in this analysis and assumed energy savings were:
Motor re-sizing or VSDs: 12% savings in the batching process;
Additives to batching solution: 4% savings in the melting process;
Recycling of cullet: 10% savings in the melting process;
Reduced batch wetting: 1% savings in the melting process;
Microwave melting: 40% savings in the melting process;
Process heating control systems: 3% savings in the melting process;
Improved drying systems: 30% savings in the finishing process;
Modeling and process analysis to reduce off-spec material: 14% savings across all processes (cross-cutting technology);
Process integration / pinch analysis: 4% savings across all processes (cross-cutting technology).
DRAFT

Bandwidth Study on Energy Use and Potential Energy Saving Opportunities in the Manufacturing of Lightweight Materials: Glass Fiber Reinforced Polymer Composites
20 Practical Minimum Energy Intensity and Energy Consumption
For a discussion of these energy savings estimates and sources, see Appendix A4. Appendix A4 also provides details of additional technologies that were considered but not included in the final PM model. The excluded technologies were considered incompatible with PM technologies already included in the model. For example, energy savings opportunities from waste heat recovery were not included in the PM model because it was assumed that savings would be negligible when using a selective heating process (microwave heating) for the melting process step. Table 5-1 presents the estimated PM energy intensities for glass fibers.
Table 5-1. Practical Minimum Energy Intensity for Production of Glass Fibers
Glass Fiber Production Sub-Process Onsite PM Energy
Intensity (Btu/lb)
Primary* PM Energy Intensity
(Btu/lb) Data Source
Batching 100 300 Calculated; see Appendix A4 for
sources
Melting 590 600 Calculated; see
Appendix A4 for sources
Fiberization 620 940 Calculated; see
Appendix A4 for sources
Finishing 430 480 Calculated; see
Appendix A4 for sources
Total Energy Intensity for Glass Fibers 1,740 2,320 Practical Minimum (PM) * Primary energy accounts for offsite electricity generation and transmission losses, assuming a grid efficiency of 33.3%. Process-specific energy mix data were used to determine the ratio of fuel and electricity consumed onsite. See Appendix A3 for energy mix assumptions. ** Note: totals may not sum due to independent rounding.
For polymer and composite production processes, PM energy intensity was again estimated by applying assumed energy savings percentages for applicable PM technologies to the baseline SOA energy intensities for each sub-process. The PM technologies and assumed energy savings were:
For polymer production:
Plastics recycling and recovery: 49% savings for thermoplastic resins and 35% savings for thermosetting resins;
Modeling and process analysis to reduce off-spec material: 14% savings across all processes (cross-cutting technology);
Process integration / pinch analysis: 4% savings across all processes (cross-cutting technology).
For composite production:
Barrel insulation to reduce thermal losses: 10% savings for injection molding, resin transfer molding, and vacuum-assisted resin infusion;
Infrared heating with emissivity matching: 50% savings for pultrusion and autoclave forming;
Improved die design: 5% savings for pultrusion;
Modeling and process analysis to reduce off-spec material: 14%
DRAFT
Practical Minimum Energy Intensity and Energy Consumption 21
savings across all processes (cross-cutting technology);
Process integration / pinch analysis: 4% savings across all processes (cross-cutting technology).
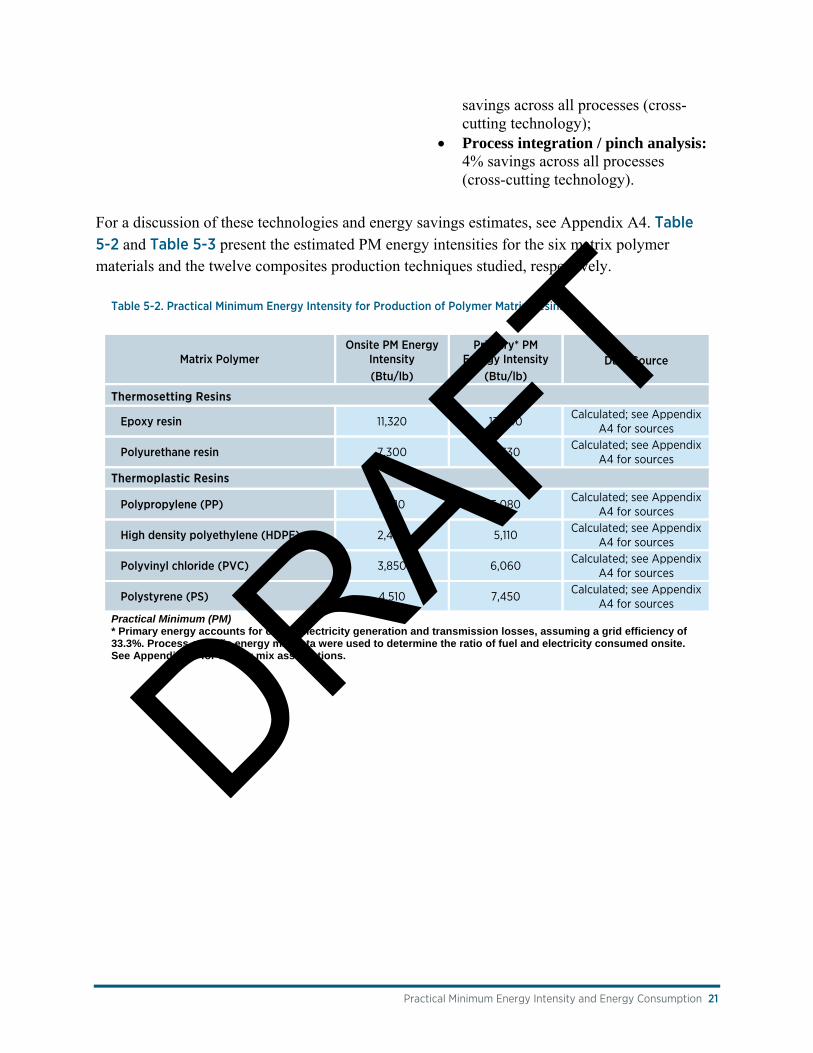
For a discussion of these technologies and energy savings estimates, see Appendix A4. Table 5-2 and Table 5-3 present the estimated PM energy intensities for the six matrix polymer materials and the twelve composites production techniques studied, respectively.
Table 5-2. Practical Minimum Energy Intensity for Production of Polymer Matrix Resins
Matrix Polymer Onsite PM Energy
Intensity (Btu/lb)
Primary* PM Energy Intensity
(Btu/lb) Data Source
Thermosetting Resins
Epoxy resin 11,320 13,640 Calculated; see Appendix A4 for sources
Polyurethane resin 7,300 9,330 Calculated; see Appendix
A4 for sources
Thermoplastic Resins
Polypropylene (PP) 2,310 5,080 Calculated; see Appendix A4 for sources
High density polyethylene (HDPE) 2,450 5,110 Calculated; see Appendix A4 for sources
Polyvinyl chloride (PVC) 3,850 6,060 Calculated; see Appendix
A4 for sources
Polystyrene (PS) 4,510 7,450 Calculated; see Appendix A4 for sources
Practical Minimum (PM) * Primary energy accounts for offsite electricity generation and transmission losses, assuming a grid efficiency of 33.3%. Process-specific energy mix data were used to determine the ratio of fuel and electricity consumed onsite. See Appendix A3 for energy mix assumptions.
DRAFT

Bandwidth Study on Energy Use and Potential Energy Saving Opportunities in the Manufacturing of Lightweight Materials: Glass Fiber Reinforced Polymer Composites
22 Practical Minimum Energy Intensity and Energy Consumption
Table 5-3. Practical Minimum Energy Intensity for Composite Production
Production Method Onsite PM Energy
Intensity (Btu/lb)
Primary* PM Energy Intensity,
(Btu/lb) Data Source
Semi-Finished Production Methods
Prepreg 11,360 34,110 Calculated; see Appendix A4 for sources
Sheet or bulk molding compound 990 2,980 Calculated; see Appendix A4
for sources
Open Forming Methods
Hand lay-up 5,450 16,370 Calculated; see Appendix A4 for sources
Spray up 4,230 12,710 Calculated; see Appendix A4
for sources
Filament winding 770 2,300 Calculated; see Appendix A4
for sources
Pultrusion 420 1,260 Calculated; see Appendix A4
for sources
Closed Molding Methods
Injection molding 710 2,140 Calculated; see Appendix A4 for sources
Compression molding 3,240 9,730 Calculated; see Appendix A4 for sources
Resin transfer molding 3,270 9,820 Calculated; see Appendix A4 for sources
Vacuum-assisted resin infusion 2,610 7,830 Calculated; see Appendix A4
for sources
Autoclave forming 3,160 9,490 Calculated; see Appendix A4 for sources
Cold press 3,350 10,060 Calculated; see Appendix A4 for sources
Practical Minimum (PM) * Primary energy accounts for offsite electricity generation and transmission losses, assuming a grid efficiency of 33.3%. Process-specific energy mix data were used to determine the ratio of fuel and electricity consumed onsite. See Appendix A3 for energy mix assumptions.
5.2 Practical Minimum Energy Consumption
Table 5-4 presents the calculated onsite and primary PM energy consumption for the GFRP production subareas studied. In these summary data, polypropylene was assumed as the polymer matrix material and injection molding was assumed as the composite production method. These selections reflect the current R&D interest in moving towards thermoplastic resins and low-energy composite production methods to reduce GFRP cost and energy requirements. Energy consumption values were calculated by multiplying energy intensity (Btu/lb) by 2010 production (lbs). Onsite energy intensities were converted to primary (and vice versa) using process-specific energy mix data, as described in Appendix 3.
DRAFT

Practical Minimum Energy Intensity and Energy Consumption 23
Table 5-4. Calculated Practical Minimum Energy Consumption for Glass Fiber Reinforced Polymer Composite Manufacturing – Application Areas Considered
Subarea (product)
Onsite PM Energy
Intensity (Btu/lb)
Primary PM
Energy Intensity (Btu/lb)
Production (million lbs)
Onsite PM Energy
Consumption (TBtu/yr)
Offsite Losses,
Calculated (TBtu/yr)
Primary PM Energy
Consumption (TBtu/yr)
Glass Fiber Production (glass fibers)
Batching Melting Fiberization Finishing
100 590 620 430
300 600 940 480
740 740 740 740
0.07 0.44 0.46 0.32
0.15 0.01 0.24 0.03
0.22 0.44 0.69 0.35
Resin Production* (matrix polymer)
2,310 5,080 740 1.70 2.05 3.74
Composite Production** (composite product) 710 2,140 1,470 1.05 2.10 3.15
Total*** 4.03 4. 57 8.61 Practical Minimum (PM) * Assumes thermoplastic polypropylene resin. ** Assumes injection molding. ***Note: totals may not sum due to independent rounding.
Table 5-5 presents a comparison of the onsite CT energy consumption and PM energy consumption for each process subarea and as a total. The difference between the CT and PM energy consumption values is presented as the PM energy savings (or the sum of the Current Opportunity plus the R&D Opportunity).
The PM energy savings percent in Table 5-5 is the percent of energy saved with PM energy consumption compared to CT energy consumption, while referencing the thermodynamic minimum as the baseline energy consumption. Thermodynamic minimum (TM), discussed further in the following section, is considered to be equal to zero in an ideal case with perfect efficiency (i.e., energy input to a system is considered fully recoverable with no friction losses or change in surface energy). For manufacturing processes where there is an irreversible change to the material, resulting in a change to the embodied free energy content of the material (i.e., chemical reaction or permanent crystalline change due to deformation), TM is not necessarily equal to zero; in some cases the change in theoretical free energy content of the material requires energy input (TM > 0) and in other cases the change creates a theoretical free energy gain (TM < 0). Referencing TM as the baseline in comparing bandwidths of energy consumption and calculating energy savings percent provides the most accurate measure of absolute savings potential. The equation for calculating onsite PM energy savings percent is:
% = −−
DRAFT

Bandwidth Study on Energy Use and Potential Energy Saving Opportunities in the Manufacturing of Lightweight Materials: Glass Fiber Reinforced Polymer Composites
24 Practical Minimum Energy Intensity and Energy Consumption
Table 5-5. Calculated Practical Minimum Energy Savings for Glass Fiber Composite Manufacturing
Subarea (product)
Onsite CT Energy
Consumption, Calculated (TBtu/yr)
Onsite PM Energy
Consumption, Calculated (TBtu/yr)
PM Energy Savings*
(CT – PM) (TBtu/yr)
PM Energy Savings
Percent** (CT-PM)/ (CT-TM)
Glass Fiber Production (glass fibers)
Batching Melting Fiberization Finishing
0.41 2.06 1.38 1.22
0.07 0.44 0.46 0.32
0.33 1.63 0.93 0.90
82.1% 94.6% 53.7% 73.7%
Resin Production* (matrix polymer) 23.53 1.70 21.83 89.5%
Composite Production** (composite product)
14.10 1.05 13.05 92.6%
Total*** 42.70 4.03 38.67 88.8% Current Typical (CT), Practical Minimum (PM), Thermodynamic Minimum (TM) * PM energy savings is the Current Opportunity plus the R&D Opportunity. ** PM energy savings percent is the PM energy savings opportunity from transforming glass fiber composite production processes through the adoption of state of the art equipment and practices. Energy savings percent is calculated using the TM energy consumption shown in Table 6-4 as the minimum energy consumption. The energy savings percent, with TM as the minimum, is calculated as follows: PM Energy Savings Percent = (Current-PM)/(Current-TM) ***Note: totals may not sum due to independent rounding.
Among the processes studied, the greatest R&D opportunity in terms of percent energy savings is composite production at 92.6% energy savings. The greatest R&D opportunity in terms of TBtu savings was resin production at 21.83 TBtu per year savings.
If all U.S. glass fiber, resin, and composites producers (based on the 2010 production level of GFRP composites for application areas considered) were able to attain PM energy intensities, it is estimated that a total of 38.67 TBtu of onsite energy could be saved annually, corresponding to an 88.8% energy savings overall. This energy savings estimate assumes the adoption of the PM technologies and practices described in this report. This is a simple estimate for potential savings, as the PM technologies considered are unproven, and not all existing plants could necessarily deploy all of the practices considered. No assessment was made in this study regarding whether the improvements would prove to be cost effective in all cases, nor whether satisfactory GFRP performance could be achieved via the PM processes. DRAFT

Thermodynamic Minimum Energy Intensity and Energy Consumption 25
6. Thermodynamic Minimum Energy Intensity and Energy Consumption
Real-world manufacturing does not occur under theoretically ideal conditions; however, understanding the theoretical minimal amount of energy required to manufacture GFRP composites can provide a more complete understanding of the realistic opportunities for energy savings. This baseline can be used to establish more realistic projections (and bounds) for the future R&D energy savings that may be achieved. This chapter presents the thermodynamic minimum (TM) energy consumption required for the subareas studied.
TM energy consumption, which is based on Gibbs free energy calculations, assumes ideal conditions that are unachievable in real-world applications. TM energy consumption assumes that all energy is used productively, that there are no energy losses, and that energy is ultimately perfectly conserved by the system (i.e., when cooling a material to room temperature or applying work to a process, the heat or work energy is fully recovered – perfect efficiency). It is not anticipated that any manufacturing process would ever attain this value in practice. A reasonable long-term goal for energy efficiency would be the practical minimum (see Chapter 5).
For manufacturing processes where there is an irreversible change to the material, resulting in a change to the embodied free energy content of the material (i.e., chemical reaction or permanent crystalline change due to deformation), TM is not necessary equal to zero; in some cases the change in theoretical free energy content of the material requires energy input (TM > 0) and in other cases the change creates a theoretical free energy gain (TM < 0).
6.1 Thermodynamic Minimum Energy Intensity
The thermodynamic minimum energy intensity was calculated for each sub-process by determining the Gibbs free energy associated with the chemical transformations involved, under ideal conditions for a manufacturing process.18 The TM energy intensity is negative when the chemical reaction is net-exergonic and positive when the chemical reaction is net-endergonic.19 Changes in surface energy were not considered in the TM analysis. The change in entropy was calculated based on the relative change in the number of molecules, and the change in enthalpy was calculated based on the change in bond energy.20
TM energy intensity calculations are process path independent (state function), but are directly related to the relative energy levels of the substrate reactants and the products. The reported value depends only on the starting material and the end product, and would not change if the process had greater or fewer process steps or if a catalyst were involved. For polymerization
18 Unless otherwise noted, “ideal conditions” means a pressure of 1 atmosphere and a temperature of 77°F. 19 Exergonic (reaction is favorable) and endergonic (reaction is not favorable) are thermodynamic terms describing the total change in Gibbs free energy (delta G). This differs from exothermic (reaction is favorable) and endothermic (reaction is not favorable) terminology that are used in describing change in enthalpy (delta H). 20 Note that the bond energy values are averages, not specific to the molecule in question.
DRAFT

Bandwidth Study on Energy Use and Potential Energy Saving Opportunities in the Manufacturing of Lightweight Materials: Glass Fiber Reinforced Polymer Composites
26 Thermodynamic Minimum Energy Intensity and Energy Consumption
reactions, the starting material is assumed to be the relevant monomers (not crude petroleum). It is important to note that a negative TM value does not imply that the reaction will occur without being forced by a manufacturing process.
For glass fiber manufacturing, only the melting and fiberization processes had nonzero TM energy intensities. The TM energy for these processes was estimated on the basis of a constant heat capacity.21 Values are presented in Table 6-1. Note that primary energy intensity was not calculated for TM because energy conversion is assumed to be perfect in the theoretical minimum case.
Table 6-1. Thermodynamic Minimum Energy Intensity for Production of Glass Fibers
Glass Fiber Production Sub-Process Onsite TM Energy
Intensity (Btu/lb)
Data Source
Batching 0 n/a
Melting 470 Calculated*
Fiberization -470 Calculated*
Finishing 0 n/a
Total Energy Intensity for Glass Fibers 0 Thermodynamic Minimum (TM) *See preceding discussion in text for description of methodology.
The TM energy intensity values for the matrix polymers reflect polymerization of the resin from its monomers, assuming a polymer chain 1000 repeat units in length.22 TM values for the polymer materials are presented in Table 6-2. For composite production there is no change to the embodied free energy content of the materials being produced, no chemical reactions or phase changes are involved in the processes; the TM energy intensity was therefore assumed to be zero for all methods, as shown in Table 6-3.
21 During the melting phase, glass is heated from room temperature to 1370°C; during the fiberization phase, the molten glass is cooled back to room temperature (Wallenberger 2001). Given a heat capacity of 0.345 Btu/lb°C for the glass, the TM energy intensity for melting is 470 Btu/lb and for fiberization is-470 Btu/lb [the opposite]. 22 The exception was epoxy, which is based upon a chain consisting of 25 units of bisphenol-A and 26 units of epichlorohydrin.
DRAFT

Thermodynamic Minimum Energy Intensity and Energy Consumption 27
Table 6-2. Thermodynamic Minimum Energy Intensity for Production of Polymer Matrix Resins
Matrix Polymer Onsite TM Energy
Intensity (Btu/lb)
Data Source
Thermosetting Resins
Epoxy resin -120 Calculated*
Polyurethane resin -190 Calculated*
Thermoplastic Resins
Polypropylene (PP) -1,160 Calculated*
High density polyethylene (HDPE) -1,740 Calculated*
Polyvinyl chloride (PVC) -970 Calculated*
Polystyrene (PS) -470 Calculated* Thermodynamic Minimum (TM) * Calculated based on polymerization of the resin from its monomers; see discussion in text for details of methodology used.
Table 6-3. Thermodynamic Minimum Energy Intensity for Composite Production
Production Method Onsite TM Energy
Intensity (Btu/lb)
Data Source
Semi-Finished Production Methods
Prepreg 0 Best engineering judgment*
Sheet or bulk molding compound 0 Best engineering judgment*
Open Forming Methods
Hand lay-up 0 Best engineering judgment*
Spray up 0 Best engineering judgment*
Filament winding 0 Best engineering judgment*
Pultrusion 0 Best engineering judgment*
Closed Molding Methods
Injection molding 0 Best engineering judgment*
Compression molding 0 Best engineering judgment*
Resin transfer molding 0 Best engineering judgment*
Vacuum-assisted resin infusion 0 Best engineering judgment*
Autoclave forming 0 Best engineering judgment*
Cold press 0 Best engineering judgment* Thermodynamic Minimum (TM) *See discussion in text for details of methodology used.
6.2 Thermodynamic Minimum Energy Consumption
Table 6-4 presents the calculated TM energy consumption for the GFRP production subareas studied. In these summary data, polypropylene was assumed as the polymer matrix material and
DRAFT

Bandwidth Study on Energy Use and Potential Energy Saving Opportunities in the Manufacturing of Lightweight Materials: Glass Fiber Reinforced Polymer Composites
28 Thermodynamic Minimum Energy Intensity and Energy Consumption
injection molding was assumed as the composite production method. These selections reflect the current R&D interest in moving towards thermoplastic resins and low-energy composite production methods to reduce GFRP cost and energy requirements. Energy consumption values were calculated by multiplying energy intensity (Btu/lb) by the 2010 production volume (lbs).
Table 6-4. Calculated Thermodynamic Minimum Energy Consumption for Glass Fiber Reinforced Polymer Composite Manufacturing – Application Areas Considered
Subarea (product)
TM Energy
Intensity (Btu/lb)
Production (million lbs)
TM Energy Consumption
(TBtu/yr)
Glass Fiber Production (glass fibers)
Batching Melting Fiberization Finishing
0 470 -470
0
740 740 740 740
0 0.34 -0.34
0 Resin Production* (matrix polymer) -1,160 740 0.86
Composite Production** (composite product) 0 1,470 0
Total*** -0.86 Thermodynamic Minimum (TM) * Assumes thermoplastic polypropylene resin. ** Assumes injection molding. ***Note: totals may not sum due to independent rounding.
DRAFT

Current and R&D Opportunity Analysis/Bandwidth Summary 29
7. Current and R&D Opportunity Analysis/Bandwidth Summary Table 7-1 summarizes the current opportunity and R&D opportunity energy savings for the subareas studied, based on GFRP composite production in 2010 for the four boundary application areas. Glass fiber production is broken down into its four sub-processes. The polymer matrix materials and composite production methods assumed for each energy band are shown in Table 7-2.
Table 7-1. Current and R&D Opportunities for GFRP Manufacturing (Onsite Energy Consumption)
Subarea (product)
Current Opportunity (CT – SOA) (TBtu/year)
R&D Opportunity (SOA – PM) (TBtu/year)
Glass Fiber Production (glass fibers)
Batching Melting Fiberization Finishing
0.31 1.01 0.83 0.66
0.03 0.62 0.10 0.23
Resin Production (matrix polymer) 3.73 18.10
Composite Production (composite product) 7.61 5.44
Total* 14.15 24.52 Current typical (CT), state of the art (SOA), practical minimum (PM) * Note: totals may not sum due to independent rounding.
Table 7-2. Manufacturing Process Assumptions for Current Typical, State of the Art, and Practical Minimum Energy Bands
Energy Band Polymer Matrix Material
Composite Production Method
Current Typical Epoxy resin Autoclave forming
State of the Art Epoxy resin Resin transfer molding
Practical Minimum Polypropylene Injection molding
In this study, two hypothetical opportunity bandwidths for energy savings were estimated (as defined in Chapter 1). The analysis shows the following:
Current Opportunity – 14.15 TBtu per year of energy savings could be realized if state of the art technologies and practices are deployed; and
R&D Opportunity – 24.52 TBtu per year of additional energy savings could be attained in the future if applied R&D technologies under development worldwide are successfully deployed (i.e., reaching the practical minimum).
DRAFT

Bandwidth Study on Energy Use and Potential Energy Saving Opportunities in the Manufacturing of Lightweight Materials: Glass Fiber Reinforced Polymer Composites
30 Current and R&D Opportunity Analysis/Bandwidth Summary
Figure 7-1 depicts these two opportunity bandwidths graphically. The area between R&D opportunity and impractical is shown as a dashed line with color fading because the PM energy savings impacts are speculative and based on unproven technologies. The impractical bandwidth—the difference between the PM and TM energy consumption—represents energy savings that could only be achieved through fundamental changes in GFRP manufacturing. The term impractical is used because the TM energy consumption is based on ideal conditions that are unattainable in commercial applications.
Figure 7-1. Current and R&D Energy Savings Opportunities for GFRP Composite Manufacturing by Process, Based on 2010 Glass Fiber Production for Structural Applications
DRAFT

Current and R&D Opportunity Analysis/Bandwidth Summary 31
Based on the bandwidth analysis, the greatest current energy savings opportunity for GFRP composites involves upgrading composite production equipment and processes. The greatest R&D energy savings opportunities could be achieved through the utilization of advanced matrix polymer materials (in particular, changing from thermosetting polymers to thermoplastic polymers). Examples of technologies that could be deployed to achieve these opportunities were detailed in this report and its appendices.
DRAFT
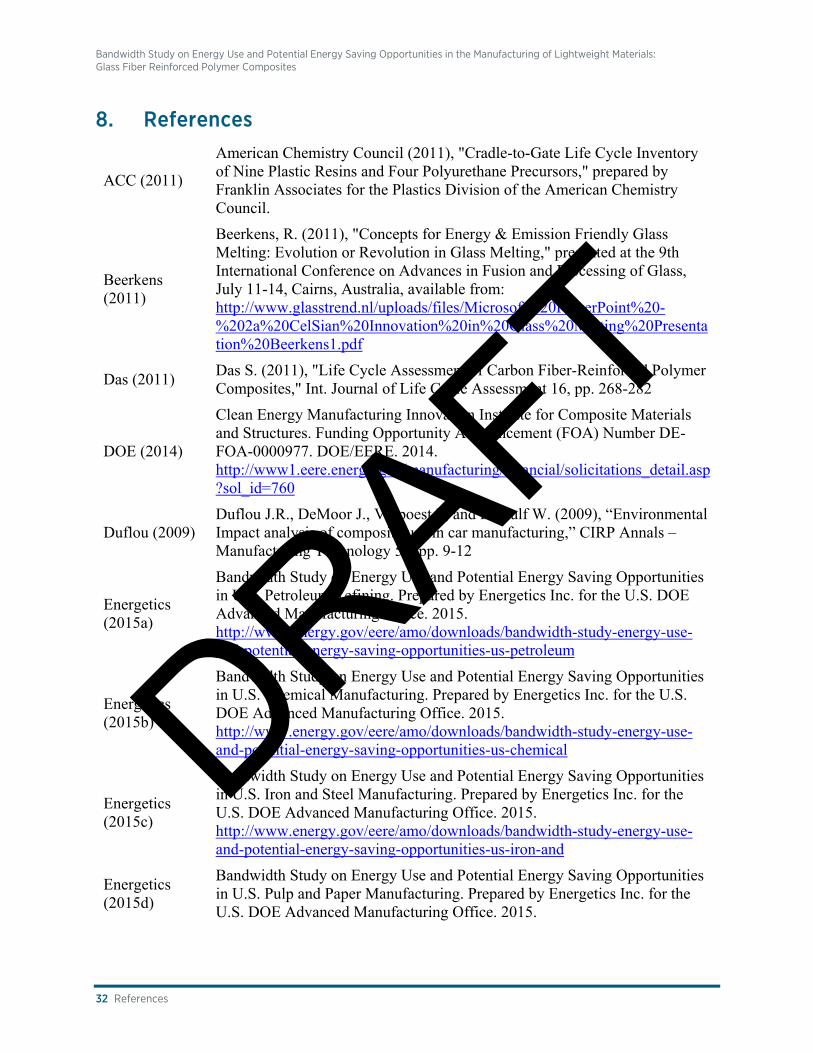
Bandwidth Study on Energy Use and Potential Energy Saving Opportunities in the Manufacturing of Lightweight Materials: Glass Fiber Reinforced Polymer Composites
32 References
8. References
ACC (2011)
American Chemistry Council (2011), "Cradle-to-Gate Life Cycle Inventory of Nine Plastic Resins and Four Polyurethane Precursors," prepared by Franklin Associates for the Plastics Division of the American Chemistry Council.
Beerkens (2011)
Beerkens, R. (2011), "Concepts for Energy & Emission Friendly Glass Melting: Evolution or Revolution in Glass Melting," presented at the 9th International Conference on Advances in Fusion and Processing of Glass, July 11-14, Cairns, Australia, available from: http://www.glasstrend.nl/uploads/files/Microsoft%20PowerPoint%20-%202a%20CelSian%20Innovation%20in%20Glass%20Melting%20Presentation%20Beerkens1.pdf
Das (2011) Das S. (2011), "Life Cycle Assessment of Carbon Fiber-Reinforced Polymer Composites," Int. Journal of Life Cycle Assessment 16, pp. 268-282
DOE (2014)
Clean Energy Manufacturing Innovation Institute for Composite Materials and Structures. Funding Opportunity Announcement (FOA) Number DE-FOA-0000977. DOE/EERE. 2014. http://www1.eere.energy.gov/manufacturing/financial/solicitations_detail.asp?sol_id=760
Duflou (2009) Duflou J.R., DeMoor J., Verpoest I., and Dewulf W. (2009), “Environmental Impact analysis of composite use in car manufacturing,” CIRP Annals – Manufacturing Technology 58, pp. 9-12
Energetics (2015a)
Bandwidth Study on Energy Use and Potential Energy Saving Opportunities in U.S. Petroleum Refining. Prepared by Energetics Inc. for the U.S. DOE Advanced Manufacturing Office. 2015. http://www.energy.gov/eere/amo/downloads/bandwidth-study-energy-use-and-potential-energy-saving-opportunities-us-petroleum
Energetics (2015b)
Bandwidth Study on Energy Use and Potential Energy Saving Opportunities in U.S. Chemical Manufacturing. Prepared by Energetics Inc. for the U.S. DOE Advanced Manufacturing Office. 2015. http://www.energy.gov/eere/amo/downloads/bandwidth-study-energy-use-and-potential-energy-saving-opportunities-us-chemical
Energetics (2015c)
Bandwidth Study on Energy Use and Potential Energy Saving Opportunities in U.S. Iron and Steel Manufacturing. Prepared by Energetics Inc. for the U.S. DOE Advanced Manufacturing Office. 2015. http://www.energy.gov/eere/amo/downloads/bandwidth-study-energy-use-and-potential-energy-saving-opportunities-us-iron-and
Energetics (2015d)
Bandwidth Study on Energy Use and Potential Energy Saving Opportunities in U.S. Pulp and Paper Manufacturing. Prepared by Energetics Inc. for the U.S. DOE Advanced Manufacturing Office. 2015.
DRAFT

References 33
http://www.energy.gov/eere/amo/downloads/bandwidth-study-energy-use-and-potential-energy-saving-opportunities-us-pulp-and
Hains (2009) Hains, D.H, London I.M., and Merivale C.A. (2009), "Batch solutions to reduce energy demand and carbon footprint in glassmaking," Avalon Rare Metals Inc.
Hopewell (2009)
Hopewell J., Dvorak R. and Kosior E. (2009), “Plastics recycling: challenges and opportunities,” Philosophical Transactions of the Royal Society B 364, pp. 2115-2126
Jacob (2005)
Jacob G.C., Starbuck J.M., Fellers J.F., and Simunovic S. (2005), “Effect of fiber volume fraction, fiber length, and fiber tow size on the energy absorption of chopped carbon fiber-polymer composites,” Polymer Composites 26, pp. 293-305
JEC (2011)
JEC (2011), “Global glass-fibre production: changes across the board” JEC Group News, posted 21 February 2011, available from: http://www.jeccomposites.com/news/composites-news/global-glass-fibre-production-changes-across-board
JEC (2012) JEC (2012), JEC Americas 2012: “The American Composites Market,” available from: http://www.jeccomposites.com/events/jec-show-americas-2012/jec-show-americas-2012/american-composites-market
Krause (2008) Krause F.L. (2008), “Energy Efficiency in Manufacturing: The Role of ICT,” Report of the European Commission Smart Manufacturing Consultation Group.
Martin (2000) Martin et al, “Emerging Energy-Efficient Industrial Technologies,” Lawrence Berkeley National Laboratory (2000)
Pellegrino (2002)
Pellegrino, J., “Glass Industry of the Future: Energy and Environmental Profile of the U.S. Glass Industry,” prepared by Energetics Incorporated for the U.S. DOE Office of Industrial Technologies, April 2002, available from: http://www.nrel.gov/docs/fy02osti/32135.pdf
PlasticsEurope (2005a)
Eco-Profiles of the European Plastics Industry: Polyurethane Rigid Foam. PlasticsEurope. 2005. http://www.plasticseurope.org/plastics-sustainability-14017/eco-profiles.aspx
PlasticsEurope (2005b)
Eco-Profiles of the European Plastics Industry: Polyvinyl Chloride (PVC) (Bulk Polymerization). PlasticsEurope. 2005. http://www.plasticseurope.org/plastics-sustainability-14017/eco-profiles.aspx
PlasticsEurope (2006)
Eco-Profiles of the European Plastics Industry: Liquid Epoxy Resins. PlasticsEurope. 2006. http://www.plasticseurope.org/plastics-sustainability-14017/eco-profiles.aspx
PlasticsEurope (2012)
Eco-Profiles and Environmental Product Declarations of the European Plastics Manufacturers: General-Purpose Polystyrene and High-Impact
DRAFT

Bandwidth Study on Energy Use and Potential Energy Saving Opportunities in the Manufacturing of Lightweight Materials: Glass Fiber Reinforced Polymer Composites
34 References
Polystyrene. PlasticsEurope. 2012. http://www.plasticseurope.org/plastics-sustainability-14017/eco-profiles.aspx
PlasticsEurope (2014a)
Eco-Profiles and Environmental Product Declarations of the European Plastics Manufacturers: Polypropylene (PP). PlasticsEurope. 2014. http://www.plasticseurope.org/plastics-sustainability-14017/eco-profiles.aspx
PlasticsEurope (2014b)
Eco-Profiles and Environmental Product Declarations of the European Plastics Manufacturers: High-Density Polyethylene (HDPE), Low-Density Polyethylene (LDPE), Linear Low-Density Polyethylene (LLDPE). PlasticsEurope. 2014. http://www.plasticseurope.org/plastics-sustainability-14017/eco-profiles.aspx
Rocky Mountain Institute (2013)
Rocky Mountain Institute (2013). Autocomposites Workshop Report. Kickstarting the Widespread Adoption of Automotive Carbon Fiber Composites: Key Findings & Next Steps, January 2013.
Rue (2007)
Rue, D.M.; Servaites, J.; Wolf, W. (2007), “Final Report: Industrial Glass Bandwidth Analysis,” prepared by Gas Technology Institute for the U.S. Department of Energy, available from: http://www.gmic.org/final%20industrial%20glass%20bandwidth%20analysis%202007.pdf
Schepp (2006) Schepp, C. et al. (2006), “Plastics Industry Energy Best Practice Guidebook,” Focus on Energy.
Suzuki & Takahashi (2005)
Suzuki T. and Takahashi J. (2005), “Prediction of Energy Intensity of Carbon Fiber Reinforced Plastics for Mass-Produced Passenger Cars,” 9th Japan International SAMPE Symposium, Nov. 29-Dec. 2, 2005.
Thiriez (2006) Thiriez A. and Gutowski T. (2006), “An environmental analysis of injection molding,” Proceedings of the 2006 ISEE International Symposium on Electronics and the Environment
Wallenberger (2001)
Wallenberger F.T., Watson J.C., and Li H. (2001), Glass Fibers, ASM Handbook, Vol. 2: Composites.
Worrell (2008) Worrell E., Galitsky C., Masanet E., and Graus W. (2008), “Energy Efficiency Improvement and Cost Saving Opportunities for the Glass Industry,” LBNL / EPA
Worrell (2010) Worrell E., Angelini T., and Masanet E. (2010), Managing Your Energy: An ENERGY STAR Guide for Identifying Energy Savings in Manufacturing Plants, LBNL/EPA, LBNL Report No. 3714E.
Yang (2012) Yang Y. et al. (2012), “Recycling of composite materials,” Chemical Engineering and Processing: Process Intensification 51, pp. 53-68
DRAFT

Appendix A1. Master GFRP Composite Summary Tables 35
Appendix A1. Master GFRP Composite Summary Tables Table A1-1. Onsite Energy Intensity and Energy Consumption Estimates for GFRP Composite Manufacturing for the Four Bandwidth Measures, Based on 2010 Production of GFRP Composites for Structural Application Areas
Process Subarea or Sub-Process 2010 Application Area
Production* (million lbs)
Estimated Onsite Energy Intensity** (Btu/lb)
Calculated Onsite Energy Consumption (TBtu/yr)
CT SOA PM TM CT SOA PM TM
Glass Fiber Production
Batching
740
550 140 100 0 0.41 0.10 0.07 0
Melting 2,800 1,430 590 470 2.06 1.06 0.44 0.34
Fiberization 1,880 750 620 -470 1.38 0.55 0.46 -0.34
Finishing 1,650 750 430 0 1.22 0.55 0.32 0
Overall – Fiber Production 6,880 3,070 1,740 0 5.07 2.26 1.29 0
Resin Production
Epoxy resin
740
31,940 26,880 11,320 -120 23.53 19.80 8.34 -0.09
Polyurethane resin 20,140 17,330 7,300 -190 14.83 12.77 5.38 -0.14
Polypropylene (PP) 5,370 4,290 2,310 -1,160 3.95 3.16 1.70 -0.86
High density polyethylene (HDPE) 5,710 4,570 2,450 -1,740 4.20 3.36 1.81 -1.28
Polyvinyl chloride (PVC) 9,710 7,180 3,850 -970 7.15 5.29 2.84 -0.71
Polystyrene (PS) 10,500 8,400 4,510 -470 7.74 6.19 3.32 -0.35
Composite Production
Prepreg
1,470
17,200 13,760 11,360 0 25.34 20.27 16.73 0
Sheet or bulk molding compound 1,510 1,200 990 0 2.22 1.77 1.46 0
Hand lay-up 8,250 6,600 5,450 0 12.16 9.73 8.03 0
Spray up 6,410 5,120 4,230 0 9.44 7.55 6.23 0
Filament winding 1,160 930 770 0 1.71 1.37 1.13 0
Pultrusion 1,330 1,070 420 0 1.96 1.57 0.62 0
Injection molding 4,830 960 710 0 7.11 1.41 1.05 0
Compression molding 4,910 3,920 3,240 0 7.23 5.78 4.77 0
Resin transfer molding 5,500 4,400 3,270 0 8.11 6.49 4.82 0
Vacuum assisted resin infusion 4,390 3,510 2,610 0 6.46 5.17 3.84 0
Autoclave forming 9,570 7,650 3,160 0 14.10 11.28 4.66 0
Cold press 5,070 4,060 3,350 0 7.47 5.98 4.94 0 Total for Glass Fiber Reinforced Polymer Manufacturing***
1,470 28,980 19,380 2,740 -580 42.70 28.55 4.03 -0.86
* Glass fiber production data reflect the total production of finished fibers used in automotive, wind energy, pressure vessel, and aerospace applications. Resin production data indicate the estimated production of all resins for GFRP composites in the application areas, assuming 50 wt% glass fibers. Composites production indicates the total production of GFRP composites (all methods) calculated from the above data.
** Energy intensities reported in terms of Btu per pound of fibers for glass fiber production (all sub-processes), Btu per pound of resin for resin production, and Btu per pound of composite product (fibers and resin) for composites production. The total energy intensity for GFRP composites is reported in Btu per pound of composite product. Feedstock energy is excluded in all values.
*** Total assumes a fiber fraction of 50 wt% glass fibers (the median value in seven automotive case studies considered; see Appendix A2). The polymer material was assumed to be epoxy (for CT and SOA) and polypropylene (for PM). The composite production method was assumed to be autoclave forming (for CT), resin transfer molding (for SOA), and injection molding (for PM). The values included in the total are shown in bold in the table. The formula used for the calculation was: Total GFRP Energy = (0.50*[Fiber Production Energy] + 0.50*[Resin Production Energy] + Composite Production Energy).
DRAFT

Bandwidth Study on Energy Use and Potential Energy Saving Opportunities in the Manufacturing of Lightweight Materials: Glass Fiber Reinforced Polymer Composites
36 Appendix A1. Master GFRP Composite Summary Tables
Table A1-2. Primary Energy Intensity and Energy Consumption Estimates for GFRP Composite Manufacturing for the Four Bandwidth Measures, Based on 2010 Production of GFRP Composites for Structural Application Areas
Process Subarea or Sub-Process 2010 Application Area
Production* (million lbs)
Estimated Primary Energy Intensity** (Btu/lb)
Calculated Primary Energy Consumption (TBtu/yr)
CT SOA PM TM*** CT SOA PM TM***
Glass Fiber Production
Batching
740
1,020 410 300 n/a 0.75 0.30 0.22 n/a
Melting 2,860 1,460 600 n/a 2.11 1.08 0.44 n/a
Fiberization 2,850 1,140 940 n/a 2.10 0.84 0.69 n/a
Finishing 1,820 830 477 n/a 1.34 0.61 0.35 n/a
Overall – Fiber Production 8,550 3,840 2,320 n/a 6.30 2.83 1.71 n/a
Resin Production
Epoxy resin
740
40,490 32,390 13,640 n/a 29.83 23.86 10.05 n/a
Polyurethane resin 27,690 22,150 9,330 n/a 20.40 16.32 6.87 n/a
Polypropylene (PP) 12,420 9,940 5,330 n/a 9.15 7.32 3.93 n/a
High density polyethylene (HDPE) 12,420 9,940 5,330 n/a 9.15 7.32 3.93 n/a
Polyvinyl chloride (PVC) 15,610 11,290 6,060 n/a 11.50 8.32 4.46 n/a
Polystyrene (PS) 17,360 13,890 7,450 n/a 12.79 10.23 5.49 n/a
Composite Production
Prepreg
1,470
51,640 41,310 34,110 n/a 76.09 60.87 50.25 n/a
Sheet or bulk molding compound 4,520 3,620 2,980 n/a 6.66 5.33 4.40 n/a
Hand lay-up 24,790 19,830 16,370 n/a 36.52 29.22 24.12 n/a
Spray up 19,240 15,390 12,710 n/a 28.34 22.67 18.72 n/a
Filament winding 3,490 2,790 2,300 n/a 5.14 4.11 3.39 n/a
Pultrusion 4,000 3,200 1,260 n/a 5.90 4.72 1.85 n/a
Injection molding 14,490 2,880 2,140 n/a 21.36 4.24 3.15 n/a
Compression molding 14,730 11,780 9,730 n/a 21.70 17.36 14.33 n/a
Resin transfer molding 16,530 13,220 9,820 n/a 24.35 19.48 14.47 n/a
Vacuum assisted resin infusion 13,170 10,530 7,830 n/a 19.40 15.52 11.53 n/a
Autoclave forming 28,730 22,990 9,490 n/a 42.33 33.87 13.98 n/a
Cold press 15,230 12,190 10,060 n/a 22.45 17.96 14.82 n/a Total for Glass Fiber Reinforced Polymer Manufacturing****
1,470 53,250 31,330 5,970 n/a 78.46 46.17 8.79 n/a
* Glass fiber production data reflect the total production of finished fibers used in automotive, wind energy, pressure vessel, and aerospace applications. Resin production data indicate the estimated production of all resins for GFRP composites in the application areas, assuming 50 wt% glass fibers. Composites production indicates the total production of GFRP composites (all methods) calculated from the above data.
** Energy intensities reported in terms of Btu per pound of fibers for glass fiber production (all sub-processes), Btu per pound of resin for resin production, and Btu per pound of composite product (fibers and resin) for composites production. The total energy intensity for GFRP composites is reported in Btu per pound of composite product. Feedstock energy is excluded in all values. The conversion from onsite energy intensity to primary was made using process-specific energy mix assumptions (see Appendix A3).
*** Primary energy is not applicable for TM because electric conversion is assumed to be perfect in the theoretical minimum case.
**** Total assumes a fiber fraction of 50 wt% glass fibers (the median value in seven automotive case studies considered; see Appendix A2). The polymer material was assumed to be epoxy (for CT and SOA) and polypropylene (for PM). The composite production method was assumed to be autoclave forming (for CT), resin transfer molding (for SOA), and injection molding (for PM). The values included in the total are shown in bold in the table. The formula used for the calculation was: Total GFRP Energy = (0.50*[Fiber Production Energy] + 0.50*[Resin Production Energy] + Composite Production Energy).
DRAFT

Appendix A2. Fiber Ratios in Structural Lightweighting Applications 37
Appendix A2. Fiber Ratios in Structural Lightweighting Applications To determine a representative fiber-to-resin ratio for lightweight structural applications, seven automotive case studies were compiled from literature sources (see Table A2-1). Each source referenced was an automotive lightweighting study that described the use of a carbon fiber reinforced polymer (CFRP) composite component in a specific lightweighting application (e.g., a vehicle door or chassis). These case studies would fall under the automotive structural application area considered in this bandwidth report. While all of the case studies involved carbon fiber composites (not glass fiber composites), they are referenced in this report to provide continuity with the carbon fiber reinforced composites study in this series. For the sake of comparison, the same fiber fraction was assumed for both fiber-reinforced composite materials (carbon and glass).
Table A2-1. Fiber / Matrix Polymer Ratios: Automotive Case Studies
Case Study Polymer Type*
Fiber Ratio, by Weight %
Fiber Ratio, by Volume % Data Source
Automotive door Epoxy 55 wt% 50 vol% Rocky Mountain Institute (2013)
Automotive body Epoxy 55 wt% 50 vol% Duflou et al. (2009)
Automotive chassis Epoxy 69 wt% 64 vol% Suzuki & Takahashi (2005)
Automotive body PP 46 wt% 32 vol% Suzuki & Takahashi (2005)
Automotive floor pan Polyester 31 wt% 34 vol% Das (2011)
Automotive energy absorber (low) Epoxy 40 wt% 35 vol% Jacob et al. (2005)
Automotive energy absorber (high) Epoxy 50 wt% 45 vol% Jacob et al. (2005)
* assumed densities were 1.6 g/cm3 for fibers; 1.3 g/cm3 for epoxy resin; 0.9 g/cm3 for polypropylene; and 1.9 g/cm3 for polyester.
The CFRP composites described in these seven case studies ranged in composition from 31% to 69% carbon fiber by weight (32 to 64% by volume). The average value was 49 wt% CF and the median value was 50 wt% CF. Based on these statistics, a 50:50 ratio of fibers to polymer resin (by weight) was assumed to be representative of structural composites for the purposes of this study.
DRAFT

Bandwidth Study on Energy Use and Potential Energy Saving Opportunities in the Manufacturing of Lightweight Materials: Glass Fiber Reinforced Polymer Composites
38 Appendix A3. Energy Mix Assumptions
Appendix A3. Energy Mix Assumptions The fuel and electricity requirements for manufacturing processes depend strongly on the specifics of the process: motor-driven processes such as conveyer belts and mixers typically use mostly electric energy, whereas thermal processes generally use mostly fuel energy. In this study, energy mixes were assumed for each sub-process to maximize the accuracy of conversions between onsite and primary energy intensity and consumption (Table A3-1). These energy mixes were generally drawn from the same sources that were used for baseline energy intensity data. Normally the steam generation and transmission losses would be accounted for when converting from onsite to primary energy consumption, but the sources used in this report did not provide that level of detail for the fuel energy data provided. Consequently, the primary energy intensities may be considered conservative as they only contain offsite electricity generation and transmission losses. Composite production processes were assumed to be 100% electric, which is consistent with several sources (Schepp 2006, Das 2011, Thiriez 2006).
An electricity generation efficiency of 33.3% was used to calculate offsite electricity generation losses. The formula used to convert between onsite and primary consumption was as follows:
= +
where Eprimary and Eonsite are the primary and onsite energy consumption values (or energy intensities), respectively, ffuel and felec are the fractions of fuel and electricity usage for the process, respectively, and ε is the electricity generation efficiency.
Table A3-1. Energy Mix Assumptions for GFRP Composite Manufacturing Processes
Process Subarea or Sub-Process Fuel % Electric % Data Source
Glass Fiber Production
Batching 0.0% 100.0% Rue (2007)
Melting 99.0% 1.0% Rue (2007)
Fiberization 74.0% 26.0% Rue (2007)
Finishing 95.0% 5.0% Rue (2007)
Overall – Fiber Production 88.1% 11.9% Rue (2007)
Resin Production: Thermosetting Resins
Epoxy resin 89.8% 10.2% PlasticsEurope (2006)
Polyurethane resin 86.1% 13.9% PlasticsEurope (2005a)
Resin Production: Thermoplastic Resins
Polypropylene (PP) 39.8% 60.2% PlasticsEurope (2014a)
High density polyethylene (HDPE) 45.8% 54.2% PlasticsEurope (2014b)
Polyvinyl chloride (PVC) 71.4% 28.6% PlasticsEurope (2005b)
Polystyrene (PS) 67.4% 32.6% PlasticsEurope (2012)
DRAFT
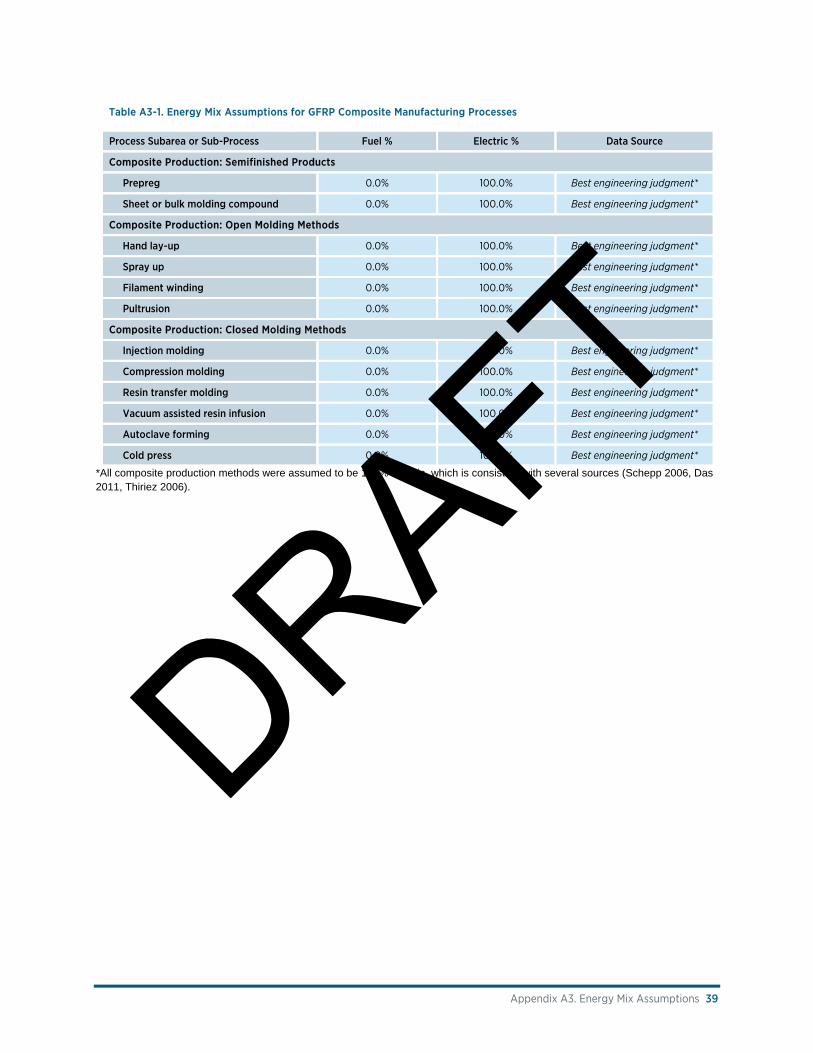
Appendix A3. Energy Mix Assumptions 39
Table A3-1. Energy Mix Assumptions for GFRP Composite Manufacturing Processes
Process Subarea or Sub-Process Fuel % Electric % Data Source
Composite Production: Semifinished Products
Prepreg 0.0% 100.0% Best engineering judgment*
Sheet or bulk molding compound 0.0% 100.0% Best engineering judgment*
Composite Production: Open Molding Methods
Hand lay-up 0.0% 100.0% Best engineering judgment*
Spray up 0.0% 100.0% Best engineering judgment*
Filament winding 0.0% 100.0% Best engineering judgment*
Pultrusion 0.0% 100.0% Best engineering judgment*
Composite Production: Closed Molding Methods
Injection molding 0.0% 100.0% Best engineering judgment*
Compression molding 0.0% 100.0% Best engineering judgment*
Resin transfer molding 0.0% 100.0% Best engineering judgment*
Vacuum assisted resin infusion 0.0% 100.0% Best engineering judgment*
Autoclave forming 0.0% 100.0% Best engineering judgment*
Cold press 0.0% 100.0% Best engineering judgment*
*All composite production methods were assumed to be 100% electric, which is consistent with several sources (Schepp 2006, Das 2011, Thiriez 2006).
DRAFT

Bandwidth Study on Energy Use and Potential Energy Saving Opportunities in the Manufacturing of Lightweight Materials: Glass Fiber Reinforced Polymer Composites
40 Appendix A4. Practical Minimum (R&D) Technologies Considered
Appendix A4. Practical Minimum (R&D) Technologies Considered The PM energy intensity for glass fiber composite manufacturing was determined based on the technologies outlined in Table A4-1. The applicability column indicates the subarea/sub-process where the technology is considered for application. The percent savings over the PM baseline is estimated, along with a brief explanation (Note that the PM baseline energy intensity is considered equal to the SOA energy intensity in this study). Some technologies in Table A4-1 were considered but not included in the final PM model. The excluded technologies were considered incompatible with PM technologies already included in the model, or it was determined that the additional energy savings from the technology were negligible. For example, energy savings opportunities from waste heat recovery were not included in the PM model because it was assumed that savings would be negligible when using a selective heating process (microwave heating) for the melting process step.
Table A4-1. Details of Practical Minimum Technologies Considered
Technology Name Description Applicability Explanation of energy savings assumptions
Percent savings (over
baseline energy)
Included in PM
model?
Reason for excluding (if applicable)
Reference
Motor re-sizing or VSDs
Motors and pumps that are improperly sized cause energy losses that could be avoided with an appropriately sized motor or a variable speed drive motor.
Batching
Worrell et al. estimated a typical energy savings of 8-15% from VSDs for conveyer belt systems used in glass batching. The range was averaged to come up with an overall savings of 12% for batching, which is an all-electric process.
12% Yes
Worrell (2008); Worrell (2010)
Additives to batching solution
Optimum glass batching compositions (including the addition of lithium or mixed alkali additives) can reduce energy required to melt the glass.
Melting
Hains et al. reported energy savings of 3-10% from lithia (Li2O) additives and 2-5% from mixed alkali additives. A 4% energy savings was assumed. Note that the benefits of this technology occur in the melting stage, although it is implemented during batching.
4% Yes Hains (2009)
Recycling of cullet and/or filter dust
Use of cullet and/or filter dust in the glass batch can reduce melting energy.
Melting
A 10% savings was assumed, as Worrell et al. reported that Owens Corning was able to save 10% in energy costs by using 30% cullet in the glass batch. Note that the benefits of this technology occur in the melting stage, although it is implemented during batching.
10% Yes Worrell (2008)
Reduced batch wetting
A small quantity of water is added to the glass batch to reduce dust and prevent separation and non-homogeneity in the batch during transport, but this water increases energy use because it must be evaporated in the furnace. Reducing water content saves energy.
Melting
Worrell et al. indicated that a 1% reduction in the moisture content can provide fuel savings of 0.5% in the glass melting furnace. A 1% total savings was assumed.
1% Yes Worrell (2008) DRAFT
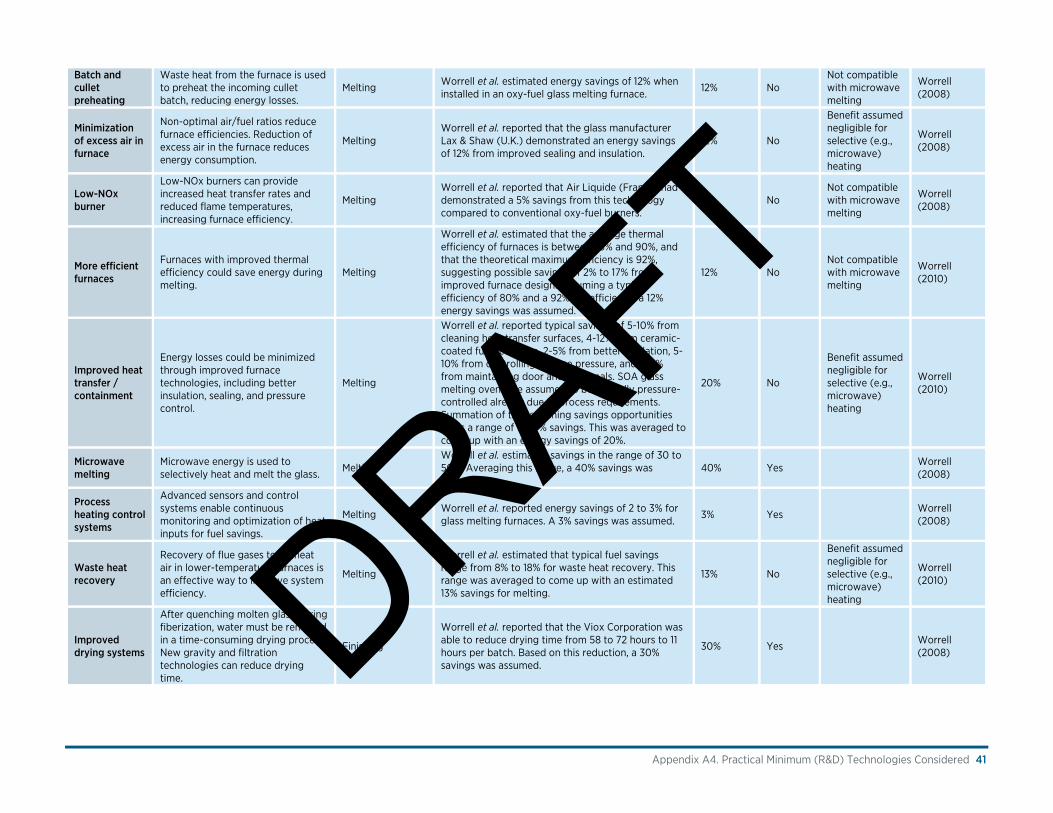
Appendix A4. Practical Minimum (R&D) Technologies Considered 41
Batch and cullet preheating
Waste heat from the furnace is used to preheat the incoming cullet batch, reducing energy losses.
Melting Worrell et al. estimated energy savings of 12% when installed in an oxy-fuel glass melting furnace.
12% No Not compatible with microwave melting
Worrell (2008)
Minimization of excess air in furnace
Non-optimal air/fuel ratios reduce furnace efficiencies. Reduction of excess air in the furnace reduces energy consumption.
Melting Worrell et al. reported that the glass manufacturer Lax & Shaw (U.K.) demonstrated an energy savings of 12% from improved sealing and insulation.
12% No
Benefit assumed negligible for selective (e.g., microwave) heating
Worrell (2008)
Low-NOx burner
Low-NOx burners can provide increased heat transfer rates and reduced flame temperatures, increasing furnace efficiency.
Melting Worrell et al. reported that Air Liquide (France) had demonstrated a 5% savings from this technology compared to conventional oxy-fuel burners.
5% No Not compatible with microwave melting
Worrell (2008)
More efficient furnaces
Furnaces with improved thermal efficiency could save energy during melting.
Melting
Worrell et al. estimated that the average thermal efficiency of furnaces is between 75% and 90%, and that the theoretical maximum efficiency is 92%, suggesting possible savings of 2% to 17% from improved furnace design. Assuming a typical efficiency of 80% and a 92% PM efficiency, a 12% energy savings was assumed.
12% No Not compatible with microwave melting
Worrell (2010)
Improved heat transfer / containment
Energy losses could be minimized through improved furnace technologies, including better insulation, sealing, and pressure control.
Melting
Worrell et al. reported typical savings of 5-10% from cleaning heat transfer surfaces, 4-12% from ceramic-coated furnace tubes, 2-5% from better insulation, 5-10% from controlling furnace pressure, and 0-5% from maintaining door and tube seals. SOA glass melting ovens are assumed to be carefully pressure-controlled already due to process requirements. Summation of the remaining savings opportunities gives a range of 11-29% savings. This was averaged to come up with an energy savings of 20%.
20% No
Benefit assumed negligible for selective (e.g., microwave) heating
Worrell (2010)
Microwave melting
Microwave energy is used to selectively heat and melt the glass.
Melting Worrell et al. estimated savings in the range of 30 to 50%. Averaging this range, a 40% savings was assumed.
40% Yes Worrell (2008)
Process heating control systems
Advanced sensors and control systems enable continuous monitoring and optimization of heat inputs for fuel savings.
Melting Worrell et al. reported energy savings of 2 to 3% for glass melting furnaces. A 3% savings was assumed.
3% Yes Worrell (2008)
Waste heat recovery
Recovery of flue gases to preheat air in lower-temperature furnaces is an effective way to improve system efficiency.
Melting
Worrell et al. estimated that typical fuel savings range from 8% to 18% for waste heat recovery. This range was averaged to come up with an estimated 13% savings for melting.
13% No
Benefit assumed negligible for selective (e.g., microwave) heating
Worrell (2010)
Improved drying systems
After quenching molten glass during fiberization, water must be removed in a time-consuming drying process. New gravity and filtration technologies can reduce drying time.
Finishing
Worrell et al. reported that the Viox Corporation was able to reduce drying time from 58 to 72 hours to 11 hours per batch. Based on this reduction, a 30% savings was assumed.
30% Yes Worrell (2008) DRAFT

Bandwidth Study on Energy Use and Potential Energy Saving Opportunities in the Manufacturing of Lightweight Materials: Glass Fiber Reinforced Polymer Composites
42 Appendix A4. Practical Minimum (R&D) Technologies Considered
Plastics recycling and recovery
Recycling of plastics is currently very limited in composites, but mechanical and other separation technologies could enable reuse.
Polymer Production
Martin et al. reported a 70% energy savings with a 70% applicability for thermoplastic (TP) polymer production (49% savings). Thermosets are more difficult to recycle, but technologies exist; see e.g. Yang (2012). A 70% savings with an applicability of 50% (35% savings) was assumed for thermoset (TS) polymer production.
49% (TP); 35% (TS)
Yes
Martin (2000); Hopewell (2009); Yang (2012)
Barrel insulation
Barrel insulation in closed molding systems enables shorter start-up times and reduces energy use through mitigation of thermal losses.
Injection Molding; Resin Transfer Molding; Vacuum-Assisted Resin Infusion
Schepp et al. estimated that barrel insulation could reduce heating energy by 7% to 25%. A 10% savings was assumed for the applicable composite molding techniques.
10% Yes Schepp (2006)
Infrared heating with emissivity matching
Infrared (radiant) heaters can save heating energy when the IR emissivity is well matched to the thermal characteristics of the polymer material
Pultrusion; Autoclave Forming
Schepp et al. estimated that radiant heaters could reduce energy use by 50%.
50% Yes Schepp (2006)
Improved die design
Proper die design (e.g., achieved through simulation) could reduce scrap rates and improve throughput.
Pultrusion Schepp et al. estimated that rejected product (and the corresponding energy use) could be reduced by 5% through improved die design.
5% Yes Schepp (2006)
Modeling and process analysis
Computer modeling and process analysis are used to improve process performance, e.g., to reduce off-spec material.
Cross-Cutting (all subareas and sub-processes)
Krause reported that modeling and process analysis could provide 5% and 10% energy savings, respectively. Combining these, 14% overall savings were assumed for all steps.
14% Yes Krause (2008)
Process integration / pinch analysis
Process intensification leverages synergies in systems of components working together. Strategies include size and performance matching to reduce bottlenecks (the "pinch")
Cross-Cutting (all subareas and sub-processes)
Martin et al. estimated an energy savings of 10% with 40% applicability, or 4% savings overall.
4% Yes Martin (2000)
In cases where more than one technology was considered for a given subarea/sub-process, the following calculation was used: = ∗ 1 − ∗ 1 − ∗ …∗ 1 −
where PM is the practical minimum energy intensity, PMBaseline is the baseline energy intensity (i.e., the SOA energy intensity), and P1, P2, … Pn are the percent savings for each of the n PM technologies included in the model. Energy savings from different technologies were not considered additive; rather this formula considers technologies as compounding when more than one is applicable to a certain subarea. Energy savings from cross-cutting technologies were applied across all subareas and sub-processes as part of the compounded savings estimate. DRAFT

Appendix A4. Practical Minimum (R&D) Technologies Considered 43
For more information, visit: manufacturing.energy.gov
DOE/EE-1344 • March 2016
DRAFT