glass clean-up systems in mrfs...ngr 5.8% non glass residue total 100% composition of the ngr:...
TRANSCRIPT

CLOSED LOOP FOUNDATION | PAGE 1
NOVEMBER 8, 2017 | NYSAR3
Glass Clean-up Systems in MRFs

We invest in businesses, municipalities and technologies that
optimize product supply chains and build the circular economy
Invest in growth of leading companies that can
catalyze circular supply chain solutions in
apparel, food, electronics, and materials.
Investors Include
Family offices, institutions, individuals
interested in strong financial returns and
measurable social impact.
GROWTH EQUITY
Invest in large scale recycling and circular
economy infrastructure.
Investors Include
PROJECT FINANCERESEARCH &
DEVELOPMENT
Identify and incubate early stage solutions,
builds the investment field.
Partners Include

CLOSED LOOP FOUNDATION | PAGE 3
CLF Deal closed / Near-closing
Affiliated / influenced operator
The Fund’s First Investments: From Collections to Manufacturing
Early pipeline
Export markets
(e.g., Canada)
Impact to date:
• 1.5 million households
represented
• 250,000 tons diverted
• 600,000 MTs of CO2E
reduced
• $4.3 million in direct
economic benefit to
municipalities
• $90 million in co-
investment

CLOSED LOOP FOUNDATION | PAGE 4
Glass in our portfolio
• Escambia County, FL
• New MRF serving 250K hh
• 50,000 tons per year
• Denver, CO
• New glass processor – only
one in CO
• Marketing to bottler,
abrasives, fiberglass
• 75,000 tons per year
• Eddystone, PA
• New manufacturer of foamed
glass aggregate
• Marketing to construction
(e.g., PENNDOT)
• 35,000 tons per year

CLOSED LOOP FOUNDATION | PAGE 5
Is there a productive and cost-effective way to increase the
reuse of glass from material recovery facilities (MRFs)?
The Question

CLOSED LOOP FOUNDATION | PAGE 6
• 9M tons of glass containers generated as MSW
each year
• <3M tons (33%) recovered for reuse, largely as a
result of residential single stream recycling programs
• 6M (67%) tons go to landfill
• Up to 95% could be reused in containers
• The infrastructure and need exists to reuse
substantially more glass
Current Generation
EPA: Glass Generation and Recycling, 1960-2014
Additional yield data available from Glass Recycling Coalition, RRS: http://www.glassrecycles.org/glassrecyclingbenefits

CLOSED LOOP FOUNDATION | PAGE 7
Costs
• Poor glass quality has limited the options for
MRFs. Many are utilizing outlets with a lower
quality standard, such as landfill cover or even
disposal.
MRFs pay disposal
and transportation
costs
Municipalities pay
processing and
disposal costs
Financial costs to the system are
more than $150M per year

CLOSED LOOP FOUNDATION | PAGE 8
The ROI on improving glass clean-up (1)
15,000+ TPY of SS glass• Installed Cost of Clean-up
System: $350K - $1M (2)
• System: adjustable sizing
screens, closed air
separation
• Design: glass removed at
presort, NGR reintroduced to
main line, protected storage
bunkers
MRF savings: + $25/ton• 75+% yield for higher
value glass cullet
• Marketable NGR
commodities (1+%)
• Less fines (< 10%), residue
(< 15%)
(1) Actual results will vary depending on MRF and local market. (2) Does not include cost of downtime at MRF to install new equipment
Disposal: - $35/ton• Discounted landfill tip fees
• Transportation
Higher quality feedstock• 7-8% energy savings and
GHG emissions reductions
• Less contamination
More end markets• Additional opportunities to
create value in established
and emerging markets
More glass is
recycled
MRF

CLOSED LOOP FOUNDATION | PAGE 9
For Single Stream
MRFs
• Revenue from glass
stream
• More volume
• Marketing advantage
• Secure markets for
material
• Transportation (T&D)
savings
Benefits
For MunicipalitiesIn addition to potential MRF
benefits…
• Sustainable home for a
key commodity
• Supports zero waste
goals
• Convenience for
residents
For End Markets
• Lower capex,
operating cost to
get/use higher quality
feedstock
• More secure and
sustainable supply
• Greater yield from
feedstock – competes
better with virgin
material
For Processors
• Lower capex,
operating costs
• Increased
productivity
• Lower disposal
costs

CLOSED LOOP FOUNDATION | PAGE 10
Example #1 – MRF in the Northeast
Before:
• A large single stream MRF generating over 40,000 tpy of glass, paying for glass
to go to glass processor at a significant cost
• First generation clean-up system from 2008
After:
• A $600,000 total investment – vibratory double screen deck, zig- zag air
separation, conveyors, platforms, controls, etc.
• Installed in 2016
• Glass going to same processor (< 50 miles)
• Fines going to alternative aggregate use
• NGR (paper, bottles, cans) going back to system for recovery and commodity
value
• MRF saw an increase in cullet pricing; payback period of less than 2 years

CLOSED LOOP FOUNDATION | PAGE 11
Example #2 – Results
Composition of the clean glass stream:
Description Amount Comments
Glass (¼” – 2”) 93.3%
Fines (< ¼”) 0.9%
NGR 5.8% Non glass residue
Total 100%
Composition of the NGR:
Description Amount Comments
CSP 3.2% Ceramic, stone, porcelain
Organics 1.1%
Metals 1.0%
Residue 0.6%
Total 5.8% Of the total stream
Note: Results from audit conducted in mid-2016 reflect standard specifications (“Fines = ¼” or less”) prior to recent update from ISRI (Nov 2016)

CLOSED LOOP FOUNDATION | PAGE 12
Economic Analysis – Key Drivers
1. Volumes
2. Operations
3. Markets
4. Transportation
5. Financing Terms
Refer to Calculator Tool for details

CLOSED LOOP FOUNDATION | PAGE 13
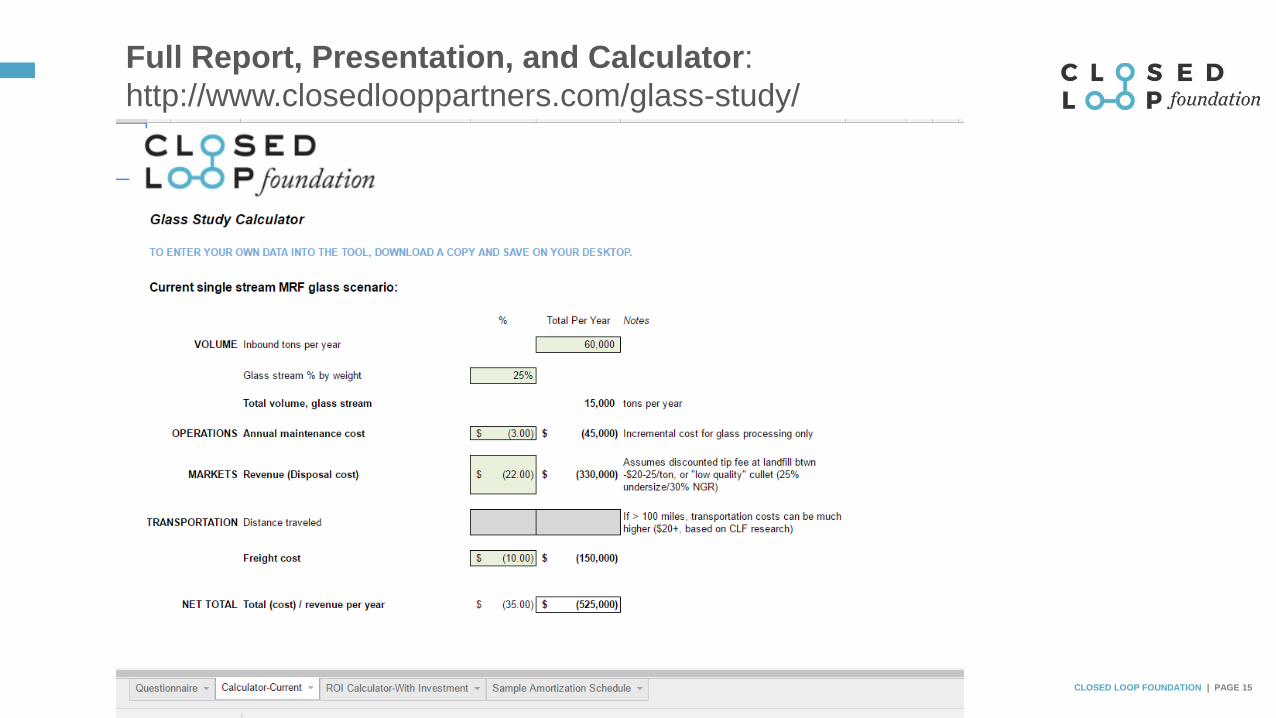
Sample Economic Analysis
Description Tons $/ton Total/year
Disposal 15,000 ($ 22.00) ($ 330,000)
Transportation ($ 10.00) ($ 150,000)
Maintenance ($ 3.00) ($ 45,000)
Total annual cost ($ 35.00) ($ 525,000)
Before
Average size MRF (60,000 TPY) sorts 15,000
TPY of SS glass using minimal/outdated
equipment. Glass goes to local landfill for use as
alternative daily cover.
After (1)
MRF upgrades to new glass clean-up system.
Same volume of glass is marketed to local
processor, generating revenue from glass and
NGR commodities.
Description Tons $/ton Total/year
Marketable glass (2) 11,250 $ 12.40 $ 156,240
Fines (3) 1,350 -0- -0-
NGR commodities 150 $ 150.00 $ 22,500
Residue disposal 2,250 ($ 37.00) ($ 83,250)
Transportation 15,000 ($ 10.00) ($ 150,000)
Maintenance (4) ($ 4.00) ($ 60,000)
Total cost (before financing) ($ 7.63) ($ 114,510)
NET SAVINGS $27.37 $411,510
(1) Scenario assumes no significant change in inbound materials or overall MRF operations; scenario does not include one-time costs, such as downtime during
installation of a new glass clean-up system. (2) Assumes 75% glass yield (incl. 5% NGR, 9% undersize), 1% marketable NGR, 15% residue; actual price/ton
may vary. (3) Additional savings could be gained by marketing fines; (4) based on MRF interviews

CLOSED LOOP FOUNDATION | PAGE 14
Other Levers and Success Drivers
New equipment alone will not ensure benefits to MRFs and municipalities
• Municipalities and MRFs must continue to accept glass
• Municipalities and MRFs should negotiate fair contracts that reflect true
costs/value of glass and minimize volatility
• Processors and manufacturers must be willing to pay for higher quality cullet
in established markets (i.e., move up the price matrix)
• MRFs need access to alternative end markets (e.g., abrasives, aggregates)
that are willing to pay for cullet and fines, and will scale over time
CLOSED LOOP FOUNDATION | PAGE 15
Full Report, Presentation, and Calculator:
http://www.closedlooppartners.com/glass-study/

CLOSED LOOP FOUNDATION | PAGE 16
Appendix

CLOSED LOOP FOUNDATION | PAGE 17
Clean Up Process
Feeding of materialfrom wherever glass is removed via
trommel, disc screen, glass breaker etc.
Size separationUsing a vibratory deck
or trommel screen
Density separationUsing air vacuum and / or
blower
Paper, bottles,
cans, etc.
2”+
Fines, small shredded
paper
¼ - Τ1 8” minus
2” to ¼ - Τ1 8” (1)
Shredded paper,
plastic, etc.
Lights
Glass pieces, ceramic,
stone etc.
Heavies
The best-performing systems:
1. Can be adjusted to differing conditions of glass material
2. Are designed to allow for a longer retention time of the material in the air separation stream
(1) Typical minimum size today is ¼”. ISRI 3-mix standard specifications define fines as smaller than 1/8”, which may change minimum size over time.
http://www.isri.org/docs/default-source/random/mrf-glass-specifications-11-7-16-(002).pdf

CLOSED LOOP FOUNDATION | PAGE 18
Clean-Up Systems
• Both of these recent installations use similar
principles
• Both systems have significantly improved the glass
quality enabling MRF’s to utilize alternative, more
cost-effective, outlets
• For mid-sized MRFs, capital costs can run between
$350,000 to $1M for new equipment installed; costs
will depend on capacity and support equipment
Note: Closed Loop Foundation and Closed Loop Fund do not
endorse any specific equipment manufacturer. The study reviewed
equipment based on performance, with the aim of improving quality
and increasing value at market. Although we gave our best effort to
consider latest designs and technology available, not every
manufacturers’ product was reviewed.