glacial sedimentary processes and products (hambrey/glacial sedimentary processes and products) ||...
TRANSCRIPT

Cenozoic climate and sea level history from glacimarine strata off the Victoria Land coast,
Cape Roberts Project, Antarctica
P.J. BARRETT
Antarctic Research Centre, Victoria University of Wellington, PO Box 600, Wellington, New Zealand (e-mail: [email protected])
ABSTRACT
This paper reviews the record of past climate and sea level from 34 to 17 Ma provided by con-tinuous core through 1500 m of shallow marine strata off the Victoria Land coast of Antarctica. Thesite was selected because it is close to the edge of the East Antarctic Ice Sheet. Previous drillingand seismic surveys had suggested a thick seaward-dipping sequence of Oligocene and older ageclose to the coast. However, the floor of the basin, lower Devonian sandstone, was encounteredbeneath uppermost Eocene conglomerate. The strata were deposited in a rift basin just seawardof the Transantarctic Mountains c. 20 m.y. after uplift began. Sediment was delivered by rivers andglaciers both from and behind the mountains from the East Antarctic interior. Sediment accumula-tion was rapid and the record more complete for the period 34 to 31 m.y., but then slowed as basinsubsidence declined, leaving major time gaps, but still a representative record of the entire timespan. Basin filling kept pace with subsidence. The sedimentary facies – conglomerate, sandstoneand mudstone with marine fossils throughout – are typical of the coastal margin of a subsidingsedimentary basin, with the addition of diamictite beds in the upper 900 m recording marine-terminating glaciers that extended periodically beyond the coast. Deposition was characterised byrepetitive vertical facies successions of conglomerate and fine sandstone in the lower part of thesection and by cyclic facies successions of diamictite, sandstone and mudstone from a few to over60 m thick in the upper part. These are thought to reflect glacio-eustatic changes in sea level ona wave-dominated coast in concert with advance and retreat of piedmont ice onto the continentalshelf, with diamicton and sand (nearshore) grading upwards to mud (shelf ) and then to sand (innershelf to shoreline). Tephra dating of two cycles at 23.98 and 24.22 Ma allows their correlation with40,000 years cycles in the deep-sea isotope record, and ascribed to eustatic sea-level changes of30–60 m. This suggests that the cyclicity of the Cape Roberts section reflects the influence of the earth’s varying orbital parameters on climate and sea level, with over 50 sedimentary cyclespreserved out of the possible 200–400 cycles during this time period. The Cape Roberts sectionalso records a dramatic increase in glacial influence at around 33 Ma, with the proportion of glacialfacies ranging from 10 to 30% of the sedimentary section through to 17 Ma. The section alsorecords a progressive shift from chemical to physical weathering (decline in CIA index and increasein % illite-chlorite) from 33 to 25 Ma, and a decline in marine palynomorphs characteristic of freshmelt water mingling over the same interval. The terrestrial pollen record records interglacial climate and indicates this to be cool temperate for the entire period from 34 to 17 Ma thoughslightly cooler from c. 25 Ma.
Keywords Cape Roberts Project, Cenozoic, palaeoclimate, sequence stratigraphy, glacio-marine facies, Antarctic margin.
GSP_4_C15.qxd 11/5/07 13:38 Page 259
Glacial Sedimentary Processes and Products Edited by Michael J. Hambrey, Poul Christoffersen, Neil F. Glasser and Bryn Hubbard © 2007 International Association of Sedimentologists. ISBN: 978-1-405-18300-0
260 P.J. Barrett
INTRODUCTION
Until the early 1970s it was believed that the iceages spanned just the last 2 million years of earthhistory – the Quaternary Period (Flint, 1971). Thatview changed with the drilling of the Ross Sea andSouthern Ocean in 1973 by the Glomar Challenger,revealing both a physical record of glaciation thatbegan at least 25 million years ago (Hayes andFrakes, 1975) and a proxy record from deep-sea sediments indicating a fall in temperature (andmaybe increase in ice volume) both at the Eocene-Oligocene boundary and in the middle Miocene(Shackleton & Kennett, 1975). The Quaternary iceages had become Cenozoic in their span – at leastin the Southern Hemisphere.
In the decade that followed, analysis of seismicsequences from the world’s continental marginsshowed repeated patterns of coastal advance andretreat on time scales of 105 to 106 years. Thesechanges could be traced back at least to Cretace-ous times, with a significant sea-level fall in mid-Oligocene (Vail et al., 1977); more substance wasadded in a review a decade later by Haq et al.(1987). This new view of the way in which strataare deposited and preserved in basins on con-tinental margins, termed sequence stratigraphy(Posamentier et al., 1988), presumed that cyclicfluctuations of tens to hundreds of metres in sealevel on time scales ranging from hundreds ofthousands to millions of years. Some found flawsin the simple conceptual model from which the early interpretations were made (e.g. Miall, 1991).However, others have shown how the concept canprovide a sound basis for interpreting sea-levelchanges by testing them on well-dated Quaternarystrata, representing a period for which the historyof eustatic sea level change is reasonably wellestablished (e.g. Carter et al., 1991). In the mean-time improvements in chronology of deep-sea coresthrough both biostratigraphy and magnetostrati-graphy have allowed the assembly of a deep-seaoxygen isotope record from many different sites that showed trends in ocean temperature and ice volume (Miller et al., 1987), with an emergingview that the first continent-wide ice sheet formedon Antarctica in earliest Oligocene times (Wise et al., 1991).
The deep-sea isotope community and sequencestratigraphers have both continued to gather their
‘far-field’ proxy data as a basis for interpreting pastclimate and sea-level history through Cenozoic(and older) times (e.g. Zachos et al., 2001; Billups& Schrag, 2003; Miller et al., 2005). At the same timea smaller community has been investigating theAntarctic margin itself for records of past climate,some through seismic surveys and offshore drill-ing under the auspices of the ANTOSTRAT pro-ject (Cooper et al., 1991, 1995) and others throughinvestigations on land (reviewed in Barrett, 1996),though land-based investigations have been frus-trated by the poorly fossiliferous and fragment-ary record of Cenozoic geological history on theAntarctic continent itself.
One location on the Antarctic margin that hasproved especially instructive for Cenozoic climatehistory has been in the southwest corner of the Ross Sea (Fig. 1). Here a series of drilling projectsbetween 1973 and 1999 (reviewed in Hambrey et al., 2002) cored the western margin of the VictoriaLand Basin, one of a north-sound-trending troughsthat form part of the West Antarctic Rift System(Behrendt, 1999). The most recent of the series, theCape Roberts Project, resulted in continuous core(95% recovery) that spans the time period from 34to 17 Ma, and contains a fragmentary, but never-theless valuable, coastal record of varying climate,ice conditions and sea level representing most ofthat period (Cape Roberts Science Team, 1998, 1999,2000). The purpose of this paper is to summarisethe results of this work.
The drilling off Cape Roberts took place from asea-ice platform in three successive field seasons(from late 1997 to late 1999), coring a more-or-less continuous stratigraphic section of 1500 m ofuppermost Eocene to lower Miocene strata (34 to17 Ma). The initial results and scientific reports havebeen published in a series of special issues of TerraAntartica (http://www.mna.it/english/Publications/TAP/terranta.html#Special). The drilling itself wasa significant technical achievement and is docu-mented in Cowie (2002).
This review first outlines the regional setting inwhich the Cenozoic strata off Cape Roberts weredeposited, and the general character and chrono-logy of the sequence. The strata are then describedin terms of a small number of characteristic facies,largely organised as facies successions and inter-preted in terms of a glacial sequence stratigraphicmodel. A case is made for the Oligocene-lower
GSP_4_C15.qxd 11/5/07 13:38 Page 260

Cenozoic climate and sea level history from glacimarine strata off the Victoria Land coast, Cape Roberts Project, Antarctica 261
Fig. 1 Setting for Cape Roberts Project drilling on the western margin of West Antarctic Rift System (from Cape Roberts Science Team, 1998). (A) The Ross Sea region, showing the location of the Victoria Land Basin adjacent to theTransantarctic Mountains, and the location of drill sites in the area; ‘x–y’ shows the section line for B. (B) Cross-sectionfrom the East Antarctic interior across the Transantarctic Mountains to the Ross Sea, showing the proximity of the EastAntarctic Ice Sheet to the Victoria Land Basin, and hence the potential for strata filling the basin to record climatic andtectonic events from this part of the Antarctic margin. The cross-section has been modified to reflect new knowledgefrom the Cape Roberts Project, notably the Beacon sandstone flooring the basin, and a new interpretation of the basin fillfrom Fielding et al. (2006) and Wilson et al. (unpub. data).
GSP_4_C15.qxd 11/5/07 13:38 Page 261

262 P.J. Barrett
Miocene sequence being deposited in a nearshoremarine environment on an open coast with sedi-mentation strongly influenced by both waves andglaciers discharging into the sea. The cycles recordboth glacial maxima when ice flowed from theinland ice sheet that lies to the west through themountains to the coast, at times grounding in the shallow water in the vicinity of the drill site,and periods of glacial retreat, and higher sea levelwhen rivers carried sediment to the coast to be distributed alongshore by waves and currents.Changes in the proportion of glacial facies and inindicators of physical/chemical weathering andtemperature, all of which imply a cooling trend, areshown in terms of discrete time periods throughthe Cape Roberts section, and the implicationsdiscussed.
REGIONAL SETTING
Cape Roberts lies on the Transantarctic MountainFront, a 30-km-wide zone between the rising Trans-antarctic Mountains to the west and the VictoriaLand Basin to the east, and representing the westernmargin of the West Antarctic Rift System (Fig. 1).The Transantarctic Mountain Front extends foraround 1000 km to Cape Adare in the north andover 3000 km to the south, the topographic reliefacross it typically being around 4000 m. Today themountains form a significant barrier to the flow ofice through outlet glaciers to the Ross Ice Shelf andRoss Sea.
The firmest indication of the initial growth of theTransantarctic Mountains comes from fission-trackdata that point to the first significant denuda-tion of the McMurdo sector of the TransantarcticMountains around 55 Ma, though other sectors ofthe Transantarctic Mountains record denudationevents in the late Cretaceous Period also (Fitzgerald,1992). The first direct physical evidence of theTransantarctic Mountains as a significant featurecomes from the oldest strata cored in the CIROS-1 drill-hole, drilled in 1986 70 km south of CapeRoberts. These include granitic clasts eroded fromexposed basement to the west, implying that theTransantarctic Mountains were at least half oftheir present height, for erosion had even then cutthrough the more than 2000 m of Devonian-JurassicGondwana cover beds to basement (Barrett, 1989).
The Transantarctic Mountains are thought to haverisen highest in late Cenozoic time because of the extreme relief they now show between summitand valley floor levels, around 50% more thanmountains in temperate regions (Stern et al., 2005).They attributed this increase in relief to middleMiocene cooling that froze mountain tops while outlet glaciers continued to excavate. This same continent-wide cooling would have also reducedsediment supply to the Antarctic continental shelf.Expansions of the Antarctic Ice Sheet have erodedto the shelf edge since its inception in the earliestOligocene (Hambrey et al., 1992, Anderson, 1999),but the present deep shelf (on average around 500 m) may have resulted from the reduced sedi-ment supply from a largely frozen continent sincemiddle Miocene times.
Today’s extreme topography of the TransantarcticMountains provides a striking contrast to the sub-dued submarine relief across the Ross Sea, as shownin the recent bathymetric compilation by Davey(2004). Provenance studies from cores taken fromthe north-south-trending Victoria Land Basin showthe basin-fill to have been derived from the adjacentmountains themselves (George, 1989; Sandroni &Talarico, 2001). Eastward-dipping basin geometry and late Cenozoic erosion along the TransantarcticMountain Front have exposed the oldest strata inthe basin in several seismic sections perpendicu-lar to the Transantarctic Mountain Front (Cooperet al., 1995), most notably off Granite Harbour(Barrett et al., 1995; Bartek et al., 1996), the site ofthe Cape Roberts Project drill sites. Environmentaland technical constraints required the selection of three sites in order to core the entire sequence(Figs. 2, 3).
Although the Transantarctic Mountains havebeen a persistent feature of the region since earlyCenozoic time, coastal bathymetry today, withvariations in nearshore water-depth from less than100 m to more than 1000 m, is far more extreme than offshore bathymetric variations during thedeposition of the Oligocene–Lower Miocene stratacored off Cape Roberts. The sea-floor relief throughthat period can be gauged from coast-parallel seismic lines (e.g. NBP9601–93), which passed closeto CRP-2/2A (Fig. 4). Resolution is low (~20 m), butthe records show persistent stratification parallel to the coast over distances of many kilometres. This contrasts with the channelling many tens of
GSP_4_C15.qxd 11/5/07 13:38 Page 262
Cenozoic climate and sea level history from glacimarine strata off the Victoria Land coast, Cape Roberts Project, Antarctica 263
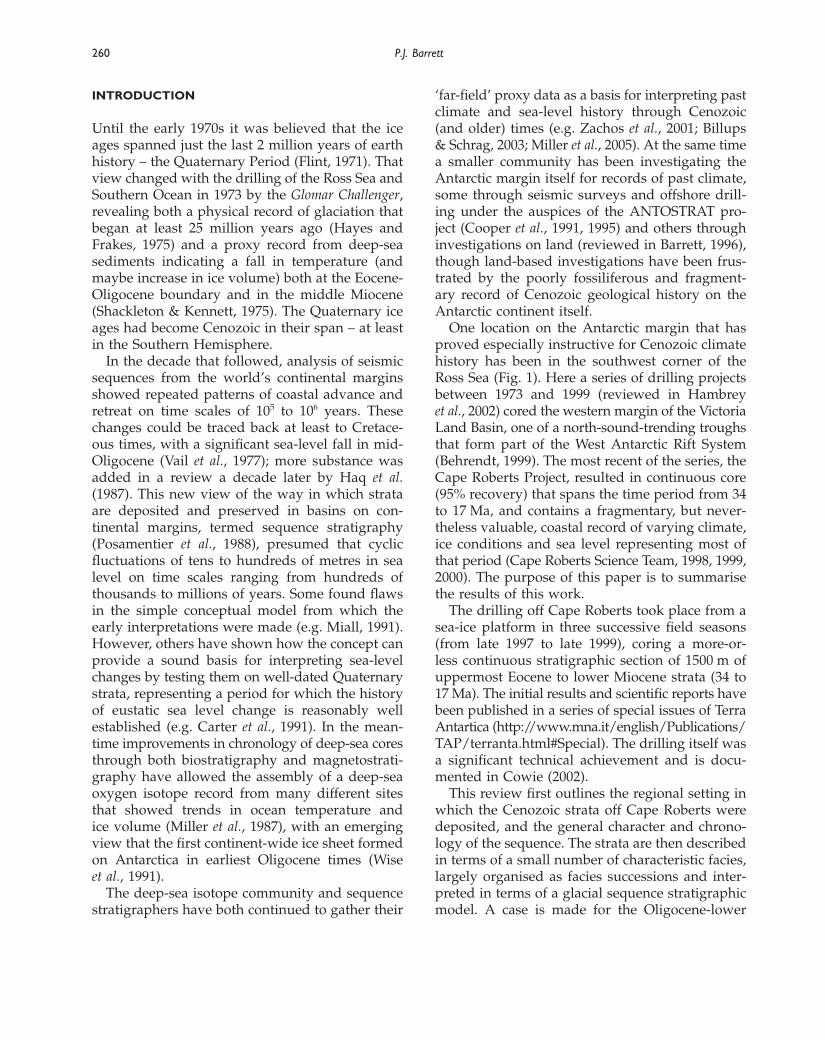
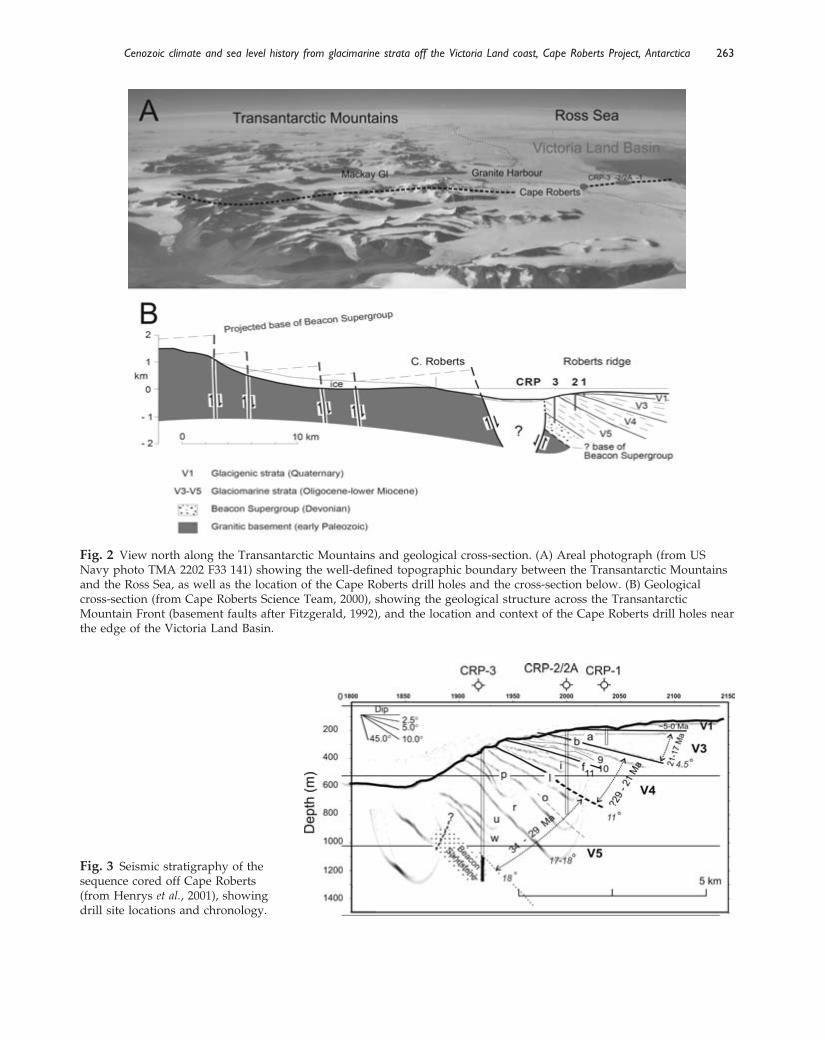
Fig. 2 View north along the Transantarctic Mountains and geological cross-section. (A) Areal photograph (from USNavy photo TMA 2202 F33 141) showing the well-defined topographic boundary between the Transantarctic Mountainsand the Ross Sea, as well as the location of the Cape Roberts drill holes and the cross-section below. (B) Geologicalcross-section (from Cape Roberts Science Team, 2000), showing the geological structure across the TransantarcticMountain Front (basement faults after Fitzgerald, 1992), and the location and context of the Cape Roberts drill holes nearthe edge of the Victoria Land Basin.
Fig. 3 Seismic stratigraphy of thesequence cored off Cape Roberts(from Henrys et al., 2001), showingdrill site locations and chronology.
GSP_4_C15.qxd 11/5/07 13:39 Page 263

264 P.J. Barrett
metres deep and hundreds of m across in younger(?late Miocene or Pliocene) strata, and the extremeQuaternary channelling of the Mackay Glacier toform the Mackay Sea Valley.
In summary, the simple seaward-dippinggeometry and the coast-parallel persistence ofstratification suggested even before drilling that the Cape Roberts section was likely to be a usefulrecorder of ice, sea level and climate for much ofmiddle Cenozoic time.
BACKGROUND TO CORE DESCRIPTION ANDANALYSIS
With the awareness that the project would mostlikely be coring a complex mix of glacial and non-glacial strata that might range from terrestrial toshelf facies, a workshop was convened prior to the drilling to compile a core-logging manual for
consistent visual core description (Hambrey et al.,1997), and agreement on the tasks for core-logpresentation and analysis. The sedimentologicalresults of the project appear in three main forms
1 The Initial Reports, with a project authorship and completed immediately after the drilling. Theseincluded detailed (4 m to a page) core logs, and wereintended to be primarily descriptive.2 The Scientific Reports, with summary descriptions,laboratory analyses and more considered interpreta-tions, with individual authorship, completed withina year of the drilling.3 Subsequent papers in the open literature.
Glacimarine sediments are inherently varied intexture, composition and sedimentary structures,and while a continuous drill core confers signific-ant advantage in providing a continuous strati-graphic record, it gives no indication of the lateral
Fig. 4 View of the Transantarctic Mountains from the Ross Sea (US Navy Photo TMA 1558 F33 69). The seismic section beneath (Henrys et al., 2000), which is roughly perpendicular to the regional dip of the strata, shows the parallelstratification and lateral continuity of Oligocene – lower Miocene section cored by CRP2A. This contrasts with the broadchannelling many tens of metres deep and hundreds of m across in younger (?late Miocene or Pliocene) strata, and thepresent day Mackay Sea Valley which is around 800 m deep and 10 km across.
GSP_4_C15.qxd 11/5/07 13:39 Page 264

Cenozoic climate and sea level history from glacimarine strata off the Victoria Land coast, Cape Roberts Project, Antarctica 265
significance of particular lithologies. Seismic recordsprovide some help in a gross way but only on a scale of tens of metres, being limited by their resolution. As a consequence there were vigor-ous on-site discussions on criteria for the variousfacies, and the meaning and significance of manyfeatures seen in the core, different people havingseen the same feature in different geological con-texts. These issues were resolved mostly throughdiscussion, and an agreement to acknowledge differences in interpretation. This took time and aconsistent and broadly accepted facies scheme wasnot established until the Initial Report on CRP-2/2A was produced (Cape Roberts Science Team,2000). This scheme was tested, and accepted withminor modification for CRP-3 (Cape Roberts ScienceTeam, 2001). It was subsequently used in severalpapers in the Scientific Reports for CRP-2/2A andCRP-3, as well as papers in the open literature(Powell & Cooper, 2002; Hambrey et al., 2002).
A feature of the project has been the developmentof a sequence stratigraphic model for explaining the cycles or facies successions that were evidentthrough most of the cored section. Sequence strati-graphy is fundamentally based on changing relativesea level, and requires a degree of wave energy to erode, remove and deposit sand nearshore andmud offshore as rising and falling sea level drivesmarine transgressions and regressions. Those lead-ing the facies analysis tended to emphasise theglacial aspects of the sediments, whereas those lead-ing the sequence stratigraphy emphasised the roleof sea level. These differences are evident in theearly reports, but have now been resolved (thispaper; Dunbar et al., in press).
The basis of all analyses of the Cape Roberts coreshas been the visual core descriptions, compiled at the Cape Roberts camp from the split core faceby a team of four sedimentologists led by KenWoolfe, who also drafted the 4 m-page logs for corefrom all three sites. These logs were checked, cor-rected and studied further by a separate team ofabout six sedimentologists at Crary Lab, McMurdoStation, led for CRP-1 by Mike Hambrey (CapeRoberts Science Team, 1998), CRP-2/2A by ChrisFielding (Cape Roberts Science Team, 1999) andCRP-3 by Malcolm Laird (Cape Roberts ScienceTeam, 2000).
The Initial Report for each site included a summary description of the core in terms of litho-
stratigraphical units (LSUs), subunits and facieswithin subunits. These were determined normallywithin 48 hours of the core arriving at the camp.The LSUs were a necessary convenience for timelycore description, and were useful for summarydescriptions for the Initial Reports. However, asdrilling proceeded, an appreciation of the whole coregrew, a separate sequence stratigraphic terminologywas developed that recognised the cyclic nature of the section, with sequence boundaries that did not necessarily correspond with lithostratigraphicalunits. For those working on cyclostratigraphicalaspects of the core, sequence boundaries and thesequence numbering scheme of Fielding et al. (2001)became a more convenient reference frame.
The 4 m-per-page logs provide an excellentrecord, along with the core images available on CD,of the gross lithology, of sedimentary structures andof clasts that feature prominently throughout thesequence. The estimates of mud content, however,can be significantly in error in sediments with acoarse ‘tail’ – 12 out of 118 samples from CRP-2/2Awere described as sandstone but found to have sand contents ranging from only 11 to 39% (Barrett& Anderson, 2000). Where trends in mud contentare important for environmental interpretation,then visual core descriptions need to be checkedagainst analytical results.
THE CAPE ROBERTS SECTION
Cape Roberts section is described in terms of 5 sedimentary units, from oldest to youngest:
1 quartz sandstone, 116 m thick, and bearing a verystrong similarity to Devonian sandstone croppingout in the adjacent Transantarctic Mountains;2 conglomerate (uppermost Eocene), 33 m thick;3 sandstone and minor conglomerate (uppermostEocene-lower Oligocene), 460 m thick;4 diamictite, sandstone, mudstone cycles (lowerOligocene-lower Miocene), 1010 m thick;5 diamicton and minor muddy sand (Pliocene,Quaternary), up to 44 m thick.
A lithologic log is shown as Figure 5, and the facies for each unit or facies association arereviewed below, but first the chronology of theCenozoic section is reviewed.
GSP_4_C15.qxd 11/5/07 13:39 Page 265

266 P.J. Barrett
Chronology of the CRP Cenozoic section
The Cenozoic section has been dated from bio-stratigraphical and chronostratigraphical datums in conjunction with a high resolution magneto-stratigraphy. The age models developed duringand after drilling (Cape Roberts Science Team,1998, 1999, 2000; Roberts et al., 1998; Lavelle, 1998;Wilson et al., 2000; Hannah et al., 2001) have nowbeen refined, and summarised by Florindo et al.(2005). A revised chronology, outlined below, hasprovided the basis for Table 1 and the ages of tenmajor lithological divisions (including the basalconglomerate) from 34 to 17 Ma in the Cenozoic pre-Pliocene section.
In particular, an adjustment has been made to the chronology of CRP sequences across theOligocene–Miocene boundary to conform withrecent astrochronological recalibration of this interval(summarised in Gradstein, 2004). The new ‘floating’astronomical calibration relies on a statistical match(coherency) between the climate proxy recordsfrom ODP Site 1090 and the orbital target curve with a time-step of 2.4 Ma. This precludes an agefor the Oligocene–Miocene Boundary of 24.0 Ma as proposed by Wilson et al. (2002), and is also inconsistent with the geomagnetic polarity time-scale (GPTS) of Cande & Kent (1995) and Berggrenet al. (1995).
In the new astrochronology the Ar-Ar tephra ages for normal-polarity sequences 10 and 11(23.98 and 24.22 Ma) place them in short normalpolarity chrons (C7n1n and C7n2n respectively).Consequently, these sequences can be uniquelymatched to individual 40-kyr cycles on the composite oxygen isotope stratigraphy of ODPsites 929/1090 (Naish et al., in press) – c. 600-kyrsearlier than the 40-kyr cycle correlation pre-sented by Naish et al. (2001a). Sequence 9, whose age is constrained only by the 21.44 Ma ash inSequence 8 above, could like in either C6n3n or C6n2n. Thus the Oligocene-Miocene boundary at 23.02 Ma could correspond to the uncon-formities below, or above Sequence 9. Here, it is placed at the base of Sequence 8, represent-ing a period of extensive erosion in the western Ross Sea associated with ice sheet expansionequivalent to global sea-level lowering of ~50 m during the earliest Miocene Mi-1 event (Pekar &DeConto, 2006).
Fig. 5 Lithologic log summarising the section cored bythe Cape Roberts Project (adapted from Barrett, 2001).The chronology has been adjusted to conform to theGradstein et al. (2004) timescale (see Naish et al., in press).
GSP_4_C15.qxd 11/5/07 13:39 Page 266
Cenozoic climate and sea level history from glacimarine strata off the Victoria Land coast, Cape Roberts Project, Antarctica 267
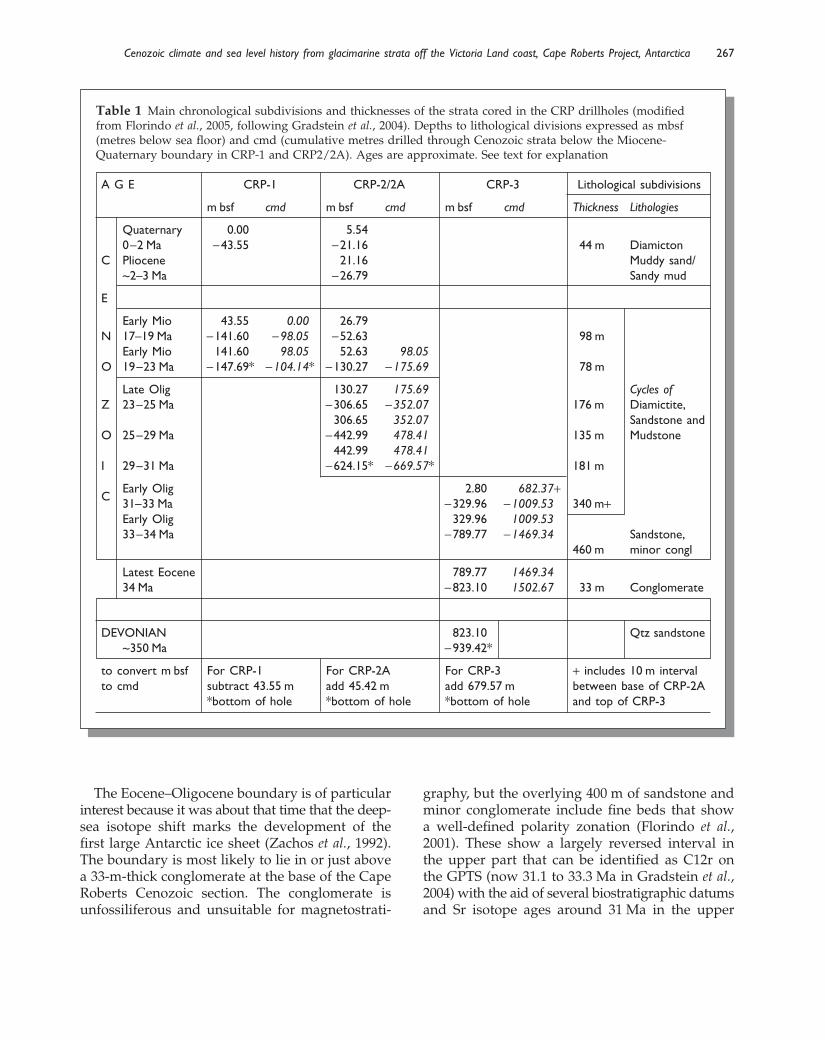
The Eocene–Oligocene boundary is of particularinterest because it was about that time that the deep-sea isotope shift marks the development of the first large Antarctic ice sheet (Zachos et al., 1992).The boundary is most likely to lie in or just abovea 33-m-thick conglomerate at the base of the CapeRoberts Cenozoic section. The conglomerate isunfossiliferous and unsuitable for magnetostrati-
graphy, but the overlying 400 m of sandstone andminor conglomerate include fine beds that show a well-defined polarity zonation (Florindo et al.,2001). These show a largely reversed interval in the upper part that can be identified as C12r on the GPTS (now 31.1 to 33.3 Ma in Gradstein et al.,2004) with the aid of several biostratigraphic datumsand Sr isotope ages around 31 Ma in the upper
Table 1 Main chronological subdivisions and thicknesses of the strata cored in the CRP drillholes (modifiedfrom Florindo et al., 2005, following Gradstein et al., 2004). Depths to lithological divisions expressed as mbsf(metres below sea floor) and cmd (cumulative metres drilled through Cenozoic strata below the Miocene-Quaternary boundary in CRP-1 and CRP2/2A). Ages are approximate. See text for explanation
A G E CRP-1 CRP-2/2A CRP-3 Lithological subdivisions
m bsf cmd m bsf cmd m bsf cmd Thickness Lithologies
Quaternary 0.00 5.540–2 Ma −43.55 −21.16 44 m Diamicton
C Pliocene 21.16 Muddy sand/~2–3 Ma −26.79 Sandy mud
E
Early Mio 43.55 0.00 26.79N 17–19 Ma −141.60 −98.05 −52.63 98 m
Early Mio 141.60 98.05 52.63 98.05O 19–23 Ma −147.69* −104.14* −130.27 −175.69 78 m
Late Olig 130.27 175.69 Cycles of Z 23–25 Ma −306.65 −352.07 176 m Diamictite,
306.65 352.07 Sandstone and O 25–29 Ma −442.99 478.41 135 m Mudstone
442.99 478.41I 29–31 Ma −624.15* −669.57* 181 m
CEarly Olig 2.80 682.37+31–33 Ma −329.96 −1009.53 340 m+Early Olig 329.96 1009.5333–34 Ma −789.77 −1469.34 Sandstone,
460 m minor congl
Latest Eocene 789.77 1469.3434 Ma −823.10 1502.67 33 m Conglomerate
DEVONIAN 823.10 Qtz sandstone~350 Ma −939.42*
to convert m bsf For CRP-1 For CRP-2A For CRP-3 + includes 10 m intervalto cmd subtract 43.55 m add 45.42 m add 679.57 m between base of CRP-2A
*bottom of hole *bottom of hole *bottom of hole and top of CRP-3
GSP_4_C15.qxd 11/6/07 15:13 Page 267

268 P.J. Barrett
200 m of CRP-3 (Hannah et al., 2001). Below thislies a normal interval from 340.8 to 627.3 mbsfidentified as C13n (now 33.27 to 33.74 Ma inGradstein et al., 2004), and a further reversedinterval below with two thin intervals of normalpolarity, regarded as possible cryptochrons(Florindo et al., 2001). The sedimentation rate forthat 0.47 Ma interval is 606 m/m.y., which pro-jects the Eocene–Oligocene boundary (33.9 Ma) tobe just under 100 m deeper ~725 mbsf. The lowerpart of the section is significantly more gravelly,implying a higher sedimentation rate, and theboundary may well be deeper still. However forthis review it is placed at the base of the sand-stone interval in Table 1 and the age rounded to34 Ma. It is worth noting that although a numberof marine palynomorphs were found in samplesfrom the lowest part of this interval (781 and 789 mbsf) they do not contain any elements of the warm late Eocene Transantarctic Flora (Hannah et al., 2001), indicating that the latest Eocene cool-ing took place before sedimentation began in theCape Roberts section.
The first well-dated interval above the CRP-3 core begins at an unconformity in CRP-2A at306.27 mbsf with the appearance of volcanic debrisfrom the McMurdo Volcanic Group. Sanidine wasdated from a clast 13 m above the unconformity at 24.98 Ma, and further clasts, as well as tephras(Fig. 5), have been dated from higher in the core(McIntosh, 2000). As noted above, tephras withincycles 11, 10 and 8 have provided chronological pinning points for the magnetostratigraphy in recognizing Milankovitch cyclicity in this intervalof CRP-2A (Naish et al., 2001a; Naish et al., inpress).
The CRP-2A section below 306.27 mbsf is mag-netostratigraphically complex and has no reli-able biostratigraphic datums. It represents a longtime span (~6 m.y.), but has a significant litho-logical break at 442.99 mbsf, separating a finerdiamictite-poor interval from a diamictite-richinterval above. This boundary also correspondswith seismic reflector ‘l’ of Henrys et al. (2001),shown in Figure 3. The upper part of the lowerinterval includes a number of miliolid shell fragments in place that have yielded Sr ages in the range 29 to 31 Ma. The interval has thereforebeen split into a lower 31–29 Ma unit and anupper 29–25 Ma unit, though it is likely that there
is significant time missing at the unconformities at 442.99 and 306.27 mbsf.
The youngest well-dated tephra in the section,the interval from 109 to 114 mbsf in CRP-2A, pro-vides an age of 21.44 Ma. For the ~160 m of lowerMiocene strata above this the chronology dependson diatom datums, Sr isotope ages and volcanic clast ages with lower precision. However, this is still sufficient to establish an age of around 17 Mafor the youngest few tens of metres of the CapeRoberts section.
The Oligocene–lower Miocene strata are overlainby a thin cover of soft largely Quaternary diamic-ton and muddy sand that is 44 m thick in CRP-1and 27 m thick in CRP-2/2A. The CRP-1 sedimentswere considered entirely late Quaternary on micro-fossil evidence (Cape Roberts Science Team, 1998).Subsequently a shell bed from 32 to 34 mbsf hasbeen the subject of detailed study, and is well-datedfrom magnetostratigraphy, diatom datums and Sr isotopic ratios at 1.1 Ma (Scherer et al., 2006). The 21 m of Late Quaternary diamicton in CRP-2/2A is underlain by 6 m of a sandier diamictonwith Pliocene foraminifera that were considered contemporaneous (Webb & Strong, 2000). The post-Oligocene cover at CRP-3 is less than 3 m thick, andnone was recovered.
Quartz sandstone (Devonian)
The oldest Cape Roberts core is over 100 m oflight reddish brown quartz-cemented quartzsandstone cored form beneath the Cenozoic sec-tion in CRP-3. The strata just below and above the contact are shown in Figure 6. The lithologybelow the contact closely resembles DevonianTaylor Group sandstone 50 km inland and around3000 m higher in the adjacent TransantarcticMountains (Turnbull et al., 1994). The sandstone is well sorted, lacking both pebbles and mud, andwith grain size varying from medium to verycoarse. The bedding in some places is massiveand in others well stratified, with small- andmedium-scale cross-lamination superimposed onthe regional 15° dip. The laminae are typicallydefined by a single grain-size and in places formlow angle ripple structures. Some intervals showcolour mottling that might have resulted fromsoft-sediment deformation or bioturbation. Thisassemblage of features has been interpreted to
GSP_4_C15.qxd 11/5/07 13:39 Page 268

Cenozoic climate and sea level history from glacimarine strata off the Victoria Land coast, Cape Roberts Project, Antarctica 269
represent a sub-humid to semi-arid continentalsetting with both fluvial and aeolian activity(Cape Roberts Science Team, 2000, p. 73). Theinterval also includes a 20-m-thick highly alteredbasic igneous intrusion. This, along with thequartzose nature of the sandstone, led to the correlation of these beds with the lower part of the Beacon Supergroup (Taylor Group) of earlyDevonian age.
Note on Cenozoic facies treatment
The characteristics of each facies in the Cape Robertssection are outlined in Appendix 1 (page 286) and summarised in Table 2, with the proportionsof each facies from each time period shown in Table 3. The summary is based largely on CapeRoberts Science Team (1998, 1999, 2000), Powell et al. (2000, Table 1), and Fielding et al. (2000), withtextural data from De Santis & Barrett (1998),Barrett & Anderson (2000, Table 2) and Barrett(2001, Table 2). The scheme is based on that ofPowell et al. (2000) and Fielding et al. (2000) fordescribing and interpreting the CRP-2/2A core,and adopted from a simplified form used byHambrey et al. (2002) for reviewing the lateOligocene and early Miocene glacimarine sedi-mentation from Ross Sea cores.
Conglomerate (uppermost Eocene)
CRP-3 823–790 mbsf (summarised from Cape Roberts ScienceTeam, 2000)
The oldest bed in the Cenozoic sequence is a 17-cm-thick clast-supported breccia of quartz sand-stone like the bedrock beneath (Fig. 6), overlain by 6 cm of matrix-supported conglomerate of thesame quartz sandstone, in turn overlain by around12 m of coarse conglomerate with cobbles andboulders up to 1.9 m long. The clasts are mostly darkFerrar dolerite, a resistant lithology derived fromsills within the Beacon Supergroup. The remainderof the unit comprises pebbly sandstone beds andcoarse sedimentary breccia of dolerite clasts, whichis also part of a 10-m-thick shear zone that runsthrough the upper part of this interval.
The basal sandstone breccia is interpreted astalus on sloping Taylor Group sandstone, with the overlying dolerite conglomerate brought in byhigh gradient streams. The overlying pebbly sand-stone and breccia is seen as a mix of fluvial andtalus debris. A granitoid clast 8 m above the baseindicates that denudation of the TransantarcticMountains had reached basement by the time this part of the Victoria Land Basin had began tosubside. This interval included a mix of clast-supported and matrix-supported conglomerate,but no evidence of glacial influence in the form offacets or striae was found.
Fig. 6 The floor of the Victoria Land Basin cored inCRP-3, showing the finely laminated reddish brownquartz sandstone of the lower Taylor Group (BeaconSupergroup) overlain at 823.10 mbsf by angularsandstone talus for around 20 cm and then pebble toboulder conglomerate of Ferrar Dolerite. (Modified fromCape Roberts Science Team, 2000.)
GSP_4_C15.qxd 11/5/07 13:39 Page 269

270 P.J. Barrett
Sandstone and subordinate conglomerate (uppermost Eocene-lower Oligocene)
CRP-3 790–330 mbsf (summarised from Cape Roberts ScienceTeam, 2000)
This interval comprises around 460 m of fine- tomedium-grain sandstone, with subordinate thinconglomerate beds, some clast-supported andothers matrix-supported, and mostly in the lower200 m. The sandstones range from vaguely stratifiedto well stratified, mostly parallel-, but with somesmall and medium scale cross-stratification, andsome suggestion of hummocky cross-stratificationwith rare thin intervals of soft-sediment deforma-tion. No biogenic structures were noted. Units are typically thick-bedded, and commonly show a fining upward trend from a thin conglomerate at the base. This is more evident above 480 mbsf,where Fielding et al. (2001) suggested that thebeds show a simple cyclicity that might lend itselfto sequence stratigraphic analysis.
Biogenic indicators are extremely rare, butclearly indicate a marine depositional environ-ment, with a modiolid mussel at 781 mbsf and a gastropod mould at 359 mbsf, and marine paly-
nomorphs occur in five samples between 789 and440 mbsf.
The sandstones in the lower 200 m were initi-ally described as ‘muddy’, giving way up sectionto clean well-sorted sandstones above 580 mbsf. The ‘mud’ has been subsequently identified asdiagenetic smectite (Wise et al., 2001). The post-depositional nature of the ‘mud’ has also beeninferred from the texture of the matrix in these samples, which have virtually no silt but ‘clay’ form-ing between 10 and 21% of the sample (Barrett,2001). These sediments were originally designatedas facies 3, but as the ‘mud’ is post-depositional then they should be included in facies 5, as has been done in Table 2.
The conglomerate clasts are pebble to cobble-sized, and mostly a mix of pre-Devonian granitoidsand Jurassic Ferrar Dolerite, sills of which intrudethe Beacon Supergroup. In addition to the con-glomerate beds the interval also includes a num-ber of isolated out-sized clasts (more than 0.1 m long and more than 100 times larger than theenclosing grain size). Seven of these were striated,the lowest only a few metres above the basal con-glomerate. Striated clasts were also found in the conglomerate beds (Atkins, 2001).
Table 2 A summary of the main CRP lithofacies, based on Powell et al. (2000, 2001), with a brief interpretation.Appendix 1 provides more detail
Lithofacies Depositional process
1. Mudstone; minor lonestones Hemipelagic suspension settling, with iceberg rafting2. Interstratified sandstone and mudstone Hemipelagic settling with sediment gravity-flows or
wave/current action3. Poorly sorted (muddy) very fine to coarse sandstone Sediment gravity-flows or offshore-transition mixing
4/5. Moderately to well sorted, fine to coarse sandstone Nearshore wave-grading and/or current sorting6. Stratified diamictite Subglacial or debris-flow deposition, or heavy rain-out
from floating ice7. Massive diamictite Subglacial melting of basal debris layer8. Sandstone-siltstone rhythmite Suspension settling from turbid plumes9. Clast-supported conglomerate Fluvial or shallow marine deposition; discharge from
subglacial streams?10. Matrix-supported conglomerate Sediment gravity-flows11. Mudstone breccia Mass-flow redeposition or subglacial shearing12. Non-welded lapillistone Airfall of volcanic ash through water; reworking by
currents and gravity flows
GSP_4_C15.qxd 11/5/07 13:39 Page 270
Cenozoic climate and sea level history from glacimarine strata off the Victoria Land coast, Cape Roberts Project, Antarctica 271
This interval was interpreted by most as repres-enting inner shelf sedimentation above fair-weatherwave-base with ice berg influence but no direct evidence of an ice margin close to the site (CapeRoberts Science Team, 2000). A minority viewconsidered the interval to have been dominated by deposition from high-density sediment gravityflows in a deep water base-of-slope setting. How-ever, in view of the stratal geometry and the shallowwater character of the overlying strata this seemsnow most unlikely.
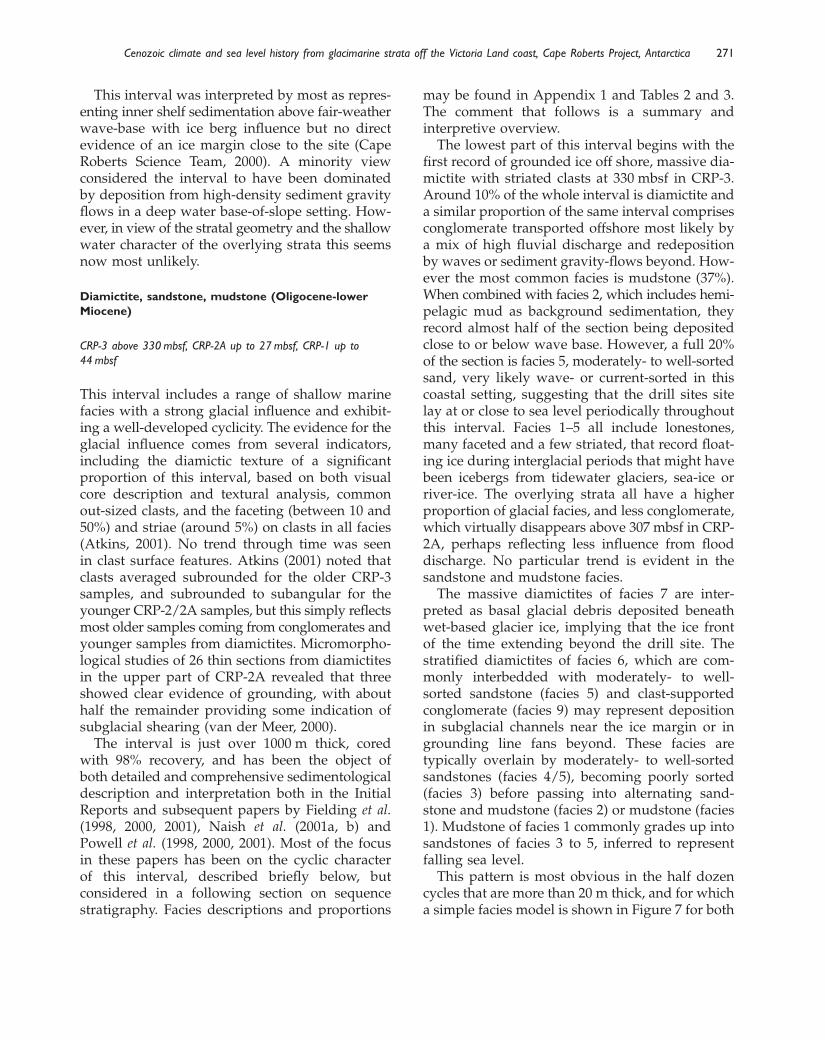
Diamictite, sandstone, mudstone (Oligocene-lowerMiocene)
CRP-3 above 330 mbsf, CRP-2A up to 27 mbsf, CRP-1 up to 44 mbsf
This interval includes a range of shallow marinefacies with a strong glacial influence and exhibit-ing a well-developed cyclicity. The evidence for theglacial influence comes from several indicators,including the diamictic texture of a significantproportion of this interval, based on both visual core description and textural analysis, commonout-sized clasts, and the faceting (between 10 and50%) and striae (around 5%) on clasts in all facies(Atkins, 2001). No trend through time was seen in clast surface features. Atkins (2001) noted thatclasts averaged subrounded for the older CRP-3samples, and subrounded to subangular for theyounger CRP-2/2A samples, but this simply reflectsmost older samples coming from conglomerates andyounger samples from diamictites. Micromorpho-logical studies of 26 thin sections from diamictitesin the upper part of CRP-2A revealed that threeshowed clear evidence of grounding, with abouthalf the remainder providing some indication ofsubglacial shearing (van der Meer, 2000).
The interval is just over 1000 m thick, coredwith 98% recovery, and has been the object of both detailed and comprehensive sedimentologicaldescription and interpretation both in the InitialReports and subsequent papers by Fielding et al.(1998, 2000, 2001), Naish et al. (2001a, b) andPowell et al. (1998, 2000, 2001). Most of the focusin these papers has been on the cyclic character of this interval, described briefly below, but considered in a following section on sequencestratigraphy. Facies descriptions and proportions
may be found in Appendix 1 and Tables 2 and 3.The comment that follows is a summary andinterpretive overview.
The lowest part of this interval begins with thefirst record of grounded ice off shore, massive dia-mictite with striated clasts at 330 mbsf in CRP-3.Around 10% of the whole interval is diamictite anda similar proportion of the same interval comprisesconglomerate transported offshore most likely bya mix of high fluvial discharge and redeposition by waves or sediment gravity-flows beyond. How-ever the most common facies is mudstone (37%).When combined with facies 2, which includes hemi-pelagic mud as background sedimentation, theyrecord almost half of the section being depositedclose to or below wave base. However, a full 20%of the section is facies 5, moderately- to well-sortedsand, very likely wave- or current-sorted in thiscoastal setting, suggesting that the drill sites sitelay at or close to sea level periodically throughoutthis interval. Facies 1–5 all include lonestones,many faceted and a few striated, that record float-ing ice during interglacial periods that might havebeen icebergs from tidewater glaciers, sea-ice orriver-ice. The overlying strata all have a higher proportion of glacial facies, and less conglomerate,which virtually disappears above 307 mbsf in CRP-2A, perhaps reflecting less influence from flood discharge. No particular trend is evident in the sandstone and mudstone facies.
The massive diamictites of facies 7 are inter-preted as basal glacial debris deposited beneath wet-based glacier ice, implying that the ice frontof the time extending beyond the drill site. Thestratified diamictites of facies 6, which are com-monly interbedded with moderately- to well-sorted sandstone (facies 5) and clast-supportedconglomerate (facies 9) may represent depositionin subglacial channels near the ice margin or ingrounding line fans beyond. These facies are typically overlain by moderately- to well-sortedsandstones (facies 4/5), becoming poorly sorted(facies 3) before passing into alternating sand-stone and mudstone (facies 2) or mudstone (facies1). Mudstone of facies 1 commonly grades up intosandstones of facies 3 to 5, inferred to representfalling sea level.
This pattern is most obvious in the half dozencycles that are more than 20 m thick, and for whicha simple facies model is shown in Figure 7 for both
GSP_4_C15.qxd 11/5/07 13:39 Page 271
272 P.J. Barrett
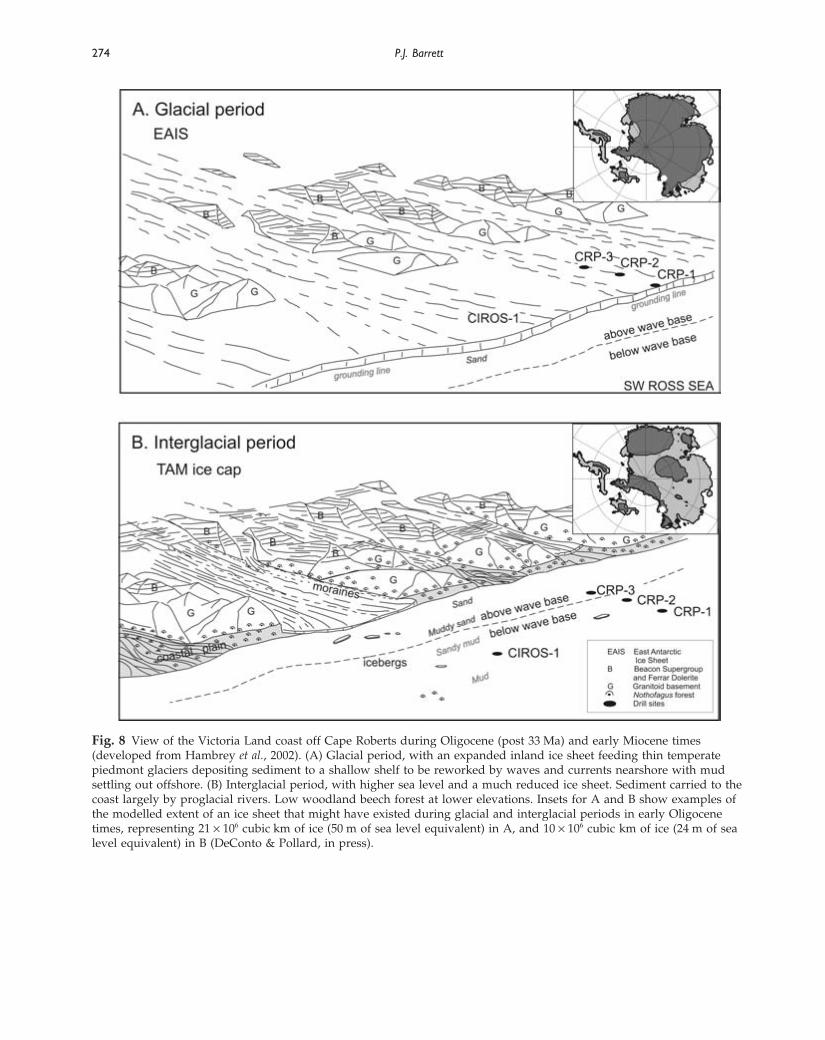
glacial and interglacial times. A perspective view ofthe Victoria Land coast for both glacial and inter-glacial times is shown as Figure 8. Detailed studiesof the core indicate far more complexity than can be depicted here, particularly with regard todecimetre-scale soft sediment deformation, and in a few places metre–scale brecciated intervals,which have been variously interpreted as a resultof slope instability, mass movement and subglacialshearing. Redeposition by sediment gravity flowsmay well have also been active from time to time.Nevertheless the context of an open coast outlinedearlier, and the nature of the diatom flora suggesta relatively nearshore marine environment, withcoastal neritic diatoms dominating over open oceantypes (Scherer et al., 2000). Indeed in early Miocenetimes waters were occasionally sufficiently shallowfor a significant proportion of benthic diatoms tobe deposited (Harwood et al., 1998).
Diamicton, muddy sandstone (Pliocene, Quaternary)
CRP-2/2A above 26.79 mbsf, CRP-1 above 43.55 mbsf
The strata above the lower Miocene section areentirely Quaternary in age at CRP-1. Little wasrecovered above 19 mbsf, but below this it com-prised largely unlithified diamicton with clasts ofdolerite and granite up to boulder size, and lessermuddy sand beds with scattered pebbles. The dia-mictons are presumed to have formed closing tothe grounding line of an ice shelf or glacier tonguewhen ice that was covering the nearby foothills wasmore extensive than that of today. Powell et al. (1998)provide a useful perspective view of the VictoriaLand coast at this time.
A shelly interval between 33.75 and 31.90 mbsfin CRP-1 has yielded a macrofossil fauna of morethan 60 species (Taviani et al., 1998, Taviani &
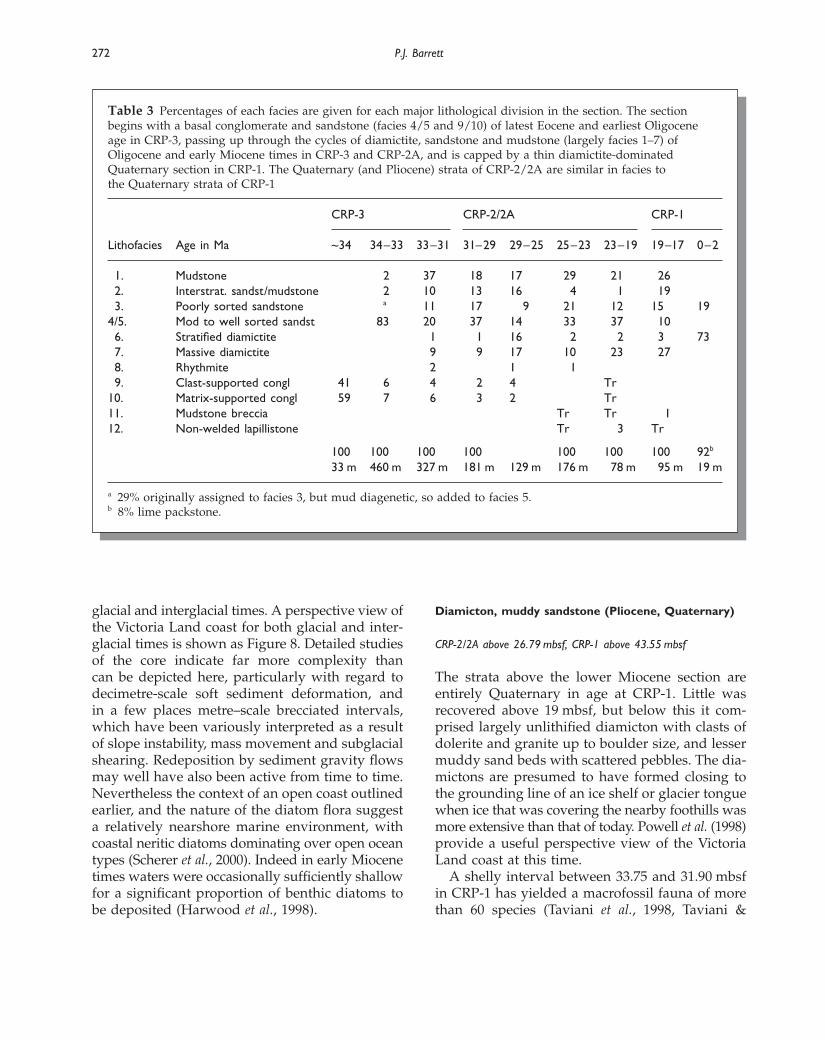
Table 3 Percentages of each facies are given for each major lithological division in the section. The sectionbegins with a basal conglomerate and sandstone (facies 4/5 and 9/10) of latest Eocene and earliest Oligocene age in CRP-3, passing up through the cycles of diamictite, sandstone and mudstone (largely facies 1–7) ofOligocene and early Miocene times in CRP-3 and CRP-2A, and is capped by a thin diamictite-dominatedQuaternary section in CRP-1. The Quaternary (and Pliocene) strata of CRP-2/2A are similar in facies to the Quaternary strata of CRP-1
CRP-3 CRP-2/2A CRP-1
Lithofacies Age in Ma ~34 34–33 33–31 31–29 29–25 25–23 23–19 19–17 0–2
1. Mudstone 2 37 18 17 29 21 262. Interstrat. sandst/mudstone 2 10 13 16 4 1 193. Poorly sorted sandstone a 11 17 9 21 12 15 19
4/5. Mod to well sorted sandst 83 20 37 14 33 37 106. Stratified diamictite 1 1 16 2 2 3 737. Massive diamictite 9 9 17 10 23 278. Rhythmite 2 1 19. Clast-supported congl 41 6 4 2 4 Tr
10. Matrix-supported congl 59 7 6 3 2 Tr11. Mudstone breccia Tr Tr 112. Non-welded lapillistone Tr 3 Tr
100 100 100 100 100 100 100 92b
33 m 460 m 327 m 181 m 129 m 176 m 78 m 95 m 19 m
a 29% originally assigned to facies 3, but mud diagenetic, so added to facies 5.b 8% lime packstone.
GSP_4_C15.qxd 11/5/07 13:39 Page 272

Cenozoic climate and sea level history from glacimarine strata off the Victoria Land coast, Cape Roberts Project, Antarctica 273
Beu, 2003). They are largely molluscs (>40 species)followed by bryozoa (>14 species) and poly-chaetes (3 species). Diatoms are largely species of Fragiliopsis and Thalassiosira, with few sea ice-related diatoms, indicating ice-free conditions formuch of the year (Bohaty et al., 1998). Recent workhas shown the age of this interval to correspondto Marine Isotope Stage 31 at 1.07 Ma (Scherer et al., 2006).
Quaternary diamicton with minor sand wasencountered in CRP-2, the first hole drilled in1999, although little was recovered of the top 5 m.The diamicton contains abundant marine benthicQuaternary foraminifera. Below 21 mbsf, how-ever, a 6-m-thick interval of muddy sand includesa 2.4-m-thick bed of diamicton with an in situforaminiferal fauna of 21 marine benthic species
that indicate a Pliocene age (Webb & Strong, 1998).These authors noted deposits of similar age abovesea level in lower Taylor Valley and Wright in the Dry Valleys region of adjacent Victoria Land,which implies ~200 m of post-Pliocene uplift acrossthe Transantarctic Mountain Front.
SEQUENCE STRATIGRAPHIC ANALYSIS
Cenozoic glacial and sea-level cycles in the VictoriaLand Basin were first recognised in late Oligoceneglacigenic strata cored by MSSTS-1, a drill-hole off New Harbour 70 km south of Cape Roberts in 1979 (Barrett, 1986; Barrett et al., 1987). Sub-sequently Hambrey et al. (1989) strengthened theconcept using a simple facies approach to interpret
Fig. 7 Facies model for the deposition of sedimentary strata off Cape Roberts during Oligocene (post 33 Ma) and earlyMiocene times (developed from Hambrey et al., 1989) for glacial (A) and interglacial (B) periods. In both cases wave-and/or current-sorted sand near the shore grade into mud below wave base offshore. During glacial periods glaciersdeposited sediment directly over the drillsites as the ice margin advanced beyond them. During interglacial periodssediment was delivered to the coast largely by rivers but striated lonestones suggest some glacial ice still reached thecoast in a few places.
GSP_4_C15.qxd 11/5/07 13:39 Page 273
274 P.J. Barrett
Fig. 8 View of the Victoria Land coast off Cape Roberts during Oligocene (post 33 Ma) and early Miocene times(developed from Hambrey et al., 2002). (A) Glacial period, with an expanded inland ice sheet feeding thin temperatepiedmont glaciers depositing sediment to a shallow shelf to be reworked by waves and currents nearshore with mudsettling out offshore. (B) Interglacial period, with higher sea level and a much reduced ice sheet. Sediment carried to thecoast largely by proglacial rivers. Low woodland beech forest at lower elevations. Insets for A and B show examples ofthe modelled extent of an ice sheet that might have existed during glacial and interglacial periods in early Oligocenetimes, representing 21 × 106 cubic km of ice (50 m of sea level equivalent) in A, and 10 × 106 cubic km of ice (24 m of sealevel equivalent) in B (DeConto & Pollard, in press).
GSP_4_C15.qxd 11/5/07 13:39 Page 274
Cenozoic climate and sea level history from glacimarine strata off the Victoria Land coast, Cape Roberts Project, Antarctica 275
~300 m of upper Oligocene-lower Miocene stratafrom the nearby CIROS-1 drill hole in terms ofglacial advance and retreat coinciding with sea-level fall and rise. However, the chronology ofthese strata was not sufficiently well established for correlating the cycles with the deep-sea oxygenisotope curve of Miller et al. (1987) and the Haq et al. (1987) onlap-offlap curve.
One of the goals of the Cape Roberts Project wasto obtain a better-dated record of this time period,and at the same time apply a sequence stratigraphicapproach to the Cape Roberts section. This was firstachieved by Fielding et al. (1998) in the eight lowerMiocene cycles from CRP-1, recognising a patternof unconformity-based diamictite followed bysand and then mudstone as representing a retreatof the ice front over the drill site and a rise in sealevel. However they noted that ‘it is not gener-ally possible to differentiate between true eustaticsignals and local glacial advance/retreat cycles.’Although the chronology of CRP-1 was an improve-ment over CIROS-1, uncertainties of ~1 m.y. pre-
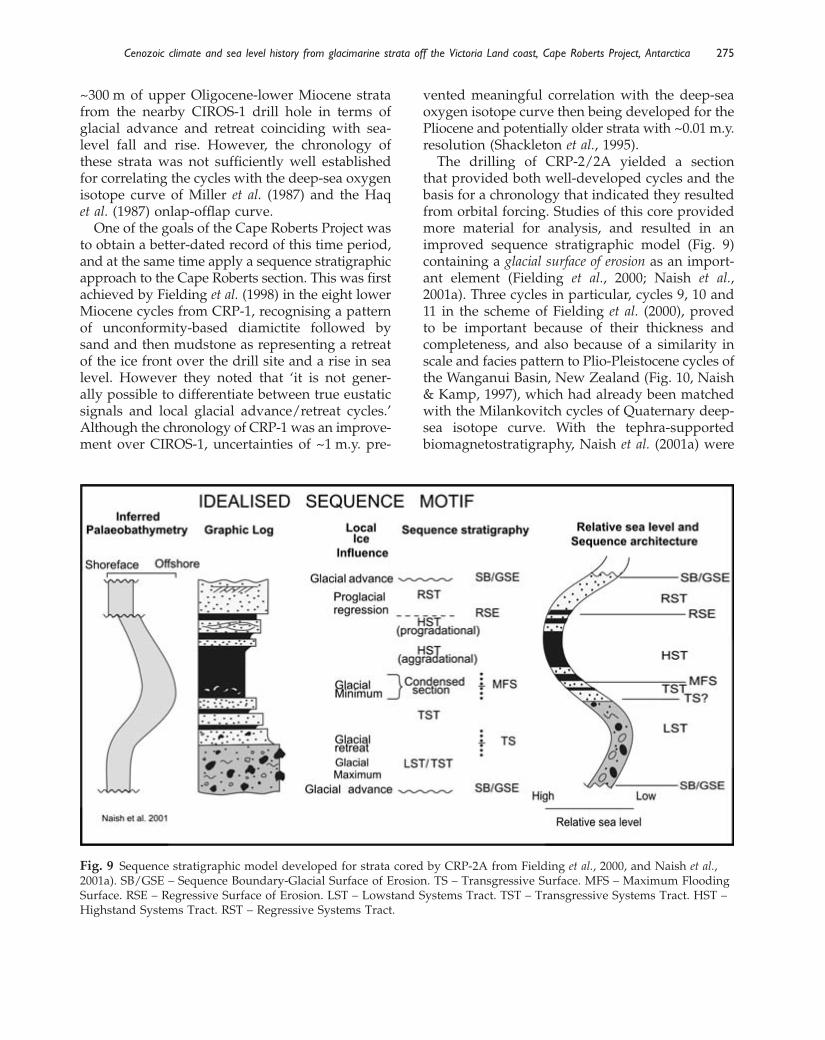
Fig. 9 Sequence stratigraphic model developed for strata cored by CRP-2A from Fielding et al., 2000, and Naish et al.,2001a). SB/GSE – Sequence Boundary-Glacial Surface of Erosion. TS – Transgressive Surface. MFS – Maximum FloodingSurface. RSE – Regressive Surface of Erosion. LST – Lowstand Systems Tract. TST – Transgressive Systems Tract. HST –Highstand Systems Tract. RST – Regressive Systems Tract.
vented meaningful correlation with the deep-seaoxygen isotope curve then being developed for thePliocene and potentially older strata with ~0.01 m.y.resolution (Shackleton et al., 1995).
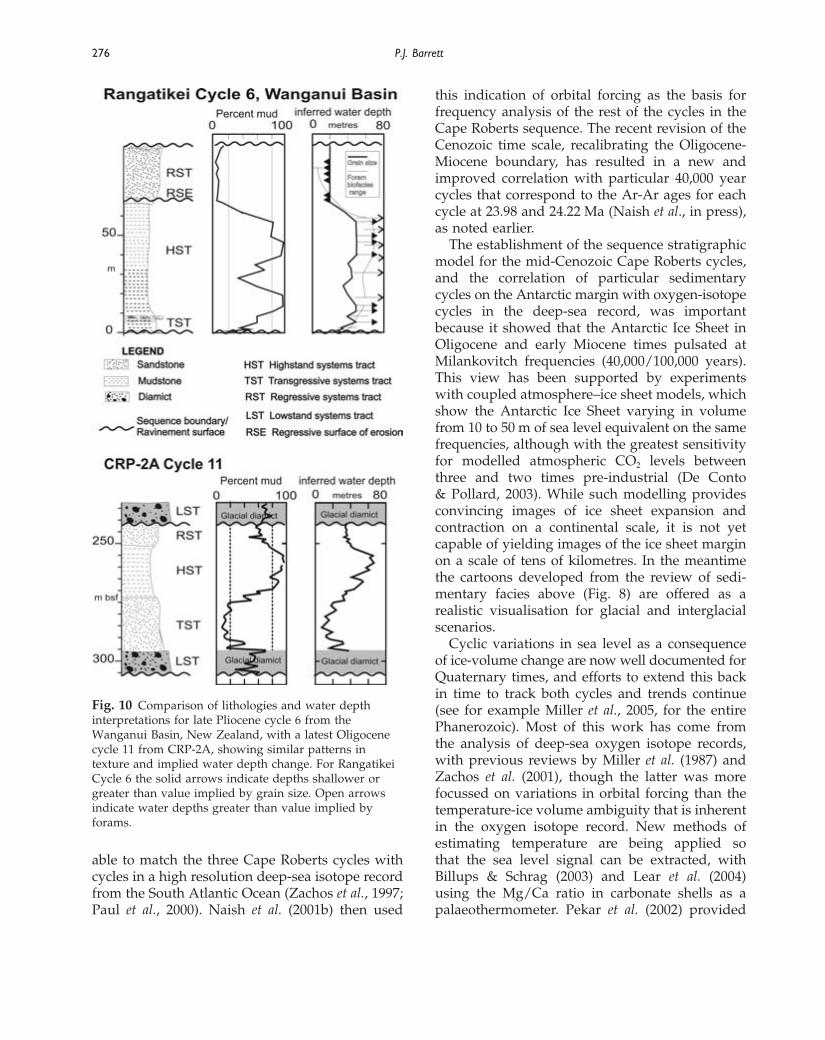
The drilling of CRP-2/2A yielded a section that provided both well-developed cycles and thebasis for a chronology that indicated they resultedfrom orbital forcing. Studies of this core providedmore material for analysis, and resulted in animproved sequence stratigraphic model (Fig. 9)containing a glacial surface of erosion as an import-ant element (Fielding et al., 2000; Naish et al.,2001a). Three cycles in particular, cycles 9, 10 and11 in the scheme of Fielding et al. (2000), provedto be important because of their thickness andcompleteness, and also because of a similarity inscale and facies pattern to Plio-Pleistocene cycles ofthe Wanganui Basin, New Zealand (Fig. 10, Naish& Kamp, 1997), which had already been matchedwith the Milankovitch cycles of Quaternary deep-sea isotope curve. With the tephra-supported biomagnetostratigraphy, Naish et al. (2001a) were
GSP_4_C15.qxd 11/5/07 13:39 Page 275
276 P.J. Barrett
able to match the three Cape Roberts cycles withcycles in a high resolution deep-sea isotope recordfrom the South Atlantic Ocean (Zachos et al., 1997;Paul et al., 2000). Naish et al. (2001b) then used
this indication of orbital forcing as the basis for frequency analysis of the rest of the cycles in theCape Roberts sequence. The recent revision of theCenozoic time scale, recalibrating the Oligocene-Miocene boundary, has resulted in a new andimproved correlation with particular 40,000 yearcycles that correspond to the Ar-Ar ages for eachcycle at 23.98 and 24.22 Ma (Naish et al., in press),as noted earlier.
The establishment of the sequence stratigraphicmodel for the mid-Cenozoic Cape Roberts cycles,and the correlation of particular sedimentarycycles on the Antarctic margin with oxygen-isotopecycles in the deep-sea record, was importantbecause it showed that the Antarctic Ice Sheet inOligocene and early Miocene times pulsated atMilankovitch frequencies (40,000/100,000 years).This view has been supported by experimentswith coupled atmosphere–ice sheet models, whichshow the Antarctic Ice Sheet varying in volume from 10 to 50 m of sea level equivalent on the samefrequencies, although with the greatest sensitivityfor modelled atmospheric CO2 levels betweenthree and two times pre-industrial (De Conto & Pollard, 2003). While such modelling providesconvincing images of ice sheet expansion and contraction on a continental scale, it is not yetcapable of yielding images of the ice sheet marginon a scale of tens of kilometres. In the meantimethe cartoons developed from the review of sedi-mentary facies above (Fig. 8) are offered as a realistic visualisation for glacial and interglacial scenarios.
Cyclic variations in sea level as a consequenceof ice-volume change are now well documented forQuaternary times, and efforts to extend this backin time to track both cycles and trends continue (see for example Miller et al., 2005, for the entirePhanerozoic). Most of this work has come from the analysis of deep-sea oxygen isotope records,with previous reviews by Miller et al. (1987) andZachos et al. (2001), though the latter was morefocussed on variations in orbital forcing than thetemperature-ice volume ambiguity that is inherentin the oxygen isotope record. New methods ofestimating temperature are being applied so that the sea level signal can be extracted, withBillups & Schrag (2003) and Lear et al. (2004)using the Mg/Ca ratio in carbonate shells as apalaeothermometer. Pekar et al. (2002) provided
Fig. 10 Comparison of lithologies and water depthinterpretations for late Pliocene cycle 6 from theWanganui Basin, New Zealand, with a latest Oligocenecycle 11 from CRP-2A, showing similar patterns intexture and implied water depth change. For RangatikeiCycle 6 the solid arrows indicate depths shallower orgreater than value implied by grain size. Open arrowsindicate water depths greater than value implied byforams.
GSP_4_C15.qxd 11/5/07 13:39 Page 276

Cenozoic climate and sea level history from glacimarine strata off the Victoria Land coast, Cape Roberts Project, Antarctica 277
glacio-eustatic estimates by calibrating detrendedapparent sea-level amplitudes to δ18O amplitudesfor Oi-events in deep-sea records (Pekar et al.,2002), with Pekar and DeConto (2006) arguing forsea level (and ice-volume) fluctuations of between30 and 60 m in early Miocene times.
The sequence stratigraphic model for the 54 cyclesdeposited off Cape Roberts from 31 to 17 millionyears ago suggests an independent approach toestimating past sea-level change based on the phys-ical characteristics of nearshore sediments. Dunbar& Barrett (2005) studied patterns of sedimentationfor coastal nearshore sediments, and reaffirmed thelong-standing awareness that where the coast isaggrading, the sea floor sediment texture changesprogressively from beach sand to offshore mud(Johnson, 1919; Swift, 1971). More importantly theyshowed a consistent relationship between mud-percent and water depth, on both seasonal anddecadal time scales, and a further relationshipbetween mud percent at a specified depth and waveenergy. They concluded that if the wave climatewere persistent for nearshore sediments on an opencoast then variations in mud content could be usedas a proxy for water depth, and if the strength ofthe wave climate could be estimated then valuesfor water depth could also be determined.
This approach was tested with a late Pleistoceneand a late Pliocene cycle from the WanganuiBasin, New Zealand, assuming with strong evidencethat wave climate was similar to that of today, andwhere independent water depths could be estimatedfrom foraminifera. There was close agreement.The textural approach has an advantage in higherresolution for depth trends, though there is lowerconfidence in depth values on account of theassumption regarding wave climate. Also it can-not register changes in water depths below wavebase, where sediment is invariably mud, unless the coast is influenced by strong geostrophic or tidalcurrents or sediment gravity-flows, which haverecognisable characteristics. Preliminary tests ofthis approach for the Cape Roberts cycles assum-ing a moderate wave climate indicate water-depthvariations of several tens of metres (Fig. 10, Dunbaret al., 2003; see also Dunbar et al., 2007).
The interpretation of the Oligocene-lowerMiocene Cape Roberts cycles offered here is basedon two key points, the first inferred and the secondobserved:
1 Sediment was supplied by glaciers and rivers to asubsiding basin from the west across a long, straightopen coast, and2 The geometry of the strata parallel to the coast ispersistent and planar.
The sequence stratigraphic interpretation, sup-ported by textural patterns of modern coastal sedi-ments, requires cyclic changes in sea level as theprimary control on sedimentary facies architecture.However, without doubt the glacial influence, indic-ated by the diamictites, sediment gravity flows, sediment deformation and lonestones, is clear andextensive. This interpretation leads to two signific-ant conclusions, one for tectonic history and theother for the value of the Cape Roberts section asa recorder of climate on the Antarctic margin.
1 The well-sorted sandstone facies closely associatedwith diamictite at many levels through the section indi-cates a regular return to sea level throughout the 17m.y. history of the Cape Roberts section. Hence, theinitially rapid and then declining net sedimentation-rate throughout the section records the subsidence history of the basin, and indeed this observation hasbeen used in a new view of the tectonic history of the Victoria Land Basin (Fielding et al., 2006; Wilsonet al., unpublished data).2 A total of 54 cycles have been identified throughthe Cape Roberts section covering the period from 33 to 17 Ma (Fielding et al., 2001; Naish et al., 2001b).However there were most likely between 160 and 400orbitally forced cycles in that time period, dependingon the relative influence of eccentricity (100,000 years)and obliquity (40,000 years). Hence only 15 to 35% ofthese cycles have been preserved. However, these stillhave value for the glacial lowstands and interglacialhighstands they record at many points through this16 million year time-span.
CLIMATE TRENDS FROM THE CAPE ROBERTSSECTION
The Cape Roberts section records many cyclicvariations in ice extent and sea level, as arguedabove. Here we review long-term trends in somesimple climate proxies for the period representedby Cape Roberts (34 to 17 Ma). The proportion of glacial facies in the section are shown, but themore significant climate proxies are considered
GSP_4_C15.qxd 11/5/07 13:39 Page 277
278 P.J. Barrett
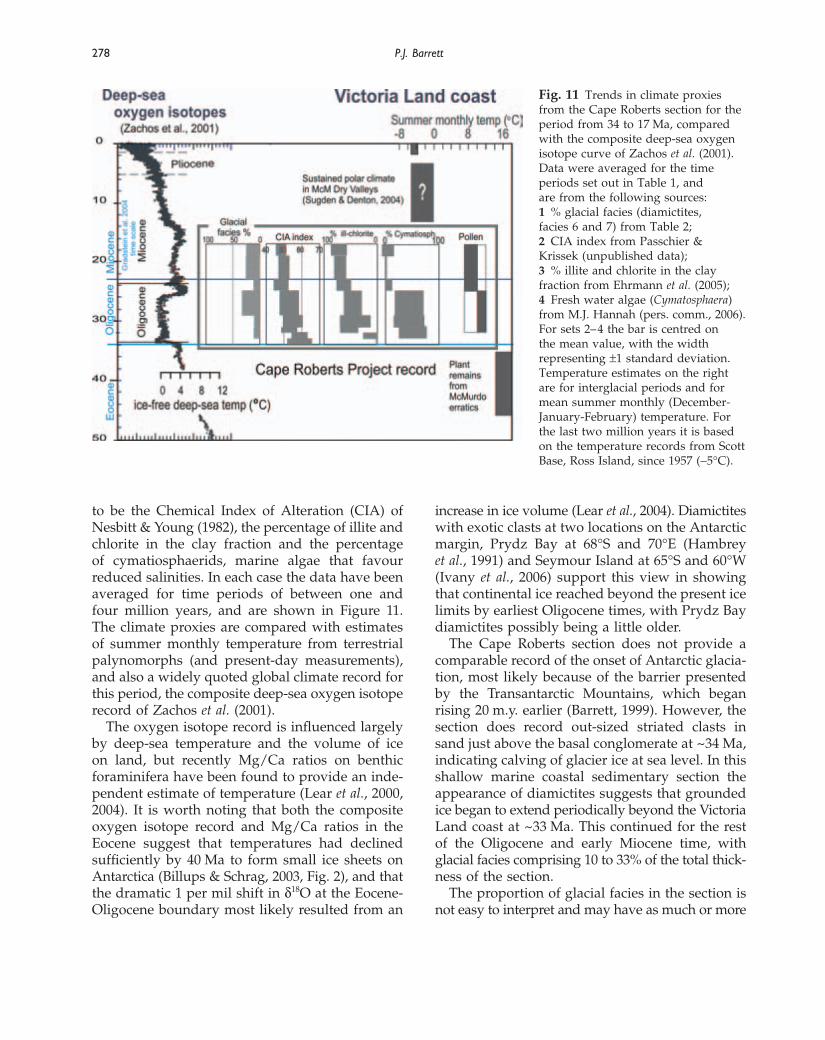
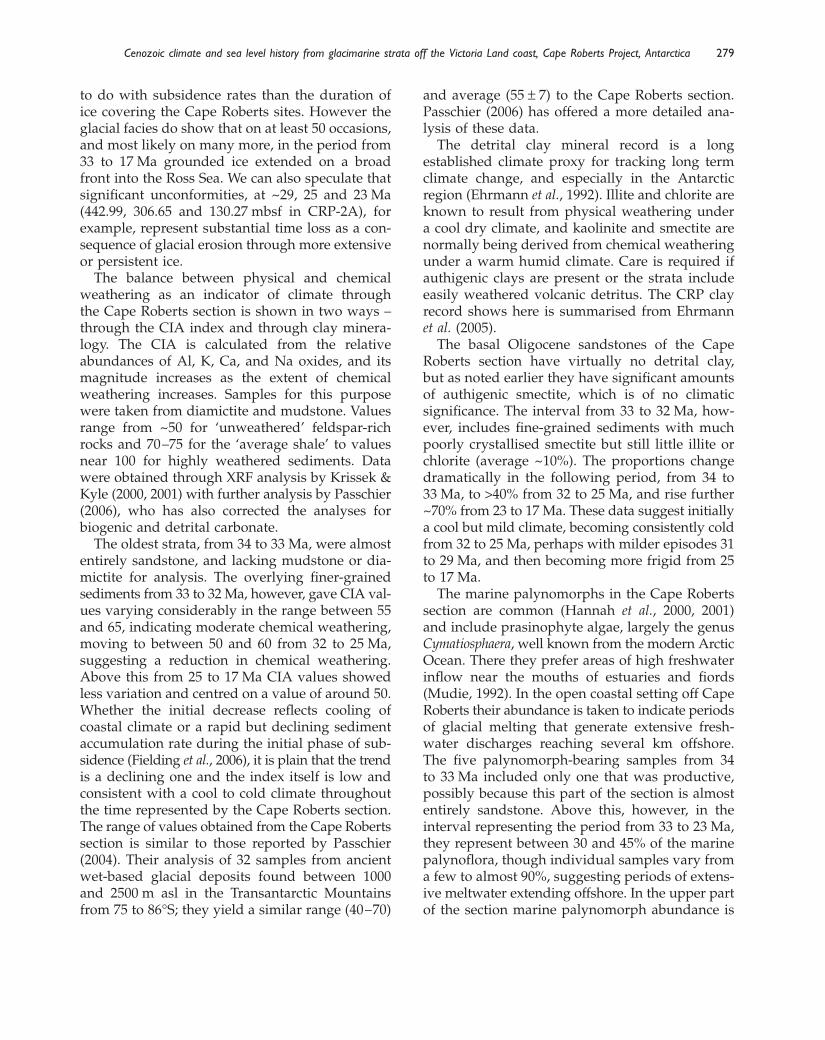
to be the Chemical Index of Alteration (CIA) ofNesbitt & Young (1982), the percentage of illite andchlorite in the clay fraction and the percentage of cymatiosphaerids, marine algae that favourreduced salinities. In each case the data have beenaveraged for time periods of between one andfour million years, and are shown in Figure 11. The climate proxies are compared with estimatesof summer monthly temperature from terrestrialpalynomorphs (and present-day measurements),and also a widely quoted global climate record forthis period, the composite deep-sea oxygen isotoperecord of Zachos et al. (2001).
The oxygen isotope record is influenced largelyby deep-sea temperature and the volume of ice on land, but recently Mg/Ca ratios on benthicforaminifera have been found to provide an inde-pendent estimate of temperature (Lear et al., 2000,2004). It is worth noting that both the compositeoxygen isotope record and Mg/Ca ratios in theEocene suggest that temperatures had declinedsufficiently by 40 Ma to form small ice sheets onAntarctica (Billups & Schrag, 2003, Fig. 2), and thatthe dramatic 1 per mil shift in δ18O at the Eocene-Oligocene boundary most likely resulted from an
increase in ice volume (Lear et al., 2004). Diamictiteswith exotic clasts at two locations on the Antarcticmargin, Prydz Bay at 68°S and 70°E (Hambrey et al., 1991) and Seymour Island at 65°S and 60°W(Ivany et al., 2006) support this view in showingthat continental ice reached beyond the present icelimits by earliest Oligocene times, with Prydz Baydiamictites possibly being a little older.
The Cape Roberts section does not provide a comparable record of the onset of Antarctic glacia-tion, most likely because of the barrier presentedby the Transantarctic Mountains, which began rising 20 m.y. earlier (Barrett, 1999). However, thesection does record out-sized striated clasts insand just above the basal conglomerate at ~34 Ma,indicating calving of glacier ice at sea level. In thisshallow marine coastal sedimentary section theappearance of diamictites suggests that groundedice began to extend periodically beyond the VictoriaLand coast at ~33 Ma. This continued for the restof the Oligocene and early Miocene time, withglacial facies comprising 10 to 33% of the total thick-ness of the section.
The proportion of glacial facies in the section isnot easy to interpret and may have as much or more
Fig. 11 Trends in climate proxiesfrom the Cape Roberts section for theperiod from 34 to 17 Ma, comparedwith the composite deep-sea oxygenisotope curve of Zachos et al. (2001).Data were averaged for the timeperiods set out in Table 1, and are from the following sources:1 % glacial facies (diamictites, facies 6 and 7) from Table 2;2 CIA index from Passchier & Krissek (unpublished data);3 % illite and chlorite in the clayfraction from Ehrmann et al. (2005);4 Fresh water algae (Cymatosphaera)from M.J. Hannah (pers. comm., 2006).For sets 2–4 the bar is centred on the mean value, with the widthrepresenting ±1 standard deviation.Temperature estimates on the rightare for interglacial periods and formean summer monthly (December-January-February) temperature. Forthe last two million years it is basedon the temperature records from ScottBase, Ross Island, since 1957 (−5°C).
GSP_4_C15.qxd 11/5/07 13:39 Page 278
Cenozoic climate and sea level history from glacimarine strata off the Victoria Land coast, Cape Roberts Project, Antarctica 279
to do with subsidence rates than the duration ofice covering the Cape Roberts sites. However theglacial facies do show that on at least 50 occasions,and most likely on many more, in the period from33 to 17 Ma grounded ice extended on a broad front into the Ross Sea. We can also speculate thatsignificant unconformities, at ~29, 25 and 23 Ma(442.99, 306.65 and 130.27 mbsf in CRP-2A), forexample, represent substantial time loss as a con-sequence of glacial erosion through more extensiveor persistent ice.
The balance between physical and chemicalweathering as an indicator of climate through the Cape Roberts section is shown in two ways –through the CIA index and through clay minera-logy. The CIA is calculated from the relative abundances of Al, K, Ca, and Na oxides, and itsmagnitude increases as the extent of chemicalweathering increases. Samples for this purposewere taken from diamictite and mudstone. Valuesrange from ~50 for ‘unweathered’ feldspar-richrocks and 70–75 for the ‘average shale’ to valuesnear 100 for highly weathered sediments. Datawere obtained through XRF analysis by Krissek &Kyle (2000, 2001) with further analysis by Passchier(2006), who has also corrected the analyses forbiogenic and detrital carbonate.
The oldest strata, from 34 to 33 Ma, were almostentirely sandstone, and lacking mudstone or dia-mictite for analysis. The overlying finer-grained sediments from 33 to 32 Ma, however, gave CIA val-ues varying considerably in the range between 55and 65, indicating moderate chemical weathering,moving to between 50 and 60 from 32 to 25 Ma, suggesting a reduction in chemical weathering.Above this from 25 to 17 Ma CIA values showedless variation and centred on a value of around 50.Whether the initial decrease reflects cooling ofcoastal climate or a rapid but declining sedimentaccumulation rate during the initial phase of sub-sidence (Fielding et al., 2006), it is plain that the trendis a declining one and the index itself is low andconsistent with a cool to cold climate throughoutthe time represented by the Cape Roberts section.The range of values obtained from the Cape Robertssection is similar to those reported by Passchier(2004). Their analysis of 32 samples from ancientwet-based glacial deposits found between 1000and 2500 m asl in the Transantarctic Mountains from 75 to 86°S; they yield a similar range (40–70)
and average (55 ± 7) to the Cape Roberts section.Passchier (2006) has offered a more detailed ana-lysis of these data.
The detrital clay mineral record is a long established climate proxy for tracking long term climate change, and especially in the Antarcticregion (Ehrmann et al., 1992). Illite and chlorite areknown to result from physical weathering undera cool dry climate, and kaolinite and smectite arenormally being derived from chemical weatheringunder a warm humid climate. Care is required ifauthigenic clays are present or the strata includeeasily weathered volcanic detritus. The CRP clayrecord shows here is summarised from Ehrmannet al. (2005).
The basal Oligocene sandstones of the CapeRoberts section have virtually no detrital clay, but as noted earlier they have significant amounts of authigenic smectite, which is of no climaticsignificance. The interval from 33 to 32 Ma, how-ever, includes fine-grained sediments with muchpoorly crystallised smectite but still little illite orchlorite (average ~10%). The proportions changedramatically in the following period, from 34 to 33 Ma, to >40% from 32 to 25 Ma, and rise further~70% from 23 to 17 Ma. These data suggest initiallya cool but mild climate, becoming consistently coldfrom 32 to 25 Ma, perhaps with milder episodes 31to 29 Ma, and then becoming more frigid from 25to 17 Ma.
The marine palynomorphs in the Cape Robertssection are common (Hannah et al., 2000, 2001)and include prasinophyte algae, largely the genusCymatiosphaera, well known from the modern ArcticOcean. There they prefer areas of high freshwaterinflow near the mouths of estuaries and fiords(Mudie, 1992). In the open coastal setting off CapeRoberts their abundance is taken to indicate periodsof glacial melting that generate extensive fresh-water discharges reaching several km offshore.The five palynomorph-bearing samples from 34 to 33 Ma included only one that was productive,possibly because this part of the section is almostentirely sandstone. Above this, however, in theinterval representing the period from 33 to 23 Ma,they represent between 30 and 45% of the marinepalynoflora, though individual samples vary froma few to almost 90%, suggesting periods of extens-ive meltwater extending offshore. In the upper partof the section marine palynomorph abundance is
GSP_4_C15.qxd 11/5/07 13:39 Page 279

280 P.J. Barrett
high but the proportion of Cymatiosphaera is low,and mostly less than 10%, implying reduced melt-water flows and a cooler climate.
The terrestrial palynomorph record is sparsebut significant because the assemblages compriselargely modern forms of vegetation. That said, the temperature estimates, although carefully con-sidered are quite speculative, with the detailedreasoning to be found in papers by Raine (1998),Askin & Raine (2000) & Raine & Askin (2001).Further work by Prebble et al. (2006) on the detailof two cycles at 31 and 24 Ma confirmed the cooling trend found in the initial work but alsofound that Nothofagus was more persistent in thelate Oligocene than previously thought. A goal of this work was to seek changes in the glacial-interglacial pollen assemblage, but these could not be resolved because of a combination of lownumbers from the extractions and probable pene-contemporaneous reworking. This suggests thatthe published assessments that follow are likely to represent an interglacial rather than a glacial climate. This flora consisted of a ‘a low-diversitywoody vegetation with several species of Nothofagusand podocarpaceous conifers’ (Raine & Askin,2001) for the period from 33 to 25 Ma, and fromabout 25 Ma of a scrub-tundra mosaic with simi-lar Nothofagus and podocarpaceous conifers, but anincreasing tundra-derived bryophytic [moss] and distinct angiosperm component (Prebble et al., 2006;Raine et al., 2006). The scrub and woodland are compared with the Pacific coast of southern SouthAmerica, where precipitation is high and meansummer monthly temperatures range from 8 to12°C. The tundra vegetation represents a colder,periglacial climate, perhaps at higher elevation orin more exposed sites.
To provide context for the temperatures estimatedfor the Cape Roberts palynomorph record, thepresent-day mean summer temperature is shown,along with a speculative assessment that the re-gional climate has been polar for the last 14 Mabased on the persistence of dated geomorphic fea-tures in the McMurdo Dry Valleys (Marchant et al.,1996; Sugden & Denton, 2004). Temperatures arealso estimated for the period immediately preced-ing the earliest Cape Roberts record from a morediverse terrestrial palynomorph assemblage thatwas extracted from middle to late Eocene erraticsfrom southern McMurdo Sound (Askin, 2000).
In summary, the indicators of ice and climate in the Cape Roberts section indicate initially acold climate for the period from 34 to 33 Ma, with limited glacial influence most likely on account ofthe barrier presented by the adjacent TransantarcticMountains. From 33 Ma onwards, however, thecycles of diamictite, sand and mud, left a recordof glacial advance and retreat that was synchronisedwith sea-level fall and rise that is considered aresponse to huge fluctuations of a dynamic Antarcticice sheet. The record shows no significant indicationof the loss of ice or a clear and persistent warm-ing of the Antarctic region to be expected from the1 per mil fall at around 25 Ma in the compositedeep-sea isotope curve.
Re-analysis of high-latitude ODP sites by Pekaret al. (2006) indicates that around this time (24.4 and 23.0 Ma) the Antarctic Ice Sheet was as largeas or larger than that of today. They suggested that the isotopic shift is better explained by astrengthening of warmer deep waters originat-ing from the North Atlantic coupled with a reduction in Antarctic deep-water, resulting in awarming of bottom water temperatures in manyof the ocean basins, rather than a change in ice volume or surface temperature. They also con-cluded that ice volume ranged from 50% to 125%of the present-day ice sheet in early Miocenetimes by calibrating high-resolution records fromODP Sites 1090 and 1218 (Pekar & DeConto, 2006).The Cape Roberts record is consistent with that conclusion.
CONCLUDING REMARKS
The Cape Roberts section represents a collection of fragments of history of the Antarctic margin from the time the ice sheet had just formed untilshortly before it became persistent around 14 Maago. The sand and minor conglomerate of the firstmillion years is likely to be primarily of regionaltectonic interest, with the subsequent period from33 to 17 Ma of wider climatic interest for its recordof the cycles of the continental ice sheet. Althoughonly 20 to 30% of the cycles experienced by theAntarctic margin have been preserved at all, anumber have survived with most or all elementsintact (e.g. cycle 4 in CRP-1, Cycles 8–11 and 19 in CRP-2A, Cycles 2 and 3 in CRP-3). With their
GSP_4_C15.qxd 11/5/07 13:39 Page 280
Cenozoic climate and sea level history from glacimarine strata off the Victoria Land coast, Cape Roberts Project, Antarctica 281
thickness ranging from 26 to 80 m, and consider-ing the time they represent – 40,000 or 100,000 years– they offer obvious potential for high-resolutionpalaeoclimate studies of the Antarctic margin whenthe earth was shifting from a high to a low CO2
world (Pagani et al., 2005).
ACKNOWLEDGEMENTS
I thank the whole Cape Roberts team, scientists,drillers and support staff, for their commitment andeffort in extracting, describing and interpreting thecores on which this review is based. In particular,I want to acknowledge the roles of Peter Webb asCrary Laboratory Science Leader, Alex Pyne asDrillsite Science Coordinator, Pat Cooper as DrillingManager and Jim Cowie as Project Manager. I alsothank the science editors, contributors and editorialstaff of Terra Antartica for the 10 issues that havepreserved the primary data from both core-basedand geophysical measurements and the sometimesdisparate views expressed in trying to reconcile theevidence. The project was also crucially dependenton funding and logistic support from the nationalprogrammes of Italy, New Zealand, the UnitedStates of America, Germany, Australia, the UnitedKingdom and the Netherlands.
I am particularly grateful for the advice andcritical comments of Rosie Askin, Alan Cooper,Warren Dickinson, Gavin Dunbar, Chris Fielding,Fabio Florindo, Mike Hambrey, Mike Hannah,Dave Harwood, Tim Naish, Steve Pekar, Ian Raineand John Smellie. The preparation of this reviewwas funded by NZ Foundation for Research,Science & Technology Grant COX0410 (Antarcticdrilling (ANDRILL) programme).
REFERENCES
Anderson, J.B. (1999) Antarctic Marine Geology. Cam-bridge University Press, Cambridge. 289 pp.
Armienti, P., Tamponi, M. and Pompilio, M. (2001)Sand provenance from major and trace elementanalyses of bulk rock and sand grains from CRP-2/2A,Victoria Land Basin, Antarctica. Terra Antartica, 8,569–582.
Askin, R.A. (2000) Spores and pollen from the McMurdoSound erratics, Antarctica. In: Paleobiology and Paleo-
environments of Eocene Rocks, McMurdo Sound, EastAntarctica (Eds J.D. Stillwell, and R.M. Feldmann),AGU Antarctic Research Series, 76, 161–181.
Askin, R.A. and Raine, J.I. (2000) Oligocene and EarlyMiocene terrestrial palynology of the Cape RobertsDrillhole CRP-2/2A, Victoria Land Basin, Antarctica.Terra Antartica, 7, 493–501.
Atkins, C.B. (2001) Glacial influence from clast featuresin Oligocene and Miocene strata cored in CRP-2/2Aand CRP-3, Victoria Land Basin, Antarctica. TerraAntartica, 8, 263–274.
Barrett, P.J. (Ed.) (1986) Antarctic Cenozoic history fromthe MSSTS-1 drillhole, McMurdo Sound, Antarctica.NZ DSIR Bulletin, 237, 174 p.
Barrett, P.J. (Ed.) (1989) Antarctic Cenozoic history fromthe CIROS-1 drillhole, McMurdo Sound, Antarctica.NZ DSIR Bulletin, 245, 254 p.
Barrett, P.J. (1996) Antarctic palaeoenvironment throughCenozoic times – a review. Terra Antartica, 3, 103–119.
Barrett, P.J. (1999) Antarctic glacial history over the last100 million years. Terra Antartica Reports, 3, 53–72.
Barrett, P.J. (2001) Grain-size analysis of samples from Cape Roberts Core CRP-3, Victoria Land Basin,Antarctica, with inferences about depositional settingand environment. Terra Antartica, 8, 245–254.
Barrett, P.J. and Anderson, J. (2000) Grain size ana-lysis of samples from CRP-2A, Victoria Land Basin,Antarctica. Terra Antartica, 7, 245–254.
Barrett, P.J., Elston, D.P., Harwood, D.M., McKelvey, B.C.and Webb, P.-N. (1987) Mid-Cenozoic record of glacia-tion and sea-level change on the margin of the VictoriaLand basin, Antarctica. Geology, 15, 634–637.
Barrett, P.J., Henrys, S.A., Bartek, L.R., Brancolini, G.,Busetti, M., Davey, F.J., Hannah, M.J. and Pyne, A.R.(1995) Geology of the margin of the Victoria LandBasin off Cape Roberts, Southwest Ross Sea. In: Geo-logy and Seismic Stratigraphy of the Antarctic Margin (EdsA.K. Cooper, P.F. Barker and G. Brancolini), AGUAntarctic Research Series, 68, 183–207.
Bartek, L.R., Henrys, S.A., Anderson, J.B. and Barrett, P.J.(1996) Seismic stratigraphy of McMurdo Sound,Antarctica: implications for glacially influenced earlyCenozoic eustatic change? Mar. Geol., 130, 79–98.
Behrendt, J.C. (1999) Crustal and lithospheric structureof the West Antarctic Rift System from geophysicalinvestigations – a review. Global and Planetary Change,23, 25–44.
Berggren, W.A., Kent, D.V., Swisher, C.C., III andAubry, M.-P. (1995) A revised Cenozoic geochrono-logy and chronostratigraphy. In Geochronology, TimeScales and Global Stratigraphic Correlation (Eds W.A.Berggren, D.V. Kent, M.-P. Aubrey and J. Hardenbol),SEPM (Society for Sedimentary Geology) Special Publica-tion, 54, 129–212.
GSP_4_C15.qxd 11/5/07 13:39 Page 281

282 P.J. Barrett
Billups, K. and Schrag, D.P. (2003) Application of benthicMg/Ca ratios to questions of Cenozoic climate change.Earth & Planetary Science Letters, 209, 181–195.
Bohaty, S.M., Scherer, R.P. and Harwood, D.M. (1998)Quaternary diatom biostratigraphy and palaeo-environments of the CRP-1 drillcore, Ross Sea,Antarctica. Terra Antartica, 5, 431–453.
Cande, S.V. and Kent, D.V. (1995) Revised calibration of the geomagnetic polarity timescale for the lateCretaceous and Cenozoic. J. Geophys. Res., 100,6093–6095.
Cape Roberts Science Team (1998) Initial Report onCRP-3. Terra Antartica, 5, 1–187.
Cape Roberts Science Team (1999) Studies from the CapeRoberts Project, Ross, Sea, Antarctica. Initial Reporton CRP-3. Terra Antartica, 6, 1–173 with supplement.
Cape Roberts Science Team (2000) Studies from the CapeRoberts Project, Ross, Sea, Antarctica. Initial Reporton CRP-3. Terra Antartica, 7, 1–209 with supplement.
Carter, R.M., Abbott, S.T., Fulthorpe, C.S., Haywick,D.W. and Henderson, R.A. (1991) Application ofglobal sea-level and sequence stratigraphic models in southern hemisphere Neogene strata from NewZealand. In: Sea-level and active plate margins (Ed. D. MacDonald), International Association of Sedimento-logists Special Publication 12, pp. 41–65.
Cooper, A.K., Barker, P.F. and Brancolini, G. (1995)Geology and Seismic Stratigraphy of the Antarctic Margin,AGU Antarctic Research Series, 68, 301 pp, atlas,CD-ROMs.
Cooper, A.K., Barrett, P.J., Hinz, K., Traube, V.,Leitchenkov, G., Stagg, H.M.J., Meyer, A.W., Davies,T.A. and Wise, S.W. (1991) Cenozoic progradingsequences of the Antarctic continental margin: arecord of glacio-eustatic and tectonic events. Mar.Geol., 102, 175–213.
Cowie, J.C. (2002) Cape Roberts Project Final Report1995–2001. Antarctica NZ, Christchurch. 134 pp.
Davey, F.J. (2004) Ross Sea Bathymetry scale 1:2000,000.Institute of Geological & Nuclear Sciences, Lower Hutt.Geophysical map.
DeConto, R.M. and Pollard, D. (2003) Rapid Cenozoicglaciation of Antarctica induced by declining atmo-spheric CO2. Nature, 421, 245–249.
DeConto, R.M. and Pollard, D. (in press) The influenceof sea ice in computer models of the Antarctic Ice Sheet for Oligocene-Miocene times. Palaeogeography,Palaeoclimatology, Palaeoecology.
DeSantis, L. and Barrett, P.J. (1998) Grain Size Analysisof Samples from CRP-1. Terra Antartica, 5, 375–382.
Dunbar, G.B., Barrett, P.J. and DeConto, R.M. (2003)Inferring sea level change from sediment texture:application to Oligocene strata off the Victoria Landcoast, Antarctica. Geophysical Research Abstracts, Vol. 5,08994.
Dunbar, G.B. and Barrett, P.J. (2005) Estimating palaeobathymetry of wave-graded continental shelvesfrom sediment texture. Sedimentology, 52, 253–269.
Dunbar, G.B., Naish, T., Barrett, P.J., Fielding, C. andPowell, R.D. (in press) Constraining the amplitude ofLate Oligocene bathymetric changes in Western RossSea during orbitally-induced oscillations in the EastAntarctic Ice Sheet: (1) Implications for glacimarinesequence stratigraphic models. Palaeogeography, Palaeo-climatology, Palaeoecology.
Ehrmann, W.U., Melles, M., Kuhn, G. and Grobe, H.(1992) Significance of clay mineral assemblages in theAntarctic Ocean. Mar. Geol., 107, 249–273.
Ehrmann, W.U., Setti, M. and Marinoni, L. (2005) Clayminerals in Cenozoic sediments off Cape Roberts(McMurdo Sound, Antarctica) reveal the palaeo-climatic history. Palaeogeography, Palaeoclimatology,Palaeoecology, 229, 187–211.
Elliott, T. (1986) Siliciclastic shorelines. In: Sedimentaryenvironments and facies (Ed. H. Reading), Blackwells,Oxford, 155–188.
Fielding, C.R., Woolfe, K.J., Howe, J.A. and Lavelle, M.(1998) Sequence stratigraphic analysis of CRP-1,Cape Roberts Project, McMurdo Sound, Antarctica.Terra Antartica, 5, 353–361.
Fielding, C.R., Naish, T.R. and Woolfe, K.J. (2000) Faciesanalysis and sequence stratigraphy of CRP-2/2A,Victoria Land Basin, Antarctica. Terra Antartica, 7,323–338.
Fielding, C.R., Naish, T.R. and Woolfe, K.J. (2001) Faciesarchitecture of the CRP-3 drillhole, Victoria LandBasin, Antarctica. Terra Antartica, 8, 217–224.
Fielding, C.R., Henrys, S.A. and Wilson, T.J. (2006) Rifthistory of the western Victoria Land Basin; a new per-spective based on integration of cores with seismicreflection data. In: Antarctica: Contributions to globalearth sciences (Eds D.K. Fütterer, D. Damaske, G.Kleinschmidt, H. Miller and F. Tessensohn), Springer-Verlag, Berlin, 309–318.
Fitzgerald, P.G. (1992) The Transantarctic Mountains of Southern Victoria Land: The application of fissiontrack analysis to a rift shoulder uplift. Tectonics, 11,634–662.
Flint, R.F. (1971) Quaternary and Glacial Geology. Wiley,New York. 892 pp.
Florindo, F., Wilson, G.S., Roberts, A.P., Sagnotti, L.and Verosub, K.L. (2001) Magnetostratigraphy oflate Eocene – early Oligocene strata from the CRP-3core, Victoria Land Basin, Antarctica. Terra Antartica,8, 599–613.
Florindo, F., Wilson, G., Roberts, A., Sagnotti, L. andVerosub, K. (2005) Magnetostratigraphic chronologyof a late Eocene to early Miocene succession from the Victoria Land Basin, Ross Sea, Antarctica. Globaland Planetary Change, 45, 207–236.
GSP_4_C15.qxd 11/5/07 13:39 Page 282

Cenozoic climate and sea level history from glacimarine strata off the Victoria Land coast, Cape Roberts Project, Antarctica 283
George, A. (1989) Sedimentary petrology. In: AntarcticCenozoic history from the CIROS-1 drillhole, McMurdoSound, Antarctica (Ed. P.J. Barrett), DSIR, Wellington,New Zealand. Bull., 245, 159–168.
Gradstein, F.M., Ogg, J.G. and Smith, A.G. (Eds) (2004)A Geologic Time Scale. Cambridge University Press,Cambridge. 589 pp.
Hambrey, M.J., Barrett, P.J., Hall, K.J. and Robinson, P.H.(1989) Stratigraphy. In: Antarctic Cenozoic history fromthe CIROS-1 drillhole, McMurdo Sound, Antarctica (Ed.P.J. Barrett) DSIR Wellington, New Zealand. Bull.245, 23–48.
Hambrey, M.J., Ehrmann, W.U. and Larsen, B. (1991) The Cenozoic glacial record from the Prydz Bay continental shelf, East Antarctica. In: Scientific resultsof the Ocean Drilling Program (Eds J. Barron and B. Larsen), 119, 77–132.
Hambrey, M.J., Barrett, P.J., Ehrmann, W.U. andLarsen, B. (1992) Cenozoic sedimentary processes on the Antarctic continental shelf: the record from deep drilling. Zeitschrift für Geomorphologie, Suppl.Vol. 86, 73–99.
Hambrey, M.J., Krissek, L.A., Powell, R.D. and 7 others(1997) Cape Roberts Project Core Logging Manual.VUW Antarctic Data Series, 21, 89 pp.
Hambrey, M.J., Barrett, P.J. and Powell, R.D. (2002)Late Oligocene and early Miocene glacimarine sedimentation in the SW Ross Sea, Antarctica: therecord from offshore drilling. In: Glacier-InfluencedSedimentation on High-Latitude Continental Margins(Eds J.A. Dowdeswell and C.O. Cofaigh), Geol. Soc.London Spec. Publ., 203, 105–128.
Hannah, M.J., Wilson, G.J. and Wrenn, J.H. (2000)Oligocene and Miocene marine palynomorphs fromCRP-2/2A, Victoria Land Basin, Antarctica. TerraAntartica, 7, 503–512.
Hannah, M.J., Wrenn, J.H. and Wilson, G.J. (2001)Preliminary report on Early Oligocene and ?LatestEocene marine palynomorphs from CRP-2/2A,Victoria Land Basin, Antarctica. Terra Antartica, 8,383–388.
Hannah, M.J., Florindo, F., Harwood, D.M., Fielding, C.R.and CRP Science Team (2001) Chronostratigraphy ofthe CRP-3 drillhole, Victoria Land Basin, Antarctica.Terra Antartica, 8, 615–620.
Harwood, D.M., Bohaty, S.M. and Scherer, R.P. (1998) Lower Miocene diatom biostratigraphy of the CRP-1 drillcore, McMurdo Sound, Antarctica. TerraAntartica, 5, 499–514.
Haq, B.U., Hardenbol, J. and Vail, P.R. (1987) Chrono-logy of fluctuating sea levels since the Triassic. Science,235, 1156–1167.
Hayes, D.E. and Frakes, L.A. (Eds) (1975) Initial Reportsof the Deep Sea Drilling Project, Vol. 28, U.S. Govern-ment Printing Office, 1012 pp.
Henrys, S.A., Bücker, C.J., Bartek, L.R., Bannister, S.A.,Neissen, F. and Wonik, T. (2000) Correlation of seismic reflectors with CRP-2/2A, Victoria LandBasin, Antarctica. Terra Antartica, 8, 221–230.
Henrys, S.A., Bücker, C.J., Niessen, F. and Bartek, L.R.(2001) Correlation of seismic reflectors with theCRP-3 drillhole, Victoria Land Basin, Antarctica.Terra Antartica, 8, 127–136.
Ivany, L.C., van Simaeys, S., Domack, E.W. and Samson,S.D. (2006) Evidence for an earliest Oligocene icesheet on the Antarctic Peninula. Geology, 34, 377–380.
Johnson, D.W. (1919) Shore Processes and Shoreline Devel-opment. Wiley, New York, NY, pp. 405–493.
Krissek, L.A. and Kyle, P.R. (2000) Geochemical indicatorsof weathering, Cenozoic palaeoclimates, and pro-venance from fine-grained sediments in CRP-2/2A,Victoria Land Basin, Antarctica. Terra Antartica, 7,281–298.
Krissek, L.A. and Kyle, P.R. (2001) Geochemical indicatorsof weathering, Cenozoic palaeoclimates, and proven-ance from fine-grained sediments in CRP-3, VictoriaLand Basin, Antarctica. Terra Antartica, 8, 561–568.
Lavelle, M. (1998) Strontium-Isotope stratigraphy of theCRP-1 drillhole, Ross Sea, Antarctica. Terra Antartica,5, 691–696.
Lear, C.H., Elderfield, H. and Wilson, P.A. (2000)Cenozoic deep-sea temperatures and global ice volumes from Mg/Ca in benthic foraminiferal calcite.Science, 287, 269–272.
Lear, C.H.Y., Rosenthal, Y., Coxall, H.A. and Wilson, P.A.(2004) Late Eocene to early Miocene ice sheetdynamics and the global carbon cycle. Paleoceano-graphy, 19, PA4015, doi: 10.1029/2004PA001039.
Lourens, L., Hilgen, F., Shackleton, N.J., Laskar, J. and Wilson, D. (2004) The Neogene Period. In: TheGeological Timescale (Eds F.M. Gradstein, J.G. Oggand A.G. Smith). Cambridge University Press,Cambridge, 409–440.
McIntosh, W.C. (2000) 40Ar/39Ar Geochronology oftephra and volcanic clasts in CRP-2A, Victoria LandBasin, Antarctica. Terra Antartica, 7, 621–630.
Marchant, D.R., Denton, G.H., Swisher III, C.C. andPotter Jr, N. (1996) Late Cenozoic Antarctic paleo-climate reconstructed from volcanic ashes in the DryValleys region of southern Victoria Land. Geol. Soc.Amer. Bull., 108, 181–194.
Miller, K.G., Fairbanks, R.G. and Mountain, G.S. (1987)Tertiary oxygen isotope synthesis, sea level history,and continental margin erosion. Paleoceanography, 2,1–19.
Miller, K.G., Kominz, M.A., Browning, J.V., Wright,J.D., Mountain, G.S., Katz, M.E., Sugarman, P.J.,Cramer, B.S., Christie-Blick, N. and Pekar, S.F. (2005)The Phanerozoic record of global sea-level change.Science, 310, 1293–8.
GSP_4_C15.qxd 11/5/07 13:39 Page 283

284 P.J. Barrett
Miall, A.D. (1991) Stratigraphic sequences and theirchronostratigraphic correlation. J. Sed. Petrol., 61,497–505.
Mudie, P.J. (1992) Circum-Arctic Neogene and Quatern-ary marine palynofloras: paleoecology and statisticalanalysis. In: Neogene and Quaternary dinoflagellatecysts and acritarchs (Eds M.J. Head and J.H. Wrenn).American Association of Stratigraphic PalynologistsFoundation, Dallas, 347–390.
Naish, T.R. and Kamp, P.J.J. (1997) Sequence stratigraphyof sixth order (41 k.y.) Plio-Pleistocene cyclothems,Wanganui basin, New Zealand: A case for the regress-ive systems tract. Geol. Soc. Amer. Bull., 109, 978–999.
Naish, T.R., Woolfe, K.J., Barrett, P.J., Wilson, G.S. and29 others (2001a) Orbitally induced oscillations inthe East Antarctic ice sheet at the Oligocene-Mioceneboundary. Nature, 413, 719–723.
Naish, T.R., Barrett, P.J., Dunbar, G.B., Woolfe, K.J., Dunn, A.G., Henrys, S.A., Claps, M., Powell, R.D. and Fielding, C.R. (2001b) Sedimentary cyclicity in CRP drillcore, Victoria Land Basin, Antarctica. TerraAntartica, 8, 225–244.
Naish, T.R., Wilson, G.S., Dunbar, G.B. and Barrett, P.J.(in press) Constraining the amplitude of Late Oligo-cene bathymetric changes in Western Ross Sea duringorbitally-influenced oscillations in the East AntarcticIce Sheet: (2) Implications for global glacio-eustasy.Palaeogeography, Palaeoclimatology, Palaeoecology.
Nesbitt, H.W. and Young, G.M. (1982) Early Proterozoicclimates and plate motions inferred from major element chemistry of lutites. Nature, 299, 715–717.
Pagani, M., Zachos, J.C., Freeman, K.H., Tipple, B. and Bohaty, S. (2005) Marked decline in atmospheric carbon dioxide concentrations during the Paleogene.Science, 309, 600–603.
Passchier, S. (2004) Variability in geochemical proven-ance and weathering history of Sirius Group strata,Transantarctic Mountains: implications for Antarcticglacial history. J. Sed. Res., 74, 607–619.
Passchier, S. (2006) Oligocene-Miocene Antarctic con-tinental weathering trend and ice volume variationsfrom sediment records in the Ross Sea area. SCAROpen Science Conference, Hobart, Abstracts, 735.
Paul, H.A., Zachos, J.C., Flower, B.P. and Triparti, A.(2000) Orbitally induced climate and geochemicalvariability across the Oligocene/Miocene boundary.Paleoceanography, 15, 471–485.
Pekar, S.F. and DeConto, R.M. (2006) High-resolution ice-volume estimates for the early Miocene: evidence fora dynamic ice sheet in Antarctica. Palaeogeography,Palaeoclimatology, Palaeoecology, 231, 101–109.
Pekar, S.F., Christie-Blick, N., Kominz, M. and Miller, K.G.(2002) Calibration between eustatic estimates frombackstripping and oxygen isotopic records for theOligocene. Geology, 30, 903–906.
Pekar, S.F., DeConto, R.M. and Harwood, D.M. (2006)Resolving a late Oligocene conundrum: Deep-seawarming and Antarctic glaciation. Palaeogeography,Palaeoclimatology, Palaeoecology, 231, 29–40.
Posamentier, H.W., Jervey, M.T. and Vail, P.R. (1988)Eustatic controls on clastic deposition I – conceptualframework. In Sea-level Research: An Integrated Approach(Eds C.K. Wilgus, B.S. Hastings, C.G. St. C. Kendall,H.W. Posamentier, C.A. Ross and J.C. Van Wagoner).SEPM Spec. Publ., 42, 109–124.
Powell, R.D. and Cooper, J.M. (2002) A glacial sequencestratigraphic model for temperate glaciated contin-ental shelves. Geol. Soc. London Special Publication,203, 215–244.
Powell, R.D., Hambrey, M.J. and Krissek, L.A. (1998)Quaternary and Miocene glacial and climatic historyof the Cape Roberts drillsite region, Antarctica. TerraAntartica, 5, 341–351.
Powell, R.D., Krissek, L.A. and van der Meer, J.J.M. (2000) Preliminary depositional environmental ana-lysis of CRP-2/2A, Victoria Land Basin, Antarctica:palaeoglaciological and palaeoclimatic inferences.Terra Antartica, 7, 313–322.
Powell, R.D., Laird, M.G., Naish, T.R., Fielding, C.R.,Krissek, L.A. and van der Meer, J.J.M. (2001)Depositional environments for strata cored in CRP-3 (Cape Roberts Project), Victoria Land Basin,Antarctica: palaeoglaciological and palaeoclimaticinferences. Terra Antartica, 8, 207–216.
Prebble, J.G., Raine, J.I., Barrett, P.J. and Hannah, M.J.(2006) Vegetation and climate from two Oligoceneglacioeustatic sedimentary cycles (31 and 24 Ma)cored by the Cape Roberts Project, Victoria LandBasin, Antarctica. Palaeogeography, Palaeoclimatology,Palaeoecology, 231, 101–109.
Raine, J.I. (1998) Terrestrial palynomorphs from CapeRoberts Project drillhole CRP-1, Ross Sea, Antarctica.Terra Antartica, 5, 539–548.
Raine, J.I. and Askin, R.A. (2001) Terrestrial palyno-logy of Cape Roberts drillhole CRP-3, Victoria Land Basin, Antarctica. Terra Antartica, 8, 389–400.
Raine, J.I., Askin, R.A., Mildenhall, D.C. and Prebble, J.G.(2006) Eocene to Miocene vegetation history and climate, Ross Sea region, Antarctica. SCAR OpenScience Conference, Hobart, Abstracts, 396.
Roberts, A.P., Wilson, G.S., Florindo, F., Sagnotti, L.,Verosub, K. and Harwood, D.M. (1998) Magneto-tratigraphy of Lower Miocene strata from the CRP-1 Core, McMurdo Sound, Ross Sea, Antarctica. TerraAntartica, 5, 703–713.
Sandroni, S. and Talarico, F. (2001) Petrography andprovenance of basement clasts and clast variability in CRP-3 drillcore (Victoria Land Basin, Ross Sea,Antarctica). Terra Antartica, 8, 449–468.
GSP_4_C15.qxd 11/5/07 13:39 Page 284
Cenozoic climate and sea level history from glacimarine strata off the Victoria Land coast, Cape Roberts Project, Antarctica 285
Scherer, R.P., Bohaty, S.M. and Harwood, D.M. (2000)Oligocene and Lower Miocene Siliceous MicrofossilBiostratigraphy of Cape Roberts Project Core CRP-2/2A, Victoria Land Basin, Antarctica. Terra Antartica,7, 417–442.
Scherer, R.P., Dunbar, R.B., Esper, O., Flores, J.-A. andGersonde, R. (2006) Southern Ocean and Antarcticnearshore record of an Early Pleistocene WarmInterglacial, MIS-31. SCAR Open Science Confer-ence, Hobart, July, 2006 (abs.).
Shackleton, N.J. and Kennett, J.P. (1975) Paleotem-perature history of the Cenozoic and the initiation of Antarctic glaciation: oxygen and carbon isotopeanalyses in DSDP Sites 277, 279, and 281. In InitialReports of the Deep Sea Drilling Project (Eds J.P.Kennett, and R. Houtz), 29, 743–755.
Shackleton, N.J., Hall, M.A. and Pate, D. (1995)Pliocene stable isotope stratigraphy of Site 846. In:Scientific Results of the Ocean Drilling Program (Eds N.G. Pisias, L.A. Mayer, T.R. Janacek, A. Palmer-Julson and T.H. van Andel), 138, 337–355.
Smellie, J. (2000) Erosional history of the TransantarcticMountains deduced from sandstone detrital modesin CRP-2/2A, Ross Sea, Antarctica. Terra Antartica, 7,545–552.
Smellie, J. (2001) History of Oligocene erosion, uplift andunroofing of the Transantarctic Mountains deducedfrom sandstone detrital modes in CRP-3 drillcore,Victoria Land Basin, Antarctica. Terra Antartica, 8,481–490.
Stern, T.A., Baxter, A.K. and Barrett, P.J. (2005) Isostaticrebound due to glacial erosion within the Trans-antarctic Mountains. Geology, 33, 221–224.
Sugden, D.E. and Denton, G.H. (2004) Cenozoic land-scape evolution of the Convoy Range to MackayGlacier area, Transantarctic Mountains: Onshore to offshore synthesis. Geol. Soc. Amer. Bull., 116,840–857.
Swift, D.J.P. (1971) Quaternary shelves and the returnto grade. Mar. Geol., 8, 5–30.
Talarico, F., Sandroni, S., Fielding, C.R. and Atkins, C.(2000) Variability, petrography and provenance ofbasement clasts from CRP-2/2A drillcore (VictoriaLand Basin, Ross Sea, Antarctica). Terra Antartica, 7,529–544.
Taviani, M. and Beu, A. (2003) The palaeoclimaticsignificance of Cenozoic marine macrofossil assemb-lages from Cape Roberts Project drillholes, McMurdoSound, Victoria Land Basin, East Antarctica. Palaeo-geography, Palaeoclimatology, Palaeoecology, 198, 131–143.
Taviani, M., Beu, A. and Lombardo, C. (1998) Pleistocenemacrofossils from CRP-1 drillhole, Victoria LandBasin, Antarctica. Terra Antartica, 5, 485–491.
Turnbull, I.M., Allibone, A.H., Forsyth, P.J. and Heron,D.W. (1994) Geology of the Bull Pass-St Johns Range
area, Southern Victoria Land, Antarctica, scale 1:50 000.Institute of Geological & Nuclear Sciences, Lower Hutt.Geological map and booklet (52 p.)
Vail , P.R., Mitchum, R.M., Todd, R.G., Widmier, J.M.,Thompson III, S., Sangree, J.B., Bubb, J.N. andHatlelid, W.G. (1977) Seismic stratigraphy andglobal changes of sea level. Mem. Amer. Assoc. Petrol.Geol., 26, 49–205.
van der Meer, J.J.M. (2000) Microscopic observations onthe upper 300 m pf CRP-2/2A, Victoria Land Basin,Antarctica. Terra Antartica, 7, 339–348.
Webb, P.-N. and Strong, C.P. (1998) Occurrence, strati-graphic distribution and paleoecology of Quaternaryforaminifera from CRP-1. Terra Antartica, 5, 455–472.
Webb, P.-N. and Strong, C.P. (2000) Pliocene benthicforaminifera from CRP-2 (Lithostratigraphic Unit2.2), Victoria Land Basin, Antarctica. Terra Antartica,7, 453–460.
Wilson, G.S., Bohaty, S.M., Fielding, C.R., Florindo, F.,Hannah, M.J., Harwood, D.M., Mcintosh, W.C., Naish, T.R., Roberts, A.P., Sagnotti, L., Scherer, R.P.,Strong, C.P., Verosub, K.L., Villa, G., Watkins, D.K.,Webb, P.-N. and Woolfe, K.J. (2000) Chronostrati-graphy of CRP-2/2A, Victoria Land Basin, Antarctica.Terra Antartica, 7, 647–654.
Wilson, G.S., Lavelle, M., McIntosh, W.C., Roberts, A.P.and 10 others (2002) Integrated chronostratigraphiccalibration of the Oligocene-Miocene boundary at24.0 ± 0.1 Ma from the CRP-2A drill core, Ross Sea,Antarctica. Geology, 30, 1043–46.
Wise, S.W., Jr., Breza, J.R., Harwood, D.M., Wei, W. and Zachos, J. (1991) Paleogene glacial history ofAntarctica. In: Controversies in Modern Geology; Evolu-tion of Geological Theories in Sedimentology, Earth Historyand Tectonics (Eds J.A. McKenzie and H. Weissert).Academic Press, London, 133–171.
Wise, S.W., Jr., Smellie, J.L., Aghib, F.S., Jarrard, R.D. andKrissek, L.A. (2001) Authigenic smectite clay coats inCRP-3 drillcore, Victoria Land Basin, Antarctica, asa possible indicator of fluid flow: a progress report.Terra Antartica, 8, 281–298.
Young, G.M. and Nesbitt, H.W. (1998) Processes con-trolling the distribution of Ti and Al in weatheringprofiles, siliciclastic sediments and sedimentary rocks.J. Sed. Research, 68, 448–455.
Zachos, J.C., Breza, J. and Wise, S.W. (1992) EarlyOligocene ice sheet expansion on Antarctica, sedi-mentological and isotopic evidence from the KergulenPlateau. Geology, 20, 569–573.
Zachos, J.C., Flower, B.P. and Paul, H. (1997) Orbitallypaced climate oscillations across the Oligocene/Miocene boundary. Nature, 388, 567–570.
Zachos, J., Pagani, M., Sloan, L. and Thomas, E. (2001)Trends, rhythms and aberrations in global climate 65 million years to present. Science, 292, 686–693.
GSP_4_C15.qxd 11/5/07 13:39 Page 285
286 P.J. Barrett
APPENDIX 1
SUMMARY DESCRIPTION OF FACIES FROMCENOZOIC STRATA DESCRIBED FROM CRPDRILL CORES
Note: Dispersed clasts or lonestones are a prominent feature throughout Facies 1–5 (mudstone through tosandstone) and facies 8 (rhythmite). They range in sizefrom small pebble to cobble-size, and from angular torounded. A few are faceted and striated (Atkins, 2001).Lithologies are largely granitoid and dolerite, with lesseramounts of metamorphic and sedimentary types, allsourced from the adjacent Transantarctic Mountains(Talarico et al., 2000, Sandroni & Talarico, 2001).
Facies 1, mudstone with lonestones, is typicallya massive slightly sandy clayey silt, although 20%sand is not uncommon. Gravel rarely accounts formore than 0.2%. Fine sand and silt laminae are com-mon and there is little bioturbation. Microfossilsinclude diatoms (common), benthic foraminifera,and both marine and terrestrial palynomorphs,the latter presumably from vegetated ice-free partsof the adjacent coast. The facies also includes a few molluscs.
This facies is interpreted as fine-grained sedi-ment discharged from rivers or glaciers on land and carried offshore to settle out below wave-basealong with coarser sediment from floating ice.
Facies 2, interstratified sandstone and mudstone,is characterised by beds of both fine sandstoneand mudstone tens of centimentres thick, withsands commonly parallel- and ripple-laminated, andfining upward to mudstones. Some thin intervalsshow intense soft-sediment deformation.
This facies is interpreted as a mix of hemipelagicsedimentation below wave base, interrupted periodically by occasional low density sediment gravity flows, perhaps triggered by floods or stormevents.
Facies 3, poorly sorted muddy very fine to coarse-grained sandstone, varies considerably in texture,although typically it is massive or weakly stratified,with normal grading. Finer beds are ripple-laminated. Thin conglomerates occur at the base of coarse-grained beds. The very poor sorting of this facies has led to several samples visuallydescribed as sandstone, analysing as sandy mud-stone with 30% fine/very fine sand, 50% silt and20% clay.
This facies has been interpreted to form from high density sediment gravity flows or by turbidplumes originating from heavy fluvial discharge.Alternatively some intervals could represent mixing between shoreface sand and offshore mudduring periods of changing sea level.
Facies 4, a moderately to well-sorted fine sand-stone, exhibits planar and low-angle cross-lamination, and in places is interbedded with very fine, medium and coarse sandstones. Recentreviews (e.g. Hambrey et al., 2002) have includedit with Facies 5.
Facies 5, a moderately to well sorted stratified or massive, fine to medium-grained sandstone, is typically massive and planar to cross-stratified.Textural analysis shows this facies to be mostlymoderately well sorted, but also to have matrix thatis far more clay-rich than Facies 1, suggesting thatmuch of the clay migh be of diagenetic origin, andthat the facies was better sorted when deposited.
This facies is interpreted as a shoreface depositinfluenced primarily by waves and currents.
Facies 6, a stratified diamictite, is a mixture ofgravel (>1%), sand and mud, with stratification evident from variations in colour, texture or clastdensity. It commonly has gravel, sand or siltinterbeds, and locally shows strong soft-sedimentdeformation.
This facies can be interpreted to result from sub-glacial melt-out through the water column from afloating ice margin. Alternatively, it may have beenthe product of a debris-flow. This might itself havebeen fed by subglacial meltwater discharge.
Facies 7, a massive diamictite, is an unstratifiedmixture of gravel, sand and mud in beds fromdecimetres to several metres in thickness. Upper andlower contacts are well-defined, though they maybe graded. Lower contacts can also be sharp andwith indications of loading. Some though not allclast fabrics show a preferred orientation (Atkins,2001). Samples taken for microtextural analysis by thin section also show rotational structures andother features that indicate that they experiencedshearing, possibly by grounded ice (Van der Meer,2000).
This facies is most likely to have formed near themargin of a temperate glacier from melting of thebasal debris layer.
Facies 8, rhythmically interstratified sandstone and siltstone, is characterised by thin silt laminae,
GSP_4_C15.qxd 11/5/07 13:39 Page 286

Cenozoic climate and sea level history from glacimarine strata off the Victoria Land coast, Cape Roberts Project, Antarctica 287
thin turbiditic sands and single-grain-thick sandlaminae, and is quite unusual, forming <1% of thesection.
This facies has been seen to form through sus-pension settling from turbid plumes accompaniedby occasional low density turbidity currents.
Facies 9, a clast-supported conglomerate, is massive, poorly sorted and commonly gradesfrom cobble to small pebble grade, with a matrixof fine- to coarse-grained sand. Clasts are typicallymoderately to well rounded, but almost invari-ably include angular clasts too.
The facies is submarine from its close associationwith other marine facies, but may have formed close to points of fluvial or subglacial meltwater discharge close to or beyond the coast. It could also represent redeposition of such gravels furtheroffshore by sediment gravity flow.
Facies 10, a poorly sorted matrix-supported conglomerate, has the same features as Facies 9, but the clasts are ‘floating’ in the sandy matrix and it typically has a higher proportion of angularclasts.
It too is interpreted as the product of fluvial or subglacial meltwater discharge, possibly re-deposited by sediment gravity flow.
Facies 11, a mudstone breccia, comprises angu-lar fragments of mudstone (with some very finesandstone) several centimetres across in a matrix
of muddy fine sandstone. It was found in just a few places (<0.5% of the section), the most strik-ing being a 4-m-thick bed with clasts up to 75 mmlong and intensively brecciated at the base from 311 to 315.5 mbsf in CRP-2A (Cape Roberts ScienceTeam, 2000, Fig. 3.2 k).
These can be interpreted as mass-movementevents, induced either by earthquakes or shearingfrom grounded ice.
Facies 12, comprises phonolitic tephras eruptedfrom ~24 Ma and above ~300 mbsf in CRP-2A(Armienti et al., 2001). Volcanic glass, crystals andclasts can be seen in the core face both dispersedand concentrated as laminae. Several discreet tephralayers were encountered, the most spectacularbeing a series between 109 and 114 mbsf in CRP-2A, and including a reverse- to normal-graded1.2-m-thick pumiceous lapillistone. It does notinclude volcanogenic sandstones with as much as30% glass and lithic fragments (Smellie, 2000).
This facies is interpreted as volcanic airfalldebris deposited through water, in most casesreworked by currents and in some redeposited bysediment gravity-flows. Ar-Ar dating of feldsparsand other volcanic material from these deposits,along with some volcanic clasts, has been crucialfor the chronology of the period from 25 to 17 Ma(Cape Roberts Science Team, 1998, 1999; Florindoet al., 2005).
GSP_4_C15.qxd 11/5/07 13:39 Page 287