gl ob a l mid -y ea r ou t l oo k 20 16 2h 2016 global themes
TRANSCRIPT
8 July 2016 OCBC Global Mid-Year Outlook 2016
Treasury Research & Strategy 1
G
LO
BA
L M
ID-Y
EA
R
OU
TL
OO
K 2
01
6
2H 2016 Global Themes
Friday, July 08, 2016
At the start of 2016, we warned that the key risks for 2016 remain namely growth and
policy-centric ones. What a volatile first half of 2016 it has been – first the Chinese
equity markets had a bumpy start, this was quickly followed by a wishy-washy US
Federal Reserve who kept talking about policy normalization but also backtracked on
China growth slowdown and Brexit fears, and of course, the actual surprise outcome of
the Brexit referendum on 24 June itself. The Brexit-induced political crisis in the
Eurozone will take time to play out, even though the economic impact on global growth
is estimated to be fairly modest. However, the key channel of contagion has been
financial in the short-term rather than economic in the medium term.
The silver lining, if you were hunting for one, is that global policy accommodation has
been unprecedented, especially in the utilization of unconventional policies. The more
global growth prospects soften, the more monetary and fiscal policy will be on tap. So
far, the Bank of Japan has joined the European Central Bank in venturing into negative
deposit rate territory. Still, the continued supply of liquidity, whether through bond
purchase programs and/or actual term liquidity injections, have benefited asset more
than actual business credit growth or headline GDP growth. This combination has led
many to question on the efficacy of monetary policy as interest rates approach the zero
bound. With many of the G7 sovereign bond yields already testing record lows, if not
outright negative yields, obviously we do not live in a normalized world. In fact, the
thinking is increasingly focusing on fiscal policy and structural and economic reforms to
make a difference from the protracted period of sluggish growth since the Global
Financial Crisis.
The only certainty looking ahead appears to be more anticipated market volatility and
economic uncertainties for the second half of the year. Looking into a rather murky
post-Brexit crystal glass at this juncture, the overwhelming suspicion is that the global
growth will again disappoint, China will continue to meander along a modestly downward
sloping GDP growth trajectory and currency regime, and the search for yield will
continue as long as the “low-for-longer” interest rate environment and liquidity-on-tap
environment persists.
The biggest market disappointment has been the US Federal Reserve. The key motto
here is to clearly watch what they do and not what they say. Policymakers are being
confounded by mixed economic prints and event risks. Note the June FOMC minutes
sounded another cautious tone amid the mixed data points, as “almost all participants
judged that the surprisingly weak May employment report increased their uncertainty
about the outlook for the labour market…even so, many remarked that they were
reluctant to change their outlook materially based on one economic data release”.
Overall, “most participants judged that, in the absence of significant economic or
financial shocks, raising the target range for the federal funds rate would be
appropriate”, albeit “some other participants were uncertain whether economic
conditions would soon warrant an increase” in the Fed Funds rate. On inflation, they
“viewed the firming in some measures of core inflation, the evidence that wage growth
was picking up”. On Brexit risks, most participants noted it “could generate financial
market turbulence that could adversely affect domestic economic performance”. Our
view is that the split in the FOMC members’ economic assessment will likely keep them
Treasury
Advisory
Corporate FX &
Structured
Products
Tel: 6349-1888 /
1881
Interest Rate
Derivatives
Tel: 6349-1899
Investments &
Structured
Products
Tel: 6349-1886
GT Institutional
Sales
Tel: 6349-1810
GT Research &
Strategy
Tel: 6530-8384

8 July 2016 OCBC Global Mid-Year Outlook 2016
Treasury Research & Strategy 2
on hold in the near-term (ie. through summer), especially given Brexit risks have materialized to a certain
extent, and that at best one rate hike will occur at the end of the year. So whilst the FOMC credibility has
been materially dented, nevertheless, the sustained dovish slant in the other major central banks
continues to ensure policy divergence for now.
For Asia, China’s policy risks remain predominant. While growth appeared to have stabilized in China,
whether the current momentum can be sustained remains another question altogether. Within Asia, the
Philippines and Indonesia look better poised to ride out the external turbulence and market headwinds,
whereas Singapore continues to lag behind in absolute growth rates due to a combination of domestic
challenges like a high cost base and foreign manpower constraints amid the ongoing economic
restructuring. To bank on a China recovery in the near-term remains a bit of a stretch for now, so
additional firepower from the policy front would be necessary to support Asian ex-China growth and credit
conditions in the interim. Domestic consumption and business confidence remains key in the current
choppy macro-environment. So stay tuned for now.
8 July 2016 OCBC Global Mid-Year Outlook 2016
Treasury Research & Strategy 3
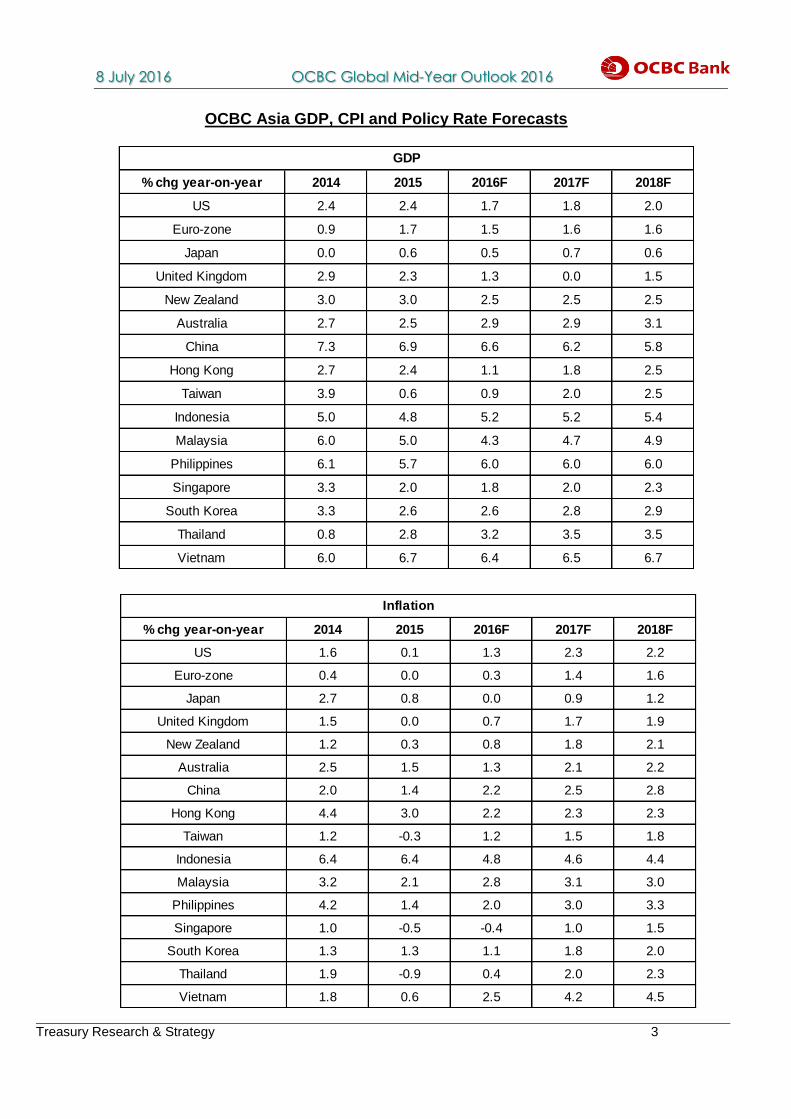
OCBC Asia GDP, CPI and Policy Rate Forecasts
% chg year-on-year 2014 2015 2016F 2017F 2018F
US 2.4 2.4 1.7 1.8 2.0
Euro-zone 0.9 1.7 1.5 1.6 1.6
Japan 0.0 0.6 0.5 0.7 0.6
United Kingdom 2.9 2.3 1.3 0.0 1.5
New Zealand 3.0 3.0 2.5 2.5 2.5
Australia 2.7 2.5 2.9 2.9 3.1
China 7.3 6.9 6.6 6.2 5.8
Hong Kong 2.7 2.4 1.1 1.8 2.5
Taiwan 3.9 0.6 0.9 2.0 2.5
Indonesia 5.0 4.8 5.2 5.2 5.4
Malaysia 6.0 5.0 4.3 4.7 4.9
Philippines 6.1 5.7 6.0 6.0 6.0
Singapore 3.3 2.0 1.8 2.0 2.3
South Korea 3.3 2.6 2.6 2.8 2.9
Thailand 0.8 2.8 3.2 3.5 3.5
Vietnam 6.0 6.7 6.4 6.5 6.7
GDP
% chg year-on-year 2014 2015 2016F 2017F 2018F
US 1.6 0.1 1.3 2.3 2.2
Euro-zone 0.4 0.0 0.3 1.4 1.6
Japan 2.7 0.8 0.0 0.9 1.2
United Kingdom 1.5 0.0 0.7 1.7 1.9
New Zealand 1.2 0.3 0.8 1.8 2.1
Australia 2.5 1.5 1.3 2.1 2.2
China 2.0 1.4 2.2 2.5 2.8
Hong Kong 4.4 3.0 2.2 2.3 2.3
Taiwan 1.2 -0.3 1.2 1.5 1.8
Indonesia 6.4 6.4 4.8 4.6 4.4
Malaysia 3.2 2.1 2.8 3.1 3.0
Philippines 4.2 1.4 2.0 3.0 3.3
Singapore 1.0 -0.5 -0.4 1.0 1.5
South Korea 1.3 1.3 1.1 1.8 2.0
Thailand 1.9 -0.9 0.4 2.0 2.3
Vietnam 1.8 0.6 2.5 4.2 4.5
Inflation
8 July 2016 OCBC Global Mid-Year Outlook 2016
Treasury Research & Strategy 4
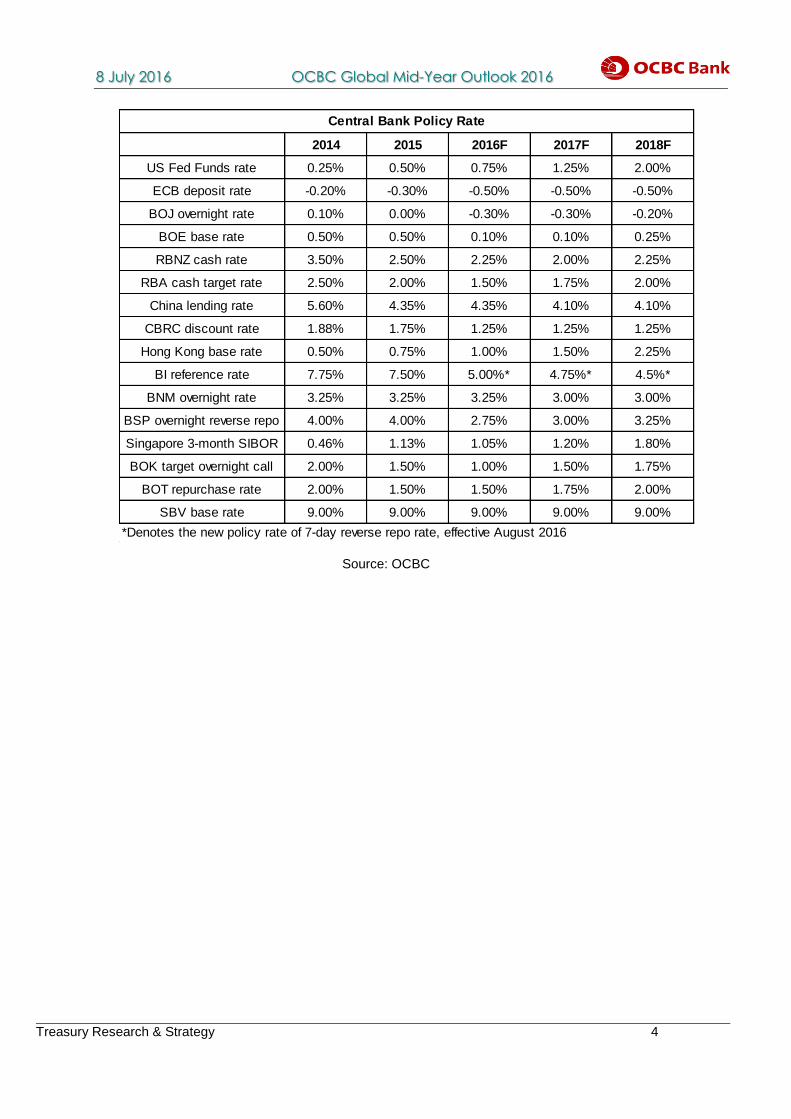
Source: OCBC
2014 2015 2016F 2017F 2018F
US Fed Funds rate 0.25% 0.50% 0.75% 1.25% 2.00%
ECB deposit rate -0.20% -0.30% -0.50% -0.50% -0.50%
BOJ overnight rate 0.10% 0.00% -0.30% -0.30% -0.20%
BOE base rate 0.50% 0.50% 0.10% 0.10% 0.25%
RBNZ cash rate 3.50% 2.50% 2.25% 2.00% 2.25%
RBA cash target rate 2.50% 2.00% 1.50% 1.75% 2.00%
China lending rate 5.60% 4.35% 4.35% 4.10% 4.10%
CBRC discount rate 1.88% 1.75% 1.25% 1.25% 1.25%
Hong Kong base rate 0.50% 0.75% 1.00% 1.50% 2.25%
BI reference rate 7.75% 7.50% 5.00%* 4.75%* 4.5%*
BNM overnight rate 3.25% 3.25% 3.25% 3.00% 3.00%
BSP overnight reverse repo 4.00% 4.00% 2.75% 3.00% 3.25%
Singapore 3-month SIBOR 0.46% 1.13% 1.05% 1.20% 1.80%
BOK target overnight call 2.00% 1.50% 1.00% 1.50% 1.75%
BOT repurchase rate 2.00% 1.50% 1.50% 1.75% 2.00%
SBV base rate 9.00% 9.00% 9.00% 9.00% 9.00%
*Denotes the new policy rate of 7-day reverse repo rate, effective August 2016
Central Bank Policy Rate
8 July 2016 OCBC Global Mid-Year Outlook 2016
Treasury Research & Strategy 5
Contents
Country Outlook Page No.
1. China – Brace For Impact 6
2. Hong Kong – Gloomy Economic Outlook
9
3. Indonesia – Monetary Push 12
4. Macau – The Worse May Be Over
15
5. Malaysia – Hanging In There 18
6. Myanmar – Stabilization In Progress
21
7. Singapore – Staying The Course In 2H16
25
8. Taiwan – Muddling Through Global Uncertainty 28
9. Thailand – Why Is The Land Of Smiles frowning? 31
10. Vietnam – Paving The Way For A Brighter Future
35
Thematic Pieces Page No.
1. US Special – Conflicting Signals On The Labour Market 39
2. China Special – Capital Account Liberalization And RMB Internationalization Amid
RMB Volatility
42
3. Hong Kong Special – HKD Pegged To Hold 44
4. Singapore Special – Going Beyond Income Inequality? 47
5. Commodity Special – Absence Of A Supercycle 53
6. Fund Flows Update – 1H 2016 Global Fund Flows Review 56

8 July 2016 OCBC Global Mid-Year Outlook 2016
Treasury Research & Strategy 6
c o m pr
isi
n g
CH
INA
Brace For Impact
China kicked off 2016 with a tough start after RMB volatility spiked to record high in January
following the quick depreciation of RMB fixing. In reaction to the panic sale of RMB, PBoC
intervened in both onshore and offshore market aggressively. The mop-up of RMB liquidity
in early January resulted in the man-made liquidity crunch in the offshore market but
managed to turn fortune around after the intervention. The stabilized RMB in late January
albeit at the expense of China’s RMB internationalization and capital account liberalization
helped calm the sentiment down and market shifted focus back to economic fundamentals.
China’s growth decelerated to 6.7% in 1Q from 6.9% in 2015, but in line with market
expectation. The stabilization of the economy in 1Q was mainly attributable to three factors
including favourable global environment, stable RMB and supportive domestic monetary
and fiscal policies.
Externally, global sentiment improved in March and April after the G20 meeting in Shanghai
in late Feb, following more easing measures from ECB and BOJ as well as dovish
comments from Fed Chairwoman Yellen. The recovery of global sentiment also spilled into
China’s financial markets, which in turn helped curb excessive bearish sentiment.
The panic about the disorderly RMB depreciation has diminished significantly after PBoC
guided markets to trade RMB with reference to a currency basket. Since early March, China
has been following the new fixing mechanism closely and markets gradually adapted to the
new fixing mechanism. This then eventually contained concerns over any big one-time
devaluation. A more predictable currency policy is important for exporters and importers,
which partially contributed to the recovery of China’s trade albeit still not stable in the past
few months.
Domestically, the Chinese economy also benefited from more expansionary monetary
policy and proactive fiscal policy. China’s aggregate social financing hit an all-time quarterly
high of CNY6.53 trillion in 1Q, signalling expansionary credit policy even as China kept its
benchmark interest rate unchanged. Meanwhile, infrastructure investment re-accelerated to
19.6% in 1Q from 17.2% in 2015 on the back of fiscal support.
Challenges remain
Despite encouraging growth data in 1Q, challenges still exist given the poor private
investment trend as well as weaker-than-expected global recovery. China’s fixed asset
investment by private sector decelerated further to only 3.9% yoy in the first five months,
down from 10.1% yoy in 2015. This signals caution in the private sector, in anticipation of a
slowdown in Chinese economy. As a result of weak private investment, fixed asset
investment slowed down to 16-year low of 9.6% yoy in the first five months. Should private
investment fail to pick up from here, we think it may weigh down the GDP growth in 2Q. We
expect China’s growth to slow down to about 6.5% in 2Q.
The impact of Brexit is manageable for now
The Brexit decision made by British people shocked the global market. The drama has been
far from over as market focus will shift to when the UK is going to invoke the Article 50 and
how long the negotiation between the UK and EU will take. Uncertainty is expected to last
8 July 2016 OCBC Global Mid-Year Outlook 2016
Treasury Research & Strategy 7
for at least three months until we have clearer picture about who is going to take over David Cameron as
the new Prime Minister in October. Nevertheless, we think the impact on China is limited for now as the
bilateral trade between UK and China only accounted for 2% of China’s total trade.
However, RMB felt the first wave of the Brexit shock with the USDCNY spiking to around 6.65 following
the event. The break of 6.60 handle may fuel fresh concern about RMB’s depreciation. In aggregate, as
the recent RMB weakness is not a China-specific event, corporate’s expectation about RMB’s two-way
movement has not been derailed yet. We think PBoC may step in to keep volatility in check. As such, we
do not expect another round of one-time devaluation. The net sale of foreign exchange under the current
account turned positive at US$4.8 billion for the first time since July 2015, signaling more balanced
demand and supply. As such, we see low risk of disorderly capital outflows in the second half should
China continue to follow its fixing mechanism.
Systemic risk is likely to be contained
A hard landing is not in our baseline scenario for the next two years as we think China still has enough
buffers to protect itself from systemic risks. The upgrade to macro prudential assessment is likely to keep
financial risk in check. The fact that China’s deposit growth remains steady shows that confidence in
China’s banking sector has not been eroded by the recent rise in credit events as well as deteriorating
asset quality. Meanwhile, money markets have been stable since last year after PBoC used the
combination of three innovative measures including SLF, MLF and PSL to manage short end liquidity,
less affected by the equity and currency market volatility. As such, we do not expect any imminent
banking crisis in China.
Looking ahead, we expect China’s monetary and fiscal policies to remain supportive, in particular, after
taking local government debt swap program and upcoming debt for equity swap program into account. On
monetary policy front, easing expectation has swung left and right after the authoritative person’s article in
May. Overall speaking, we think the chance of further interest rate cut is low despite Brexit event for three
reasons. First, China’s short end money market rate has been stable. Hence, there is no urgency for
China to cut interest rate to boost sentiment unless we see another round of equity market turmoil.
Second, China has enough alternative measures to express easing monetary policy. The latest three
non-traditional measures including SLF, MLF and PSL, are preferred measures at the current stage to
interest rate cut. Third, an interest rate cut may have negative impact on still fragile RMB sentiment. As
such, we see no interest rate cut for the rest of year. However, the chance of reserve requirement ratio
cut cannot be ruled out under the prudent monetary policy. We expect one more RRR cut in 3Q to offset
the impact of capital outflows.
Compared to prudent monetary policy, we think fiscal policy is likely to play a more active role in the
second half to stimulate the growth. China has raised the fiscal deficit target to 3% of GDP for 2016; we
expect the actual fiscal deficit target to exceed 3% as a result of rising infrastructure investments and
change of tax regime from business tax to value added tax.
To conclude, we expect China to achieve its 6.5%-7% target for 2016. How fast China will grow will
depend on two key parameters including the external environment and private sector participation. Given
private investment remains weak, we revise our GDP forecast for China down slightly to 6.6% from
previously expected 6.7%.

8 July 2016 OCBC Global Mid-Year Outlook 2016
Treasury Research & Strategy 8
China’s Private Investment
China’s GDP Growth
CFETS Index
Source: Bloomberg, CEIC, OCBC
0
2
4
6
8
10
12
14
16
Ma
r-0
5
Au
g-0
5
Jan
-06
Jun
-06
No
v-0
6
Ap
r-0
7
Se
p-0
7
Fe
b-0
8
Jul-
08
De
c-0
8
Ma
y-0
9
Oct-
09
Ma
r-1
0
Au
g-1
0
Jan
-11
Jun
-11
No
v-1
1
Ap
r-1
2
Se
p-1
2
Fe
b-1
3
Jul-
13
De
c-1
3
Ma
y-1
4
Oct-
14
Ma
r-1
5
Au
g-1
5
Jan
-16
GDP growth
94
95
96
97
98
99
100
101
102
04
/01
/20
16
11
/01
/20
16
18
/01
/20
16
25
/01
/20
16
01
/02
/20
16
08
/02
/20
16
15
/02
/20
16
22
/02
/20
16
29
/02
/20
16
07
/03
/20
16
14
/03
/20
16
21
/03
/20
16
28
/03
/20
16
04
/04
/20
16
11
/04
/20
16
18
/04
/20
16
25
/04
/20
16
02
/05
/20
16
09
/05
/20
16
16
/05
/20
16
23
/05
/20
16
30
/05
/20
16
06
/06
/20
16
13
/06
/20
16
20
/06
/20
16
27
/06
/20
16
04
/07
/20
16
CFETs RMB Index
8 July 2016 OCBC Global Mid-Year Outlook 2016
Treasury Research & Strategy 9
c o m pr
isi
n g
HO
NG
KO
NG
Gloomy Economic Outlook
HK’s GDP shrank by 0.4% qoq (+0.8% yoy) in 1Q, the first contraction since 2014 amid
weak retail and trade sectors, cautious business spending and sluggish local consumer
demand. A combination of fewer visitors and tepid tourist expenditure further dragged
retail sales in April, in turn prompting the employers in this sector to increase
retrenchments. Also, sluggish trade growth resulted in high unemployment rate in the
trade and wholesale sector. Consequently, unemployment rate in HK held at an over two-
year high of 3.4% in April. Elsewhere, the continuous drop in housing prices and
consistently low borrowing costs have brought some potential home buyers back to the
market, bringing transaction volume up in April.
Weak tourism and sluggish retail sales would continue to hit the economy
Downward cycle in both the tourism and retail sector are still present due to a combination
of fewer tourists, tepid tourist spending as well as cautious local consumer sentiment.
Total value of retail sales fell for the 14th straight month in April, down by 7.5% yoy to
HK$ 35.2 billion. The retail sector remains in doldrums amid weak inbound tourism and
subdued tourists spending. The luxury segment has been the major drag on HK retail
sales, with the sales value of jewellery and watches sliding for the 19th straight month by
16.6% yoy in April.
Due to the gloomy prospect for Hong Kong’s retail sector, HK retail property market may
tumble further even as retail shop rentals and prices fell by 1.3% yoy and 7.8% yoy
respectively in March. More rental concession by landlords and higher vacancy rates in
core business district could also be expected.
Amid weak tourist activities and luxury consumption, unemployment rate in the retail
sector rose to 5.3% in April. This was disappointing as compared to an average of 4.4% in
2014. This is because business performance in retail sales was lacklustre amid shrinking
tourist spending. In the near term, HK retail sector is likely to be constrained by weak
inbound tourism activities amid Chinese economic downturn and external uncertainties, in
turn weighing down employment in this sector. Overall, HK’s labor market may worsen
further with unemployment rate expected to rise to 3.5% over 2016.
Trade remained lacklustre and fake trade invoicing increased
Exports to major markets, including China, US and Japan continued to decline. This may
reinforce the sluggish trading activities of Hong Kong.
Total exports value declined for the 12th consecutive month albeit at a slower pace, falling
by 2.3% yoy in April due to weak external demand. Meanwhile, fall of imports value
(HK$ 316.3 billion) also narrowed to 4.5% yoy in April, improving the trade deficit to
HK$31 billion. Looking ahead, though the U.K. and Germany merely took up 1.5% and
1.9% respectively of HK’s overseas shipments, demand across the globe may be
dampened amid the heightened uncertainty of global recovery after Brexit. As a result,
Hong Kong’s exports are likely to remain subdued this year. Notably, exports to Mainland
China slipped by 4.8% yoy, whereas imports from HK reported by China’s customs
jumped significantly by 203.5% yoy. The prominent mismatch in data prints points out that
8 July 2016 OCBC Global Mid-Year Outlook 2016
Treasury Research & Strategy 10
pressure of capital outflow from the onshore market is still alive.
Offshore financial activities dipped amid increasing RMB volatility in 2016
Offshore RMB deposits shrank further by 24.3 yoy for the 8th straight month to the lowest level (RMB 723
billion) since August 2013 in April as raising expectation on Fed’s summer rate hikes pushed USDCNH up
by 0.4% during the same month. On a monthly basis, RMB deposits dipped 4.8% after the previous drop
of 5.5%. Interestingly, recent deprecation of the RMB has been orderly and the PBOC managed market
expectation well via its new fixing mechanism. Nonetheless, since the RMB exchange rate would rest
more on the basket of currencies than on the USD, the PBoC seemed to become more tolerant about
RMB depreciation. Moving forward, the potential inclusion of the Korean Won to the basket and the
impact of Brexit may further increase the volatility of the RMB, and as a result, dent market sentiment of
the currency. As such, we believe RMB deposits may continue to decline moderately in coming months.
Loans for use outside HK dipped slightly by 0.5% mom (-2.2% yoy), indicating that demand for Mainland
related loan remained soft in China given lower onshore borrowing cost and banks’ increasing
cautiousness of Chinese borrowers after the series of credit events. All-in-all, Hong Kong’s restrained loan
growth can be attributed to (a) rising defaults and moral hazard issues in China’s bond market and thus
souring sentiment, (b) deterioration of credit quality in China’s enterprises due to its economic slowdown,
(c) narrowing of offshore and onshore lending rates.
Increasing need for financial integration with Mainland
The mutual fund recognition scheme launched on the 1st July in 2015 is another key step to the
liberalization of Mainland’s capital account following Shanghai-Hong Kong Stock Connect. This scheme
allowed funds domiciled in HK and China to be transacted in each other’s market. Also, Shenzhen-Hong
Kong Stock Connect is on the schedule and could be implemented in 2H 2016.
At present, QFII & RQFII are not offering enough quotas. There is no transparent quota system and it is
not easy to apply for quota. In the future, there exists hope for removal of quota system, and thus,
removing the need to open accounts in onshore market and the use of counterparty’s dealer (foreign
dealer). In addition, the One Belt One Road plan can bring in RMB investment as governments and other
long-term investors can benefit from huge earning opportunities in the emerging markets while reduce
short-term risks. Besides, OBOR plan will increase use of RMB for trading activities. All these would help
enhance HK’s role as an intermediate to connect foreign and Mainland market.
HK residential property market remained clouded
Lower housing prices (-8.2% yoy in Apr) and low borrowing costs drove housing transaction volumes up
by 2% mom to 4,586 units in May. However, as compared to the same month last year, housing
transaction activities remained subdued. The bleak economic outlook due to China’s slowdown and tame
external demand may put pressure on employers to increase retrenchments or slow wage growth, thereby
hurting investor sentiment. On a positive note, as the Brexit may translate into delays in rate hikes by the
Fed, the borrowing cost in Hong Kong is more unlikely to tick up this year, leaving room for the city’s
property market to see a more gradual correction.
On the supply front, HK private residential housing starts increased 12.15% yoy in 1Q. Figure indicates
that the housing supply in private sector could grow at a solid pace over next two to three years. Based on
the average housing starts figures, average supply of private residential units during 2016 to 2018 could
reach around 17,913 units, higher than the five-year average of around 11,397 units over 2010 to 2014.
Moving forward, we expect dimmer economic outlook coupled with a volatile stock market, especially after
Brexit, will continue to dent investor sentiment despite recent rebound in transaction volume driven by
lower prices and low borrowing cost. The increasing supply may also translate into additional downward
risks to the housing prices, which may drop by around 20% yoy by end of 2016.

8 July 2016 OCBC Global Mid-Year Outlook 2016
Treasury Research & Strategy 11
Hong Kong GDP Growth
Retail Sales Growth by Categories
Residential Property Price
Source: Land Registry, Census and Statistics Department.
8 July 2016 OCBC Global Mid-Year Outlook 2016
Treasury Research & Strategy 12
c o m pr
isi
n g
IND
ON
ES
IA
Monetary Push
At the start of this year, after we peered into the crystal ball and thought about the outlook
for the Indonesian economy in 2016, we wrote that, “For the year ahead, Indonesia can
indeed do better – albeit not by much.”
Halfway into the year, it appears that the above characterization has been holding up. For
one, the year was off to a rather uninspiring start, with GDP clocking growth of just 4.92%
yoy, falling back below 5% again after peering above it in the previous quarter. Lackluster
growth in household consumption and investment activities were the key drags on overall
GDP growth at that time.
It appears that the relatively weak momentum has extended into the second quarter. In its
latest monetary policy statement, for instance, Bank Indonesia suggested that, while Q2
GDP should be an improvement from Q1, it is likely to still be softer than expected. The fact
that it sees Q2 growth at 4.9-5.0% yoy signals that, even if Q2 does offer higher growth rate
compared to Q1, it is unlikely to be more than just second decimal point type of
improvement and that growth may be unable still to break the 5% barrier.
The sense that economic growth remains ‘stuck’ has prompted the central bank to give it
another push. Indeed, having cut its policy rate by three times successively in the first
quarter of the year, BI has reached for easing again on June 17th, by slashing its policy rate
by another 25bps. Its existing 12-month policy rate was cut from 6.75% to 6.50%, while the
7-day reverse repo rate – which is slated to be the new benchmark rate come August – was
also trimmed from 5.50% to now 5.25%.
By re-engaging in monetary policy easing, the central bank is hoping to inject new fervour
into the banking sector, in terms of passing on the lower rates and boosting credit growth
more – and thus helping to juice up the economic growth more significantly. Tellingly, in the
latest monetary policy statement, BI noted that “transmission via credit channel is not yet
optimal.”
Having picked up speed somewhat in the first quarter, there are some signs that credit
growth momentum has weakened again. The latest April loans growth stood at 8.0% yoy, a
dip compared to the 8.7% yoy the month before, for instance. The stubbornly slow credit
disbursement proved too much for BI to stomach and re-energized the easing bias.
Our sense is that the central bank is not quite done yet with rate cuts, with at least one more
rate cut for the year to bring the new benchmark rate of the 7-day reverse repo to 5.0%.
Timing will all depend on how the global factors play out once more. Our sense is that BI
remains worried that the Fed may still hike rate in July. If that were to happen against a
market that is not expecting it, then any resurgence in USD because of that would obviously
make it rather tricky for Bank Indonesia to continue the course of easing. Hence, BI may
wait until August when things look clearer to cut rate again.
In case it cannot enjoy the space to cut policy rate because of global factors, we believe
that BI will nevertheless continue to signal an easing bias to further prod the banking sector

8 July 2016 OCBC Global Mid-Year Outlook 2016
Treasury Research & Strategy 13
in extending credit more. It has already talked about broadening today’s loosening of macro-prudential
measures to vehicle financing, for instance. There is also a potential slashing of reserve requirement ratio
that it can utilize.
All in all, we see a central bank that is determined to play its part in giving the domestic economic
momentum more push, enough for us to be confident in our fairly sanguine growth outlook for Indonesia.
Moreover, with the long-deliberated Tax Amnesty Law now passed by the parliament, the potential flow of
funds could help to push growth up to 5.2% into year-end.
The fact that BI feels that it has to act repeatedly in utilizing monetary policy to boost growth also betrays
the fact that fiscal policy has limited space to do so.
On that front, it pays to remember that Indonesia has a legal limit of 3% when it comes to how much fiscal
deficit the government can run as a proportion of GDP. While even with an upward revision, the fiscal
deficit this year should be around 2.5% of GDP, the sensitivity of deficit to low tax revenue intake would
make the government cautious in terms of expenditure as well.
So far, the government is banking on the hope that the tax amnesty policy could bring in extra revenue
that will be enough to cover any potential shortfall in tax intake. While figures vary, the government itself
has talked about anticipating over IDR100tn worth of additional revenue from the policy.
The central bank’s estimate is perhaps more realistic, seeing an additional tax revenue of IDR53.4tn and
adding 0.3 percentage point to the GDP growth rate. The question of whether these estimates turned out
to be close enough to reality would have to wait for the actual uptake of the amnesty measure that is
something to look forward to in H2 this year.

8 July 2016 OCBC Global Mid-Year Outlook 2016
Treasury Research & Strategy 14
GDP Growth
Policy Rate
Loans Growth
Source: Bloomberg, CEIC, OCBC
8 July 2016 OCBC Global Mid-Year Outlook 2016
Treasury Research & Strategy 15
c o m pr
isi
n g
MA
CA
U
The Worst May Be Over
Macau’s GDP contracted for the seventh straight quarter in 1Q, falling by 13.3% yoy due to
continuous decline in gaming revenue, slowdown in investment, as well as weak domestic
and visitor consumption. Looking ahead, the expected sustained recovery in the gaming and
tourism sector, will continue to support government expenditure and boost private
expenditure.. All in all, this is likely to offset slackening domestic demand and subdued visitor
expenditure. However, as it looks to us that the gaming business is unable to return to the
past glory days, adding that tourists and local consumption may continue to take a hit, we
revise our GDP forecast for 2016 down to around 2-3% from 5.0%.
Moving forward, eyes will be on whether the increase in overnight visitors is able to sustain
and translate into growth of low-end gamblers, in turn underpinning a further pick-up in the
gaming sector. Even with recovery in the tourism activities, weak tourist expenditure and
sluggish local consumer sentiment are expected to further dampen the retail sector.
Fortunately, the city’s labour market is likely to remain strong thanks to the mismatch
between huge demand from tourism-related businesses and the tight labour supply.
Nevertheless, uncertainty over the economic transition may propel employers to slow wage
growth, which will hurt domestic sentiment and add downward pressure to the housing
market as well as the economic growth.
The gaming sector is getting over its worst time
Gross gaming revenue declined consecutively for two years, dropping 9.6% yoy in May to
MOP18.39 billion. On a positive note, the stabilization of gaming revenue confirms that the
gaming sector has bottomed out.
In the first quarter, gaming revenue declined at its slowest pace since 4Q 2014. Due to the
relentless anti-corruption campaign of China, loss of high rollers prompted casino operators
to shift their focus to the mass-market segment. VIP tables have been partially reconfigured
to serve mass-market gamblers. As the string of hotel openings has bolstered a gradual
recovery of the tourism sector, it supports the new business strategies of the casino
operators. Consequently, the share of mass-market revenue rose to 40.8% in 1Q 2016, as
compared to the average of 32.8% during 2012-2015.
Looking ahead, the gaming sector may be able to benefit further from more new hotel, casino
and theme park openings in the next 1-2 years, which are expected to lure more overnight
visitors and casual gamblers. However, while the worst is over for the gaming sector, the
sector still suffers from government caps on gaming tables growth at 3% till 2023. Also,
despite an expanding mass-market segment, the lower profitability of mass-market tables, as
compared to that of VIP tables amid lower minimum betting amount, sees the gaming sector
unable to return to the past glory days. As such, though we expect gross gaming revenue to
decrease at a slower pace in 2016 from last year, it may still fall 4%-5%.
Increasing overnight visitors with tighter purse strings
The hotel industry sees prevailing room rate cuts as hotels are struggling to maintain their
market shares after new hotel openings since last May. Increasingly favourable room rates
lured more the overnight visitors from major sources (including Mainland China), which
increased for the 9th straight month (+5.6% yoy) in April. Due to the structural change of the

8 July 2016 OCBC Global Mid-Year Outlook 2016
Treasury Research & Strategy 16
inbound tourists, total visitor arrivals decreased marginally by 0.3% yoy over the first four months. Into 2H,
upcoming data prints of visitor arrivals should be closely monitored to confirm whether Macau’s appeal to a
wider range of visitors is able to sustain, thereby bolstering the pick-up in tourism activities. Still, the
overnight visitors should keep its growth pace, especially after a fresh wave of new hotel projects
completed.
Despite signs of recovery in the tourism sector, visitor expenditure remained lacklustre. Specifically, due to
a stronger MOP, global economic slowdown and China’s anti-corruption campaign, per-capita spending of
total visitors and Mainland tourists both shrank for the 7th straight quarter in 1Q, down respectively by 14%
yoy and 18% yoy. Adding cautious local consumer sentiment, Macau’s total value of retail sales dropped at
a faster pace by 11.2% yoy in 1Q. The seven straight months of decline was attributed to slump in sales
value of Watches, Clocks & Jewellery, Goods in Department Stores and Leather Goods, all of which
accounted for 47% of total retail sales. Also, the prospects of slower wage growth may dent local consumer
sentiment. Therefore, retail sales are expected to take a further hit and dampen labour demand in the
sector.
Elsewhere, in spite of continuous solid gain in overnight visitors and hotel guests, hotel occupancy rate
continued to drop albeit at a slower rate to 79% in April amid oversupply. Looking forward, as more new
hotels are scheduled to be completed in the coming two years, the resulting increase in hotel rooms will
cap the hotel occupancy rate at 80%.
Labour market to sustain its strength
Unemployment rate held steady at 1.9% in April, reinforcing a stable labour market in Macau. As it gets
clearer that the gaming sector has already bottomed out, the employment in this sector registered robust
gains (+ 3.1% YTD). In contrast, despite the continuous growth in overnight visitors, employment in hotels,
restaurants and similar activities were down 0.3% YTD. Additionally, delays in the completion of some
hotel and casino projects have also resulted in layoffs (-6.7% YTD) in the construction sector. However, we
still believe that after the completion of a fresh wave of new hotels and casinos in the coming 1-2 years,
employment in the hotel, construction and gaming sectors will increase. Elsewhere, the outlook of the retail
and wholesale sector’s employment (-6.3% YTD) remains clouded by soft tourist spending and the
resulting slump in retail sales. In conclusion, we expect that the jobless rate will remain stable below 2.0%
this year.
Housing market is still searching for its bottom
Recent signs of the gaming sector’s bottoming out and rebound in tourism activities have underpinned
housing market sentiment. Additionally, sellers’ willingness to slash prices drove the average transaction
price down by 34.6% in 1Q from the peak in 2Q 2014. Lower housing prices and low borrowing costs as a
result have attracted some end-users of smaller units. As such, housing transaction volume sustained its
rebound in 1Q despite slimmer demand for the high-end flats, up by 9.1% yoy to 1215 units. However, the
increased transaction volume did not translate into higher demand for new residential mortgage loans
(RML), which dropped in 7 out of the past 8 months and was down by 35% yoy in April. Fears of steep
increase in borrowing cost amid Fed’s tightening may be the main reason behind homebuyers’ persistent
cautiousness of mortgage loans.
Looking ahead, though increasing labour demand from new hotels and casinos will likely to attract more
non-local residents to work in Macau, this group of labour tend to reside outside the city, providing little
support to Macau’s housing market. Slower wage growth is also expected to dent housing market demand.
Coupled with increasing supply in coming 1-2 years, housing prices (-23.6% yoy to MOP 78,745/sq.m in
April) are expected to drop 10% yoy by end of this year.

8 July 2016 OCBC Global Mid-Year Outlook 2016
Treasury Research & Strategy 17
Impact of Gaming as Export of Services on Macau GDP
Macau Gaming Revenue
Macau Residential Property Market
Source: DSEC, DICJ

8 July 2016 OCBC Global Mid-Year Outlook 2016
Treasury Research & Strategy 18
c o m pr
isi
n g
MA
LA
YS
IA
Hanging In There
The year did not start on that friendly a note for the Malaysian economy.
One of its largest trading partners, China, appeared to be struggling to keep its economy on
an even keel. While that fear soon ebbed enough for some semblance of stability to return, it
had nonetheless led to concerns about Malaysia’s export prospects and its currency stability
as well in the early months of the year.
Meanwhile, the price of oil appeared to be dropping precipitously, affecting market
perception of the sustainability of Malaysia’s current account surplus as well as its fiscal
situation. All these occurred right when domestic political situation was also hardly conducive
for sentiment, with 1MDB-related news flow dominating headlines.
Against such an inopportune backdrop, it is notable then that – despite all that – the
Malaysian economy was still, effectively, hanging in there. For one, while Q1’s GDP growth
of 4.2% yoy was indeed the lowest print since mid-2009, it nevertheless was better than
expected.
In other words, it could have been worse. What turned out to be saving grace was a number
of factors. To begin with, as mentioned earlier, the fear about China’s hard landing did
subside by early March. No less importantly, a revision to 2016 budget that the government
undertook in January began to make a more realistic assumption of oil price and prioritized
spending enough to counter market concerns about the country’s fiscal sustainability.
Still, as much as the economy has avoided the deepest pitfalls, it remains an unfortunate
reality that the underlying growth momentum remains rather weak.
Looking into the details of the Q1 GDP data, for instance, the challenging nature of eking out
growth amid a tough environment is most evident in the external sector. The exports
component of GDP showed a 0.5% yoy contraction in Q1, for instance, compared to an
already-challenged 0.6% growth in the previous quarter. Commodities slowdown continued
to be deadweight to the economy, even as exports of manufactured goods tried to keep the
whole thing above water. As a result, despite a fairly steady growth in imports, the net
exports registered a 12.4% yoy slump that hurts the overall growth print.
Tellingly, the balance of payments data that was released today as well paints a similar
story. Current account receipts for Q1 slumped to MYR5bn, compared to over 11bn the
quarter before. As a proportion of GDP, this stood at a relatively thin surplus of 1.7%.
These are some sobering numbers to be sure, but it is important to note that there remain
crucial pockets of resilience in the economy. In particular, private consumption continues to
stage a robust recovery from last year’s post-GST slump. In year-on-year terms, household
consumption grew by 5.3% in Q1, at a healthy clip that is comparable to Q4’s 4.9%. BNM
highlighted support for this sector coming from continued wage and employment growth. At
a time when external trade, especially on the commodities front, remains too much like fair-
weather friends, the fact that domestic consumption has been a more dependable source of
growth will not escape the attention of the central bank.
8 July 2016 OCBC Global Mid-Year Outlook 2016
Treasury Research & Strategy 19
Hence, given the resilience of the private spending, it is not too surprising to see BNM remaining relatively
sanguine about Malaysia’s growth prospects. The new governor, Muhammad Ibrahim, for one was quoted
as saying today that the economy remains on track to expand by 4.0-4.5% this year, something that we
agree as we keep to our 4.4% forecast.
His words of confidence have been backed by action, as well, thus far. In what was his inaugural meeting
as BNM’s governor on May 19th, he led the MPC members in keeping the overnight policy rate unchanged
at 3.25%.
Bank Negara’s decision was anchored by a palpable conviction that – despite what casual observers
might think given various headlines about the country – the underlying economic fundamentals remain
strong. Hence, more than having to consider whether there is space to ease or not, the central bank
appears to think that there is not much of a need to ease to begin with.
Tellingly, the wording in a portion of the latest monetary policy statement marks an important shift as well.
In particular, we are referring to the segment regarding private consumption. Whereas “private
consumption is expected to moderate” back on March 9th, “private consumption is expected to expand
further” in today’s statement. The fact that civil service pay is due to be increased soon is likely to be one
of the factors BNM has in mind.
The conspicuous absence of alarm regarding growth prospects is also evident in how BNM describes the
global outlook. Importantly, the central bank points out that the “Volatility in the international financial
markets has receded and investor sentiments have improved,” even if it adds that the calm is “susceptible
to policy and market developments.”
As we mentioned before, looking at how BNM looks at the world is important. Given its comfort about
domestic growth drivers, the only way in which it would turn more cautious about growth outlook and thus
become more dovish and inch towards rate cuts would be if its views of the global growth prospects
darken considerably. We do not get the sense that is happening at all from the statement.
Hence, when it comes to Malaysia, any dovish expectation that some corners of the market are harbouring
will face disappointment. Unless export numbers deteriorate massively, or the much-touted domestic
consumption uptick gets derailed somehow, here is a central bank that will most likely hold at 3.25% for
the rest of the year.
In short, as long as the economy is hanging in there, the policy rate will be, as well.

8 July 2016 OCBC Global Mid-Year Outlook 2016
Treasury Research & Strategy 20
GDP Growth
Current Account
Overnight Policy Rate and Inflation
Source: Bloomberg, CEIC, OCBC

8 July 2016 OCBC Global Mid-Year Outlook 2016
Treasury Research & Strategy 21
c o m pr
isi
n g
MY
AN
MA
R
Stabilization In Progress
Thus far, 2016 has been a year of rapid transition and change for Myanmar. Following the
landslide election victory by the National League of Democracy (NLD) in November 2015,
the new government has settled in well, and democratic transition in Myanmar has
continued apace. With strong backing from the people, the NLD government is well
positioned to deepen the much-needed reforms to bring progress to the country.
With great potential and the new government in place, we continue to be optimistic about
the economic outlook of Myanmar. Annual GDP growth in 2015 came in at a relatively low
7% due to the floods in July 2015. However, we continue to expect Myanmar to grow at a
rate of 8% to 8.5% in the medium term.
Stabilising political scene sets the stage for economic development
Htin Kyaw, a trusted aide of Aung San Suu Kyi, assumed office as the President of
Myanmar in 1 April 2016, officially ushering in the new democratic government. Ms Suu Kyi
remains central in charting Myanmar’s course as its State Counsellor and Foreign Minister.
Meanwhile, the Constitution retains the military’s presence in the Myanmar’s politics by
guaranteeing it 25% of all parliamentary seats in the Union parliament and three ministerial
positions in the Cabinet. This lingering influence of the military has been cited as cause of
concern. However, it is worth noting that the military is not in the position to block any
legislation that does not amount to a constitutional change. Indeed, it appears that the
military’s biggest scope of influence is through its participation in the parliamentary
committees that advise on specific policy areas. Even so, they will have to convince other
committee members, most of whom will invariably be democratically-elected
parliamentarians. Thus, the NLD government has significant scope in passing the
legislations supporting administrative and policy reforms, especially in areas relating to the
business and economy of Myanmar.
Transport infrastructure and tourism: Two drivers of the services sector
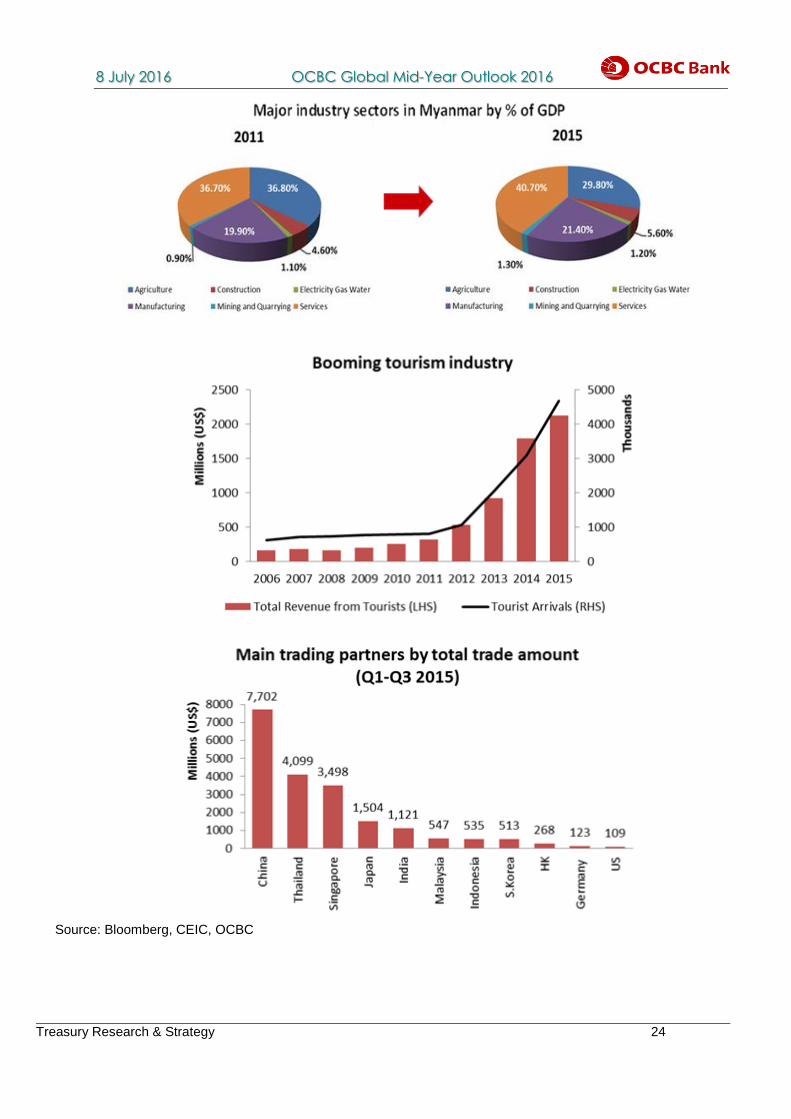
Since Myanmar took the initial steps to open up its economy in 2011, the services sector
has seen the most rapid growth. As a percentage of GDP, the services sector grew from
36.7% in 2011 to 40.7% in 2015 respectively. Moving forward, the transportation and
tourism industries are expected to drive the services sector. However, the two industries will
be in focus for very different reasons.
The call to focus more on the transportation industry is predicated on the currently poor
state of transportation infrastructure, and the resultant tendency to cause bottlenecks that
hamper the growth of other industries. The new NLD government recognizes the lack of
transportation infrastructure, ranging from railways to ports, will hamper the prospects of
Myanmar’s economic growth. Moving forward, as the government invests more in its
transport infrastructure, more opportunities should arise for corporates to be involved in this
space.
In reality, great attention has already been placed on transportation infrastructure. In
February 2016, a consortium consisting of JGC Corporation, Yongnam Holdings and
Changi Airports International overcame another regulatory hurdle in its project to build the
new Hanthawaddy International Airport when it formalized a framework agreement to with
8 July 2016 OCBC Global Mid-Year Outlook 2016
Treasury Research & Strategy 22
the Department of Civil Aviation (DCA).
When completed in 2022, the airport will be the main gateway for the Yangon metropolitan area.
Meanwhile, plans to upgrade the existing Yangon International Airport and Mandalay International Airport
are also in place. Once these developments are completed, the scope for supporting industries like
aircraft maintenance, food catering and fueling services will be immense.
Another potential growth area is the maritime ports of Myanmar. The main Yangon port is essentially
unchanged since colonial times, and will struggle to support the accelerating economic growth in
Myanmar. The single terminal within the port is dated and prone to congestion. It took emergency
measures, such as 24-hour port operation, to clear a backlog accumulated in May 2016. In addition,
supporting infrastructure like storage and logistics are also inadequate. Moving forward, it is likely that
there will be strong determination from the new government to bring meaningful improvement to this area.
On the other hand, tourism continues to be a bright spot. Tourist arrivals have skyrocketed in recent
years. Since 2011, the number of tourist arrivals grew by 41.8% per annum to reach 4.68m visitors in
2015. The Ministry of Hotels and Tourism expects 6m visitors to arrive in 2016. This forecast is likely to be
achieved given the post-election political stability. Moreover, a 30-day visa-free travel agreement between
Singapore and Myanmar will take effect on December 2016. Following the agreement, Jetstar also
announced that the frequency of flights to Yangon will be increased. These changes will further spur
business and recreational travel between the two countries.
Tourists are also spending more in Myanmar. Growth in total expenditure by tourists outpaced arrival
figures, growing 52.9% per annum since 2011. Tourist spending amounted to over US$2.1b in 2015,
making up approximately 3.3% of Myanmar’s GDP. With the current growth trends in tourist arrivals and
per tourist expenditures, tourism is likely to contribute much more significantly to Myanmar’s GDP. In the
medium term, we expect tourism to contribute about 5-6% of GDP.
While significant in itself, the true value of tourism to the economy lies in its ability to generate positive
externalities in the economy. With the growth of the tourism industry comes the development of
supporting industries. A case in point is the construction industry. In recent years, the increase in the
number of hotel rooms has not kept pace with tourist arrivals. Consequently, the relative shortage of hotel
rooms has resulted in the development and construction of newer and larger hotels in Myanmar,
especially in the Yangon metropolitan area. Apart from construction, industries like food and beverage,
entertainment and hospitality may also enjoy the spillover effects of the increase in tourists.
Formidable challenges remain
In May 2016, the U.S. sanctions on Myanmar were renewed with changes that amounted to easing in
some respects. It is now easier for U.S. nationals to conduct day-to-day business transactions, such as
transportation of goods and banking through local banks. Six companies were also removed from the
Specially Designated Nationals (SDN) List. U.S.-nationals are not permitted to have business dealings
with persons or entities on the SDN List. While these are steps in the right direction, major impediments
remain. The SDN list runs more than 900 pages long, covering the majority of Myanmar’s largest
businesses.
The argument that Myanmar will still progress well in spite of the sanctions is not without justification.
Nevertheless, having the potential of deeper U.S.-Myanmar business ties hampered by the sanctions is a
wasted opportunity. Although major U.S. companies, such as General Motors and Coca-Cola have
pledged to establish operations in Myanmar, the overall presence of U.S. companies in the Myanmar’s
economy is still limited. Bilateral trade between the Myanmar and the U.S. is also insignificant. From a
commercial perspective, Myanmar should benefit from a greater U.S. involvement in its quest to jumpstart
the economy and reintegrate into the global business environment.
8 July 2016 OCBC Global Mid-Year Outlook 2016
Treasury Research & Strategy 23
In addition, the sheer scale of the task facing the NLD government should also not be underestimated.
Frictions in the transition process remain to be surfaced and be addressed, especially in the different
administrative arms and agencies of government. These will take time to be surfaced and addressed. A
case in point is the Myanmar Investment Commission (MIC), the agency that grants approvals for foreign
investment into Myanmar. The previous commission, consisting of members appointed by the ex-
President Thein Sein, saw their tenure expire in March following the inauguration of the new government.
However, the new commission was only appointed in early June. In the meantime, potential investments
totaling US$2.3 billion were delayed. Moreover, approvals granted by the previous MIC to a hospital
project and a port extension were reversed. These frictions will undoubtedly create some anxiety among
the business community. However, we expect that these issues will be alleviated over time as the new
government settles into its role.
Cautious optimism on the continued progress of Myanmar
Expecting an overnight improvement in Myanmar’s business and economic outlook would be unrealistic.
As the euphoria of the election victory subsides, the new NLD government settles into the daily grind of
governance. Inevitably, challenges will continue to arise in the transition process. However, with the
strong mandate that the new NLD government possesses, it will be afforded the time to address them in
due course.
We urge patience when it comes to Myanmar. Undoubtedly, Myanmar has the building blocks of a thriving
economy. However, formidable challenges remain in the short term. We continue to be cautiously
optimistic over Myanmar, expecting it to achieve growth rates of 8% to 8.5% per annum in the medium
term.
8 July 2016 OCBC Global Mid-Year Outlook 2016
Treasury Research & Strategy 24
Source: Bloomberg, CEIC, OCBC

8 July 2016 OCBC Global Mid-Year Outlook 2016
Treasury Research & Strategy 25
c o m pr
isi
n g
SIN
GA
PO
RE
Staying The Course In 2H16
Another challenging first half for the economy
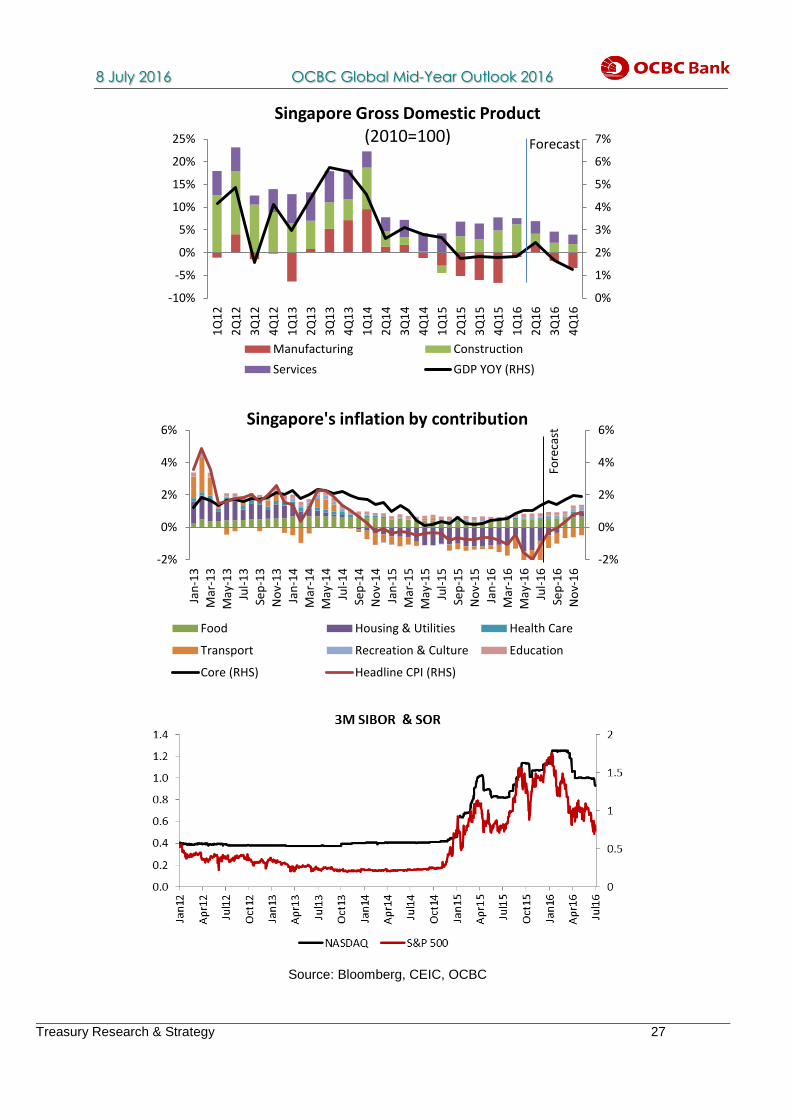
Given the global growth headwinds, Singapore’s first quarter GDP growth turned out to be a
lackluster +0.2% qoq saar (+1.8% yoy), but just avoided an on-quarter contraction. As a
testament to the deflationary forces prevailing globally, the MAS also adopted at its April
2016 monetary policy review a neutral slope for the SGD NEER, which was last seen during
the post-GFC, citing that inflation had been generally undershooting expectations and core
inflation is likely to average slightly below 2% due to an extended period of globally low
inflation. Manufacturing and export growth remained in the doldrums, partly due to disparate
trends of China’s insourcing of intermediate goods and services and US’ re-shoring trends,
in addition to sluggish global demand.
Downside risks to the 2016 GDP growth forecast persist
The official 2016 growth forecast remains at 1-3%, but downside risks prevail and suggest
that a 1-2% range is more plausible. As such, we expect the official growth forecast to be
narrowed to 1-2% yoy at a later stage. Note that external demand remains very weak,
notwithstanding the recent May NODX blip (+11.6% yoy). After a very weak NODX
performance (-9.0% yoy) in 1Q16, IE Singapore had also pared its full-year NODX growth
forecast from 0-2% to -5% to -3%, as total trade forecast is anticipated to contract -8% to -
6% this year. Given the ongoing China slowdown story and a potentially acrimonious US
presidential elections coming up in November this year, the various trade initiatives like the
Trans-Pacific Partnership may not gain much traction in the interim. Our NODX growth
forecast remains at -4.4% yoy, which would mark a 4th year of contraction and further
deterioration from 2015’s 0.1% decline.
But barring downside risks, growth expectations may be bottoming
Latest MAS Professional Forecasters Survey shows a slight downgrade in 2016 growth
forecast from 1.9% three months ago to 1.8%, the NODX forecast to -2.1%, and CPI to -
0.4%. Our growth forecast remains at 1.8%. The silver linings are the public infrastructure
spending which is holding up the public construction activity pipeline, coupled with the
recovery in visitor arrivals and sustained growth in financial and business services in the
interim. That said, 2Q16 GDP growth could still shrink quarter-on-quarter, and the possibility
of a technical recession materializing by 3Q16 remains.
Headline inflation continued to stay in negative territory in 2016
Headline CPI prints, which have already marked the longest slump on record, are expected
to stay negative throughout 2016, but MAS core inflation remains solidly in positive territory
for now despite reduced tightness in the labour market. Global crude oil prices have crept
higher over 1H16 but the US$50 handle remains a key resistance. Given that crude oil
prices averaged around US$45 in 2H15, oil-related prices could start seeing a positive
contribution to headline inflation if current levels are sustained. The latest MAS Professional
Forecasters Survey saw the street downgrade the headline inflation forecasts for 2016 to -
0.4% (previously -0.2% three months ago) but kept the MAS core inflation forecast
unchanged at +0.8%. Our house forecast for both headline and MAS core inflation remains
at -0.4% and +1.0% yoy respectively.
8 July 2016 OCBC Global Mid-Year Outlook 2016
Treasury Research & Strategy 26
Business sentiments remain cautious heading into 2H16
The latest business surveys suggest slightly less bearish sentiments across manufacturers and services
firms for the second half of the year, but few domestic catalysts rise to the top of the mind in the near-term.
Even MAS warned in the Macroeconomic Review that corporate margins could come under further strain in
the near term amid the weak external demand conditions and sluggish domestic growth environment. Note
total bank loans had already fallen for 7 consecutive months in April, overtaking the Nov1999-Apr2000
period as the longest duration whereby loans growth fell year-on-year. Notably, business loans could
continue to decline due to the drag from general commerce and the marine & offshore industry. This
suggested that private sector business sentiments remain very cautious at this juncture. Consumer bank
loans, however, continued to expand year-to-date, supported by housing/bridging loans. The recent easing
of auto loan measures may also mean more support for consumer loans, albeit it remains a small segment
(just 3%) of the consumer loan market. Our forecast is for bank loans growth to shrink 0.2% yoy for 2016.
Policy settings to remain accommodative with the challenging external economic environment
The 3-month SIBOR has been very stable since April around the 1% handle, while the 3-month SOR has
also treaded lower and is nearing its year-to-date low of 0.81% as a more dovish FOMC weighed on the
broad USD sentiment. The key question is if we will see a replay of the 2015 pattern where 2H saw greater
interest rate volatility. The majority of FOMC members are still pencilling in one to two rate hikes this year,
albeit market pricing is currently discounting even that probability. Our year-end forecasts for the 3-month
SIBOR and SOR have been updated to 1.05% and 0.9% respectively. SGS bonds should remain
supported in a relatively stable interest rate environment. In terms of longer-dated SGS bond issuance,
there is only a new 20-year SGS bond for auction on 1 August.
Labour market conditions should continue to soften, but the unemployment rate will remain low
The overall unemployment rate was unchanged at 1.9% in 1Q15. However, the decline in resident and
citizen unemployment rate was largely attributable to a lower labour force participation rate among youths
aged 15-24. Redundancies, which stood at 4,600 in 1Q16, is lower than the 5,370 registered in 4Q15, but
is nevertheless still the highest since at least 1Q12. Going forward, we expect that layoffs may potentially
pick up amid a more cautious business outlook and ongoing economic-cum-business restructuring,
particularly given the business consolidation in some sectors like manufacturing and retail trade. The
unemployment rate may average around 2.1% for the full year of 2016. Wage growth, on the other hand,
should moderate from 2015 but remained positive due to the negative headline inflation print. Resident
wage growth is tipped to be 2.5-3% this year versus 3.5% in 2015.
Fiscal policy still has room to step up, but may be more a 2017 story
The Committee for Future Economy (CFE), which is supposed to prepare for longer-term challenges and
structural changes in the Singapore economy, is due to release its recommendations at the year-end. This
follows the earlier Economic Review Committee in 2001 and the Economic Strategies Committee in 2009.
The adoption and implementation of the CFE recommendations are likely to materialize only in 2017,
possibly accentuated by the FY17 Budget announcement in early 2017. The FY16 Budget had projected an
overall surplus of $3.4 billion (equivalent to 0.8% of GDP), compared to a $4.9 billion (1.2% of GDP) in
FY2015, but was estimated to mildly expansionary. The FY17 Budget would mark the second year of the
new government and has scope to be more supportive of the Singapore economy should growth and
inflation conditions deteriorate further from here and a further boost to the restructuring efforts are required.
8 July 2016 OCBC Global Mid-Year Outlook 2016
Treasury Research & Strategy 27
Source: Bloomberg, CEIC, OCBC
0%
1%
2%
3%
4%
5%
6%
7%
-10%
-5%
0%
5%
10%
15%
20%
25%
1Q
12
2Q
12
3Q
12
4Q
12
1Q
13
2Q
13
3Q
13
4Q
13
1Q
14
2Q
14
3Q
14
4Q
14
1Q
15
2Q
15
3Q
15
4Q
15
1Q
16
2Q
16
3Q
16
4Q
16
Singapore Gross Domestic Product(2010=100)
Manufacturing Construction
Services GDP YOY (RHS)
Forecast
-2%
0%
2%
4%
6%
-2%
0%
2%
4%
6%
Jan
-13
Mar
-13
May
-13
Jul-
13
Sep
-13
No
v-1
3Ja
n-1
4M
ar-1
4M
ay-1
4Ju
l-1
4Se
p-1
4N
ov-
14
Jan
-15
Mar
-15
May
-15
Jul-
15
Sep
-15
No
v-1
5Ja
n-1
6M
ar-1
6M
ay-1
6Ju
l-1
6Se
p-1
6N
ov-
16
Singapore's inflation by contribution
Food Housing & Utilities Health Care
Transport Recreation & Culture Education
Core (RHS) Headline CPI (RHS)
Fore
cast

8 July 2016 OCBC Global Mid-Year Outlook 2016
Treasury Research & Strategy 28
c o m pr
isi
n g
TA
IWA
N
Muddling Through Global Uncertainty
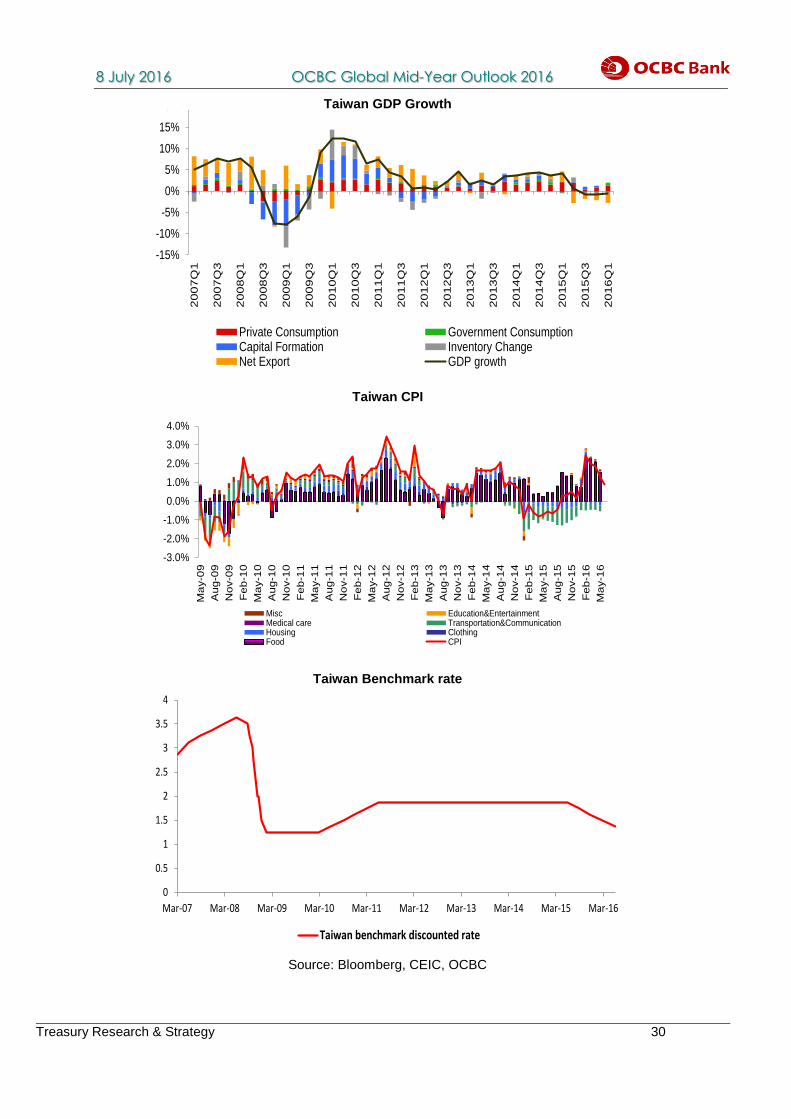
Taiwan’s economic growth contracted by 0.68% yoy in the first quarter of 2016, down for
three consecutive quarters. The contraction was mainly attributable to two factors including
weaker than expected external demand as well as sluggish investment.
External shock
Among the entire GDP component, external demand has been the main drag for the past
few quarters. Net export fell by 29.19% yoy in 1Q, dragging down growth by 2.29% in 1Q
and overshadowing 1.59% contribution from domestic demand. The external shock to
Taiwan’s GDP was mainly the result of uncertain global situation as well as the slowdown in
China’s growth. Taiwan’s export growth fell by 10.5% yoy in the first five months, but in line
with the decline trend in the region due to sluggish global recovery. In addition, the
slowdown in Chinese economic growth as well as China’s economic restructuring also
weighed down Taiwan’s export prospect. The historical data shows that Taiwan’s export
growth has been positively correlated with China’s import growth. The further decline of
China’s import hurt by excessive capacity also negatively impact Taiwan’s export growth.
Limited fiscal room for counter cyclical stimulus
In addition to the decline in net export growth, capital formation also fell by 0.5% in 1Q 2016
due to budget constraints after expanding by three straight quarters. Taiwan has been
running a fiscal deficit for many years. Compared with its neighbouring competitor South
Korea, there is limited room for Taiwan to roll out a big stimulus to boost public investment
to counter cyclical slowdown. South Korea plans to announce a 20 trillion won stimulus
package to support growth following the unexpected Brexit results while the room for
Taiwan seems to be limited given the fiscal constraint.
Consumption remains steady
Private consumption remains steady, growing by 2.19% despite weaker job market.
However, looking ahead, the outlook of private consumption remains murky due to the both
cyclical slowdown and structural shock. Cyclically, Taiwan’s job market deteriorated further
due to uncertain external environment. Unemployment rate rose to 3.87% while nominal
wages posted negative growth. Structurally, the aging problem is expected to kick in.
According to the latest estimation, Taiwan’s working population peaked in 2015 and is
expected to shrink by an average of 180K every year from 2016. This may structurally
impact Taiwan’s consumption behaviour.
Muted inflationary pressure
Taiwan’s CPI re-accelerated in the first quarter from the contraction of 0.3% in 2015 on the
back of a recovery of oil prices and higher food prices due to extreme weather. CPI grew
1.7% on average in 1Q but slowed to an average of 1.3% in 2Q. However, the negative
output gap continued to suppress the inflationary pressure. Given that the upside risk for oil
price in the second half is likely to be capped, Taiwan’s CPI is expected to hover around 1%
assuming no shock to food prices.
More easing still possible
Taiwan’s central bank has entered the easing cycle since September 2015 to support
growth. Benchmark interest rate has been cut by four times from 1.75% to 1.375% due to
8 July 2016 OCBC Global Mid-Year Outlook 2016
Treasury Research & Strategy 29
sluggish economic outlook and modest inflationary pressure. CBC became the first central bank in the
region to cut interest rate following the unexpected result of Brexit as pre-emptive measures to stabilize the
market sentiment. However, as mentioned by CBC Governor Peng that monetary policy is very loose now
and cannot be overly used.
Despite year-on-year contraction, Taiwan’s economy may have found the bottom in 3Q 2015. The
economy expanded by annualized 3.14% quarter-on-quarter seasonally adjusted in 1Q 2016. Given the
favourable base effect, we expect the yoy economic growth to go back to positive territory in the second
half of the year. As such, the need for additional monetary easing may start to taper. The future policy path
may be data dependant. We expect one more interest rate cut in September before CBC ends its the
current easing cycle.
On the currency front, Taiwan dollar has surprisingly held up well in the first half of the year in the form of
both spot and effective exchange rate, unaffected by monetary easing and RMB weakness thanks to tight
management by the central bank. Taiwan dollar has appreciated against RMB by more than 4.5% year to
date. The delay of Fed tightening may lend some supports to Taiwan dollar. However, we doubt the current
strength will last in the second half. We think the recent rate cut may eventually press the currency
downward and the USDTWD is expected to test 32.50 again.
To conclude, although Taiwan’s economy is projected to return to positive in the second half, the economy
is likely to underperform as a result of uncertain external environment following the Brexit shock as well as
the drag by the slowdown in China. We downgrade our GDP forecast for 2016 to 0.9%.
8 July 2016 OCBC Global Mid-Year Outlook 2016
Treasury Research & Strategy 30
Taiwan GDP Growth
Taiwan CPI
Taiwan Benchmark rate
Source: Bloomberg, CEIC, OCBC
-15%
-10%
-5%
0%
5%
10%
15%
20%
20
07
Q1
20
07
Q3
20
08
Q1
20
08
Q3
20
09
Q1
20
09
Q3
20
10
Q1
2010Q
3
20
11
Q1
20
11
Q3
20
12
Q1
20
12
Q3
20
13
Q1
20
13
Q3
2014Q
1
20
14
Q3
20
15
Q1
20
15
Q3
20
16
Q1
Taiwan GDP growth
Private Consumption Government ConsumptionCapital Formation Inventory ChangeNet Export GDP growth
-3.0%
-2.0%
-1.0%
0.0%
1.0%
2.0%
3.0%
4.0%
Ma
y-0
9
Aug-0
9
No
v-0
9
Feb
-10
Ma
y-1
0
Aug-1
0
No
v-1
0
Feb
-11
Ma
y-1
1
Aug-1
1
No
v-1
1
Feb
-12
Ma
y-1
2
Aug-1
2
No
v-1
2
Feb
-13
Ma
y-1
3
Aug-1
3
No
v-1
3
Feb
-14
Ma
y-1
4
Aug-1
4
No
v-1
4
Feb
-15
Ma
y-1
5
Aug-1
5
No
v-1
5
Feb
-16
Ma
y-1
6
Misc Education&EntertainmentMedical care Transportation&CommunicationHousing ClothingFood CPI
0
0.5
1
1.5
2
2.5
3
3.5
4
Mar-07 Mar-08 Mar-09 Mar-10 Mar-11 Mar-12 Mar-13 Mar-14 Mar-15 Mar-16
Taiwan benchmark discounted rate
8 July 2016 OCBC Global Mid-Year Outlook 2016
Treasury Research & Strategy 31
c o m pr
isi
n g
TH
AIL
AN
D
Why Is The Land Of Smiles Frowning?
Choose Thailand as a holiday destination, and you will not be disappointed. This Asian
country is home to an extremely vibrant history and gorgeous landscapes, endless
opportunities for bargain shopping in the famous Chatuchak Weekend Market, and most
importantly, a deeply religious culture that is entirely unique to this nation. Aptly coined as
being the Land of Smiles, for one holiday trip that offers so much, any tourist would be
beaming from cheek to cheek.
Arguably, the same may well be said for a Thai citizen on the streets. According to
Bloomberg Misery Index in 2015 and 2016, Thailand has retained its bottom place (meaning
being the happiest economy) given low unemployment and inflation levels. In addition, the
peace that ensued after the military takeover has also likely lifted both consumer and
business confidence, seen from the uptick in both indices in 2015. Afterall, the Thai people
would pride themselves as being part of a Teflon economy, where economic growth at this
stage is expected to accelerate further from 2015’s levels even in the face of a lackluster
external environment.
Smile turning to a frown
Moving into the second quarter of 2016, this said smile is slowly turning into a frown. Much
has changed since the start of this year; Thailand’s consumer confidence has fallen to its 8-
month low in May, a tell-tale sign that economic challenges are gradually crippling
sentiments. Although unemployment levels remains at a coveted 1.0% as of April 2016, the
labor participation rate suggests an entirely different tale. Empirically, the participation rate
has fallen to its record low to 68.5%, suggesting that a significant part of its population that
are supposed to be economically active (typically refers to ages 16 to 64), plays no part in
contributing labor and growth to the economy.
In addition, further investigations show that the agriculture sector, still accounting for about
40% of total labor force, has seen a sizable fall in employment levels, suggesting that the
recent drought and consequential poor harvests have left farmers idle. Thailand has long
served as one of the world’s key producers of rice, and the water shortages seen since last
year have hit nearly a third of Thailand, particularly in the rice-producing provinces. This had
left farmers no choice but to plant only one rice crop in the year, versus the norm of three
rice crops during water-abundant periods. Translating this into economic prints, the growth
in the agricultural sector saw a 1.5% contraction in 1Q16, while farmers’ income reportedly
fell by 7%. Moreover, the sudden realization of unemployment amid the need to tide through
the dry season had probably contributed to higher household debt levels as well.
More stark however is the sustained deterioration of Thailand’s economic fundamentals, led
by the still lackluster external environment. Empirically, exports in dollar terms had
contracted for 13 straight months till January this year, before resuming its decline again (-
8.0% yoy) in April. Elsewhere, imports as a signal of falling oil prices and tapering consumer
demand also resulted in its 10th straight month of contraction. Should we observe the
industry sentiment prints across Thailand’s key sectors, we can see that confidence levels in
machinery, electronics, petroleum and automobile have remained in the doldrums since the
start of year (as well when compared on the year-on-year basis). To exemplify matters,
these industries make up Thailand’s key export sectors, with chemical & petroleum constit-

8 July 2016 OCBC Global Mid-Year Outlook 2016
Treasury Research & Strategy 32
uting 11% of total exports (down from 14% back in 2013), electronics, machinery & equipment at 24%,
while automobile stands at a strong 14%.
Further economic uncertainty may also be seen from the current post-Brexit environment. Noting that
Thailand’s key economic drag has stemmed from the deterioration of trade numbers, the lack of policy
direction by the European officials after 23rd June’s awkward divorce would certainly bring about
undesirable risk-off ripples into Asia, including Thailand. Just focusing on the trade numbers, it may be
seen as a cup half-full, given that Thailand’s percentage of total trade with the EU has fallen from almost
20% back in 1991 to a current 8.9% in May 2016. Still, EU is Thailand’s 4th largest trade partner, after
China, Japan and the US, suggesting the first direct impact to Thailand from the Brexit fallout may come
from worsening trade numbers.
Last but not least, as we approach the upcoming August referendum, much concerns surrounding this
issue has naturally surfaced. According to a poll made by Suan Dusit Poll, the top concerns surrounding
the political issues includes the fear of political division (84.7%), its detrimental effects to economic growth
(81.5%) and presence of corruption within the political arena (76.2%). Their concerns are not without
grounds given the many years of political divide amid past violence seen as a result. Elsewhere, political
arrests made ever since the junta took over had picked up over the last year, especially as open criticisms
over the upcoming referendum is deemed illegal. To exacerbate matters, even the sale of “Vote No” t-
shirts, deem as propaganda against the vote for the referendum this August, constitutes a 10-year prison
sentence.
A sturdy ship in rough waters
At the very least, much of the policy in place is aiding economic growth. The government’s aim to pursue
large-scale infrastructure projects investment, namely the ambitious earmark of THB1.6 - THB1.9 trillion
worth of transportation projects is a strong driver to cushion the lackluster external environment. Elsewhere
on the monetary policy front, Thailand’s benchmark interest rate at 1.50% remains highly accommodative,
while the central bank’s reluctance to cut interest rates further signals its priority to keep imbalances in
check. Moreover, the peace that ensued with the junta government in place has aided international
confidence and encouraged tourist arrivals which contributed a healthy THB708bn (+17.3%yoy) of tourism
revenue in the first five months of 2016.
Moreover, Thailand’s economic make-up remains favorable to overall growth, a key reason as to why
growth is able to accelerate into 2017 despite the various political and economic challenges.
Encouragingly, its huge domestic consumer base private consumption still accounts for over 50% of gross
domestic product, thus enabling consumer demand to provide an effective cushion against the dull external
environment. In addition, the Land of Smiles should remain an attractive avenue for foreign investment,
with Gross Fixed Capital Formation accounting for a quarter of GDP, especially with the cabinet’s approval
to double tax breaks for private investors.
Still, while much has been done to spur growth, one key exogenous factor faced by the policy makers has
little mitigating solutions: weak export growth seen since 2015 have dragged the already stagnant
manufacturing sector. Empirically, Thailand’s manufacturing sector is a significant component of growth
and contributes close to 30% of overall GDP. This same sector however, was the worst performing non-
agriculture sector, printing a worrying 0.33% contraction in 1Q16. Still, do note that a lackluster
manufacturing sector is not isolated to Thailand itself; the weak oil prices amid sustained slowdown in
Chinese import demand (contracted for 19 consecutive months now) have led overall lower trade value.
Time will tell…
It is the mix of appropriate monetary governance, societal peace and more importantly, the ambitious
disbursement of public expenditure that would give economic growth the much needed support. At least on
paper, Thailand’s ability to print above 3.0% growth this year (vs 2.8% in 2015) with the help of state
spending and growing tourism revenue would bolster both domestic and international confidence.

8 July 2016 OCBC Global Mid-Year Outlook 2016
Treasury Research & Strategy 33
Still, the Thai people may likely see little glee in the prints, given the ballooning indebtedness seen since
2013 with the rollout of the car buying scheme, exacerbated by the falling income in both the manufacturing
and agricultural sectors. Elsewhere, pockets of unhappiness may also surface as we near the August
referendum, especially with the curb on open debate and criticism over the referendum outcome itself. The
risk of political uncertainty and prolonged military rule may be possible Post-August as well, as Prime
Minister Prayuth Chan-ocha is expected to order another constitution draft to be drafted by the Constitution
Drafting Committee (CDC) should the upcoming referendum be voted down.
So far our discussion has focused largely on the nation’s economic prospect and societal happiness.
Beyond that, while we worry over the Brexit’s influence on Thailand’s economic growth, we are comforted
by Thailand’s strong growth fundamentals and its falling reliance on EU trade. Barring an extreme risk-off
scenario from the Brexit fallout, we keep our growth forecast for 2016 at 3.2%, while inflation to turn
positive to average 0.4% this year. With this growth potential, we expect the Bank of Thailand to prefer to
keep economic imbalances in check by adhering to its 1.50% interest rate handle for the entire year.
At the very least, PM Prayuth’s “Return Happiness” campaign back in 2015 has worked wonders. Given the
choice of political instability and bloodshed versus the pick-up in both domestic and international
confidence, it is no wonder that Prayuth’s “Return Happiness” song topped the Thai radio chart briefly in
2015. Still, the challenge is to keep the happiness of the people on the table, a reality that is appearing
increasingly arduous as we approach the August referendum.
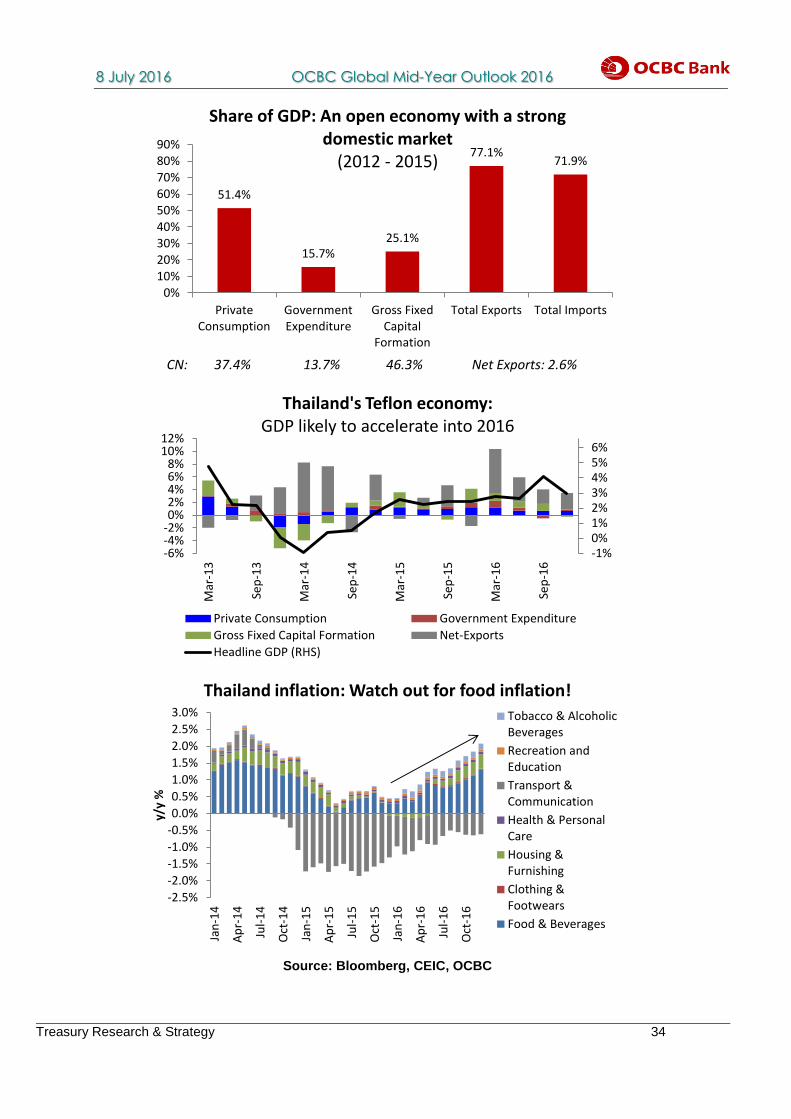
8 July 2016 OCBC Global Mid-Year Outlook 2016
Treasury Research & Strategy 34
Source: Bloomberg, CEIC, OCBC
51.4%
15.7%25.1%
77.1%71.9%
0%10%20%30%40%50%60%70%80%90%
PrivateConsumption
GovernmentExpenditure
Gross FixedCapital
Formation
Total Exports Total Imports
Share of GDP: An open economy with a strong domestic market
(2012 - 2015)
CN: 37.4% 13.7% 46.3% Net Exports: 2.6%
-1%0%1%2%3%4%5%6%
-6%-4%-2%0%2%4%6%8%
10%12%
Mar
-13
Sep
-13
Mar
-14
Sep
-14
Mar
-15
Sep
-15
Mar
-16
Sep
-16
Thailand's Teflon economy: GDP likely to accelerate into 2016
Private Consumption Government Expenditure
Gross Fixed Capital Formation Net-Exports
Headline GDP (RHS)
-2.5%
-2.0%
-1.5%
-1.0%
-0.5%
0.0%
0.5%
1.0%
1.5%
2.0%
2.5%
3.0%
Jan
-14
Ap
r-1
4
Jul-
14
Oct
-14
Jan
-15
Ap
r-1
5
Jul-
15
Oct
-15
Jan
-16
Ap
r-1
6
Jul-
16
Oct
-16
y/y
%
Thailand inflation: Watch out for food inflation!
Tobacco & AlcoholicBeverages
Recreation andEducation
Transport &Communication
Health & PersonalCare
Housing &Furnishing
Clothing &Footwears
Food & Beverages
8 July 2016 OCBC Global Mid-Year Outlook 2016
Treasury Research & Strategy 35
c o m pr
isi
n g
VIE
TN
AM
Paving The Way For A Brighter Future
The first half of the year came as a shock to Vietnam with its cumulative GDP growth as of
1Q 2015 slowing to 5.46%, marking the first slowdown in economic growth since 2014.
However, even with the slowdown, the up-and-coming South East Asian nation continues to
show strength and resilience, with its industrial/construction sector continuing to grow at
6.72% year-on-year, while service sector growth headlined at 6.13% for the same period.
Deeper analysis of the underlying data also indicates that the dip in economic growth was
mainly a result of disappointing agricultural output that was severally hit by unfavourable
weather conditions. Rice production derived from the Mekong Delta, reportedly dropped by
6.2%, pulling overall agricultural production down by 2.69% year-on-year, a surprise for a
sector that averaged a consistent 2% growth ever since 2014. Elsewhere, inflation picked
up from last year’s lows as concerns over the oil glut subsided with crude prices steadily
climbing back up to US$50per barrel. Given that 2016’s official inflation target still remains
set at 5%, it remains to be seen if rising healthcare and education prices will bring back
fears of an overheating economy or allow the economy to settle below its target. On the
whole, we continue to expect Vietnam’s growth to remain strong in the second half of 2016
on the back of greater foreign investments, particularly from its greater economic
partnerships from its trading partners.
More good things to come
In tandem with its notable economic growth, 1H 2016 has seen manufacturing and industrial
production heading towards new highs as foreign investments continue to drive economic
development despite a volatile global environment. A breakdown of Vietnam’s industrial
production by the country’s general statistics office found that the country averaged a 6.67%
year-on-year growth in 1Q 2016, beating other regional developed economies such as
Singapore and South Korea that posted an average of 2.63% and -0.17% respectively for
the same periods.
For the second half of 2016, we continue to expect the trend of accelerating FDI to support
manufacturing especially given the nation’s proactive stance to greater economic
integration. Vietnam’s leap into the global economic landscape has also garnered World
Bank support which had recently extended US$150 million worth of loans to (1) maintain
economic stability through strengthening financial sector governance and fiscal
management, (2) create a more transparent, efficient and accountable public sector, and (3)
improve business environment. The World Bank also believes that Vietnam has the
potential for greater growth and prosperity. Hence, as Vietnam continues its process of
socio-economic reforms, the foundation for sustainable growth is expected to strengthen
exponentially.
Furthermore, let’s not forget the many Free Trade Agreements (FTA) that Vietnam had
established in the recent 5-years, the biggest being the Trans-Pacific Partnership (TPP).
Leveraging on these FTAs, the potential for Vietnam’s manufacturing growth extends itself
both in the medium and long term, ensuring sustainable levels of growth as more inflows
from partner countries look towards ASEAN to facilitate their operations. Coupled with its low
cost of labour and production, the contention for Vietnam to be an alternative to China as the
next “factory of Asia” is certainly supported. Against the backdrop of the Chinese economic
slowdown and its shift towards a more service-oriented economy, Vietnam is positioned to
8 July 2016 OCBC Global Mid-Year Outlook 2016
Treasury Research & Strategy 36
“pick up the slack” in manufacturing within the global economy. With May’s Purchasing Managers Index
(PMI) climbing further to 52.7, the highest in a year, business conditions in 2016 have clearly shown signs
of improvement, signalling an expansionary manufacturing sector.
In addition, as reported by the Japanese Ministry of Economy, Trade and Industry, 1,500 Japanese
businesses have already been reported to be operating in the Vietnam as of May 2016, while a total of
3,000 projects with a total registered capital of over US$39 billion being invested in the economy. With
Japan being the country’s largest official development assistance (ODA) provider, this number is expected
to skyrocket as the two nations continue to enhance collaboration through infrastructure development,
education and training. Moreover, during the recent 25th World Economic Forum on ASEAN, Vietnam’s
efforts for economic integration were also recognized, with Malaysia pledging to boost trade and
investment through the Vietnam – Malaysia action programme. As such, with Vietnam’s industrial
production continuing to be in the limelight of global growth, we also expect manufacturing to not only
improve but to accelerate in the medium term.
A trade deficit: but not to worry
Meanwhile, Vietnam’s trade balance continues to register a surplus, coming in at US$1.36 billion year-to-
date as total exports (US$67.7 billion) overtook imports (US$66.3 billion). The surplus came on the back of
accelerating export growth, as exports deriving from the domestic sector reached a high of +6.8% year-on-
year in May itself. Among its trading partners, export growth to China rose by 16.5% year-on-year, while
exports to the United States saw an uptick of 14.9% for the same period as well. However, despite
improving export prints, Vietnam’s Ministry of Industry and Trade (MoIT) continues to anticipate an overall
trade deficit at the end of 2016.
In line with MoIT’s forecast, we also expect Vietnam’s trade balance to snap into a deficit at the end of
2016 due to the loss in export competitiveness. Despite having close trading ties with China, the Middle
Kingdom still remains one of Vietnam’s close competitors when it comes to the global export space. Within
the first five months of 2016, the Chinese Yuan has already depreciated by 5% on a nominal effective
exchange rate basis (OCBC calculations) and is expected to fall further as China continues to move its
exchange rate towards a market-driven system. Moreover, with the expectation that the dollar is expected
to climb at the end of the year due to the Fed’s lift off, pressures amount for the Yuan to depreciate further
into 2H 2016. With the risk of a weakening Yuan, Vietnamese firms face greater pressures to remain
competitive.
On the other hand, total imports are expected to increase both in the near and medium term as Vietnam
continues to forge closer ties with its trading and investment partners. Specifically, with the active
expansion and development of Vietnam’s manufacturing sector, demand for imported machinery and
materials for infrastructure development would certainly be expected to climb in tandem. Furthermore,
healthier domestic consumption also provides another reason for imports to rise. As reported by the
General Statistics Office of Vietnam, retail sales in May grew by 9.1% on the back of greater trade and
service growth.
Nonetheless, a trade deficit does not necessary spell doom and gloom for Vietnam. On the contrary, as
imports are focused on materials used for future development, import growth would likely moderate once
Vietnam establishes its position as a global manufacturer. Meanwhile, export competitiveness should also
improve as MoIT continues to devise measures for tackling business obstacles and improving production
capacity.
Inflation: On its way back up
Elsewhere, headline inflation printed an average of 1.6% in the first half of 2016, picking itself up from
2015’s lows. Notably, since November 2015’s CPI print of 0.34%, domestic prices have been steadily
increasing, reaching 2.28% in May. The rise in CPI was brought about mainly due to sharp spikes in
medical and healthcare prices, which surged from 1.73% in February to 26.8% year-on-year in May.

8 July 2016 OCBC Global Mid-Year Outlook 2016
Treasury Research & Strategy 37
Overall prices were also pushed up by the food component, which were largely affected by supply-side
shocks that came in the form of severe droughts. Interestingly, on a year-on-year basis, transportation
prices remained in deflationary territory as the effects of the oil glut continued to weigh on electricity and
gasoline prices. However, the drag is likely to abate as prices of the sticky liquid had already begun to rally
in recent months, even crossing US$50 per barrel. From further observation of the monthly inflation figures,
transport prices have already returned to inflationary territory, registering a 2.39% month-on-month growth
in May. Accordingly, core inflation, which excludes food and energy prices, continued to remain relatively
unchanged, printing an average of 1.78% for the first five months of 2016.
Looking ahead, we continue to expect headline inflation to pick to 3.3% in the second half of 2016 as the
effects of rallying energy prices trickle down to pull transport prices back up. Also, with the arrival of the La
Nina in September this year, it is unlikely that Vietnam’s agricultural sector will recover from the droughts
which plagued the sector in the first half of the year, thus providing additional upside risks for domestic
prices.
A new political era
Taking a step back from the country’s economic health, Vietnam’s parliament had also recently completed
reshuffling its leadership, turning the page onto a new political era. Though the cabinet sees twenty one
new faces, several key figures from the previous pro-business administration remained. These include
finance minister Dinh Tien Dung, deputy premiers Vu Duc Dam and Pham Binh Minh, who is also foreign
minister.
More importantly, the new Prime Minster was also sworn in. Former Deputy Prime Minster, Nguyen Xuan
Phuc dominated the national assembly, clinching 90% of the total votes, replacing two-term Nguyen Tan
Dung. Other than Phuc, three new deputy prime ministers were also voted in, including former Supreme
Court judge Troung Hoa Binh and former chief of the Communist Party’s economic committee, Voung Dinh
Hue.
Nevertheless, despite a reshuffle of the country’s key decision makers, we expect Vietnam’s economic and
foreign policy to remain focused on economic reformation and global integration. Already the South-East
Asian nation recently hosted United States President Obama on his tenth trip to Asia, strengthening ties
between the two nations. Economic, trade and security issues were the main themes of the visit as both
countries continue to partner with each other on the TPP. Moreover, as China continues to expand into the
South China Sea, it remains to be seen how the new Vietnamese administration would tackle matters over
national sovereignty, especially since China is one of Vietnam’s top trading partners.
A rosier second half
All in all, the outlook of Vietnam in the second half of 2016 continues to look promising. As the nation
continues to build economic ties with the rest of the world, trade and investments are expected to boost
growth in the near and medium term. Manufacturing will continue to remain the key driver for growth, with
Vietnam leveraging on its low cost of labour and production while also strengthening the overall
competitiveness of its export industry. Meanwhile, agricultural production is expected to remain in the
doldrums as the bad weather from an impending La Nina is likely to devastate crops in the second half of
2016. However, the support comes in the form of rising crude oil prices as well, which may help to keep
domestic inflation above deflationary levels for the rest of the year. In totality, we expect Vietnam’s growth
to tip at 6.4% at the end of the year, on the back of investment and manufacturing growth.

8 July 2016 OCBC Global Mid-Year Outlook 2016
Treasury Research & Strategy 38
Source: Bloomberg, CEIC, OCBC

8 July 2016 OCBC Global Mid-Year Outlook 2016
Treasury Research & Strategy 39
c o m pr
isi
n g
US
THEM
ATI
C
Conflicting Signals On The Labour Market
Fed chairwoman Janet Yellen might have used Brexit referendum uncertainties as one of the
many excuses not to push for a rate hike on the June 16th FOMC meeting. However, it does
appear that the most important reason behind the hesitation is none other than the hugely
disappointing nonfarm payrolls print from May that was released just weeks before the
meeting.
Against expectation that the US economy would create 160,000 jobs, actual data disappointed
with a tepid 38,000 increase. The upset in the official payrolls data also contrasted sharply
with the steady-as-she-goes trajectory suggested by the numbers compiled privately by ADP.
Given the scale and suddenness of the downside surprise, there is of course the chance that
the May NFP figure is but an aberration and that the numbers thereafter would bounce back
up nicely enough. Such a scenario is not without precedent. NFP data of December 2013 saw
a sharp shortfall – at 45,000 compared to 291,000 the month before – but recovered to
187,000 the month after. Similarly, March 2015 saw a quick dip to 84,000 in between months
of jobs prints above 200,000.
Source: Bloomberg, OCBC.
This history of occasional month-to-month seesaws aside, it pays to note also that the NFP
print comes with a wide margin of error of 100,000 on either side. This means that, the 38,000
number from May could well actually be saying that the actual jobs created for the month
could be anywhere between -62,000 to 138,000.
All in all, it is a number that has to be taken with a pinch of salt. Market and policymakers alike
would therefore have to wait for the June number to ascertain whether the May figure is a one-
off outlier or a harbinger of something more sinister about the US employment outlook.
Tellingly, in her June 21st testimony before the Senate Banking Committee, Yellen said that “It
is important not to overreact to one or two reports, and several other timely indicators of labour
market conditions still look favourable.”

8 July 2016 OCBC Global Mid-Year Outlook 2016
Treasury Research & Strategy 40
Source: Bloomberg, OCBC.
Indeed, if we look at the US unemployment rate, it is striking that the figure was at 4.7% in May, the lowest
rate since mid-2007. Meanwhile, a broader unemployment rate which takes into account not only those
who cannot find jobs, but also Americans who could only find part-time work even if they want full-time
roles, tells a similar encouraging story. The so-called U6 unemployment rate printed 9.7% in May, staying
at its lowest rate since before Lehman Crisis.
The fact that the unemployment figures dipped even as nonfarm payrolls data came out poorly for the
month is largely due to a drop in labor force participation rate. Given that fewer people are in the workforce
actively looking for a job, the unemployment rates can still go down even with more lackluster jobs creation.
Source: Bloomberg, OCBC.
The same cannot be said, however, if a significant number of people are no longer in workforce because
they are so utterly dejected from failing to succeed at job searching that they stop doing so altogether – and
thus drop out from the participation rate statistics.
This is especially tricky at the turn of cycles. If the economy recovers well enough for more jobs to be
created, those who have previously given up now feel encouraged enough to step back into the search
process, they would thus contribute to the labor force participation rate pick up once more. In turn, that may
well lead to an uptick in unemployment rate, even though the economy is actually picking up steam.
The difficulty in knowing for sure whether the metrics you are looking at when making decisions are truly
reflective of the state of the economy is a tricky one. It is as if you are flying a plane through rough weather

8 July 2016 OCBC Global Mid-Year Outlook 2016
Treasury Research & Strategy 41
over treacherously mountainous terrain, right when you have doubts about whether the flight instruments in
your cockpit are telling you the right things or not.
Arguably, having done its lift-off in December last year with an idea that more hikes will be carried out into
2016 only to face China’s market jitters early in the year and Brexit volatility at the end of Q2, the Fed
should already be cautious in carrying out its plan for further tightening. Add to that the unknowns about
how the domestic labor market truly is coping and it makes sense then that the policymakers would adopt
an even more gingerly stance and be extra careful in raising rates until they have a better sense of the
outlook ahead.
8 July 2016 OCBC Global Mid-Year Outlook 2016
Treasury Research & Strategy 42
c o m pr
isi
n g
CH
INA
TH
EMA
TIC
Capital Account Liberalization And RMB
Internationalization Amid RMB Volatility
Back in mid-2015, PBoC mentioned in its RMB Internationalization report published on 11
June 2015 that China will further push two-way capital account liberalization including
deepening the outflow channels such as QDII2 program to allow individual to invest in the
offshore market. One year after the publication of report, PBoC has failed to deliver those
reforms. Instead, China unwound some previous opening measures and shut down most of
outflow channels in reaction to the currency turmoil following the fixing mechanism reform
on 11 August 2015. For example, China suspended bond repo transaction by offshore Yuan
clearing and participating banks that participating in the onshore interbank bond market in
November 2015, five months after PBoC launched the new initiative in early June to push
on Yuan usage.
The “stop-go” approach drew concern that China may prolong its timeline for capital
account liberalization even though RMB has been admitted to the SDR basket currency.
This, together with the concern about RMB depreciation has hindered the development of
offshore RMB market since late 2015. Offshore RMB deposits in Hong Kong fell to CNY723
billion in April from the peak of CNY1 trillion in December 2014. In addition to Hong Kong,
offshore RMB deposits have declined across the major offshore RMB centers including
Singapore and Taiwan. Meanwhile, the usage of Yuan in international trade settlement and
payment also declined. Based on our estimation, total China’s goods trade denominated in
RMB fell to about 16% in April, down significantly from an average 25% in 2015. RMB’s
ranking as global payment currency also fell by one position to six, accounting for about
1.9% of global shares as of June 2016.
Coupled with the shrinking liquidity pool in the offshore market, the development of RMB
denominated assets also stalled. The issuance of dim sum bond tumbled in the first quarter
of 2016 due to concerns about RMB exchange rate as well as falling funding costs in the
onshore market but subsequently recovered in May and June after number of default cases
in the onshore market increased in April.
In order to reboot the engine of RMB Internationalization, China has sped up the capital
account liberalization reform since the beginning of the year under the guideline of
“attracting inflows and controlling outflows” as shown on the table below.
All the measures listed above served two purposes in our view including attracting capital
inflows to mitigate the capital outflows and further open onshore RMB denominated assets
to promote RMB Internationalization. The results have yet to be seen. Nevertheless, it is
clear that policy direction is likely to remain unchanged to attract more inflows.
How about outflows?
Since the beginning of the year, we have heard various rumors that China may restrict the
foreign currency purchase by individuals but all have been denied by China’s currency
regulators. So far, US$50K quota is still the main channel for individuals to move capital out
of country. Corporates are still able to purchase foreign currency for trade and investment
settlement backed by genuine documents. Nevertheless, talking to people on the ground, it is
indeed that China has tightened the grip on outflows especially for large amount of outward

8 July 2016 OCBC Global Mid-Year Outlook 2016
Treasury Research & Strategy 43
payment above US$50 million.
China has not talked about two-way since late 2015 until recently when PBoC published its 2015
annual report in late June 2016. The PBoC reiterated that it plans to roll out the trial of QDII2 to allow
individual to invest in the offshore market though there is no details about timetable. However, given
the unexpected Brexit referendum event, the risk for China to postpone the QDII2 cannot be ruled
out amid renewed concerns about RMB depreciation.
Looking ahead, the Brexit event has complicated China’s plan for capital account liberalization. We
think China may continue its lopsided capital account liberalization focusing on attracting capital
inflows. The latest news that China suspended the purchase of foreign currency for overseas direct
investment by partnership companies financed by individuals after the Brexit event shows that China
remain cautious about the capital outflows. As such, we think China may postpone its reform plan for
capital outflows until clearer picture from this Brexit drama.
In terms of RMB Internationalization, it is undeniable that the initiative has been dampened by the
uncertain outlook about RMB and tighter capital account control. Nevertheless, given China has
speeded up its reform to open both interbank FX and bond markets, we think RMB
Internationalization may find alternative engine and we expect foreign ownership of China’s bond is
likely to go up.
Reforms Implications
Feb-16
China opened its onshore interbank
bond market to most foreign
investors
The move is likely to attract more capital inflows given low
foreign ownership of Chinese bonds.
May-16
China announced to implement new
macro prudential management of
cross border financing.
All China incorporated enterprises (excluding government
funding vehicles and real estate company) and financial
institutions are allowed to borrow RMB or foreign currency from
offshore market under new foreign debt limit in place of existing
foreign debt quota.
May-16
China gave the green light to first
batch of offshore participating banks
to enter China’s onshore interbank
FX market.
In the longer run, the open of onshore FX market will provide
more effective hedging tools to those offshore players, who are
able to access to onshore capital markets. This will make RMB
assets more appealing to offshore players.
May-16
PBoC published detailed guidance
on investment in China’s onshore
interbank bond market by offshore
financial institutions.
There will be no quota limit for qualified offshore financial
institutions. China also eased repatriation rules. We do not
expect the recent RMB volatility to hinder interests from medium
to long term investors.
Jun-16
China announced to allocate
CNY250 billion RQFII quota to the
US
The CNY250 billion RQFII quota is the second largest after Hong
Kong. Together with the setup of RMB clearing and settlement
in the US, it will help promote the use of RMB in bilateral trade
and investment between US and China.
Jun-16
China’s currency regulator SAFE
released regulation 16 to ease the
sale of foreign currency receivable
from foreign debt.
The companies are allowed to sell their foreign currency
receivable from foreign debt at their own willingness. Given the
offshore all-in cost remains low compared to onshore RMB cost,
companies may have incentive to bring in the foreign debt to
swap their existing RMB loan.
8 July 2016 OCBC Global Mid-Year Outlook 2016
Treasury Research & Strategy 44
c o m pr
isi
n g
HO
NG
KO
NG
TH
EMA
TIC
HKD Pegged To Hold
HKD’s strengthened in 2015
HKD kept triggering the Strong-side Convertibility Undertaking in 2015 due to the robust
stock market in first half of 2015 and the sudden depreciation of RMB after the reform of
USDCNY fixing mechanism in the second half. This propelled the HKMA to sell HKD to
defend the linked exchange rate system, in turn piling up its foreign exchange reserve to a
historical high.
Impact of China’s slowdown on HK becomes prominent
In 2015, trade with Mainland China took up 51% of HK’s total trade. Though visitors from
Mainland decreased, its share in total visitors to HK remained high at 75% during the first
four months of 2016. Closer economic and financial inter-connection with the Mainland
China makes the impact of China’s slowdown on HK more prominent.
Since the beginning of 2016, a plunge of China’s stock market and the further depreciation
of the RMB have raised market concerns on China’s hard-landing. Such concerns indirectly
pushed the HK dollar down to the weaker side. On one hand, China’s Securities Regulatory
Commission postponed the expiration of shares sale ban by major shareholders, prompting
the investors to sell the H-share instead. As a result, the demand for HKD shrank.
On the other hand, in order to ease the concern of RMB depreciation and narrow the spread
between CNH and CNY, Chinese officials intervened in the offshore RMB market via
crackdown on the short selling of CNH. This propelled investors to sell off the HKD instead,
betting on an abandoning of HKD’s peg against USD.
Increasing concerns on the de-peg risk of the HKD
Given that HK connects more closely to the Mainland China in terms of economy, the Fed’s
rate hike and China’s economic slowdown have together weighed on HK’s growth, which
witnessed the first contraction since 2Q 2014 in the first quarter. This underpins the
speculation on the de-pegging of HKD against the USD and builds up downward risks for
the HK dollar. On Jan 21st, USD/HKD surged to the highest level since 2007, reaching
7.8295, while the USDHKD 12 month outright forward prices jumped to 7.9002, implying the
heightened expectation on de-peg risk.
Nevertheless, the de-pegging of HKD against the USD is unlikely at this junction for three
reasons. First, Hong Kong Monetary Authority (HKMA) reiterated that they have no intention
to abandon the linked exchange rate system. The HKMA raised its interest rate for the first
time since 2006 on 17 December 2015, one day after the Fed hiked its interest rate, showing
its determination to maintain the HK dollar’s 32-year-old peg to the US dollar. Second,
maintaining the current linked exchange rate system instead of de-pegging and re-pegging to
the RMB, which has yet been freely traded, is perceived as the best way to sustain the
stability of Hong Kong’s financial system, especially given the heightened market volatility
after Brexit. Third, HK’s foreign exchange reserve remained near an all-time high of
USD360.8 billion in April, equivalent to 1.75 times the monetary base and over 7 times the
currency in circulation one of the highest levels across the globe. In this case, even if the HK
dollar leans to the weaker side and touches 7.8500, abundant foreign exchange reserve will
allow HKMA to maintain the peg. Moreover, aggregate balance and outstanding exchange
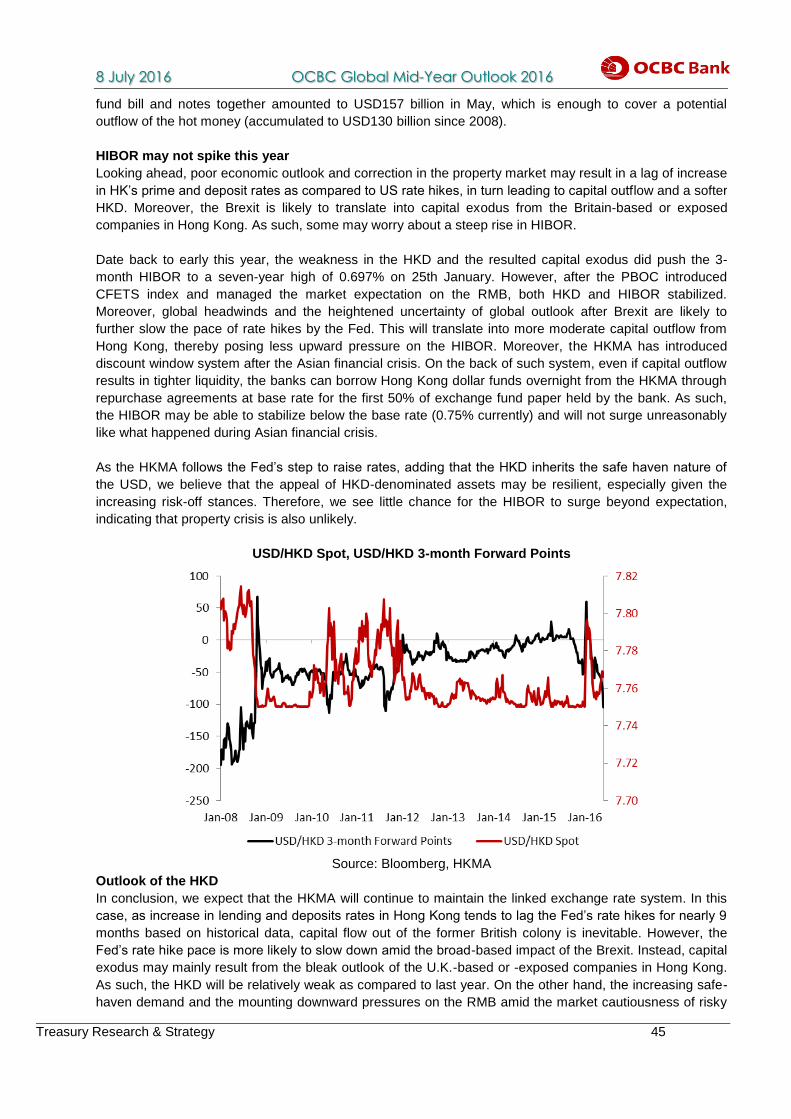
8 July 2016 OCBC Global Mid-Year Outlook 2016
Treasury Research & Strategy 45
fund bill and notes together amounted to USD157 billion in May, which is enough to cover a potential
outflow of the hot money (accumulated to USD130 billion since 2008).
HIBOR may not spike this year
Looking ahead, poor economic outlook and correction in the property market may result in a lag of increase
in HK’s prime and deposit rates as compared to US rate hikes, in turn leading to capital outflow and a softer
HKD. Moreover, the Brexit is likely to translate into capital exodus from the Britain-based or exposed
companies in Hong Kong. As such, some may worry about a steep rise in HIBOR.
Date back to early this year, the weakness in the HKD and the resulted capital exodus did push the 3-
month HIBOR to a seven-year high of 0.697% on 25th January. However, after the PBOC introduced
CFETS index and managed the market expectation on the RMB, both HKD and HIBOR stabilized.
Moreover, global headwinds and the heightened uncertainty of global outlook after Brexit are likely to
further slow the pace of rate hikes by the Fed. This will translate into more moderate capital outflow from
Hong Kong, thereby posing less upward pressure on the HIBOR. Moreover, the HKMA has introduced
discount window system after the Asian financial crisis. On the back of such system, even if capital outflow
results in tighter liquidity, the banks can borrow Hong Kong dollar funds overnight from the HKMA through
repurchase agreements at base rate for the first 50% of exchange fund paper held by the bank. As such,
the HIBOR may be able to stabilize below the base rate (0.75% currently) and will not surge unreasonably
like what happened during Asian financial crisis.
As the HKMA follows the Fed’s step to raise rates, adding that the HKD inherits the safe haven nature of
the USD, we believe that the appeal of HKD-denominated assets may be resilient, especially given the
increasing risk-off stances. Therefore, we see little chance for the HIBOR to surge beyond expectation,
indicating that property crisis is also unlikely.
USD/HKD Spot, USD/HKD 3-month Forward Points
Source: Bloomberg, HKMA
Outlook of the HKD
In conclusion, we expect that the HKMA will continue to maintain the linked exchange rate system. In this
case, as increase in lending and deposits rates in Hong Kong tends to lag the Fed’s rate hikes for nearly 9
months based on historical data, capital flow out of the former British colony is inevitable. However, the
Fed’s rate hike pace is more likely to slow down amid the broad-based impact of the Brexit. Instead, capital
exodus may mainly result from the bleak outlook of the U.K.-based or -exposed companies in Hong Kong.
As such, the HKD will be relatively weak as compared to last year. On the other hand, the increasing safe-
haven demand and the mounting downward pressures on the RMB amid the market cautiousness of risky
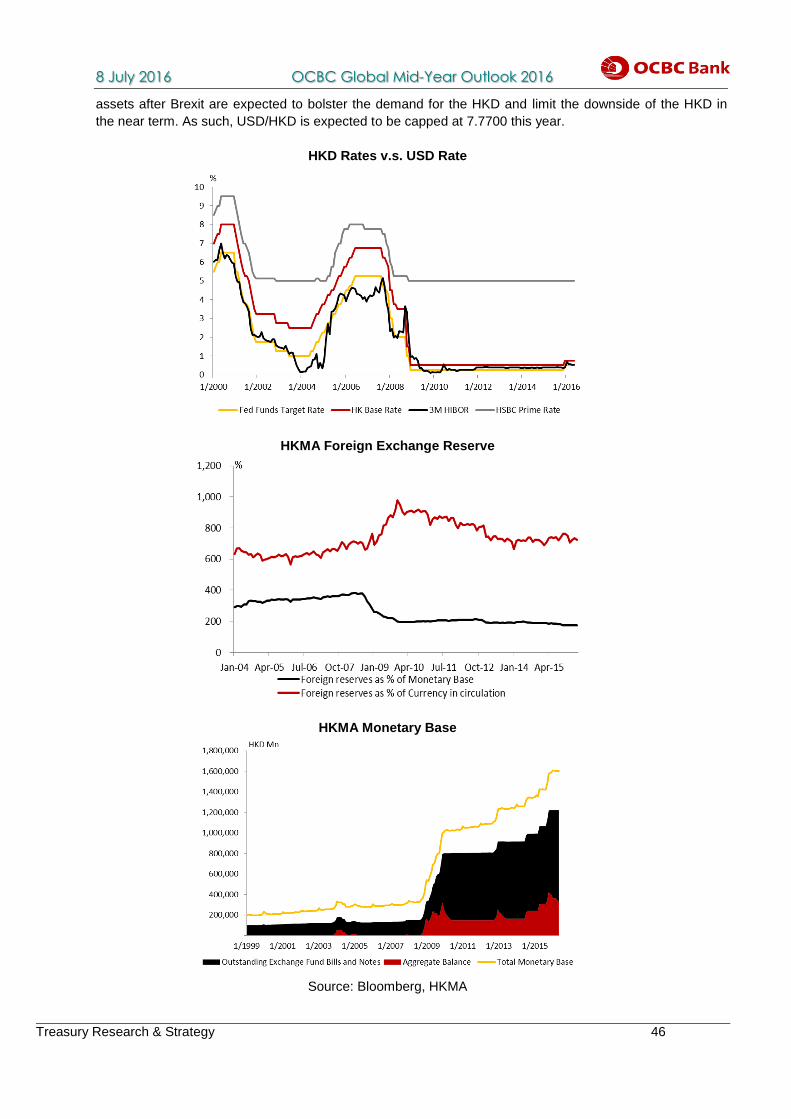
8 July 2016 OCBC Global Mid-Year Outlook 2016
Treasury Research & Strategy 46
assets after Brexit are expected to bolster the demand for the HKD and limit the downside of the HKD in
the near term. As such, USD/HKD is expected to be capped at 7.7700 this year.
HKD Rates v.s. USD Rate
HKMA Foreign Exchange Reserve
HKMA Monetary Base
Source: Bloomberg, HKMA

8 July 2016 OCBC Global Mid-Year Outlook 2016
Treasury Research & Strategy 47
c o m pr
isi
n g
SIN
GA
PO
RE
THEM
ATI
C
Going Beyond Income Inequality?
Proactive fiscal policy measures have taken effect since 2012
Since 2000, Singapore’s GINI coefficient, after accounting for government taxes and
transfers, peaked at a high of 0.439 in 2007, before tapering down for a couple of years. It
then spiked again to 0.432 in 2012, which was likely attributed to lagging real wage growth.
This probably underscored the urgency to improve the labour productivity thrust so as to
improve the labour market’s real wage growth and its share of the economy.
Given the more recent redistributive slant in Singapore’s Budgetary and other fiscal policies,
the Gini coefficient have stabilised and even improved since 2012, especially if government
transfers and taxes are taken into account. To a certain extent, this came amid a whole host
of measures to tackle not only the financial aspects of the income inequality issue, but also
the socioeconomic aspects like education, healthcare and job up-skilling opportunities
notwithstanding the sluggish economic growth and a tight labour market.
Source: CEIC
Measuring income inequality beyond the GINI coefficient?
Like in many other countries, the GINI coefficient is used as a main indicator to represent
the income distribution of the country’s residents. However, simply looking at the coefficient
at face value does not allow for a full analysis. Singapore has a somewhat different
approach to using fiscal policy to tackle such issues – this includes having a lower overall
tax burden and very targeted subsidies for the low income households which have been
increasing over time. The overall GINI coefficient also does not offer a breakdown of real
income growth within the different income groups.

8 July 2016 OCBC Global Mid-Year Outlook 2016
Treasury Research & Strategy 48
Source: SingStats, OCBC
Important role of taxes and transfers in Singapore’s fiscal objectives
Over 2000-2015, despite slower wage growth within the bottom quintile before accounting for taxes and
transfers, average monthly household income growth skyrockets once taxes and transfers are taken into
consideration. In addition, when comparing across countries, IMF statistics show that Singapore’s income
growth after taxes and transfers among lower income households is also considerably higher than other
countries, with cumulative income growth for households in the lowest 20% coming in at 37.1% as opposed
to the US’ growth of -8.2% and UK’s growth of 2.8%. Moreover, if we compare Singapore’s after tax GINI
coefficient across similar economies, income redistribution policies also play a fairly significant part in
reducing Singapore’s income inequality to that below most of these countries.
Source: World Bank, CEIC, MOF, OCBC
Supplementing work income for the low-income workers
Since 2007, the government has introduced many schemes that aimed to supplement the income and
retirement savings of low-wage workers. The Workfare Income Scheme is an example, encouraging

8 July 2016 OCBC Global Mid-Year Outlook 2016
Treasury Research & Strategy 49
eligible workers to continue working by enhancing their net income through cash payments and CPF
contributions. In addition, with the permanent implementation of the GST voucher scheme in 2012, P20
households are able to partially offset tax expenses as well. Coupled with a progressive tax system that
places a greater tax burden on the rich, Singapore is able to tweak income distribution to ensure that the
lower-income households are not left behind.
Source: MOF, OCBC
A holistic approach to promoting intergenerational income mobility
Apart from redistributive fiscal policy inclinations, even the education policies promote intergenerational
income mobility. In a study done by the Ministry of Finance, Singapore has the highest percentage of
children born to parents in the bottom 20% of incomes making it to the top 20%, compared to other
developed economies. Singapore’s focus on engendering intergenerational income mobility extends to
schemes such as the Workfare Training Support Scheme and dedicated agencies such as the Workforce
Development Agency (WDA). As such, the combination of targeted manpower and education policies help
Singapore to achieve a more flexible income structure, allowing for movement between quintiles and
hopefully a more stable and equitable income distribution in the medium term.
Source: MOF, OCBC
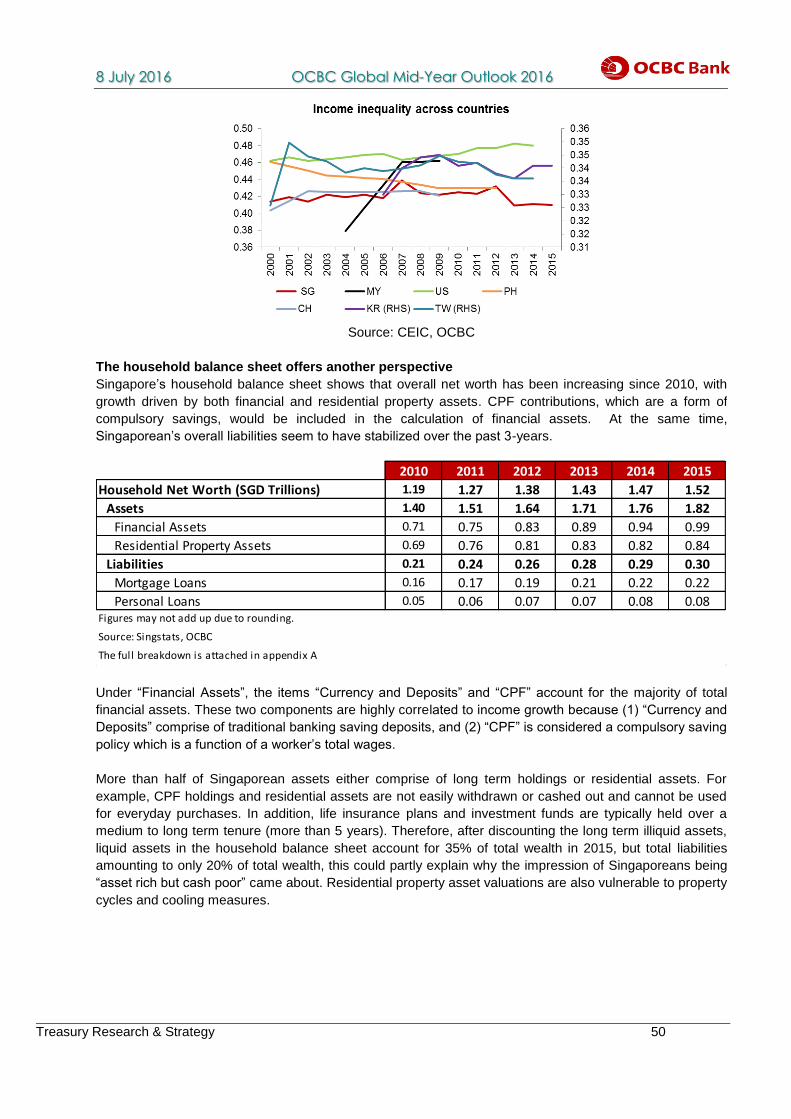
8 July 2016 OCBC Global Mid-Year Outlook 2016
Treasury Research & Strategy 50
Source: CEIC, OCBC
The household balance sheet offers another perspective
Singapore’s household balance sheet shows that overall net worth has been increasing since 2010, with
growth driven by both financial and residential property assets. CPF contributions, which are a form of
compulsory savings, would be included in the calculation of financial assets. At the same time,
Singaporean’s overall liabilities seem to have stabilized over the past 3-years.
Under “Financial Assets”, the items “Currency and Deposits” and “CPF” account for the majority of total
financial assets. These two components are highly correlated to income growth because (1) “Currency and
Deposits” comprise of traditional banking saving deposits, and (2) “CPF” is considered a compulsory saving
policy which is a function of a worker’s total wages.
More than half of Singaporean assets either comprise of long term holdings or residential assets. For
example, CPF holdings and residential assets are not easily withdrawn or cashed out and cannot be used
for everyday purchases. In addition, life insurance plans and investment funds are typically held over a
medium to long term tenure (more than 5 years). Therefore, after discounting the long term illiquid assets,
liquid assets in the household balance sheet account for 35% of total wealth in 2015, but total liabilities
amounting to only 20% of total wealth, this could partly explain why the impression of Singaporeans being
“asset rich but cash poor” came about. Residential property asset valuations are also vulnerable to property
cycles and cooling measures.
2010 2011 2012 2013 2014 2015
Household Net Worth (SGD Trillions) 1.19 1.27 1.38 1.43 1.47 1.52
Assets 1.40 1.51 1.64 1.71 1.76 1.82
Financial Assets 0.71 0.75 0.83 0.89 0.94 0.99
Residential Property Assets 0.69 0.76 0.81 0.83 0.82 0.84
Liabilities 0.21 0.24 0.26 0.28 0.29 0.30
Mortgage Loans 0.16 0.17 0.19 0.21 0.22 0.22
Personal Loans 0.05 0.06 0.07 0.07 0.08 0.08Figures may not add up due to rounding.
Source: Singstats, OCBC
The full breakdown is attached in appendix A
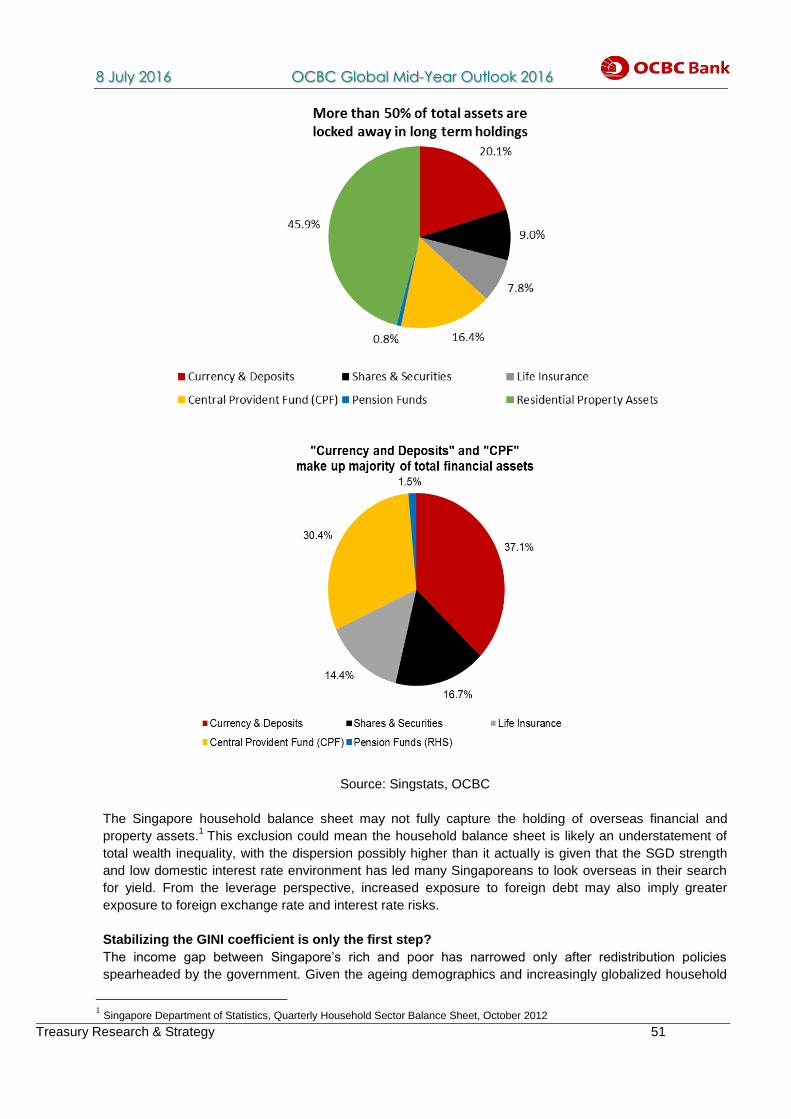
8 July 2016 OCBC Global Mid-Year Outlook 2016
Treasury Research & Strategy 51
Source: Singstats, OCBC
The Singapore household balance sheet may not fully capture the holding of overseas financial and
property assets.1 This exclusion could mean the household balance sheet is likely an understatement of
total wealth inequality, with the dispersion possibly higher than it actually is given that the SGD strength
and low domestic interest rate environment has led many Singaporeans to look overseas in their search
for yield. From the leverage perspective, increased exposure to foreign debt may also imply greater
exposure to foreign exchange rate and interest rate risks.
Stabilizing the GINI coefficient is only the first step?
The income gap between Singapore’s rich and poor has narrowed only after redistribution policies
spearheaded by the government. Given the ageing demographics and increasingly globalized household
1 Singapore Department of Statistics, Quarterly Household Sector Balance Sheet, October 2012

8 July 2016 OCBC Global Mid-Year Outlook 2016
Treasury Research & Strategy 52
balance sheets, other forms of addressing inequality issues may grow in importance. For instance,
equality in other aspects outside of income like health and education may be interesting to study, but this
will be for future discussion.
Appendix A: Singapore’s complete household balance sheet
2010 2011 2012 2013 2014 2015
Household Net Worth (SGD Trillions) 1.19 1.27 1.38 1.43 1.47 1.52
Assets 1.40 1.51 1.64 1.71 1.76 1.82
Financial Assets 0.71 0.75 0.83 0.89 0.94 0.99
Currency & Deposits 0.25 0.27 0.30 0.32 0.34 0.37
Shares & Securities 0.16 0.15 0.16 0.17 0.17 0.16
Listed Shares 0.08 0.07 0.09 0.09 0.09 0.08
Unlisted Shares 0.04 0.04 0.03 0.03 0.03 0.04
Unit Trusts & Investment Funds 0.04 0.04 0.04 0.05 0.05 0.05
Life Insurance 0.11 0.11 0.12 0.12 0.14 0.14
Central Provident Fund (CPF) 0.19 0.21 0.23 0.25 0.28 0.30
Pension Funds 0.01 0.01 0.01 0.01 0.01 0.01
Residential Property Assets 0.69 0.76 0.81 0.83 0.82 0.84
Public Housing 0.35 0.39 0.42 0.41 0.39 0.40
Private Housing 0.34 0.37 0.40 0.42 0.42 0.44
Liabilities 0.21 0.24 0.26 0.28 0.29 0.30
Mortgage Loans 0.16 0.17 0.19 0.21 0.22 0.22
Financial Institutions 0.12 0.13 0.15 0.17 0.18 0.19
Housing & Development Board (HDB) 0.04 0.04 0.04 0.04 0.04 0.04
Personal Loans 0.05 0.06 0.07 0.07 0.08 0.08
Motor Vehicle 0.02 0.01 0.01 0.01 0.01 0.01
Credit/ Charge Cards 0.01 0.01 0.01 0.01 0.01 0.01
Others 0.03 0.04 0.05 0.05 0.06 0.06
Figures may not add up due to rounding.
Source: Singstats, OCBC
8 July 2016 OCBC Global Mid-Year Outlook 2016
Treasury Research & Strategy 53
c o m pr
isi
n g
CO
MM
OD
ITY
SP
ECIA
L
Absence Of A Supercycle
The old supercycle
As recently as December 2015, major newswires were having headlines including “Don’t
mourn the death of the commodities super-cycle”, and “Is the Commodities Super-cycle
really at an end?”. Others however are saying that the supercycle is a pause, rather than an
end. Should we be interested in the death of the commodity supercycle, or more
importantly, why should we be interested?
Should history be of reference, investors who have missed the previous commodity
supercycle back in the late 1990s to the fall of Lehman in 2008/9 had effectively
squandered their chance to ride the rally in oil (+1,062%), gold (+646%), copper (+487%),
corn (+240%). The gains had in fact effectively overshadowed those of developed market
equities (+139%), emerging market equities (+418.8%), US HY bonds (+88.5%), US IG
bonds (+40.4%) and for the interest of property investors, global property prices (+208.5%).
As such, just by merely observing the returns, any investor (and speculator for that matter)
would want to see such substantial gains in their portfolio should the chance arise again,
should a commodities ‘super’ cycle be around the corner.
Why so super?
To aid our discussion, it is important to define the commodity classes, as well as the term
“cycle”. Commodities comprise of six main groups: Energy accounting for the most in the
Thomson Reuters CRB Commodities Index, followed by Base Metals, Precious Metals,
Agriculture and Grains. Elsewhere, a cycle refers to the upward movement of commodity
prices for a long time period, followed by a downward movement of commodity prices. The
cycle thus continues, hopefully with another upturn of prices when prices bottom.
Despite the likelihood that commodity prices may likely not match its stellar performance
back in the last decade, it does not mean that one should take a negative view on future
prices. For one, soft commodities and grains had rallied substantially due to its classification
as defensive in nature, while also benefiting from the harsh weather conditions meted out
by El Nino.
However, prices belonging to energy and base metals had fallen substantially given
renewed global growth headwinds and slowdown in Chinese imports demand. Statistically,
since July 2008, crude oil prices tumbled 63.9%, though most of the decline was seen back
since late 2014. Base metals, related to crude oil as a growth-linked commodity, also
suffered a sizable 34.3% fall over the same period of time. Gold also lost some of its
appeal, falling by 16.9%. Curiously enough, these are the same commodity classes that
racked the most gains during the commodities supercycle, and therefore begs the question
if these commodity classes have fallen substantially enough to pose for another upward
cycle.
Should history be of reference, an upward cycle should occur not only in the presence of an
immediate down cycle, but also in tandem with other exogenous drivers. Looking back to the
last decade, many pieces had fallen in place to stimulate the commodities supercycle:
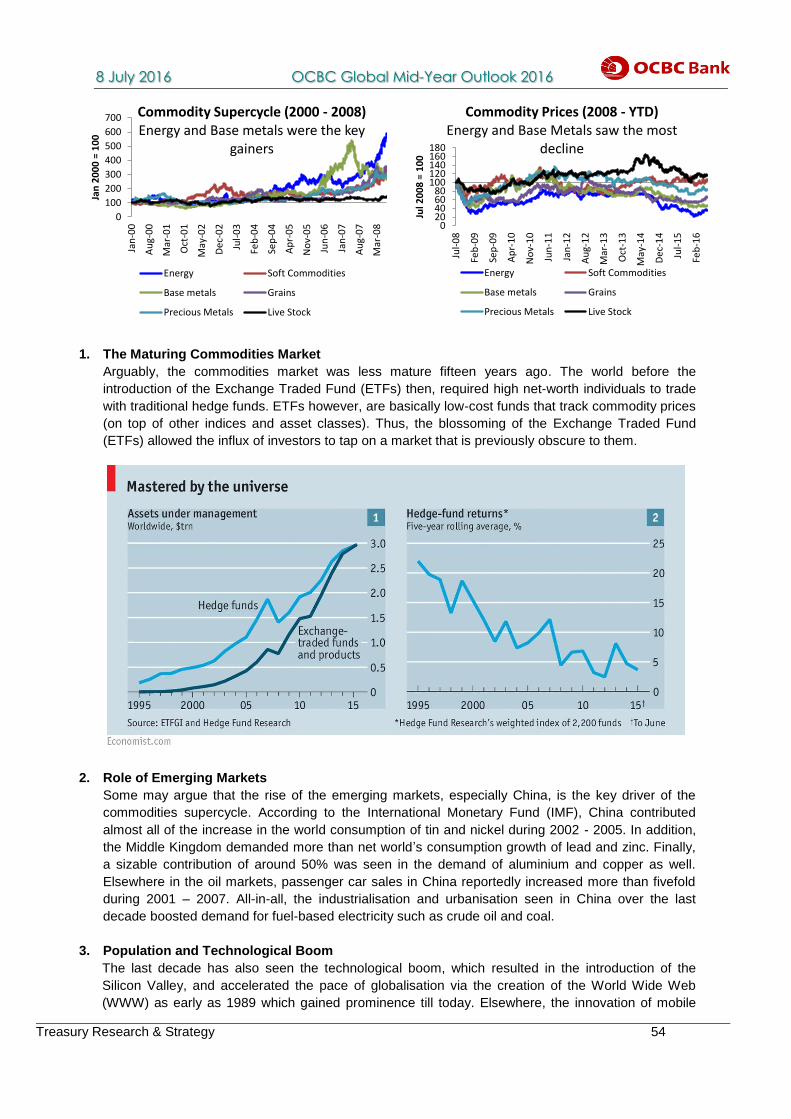
8 July 2016 OCBC Global Mid-Year Outlook 2016
Treasury Research & Strategy 54
1. The Maturing Commodities Market
Arguably, the commodities market was less mature fifteen years ago. The world before the
introduction of the Exchange Traded Fund (ETFs) then, required high net-worth individuals to trade
with traditional hedge funds. ETFs however, are basically low-cost funds that track commodity prices
(on top of other indices and asset classes). Thus, the blossoming of the Exchange Traded Fund
(ETFs) allowed the influx of investors to tap on a market that is previously obscure to them.
2. Role of Emerging Markets
Some may argue that the rise of the emerging markets, especially China, is the key driver of the
commodities supercycle. According to the International Monetary Fund (IMF), China contributed
almost all of the increase in the world consumption of tin and nickel during 2002 - 2005. In addition,
the Middle Kingdom demanded more than net world’s consumption growth of lead and zinc. Finally,
a sizable contribution of around 50% was seen in the demand of aluminium and copper as well.
Elsewhere in the oil markets, passenger car sales in China reportedly increased more than fivefold
during 2001 – 2007. All-in-all, the industrialisation and urbanisation seen in China over the last
decade boosted demand for fuel-based electricity such as crude oil and coal.
3. Population and Technological Boom
The last decade has also seen the technological boom, which resulted in the introduction of the
Silicon Valley, and accelerated the pace of globalisation via the creation of the World Wide Web
(WWW) as early as 1989 which gained prominence till today. Elsewhere, the innovation of mobile
0
100
200
300
400
500
600
700Ja
n-0
0
Au
g-0
0
Mar
-01
Oct
-01
May
-02
De
c-0
2
Jul-
03
Feb
-04
Sep
-04
Ap
r-0
5
No
v-0
5
Jun
-06
Jan
-07
Au
g-0
7
Mar
-08
Jan
20
00
= 1
00
Commodity Supercycle (2000 - 2008)Energy and Base metals were the key
gainers
Energy Soft Commodities
Base metals Grains
Precious Metals Live Stock
020406080
100120140160180
Jul-
08
Feb
-09
Sep
-09
Ap
r-1
0
No
v-1
0
Jun
-11
Jan
-12
Au
g-1
2
Mar
-13
Oct
-13
May
-14
De
c-1
4
Jul-
15
Feb
-16
Jul 2
00
8 =
10
0
Commodity Prices (2008 - YTD)Energy and Base Metals saw the most
decline
Energy Soft Commodities
Base metals Grains
Precious Metals Live Stock

8 July 2016 OCBC Global Mid-Year Outlook 2016
Treasury Research & Strategy 55
and media devices ranging from digital cameras, MP3 players, and camera phones to smartphones
also played its role in the demand for commodities. The rapid increase in population growth in
emerging nations, empirically even outpacing those of the developed ones, would also contribute to
the demand of commodities as overall consumption increases.
Maybe not so super
With the supercycle effectively coming to an end, the recent commodity plunge had well sparked
some interest in a new upward cycle in commodity prices. Having the factors in mind, one should re-
evaluate on the presence of these factors in current times to substantiate another ‘supercycle’.
Fundamentally, many of the drivers are well absent at this juncture. Global population growth rate has
also slowed to 1.2% in 2013, down from 1.7% seen back in 1990. Importantly as well, we are now
faced with the slowdown of China’s growth to an estimate of 6.7% (2016) and 6.2% (2017), amid an
observable slowdown in its import growth.
Still, the question begets if another form of a technological boom equivalent to the magnitude of that in
the last decade may bring about the anticipated rise of commodity prices. The concept of driverless
cars, space exploration and inhabitation of the moon, and the rise of robotics may be the next
technological horizon for the next decade. Needless to say, the recovery in global growth in the key
economies would also spur the pickup of commodity prices.
But before that happens, a natural cycle of a pickup in commodity prices should occur, given the low
prices already seen from the plunge in the last years. It may not as super as the one seen in the last
decade, but could still warrant interest in the eyes of the market as price appreciation takes form.

8 July 2016 OCBC Global Mid-Year Outlook 2016
Treasury Research & Strategy 56
c o m pr
isi
n g
FUN
D F
LOW
S U
PD
ATE
Fun
d F
low
s U
pd
ate
1H 2016 Global Fund Flows Review
Highlights
Global risk appetite through the first half of 2016 demonstrated much risk aversion as seen
from the divergence between global equity and bond flows. China’s economic slowdown
coupled with constant fears over the Brexit Referendum led to investors pulling funds out of
equity funds as total flows printed a net of $133.6bn worth of redemptions. In contrast, total
net flows for 2014 and 2015 came in at +$129.2bn and +$27.9bn respectively. In tandem
with global risk aversion, investors flocked to credit as capital inflows into global bond funds
came in $75.5bn. Meanwhile, flows within the money market in the first half of 2016
reversed 2015’s gains to post $78.5bn worth of outflows, led primarily by outflows from
North America (Total YTD flows: -$56.1bn).
In the DM space, equity flows from all regions dived into negative territory in 1H2016 with
total net outflows coming in at $123.4bn. Of note, total DM-equity outflows were led by
North America (Total YTD flows: -$82.5bn) as equity outflows from the US dragged total
flows down within the region (Total YTD flows: -$80.2bn). Elsewhere, concerns over
Europe’s economic recovery coupled with Brexit fears weighed heavily on Europe in
1H2016 as the region also posted net outflows (Total YTD flows: -$40.5bn). Risk appetite
clearly abated as 2015 ended the year with $152.7bn worth of net inflows. On the flip side,
DM-bond funds enjoyed fresh money through the year (Total YTD flows: +$71.1bn). In
particular, the North American region saw flows totalling up to $72.4bn, likely due to
investors fleeing to safe haven US treasuries.
With China’s economic slowdown and the equity rout in start of the year, EM-Asian equity
markets (Total YTD flows: -$9.72bn) pulled total EM-equity funds down into the red. As
such, total outflows from EM-equity funds came in at $10.3bn. On the other hand, total flows
within the EM-bond space closed the first half of the year within inflow territory (Total YTD
flows: +$4.4bn) as all EM-regions resurfaced back from 2015’s outflow print.
Source: EPFR, OCBC Bank
-300-200-100
0100200300400500600700800
Jan-1
2
Apr-
12
Jul-1
2
Oct-
12
Jan-1
3
Apr-
13
Jul-1
3
Oct-
13
Jan-1
4
Apr-
14
Jul-1
4
Oct-
14
Jan-1
5
Apr-
15
Jul-1
5
Oct-
15
Jan-1
6
Apr-
16
US
D b
n
Global Equity and Bond Flows (Cumulative since Jan 2012)
Global Equities Global Bonds Money Market
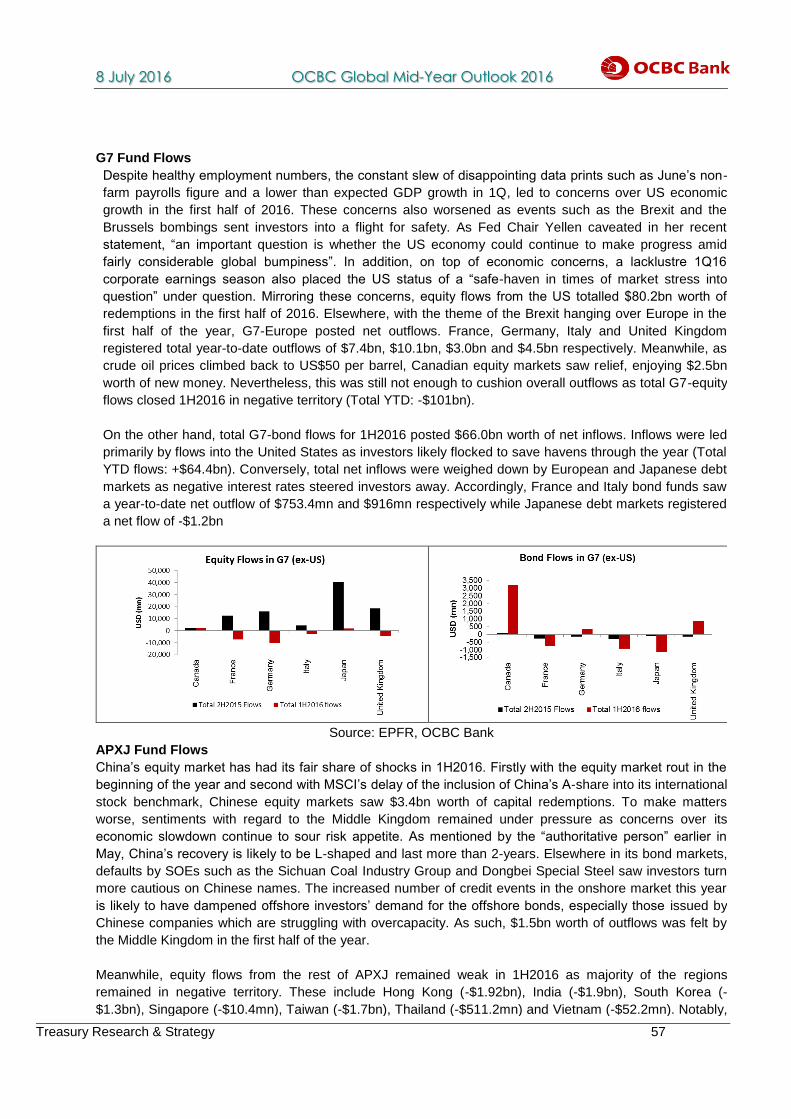
8 July 2016 OCBC Global Mid-Year Outlook 2016
Treasury Research & Strategy 57
G7 Fund Flows
Despite healthy employment numbers, the constant slew of disappointing data prints such as June’s non-
farm payrolls figure and a lower than expected GDP growth in 1Q, led to concerns over US economic
growth in the first half of 2016. These concerns also worsened as events such as the Brexit and the
Brussels bombings sent investors into a flight for safety. As Fed Chair Yellen caveated in her recent
statement, “an important question is whether the US economy could continue to make progress amid
fairly considerable global bumpiness”. In addition, on top of economic concerns, a lacklustre 1Q16
corporate earnings season also placed the US status of a “safe-haven in times of market stress into
question” under question. Mirroring these concerns, equity flows from the US totalled $80.2bn worth of
redemptions in the first half of 2016. Elsewhere, with the theme of the Brexit hanging over Europe in the
first half of the year, G7-Europe posted net outflows. France, Germany, Italy and United Kingdom
registered total year-to-date outflows of $7.4bn, $10.1bn, $3.0bn and $4.5bn respectively. Meanwhile, as
crude oil prices climbed back to US$50 per barrel, Canadian equity markets saw relief, enjoying $2.5bn
worth of new money. Nevertheless, this was still not enough to cushion overall outflows as total G7-equity
flows closed 1H2016 in negative territory (Total YTD: -$101bn).
On the other hand, total G7-bond flows for 1H2016 posted $66.0bn worth of net inflows. Inflows were led
primarily by flows into the United States as investors likely flocked to save havens through the year (Total
YTD flows: +$64.4bn). Conversely, total net inflows were weighed down by European and Japanese debt
markets as negative interest rates steered investors away. Accordingly, France and Italy bond funds saw
a year-to-date net outflow of $753.4mn and $916mn respectively while Japanese debt markets registered
a net flow of -$1.2bn
Source: EPFR, OCBC Bank
APXJ Fund Flows
China’s equity market has had its fair share of shocks in 1H2016. Firstly with the equity market rout in the
beginning of the year and second with MSCI’s delay of the inclusion of China’s A-share into its international
stock benchmark, Chinese equity markets saw $3.4bn worth of capital redemptions. To make matters
worse, sentiments with regard to the Middle Kingdom remained under pressure as concerns over its
economic slowdown continue to sour risk appetite. As mentioned by the “authoritative person” earlier in
May, China’s recovery is likely to be L-shaped and last more than 2-years. Elsewhere in its bond markets,
defaults by SOEs such as the Sichuan Coal Industry Group and Dongbei Special Steel saw investors turn
more cautious on Chinese names. The increased number of credit events in the onshore market this year
is likely to have dampened offshore investors’ demand for the offshore bonds, especially those issued by
Chinese companies which are struggling with overcapacity. As such, $1.5bn worth of outflows was felt by
the Middle Kingdom in the first half of the year.
Meanwhile, equity flows from the rest of APXJ remained weak in 1H2016 as majority of the regions
remained in negative territory. These include Hong Kong (-$1.92bn), India (-$1.9bn), South Korea (-
$1.3bn), Singapore (-$10.4mn), Taiwan (-$1.7bn), Thailand (-$511.2mn) and Vietnam (-$52.2mn). Notably,
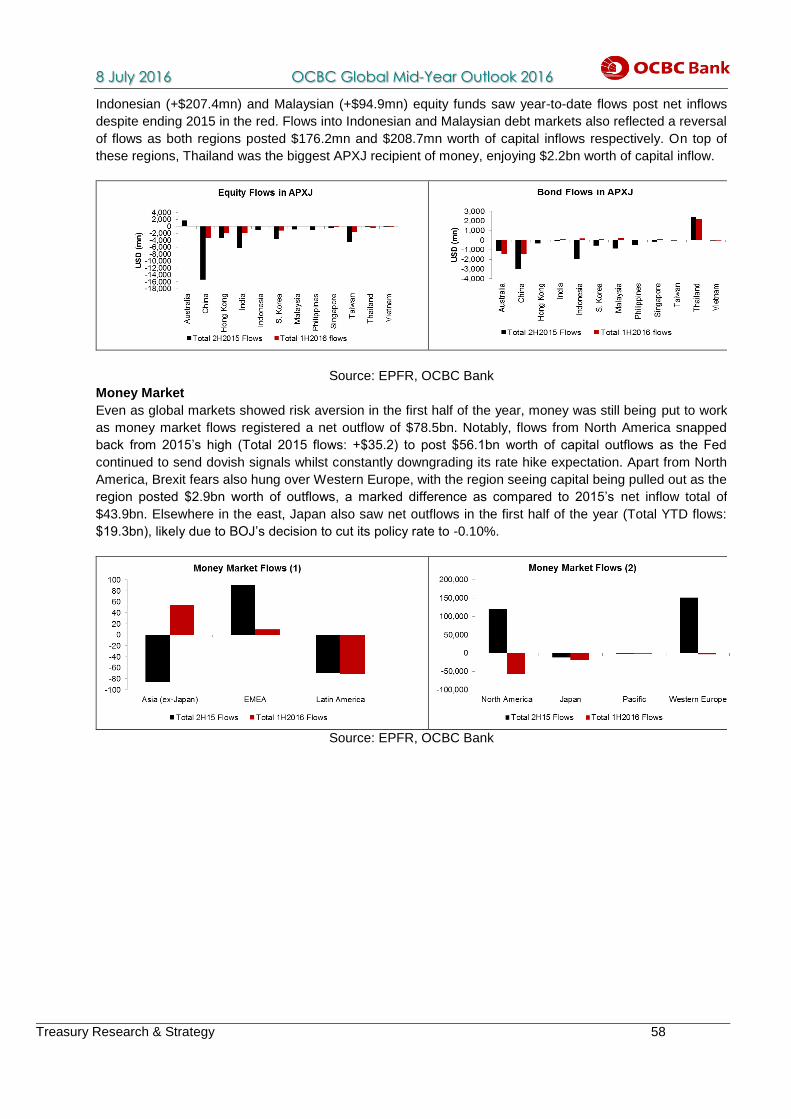
8 July 2016 OCBC Global Mid-Year Outlook 2016
Treasury Research & Strategy 58
Indonesian (+$207.4mn) and Malaysian (+$94.9mn) equity funds saw year-to-date flows post net inflows
despite ending 2015 in the red. Flows into Indonesian and Malaysian debt markets also reflected a reversal
of flows as both regions posted $176.2mn and $208.7mn worth of capital inflows respectively. On top of
these regions, Thailand was the biggest APXJ recipient of money, enjoying $2.2bn worth of capital inflow.
Source: EPFR, OCBC Bank
Money Market
Even as global markets showed risk aversion in the first half of the year, money was still being put to work
as money market flows registered a net outflow of $78.5bn. Notably, flows from North America snapped
back from 2015’s high (Total 2015 flows: +$35.2) to post $56.1bn worth of capital outflows as the Fed
continued to send dovish signals whilst constantly downgrading its rate hike expectation. Apart from North
America, Brexit fears also hung over Western Europe, with the region seeing capital being pulled out as the
region posted $2.9bn worth of outflows, a marked difference as compared to 2015’s net inflow total of
$43.9bn. Elsewhere in the east, Japan also saw net outflows in the first half of the year (Total YTD flows:
$19.3bn), likely due to BOJ’s decision to cut its policy rate to -0.10%.
Source: EPFR, OCBC Bank

8 July 2016 OCBC Global Mid-Year Outlook 2016
Treasury Research & Strategy 59
Macro Research Credit Research Wing Hang
Selena Ling Andrew Wong Kam Liu
[email protected] [email protected] kamyyliu@ocbcw h.com
Emmanuel Ng Wong Liang Mian (Nick) Carie Li
[email protected] [email protected] carierli@ocbcw h.com
Wellian Wiranto Ezien Hoo
[email protected] [email protected]
Tommy Xie Dongming
Barnabas Gan
OCBC Treasury Research
This publication is solely for information purposes only and may not be published, circulated, reproduced or distributed in whole or in part to any other person without our prior written consent. This publication should not be construed as an offer or solicitation for the subscription, purchase or sale of the securities/instruments mentioned herein. Any forecast on the economy, stock market, bond market and economic trends of the markets provided is not necessarily indicative of the future or likely performance of the securities/instruments. Whilst the information contained herein has been compiled from sources believed to be reliable and we have taken all reasonable care to ensure that the information contained in this publication is not untrue or misleading at the time of publication, we cannot guarantee and we make no representation as to its accuracy or completeness, and you should not act on it without first independently verifying its contents. The securities/instruments mentioned in this publication may not be suitable for investment by all investors. Any opinion or estimate contained in this report is subject to change without notice. We have not given any consideration to and we have not made any investigation of the investment objectives, financial situation or particular needs of the recipient or any class of persons, and accordingly, no warranty whatsoever is given and no liability whatsoever is accepted for any loss arising whether directly or indirectly as a result of the recipient or any class of persons acting on such information or opinion or estimate. This publication may cover a wide range of topics and is not intended to be a comprehensive study or to provide any recommendation or advice on personal investing or financial planning. Accordingly, they should not be relied on or treated as a substitute for specific advice concerning individual situations. Please seek advice from a financial adviser regarding the suitability of any investment product taking into account your specific investment objectives, financial situation or particular needs before you make a commitment to purchase the investment product. OCBC and/or its related and affiliated corporations may at any time make markets in the securities/instruments mentioned in this publication and together with their respective directors and officers, may have or take positions in the securities/instruments mentioned in this publication and may be engaged in purchasing or selling the same for themselves or their clients, and may also perform or seek to perform broking and other investment or securities-related services for the corporations whose securities are mentioned in this publication as well as other parties generally.
Co.Reg.no.:193200032W