giving wastewater a boost with breakthroughs in … · with breakthroughs in secondary treatment...
TRANSCRIPT

Giving Wastewater a Boost with Breakthroughs in Secondary TreatmentBrent GilesResearch Director
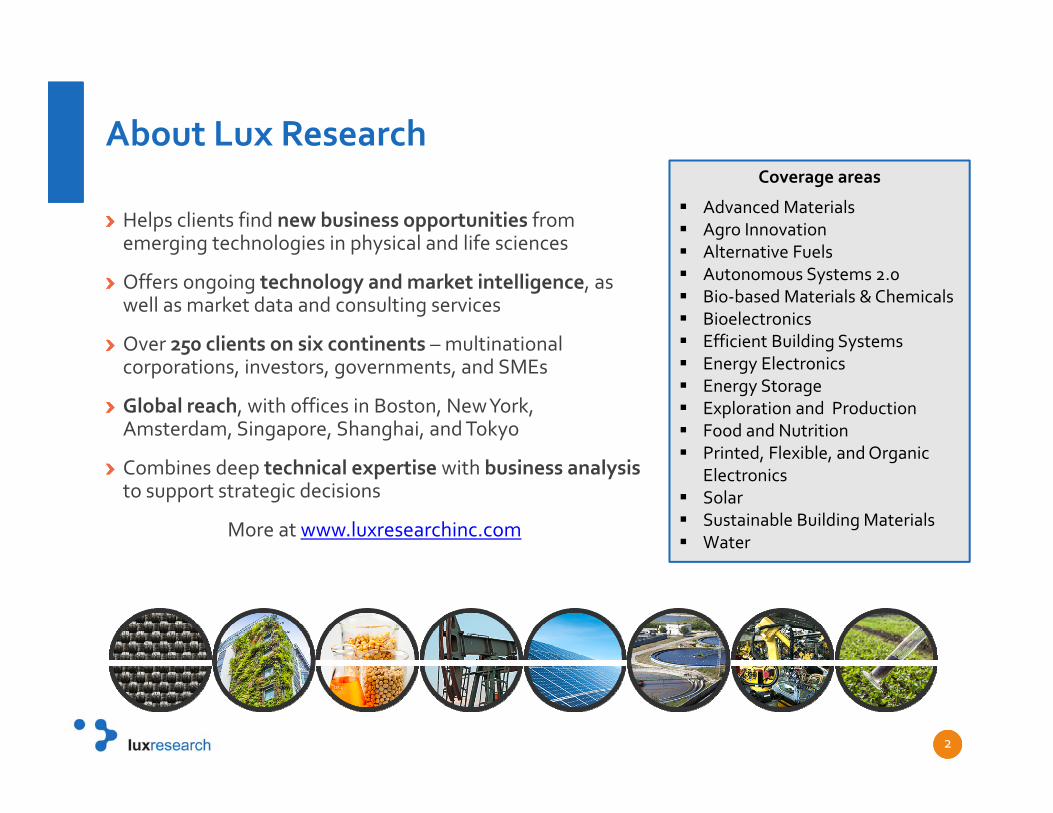
About Lux Research
Helps clients find new business opportunities from emerging technologies in physical and life sciences
Offers ongoing technology and market intelligence, as well as market data and consulting services
Over 250 clients on six continents – multinational corporations, investors, governments, and SMEs
Global reach, with offices in Boston, New York, Amsterdam, Singapore, Shanghai, and Tokyo
Combines deep technical expertisewith business analysis to support strategic decisions
More at www.luxresearchinc.com
2
Coverage areas
Advanced Materials Agro Innovation Alternative Fuels Autonomous Systems 2.0 Bio‐based Materials & Chemicals Bioelectronics Efficient Building Systems Energy Electronics Energy Storage Exploration and Production Food and Nutrition Printed, Flexible, and Organic
Electronics Solar Sustainable Building Materials Water

Contents
Problems with existing wastewater treatment
A picture of the “average” activated sludge plant
Six innovative technologies go head to head
3
Stickney Water Reclamation Plant, Chicago

Contents
Problems with existing wastewater treatment
A picture of the “average” activated sludge plant
Six innovative technologies go head to head
4
Stickney Water Reclamation Plant, Chicago

Wastewater treatment gobbles energy and produces large volumes of sludge
The dominant process for treating the world’s wastewater, activated sludge, faces three major issues:
5
High energy consumption
Mountains of waste sludge
The squeezefor space

Anaerobic digestion reduces, but doesn’t eliminate waste sludge
6
Does not scale down well
Many facilities need to combine sludge with other waste streams
Reduces sludge volume by about 40%, but you still have to do something with the remaining stabilized biosolids
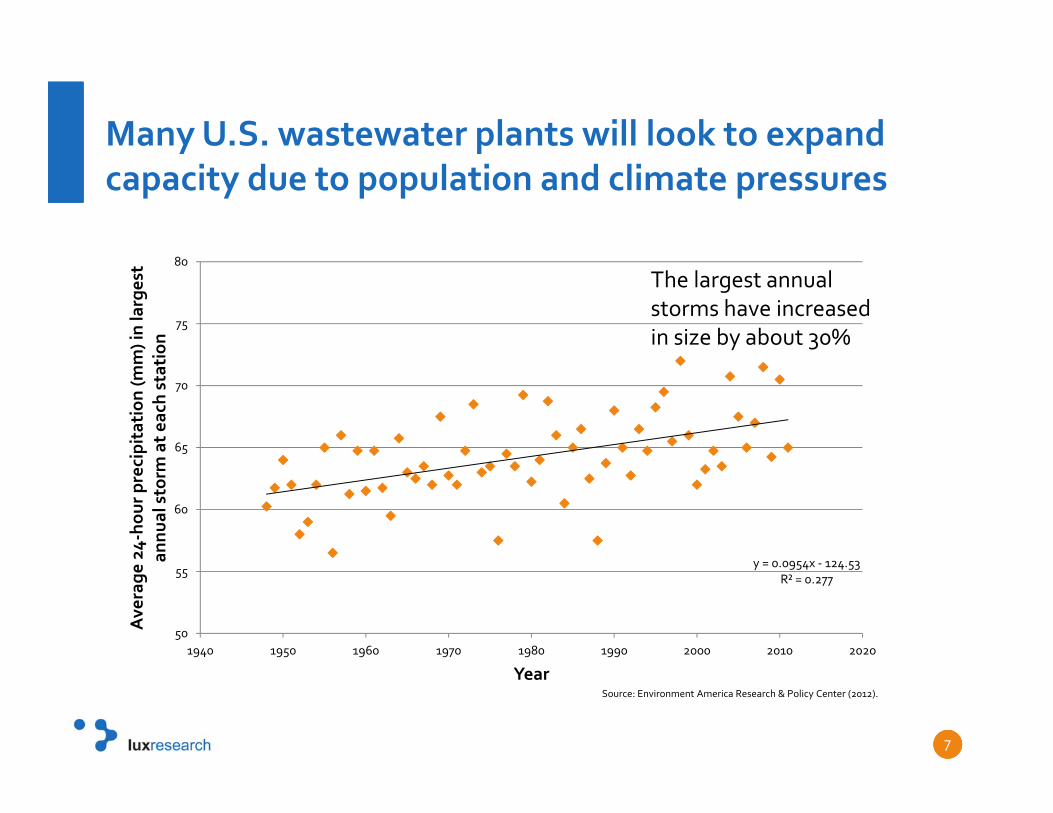
The largest annual storms have increased in size by about 30%
y = 0.0954x ‐ 124.53R² = 0.277
50
55
60
65
70
75
80
1940 1950 1960 1970 1980 1990 2000 2010 2020
Ave
rage 24‐ho
ur precipitation (m
m) in larges
t an
nual sto
rm at e
ach station
Year
Many U.S. wastewater plants will look to expand capacity due to population and climate pressures
7
Source: Environment America Research & Policy Center (2012).

Many U.S. wastewater plants will look to expand capacity due to population and climate pressures
8
Change in frequency of extreme storm events, 1948 to 2011
New EnglandExtreme storms now occur 85% more frequently
0%
10%
20%
30%
40%
50%
60%
70%
80%
90%
100%
0 Up to 378m3/day
Up to 3780m3/day
Up to 37,800m3/day
Up to 378,000m3/day
Total
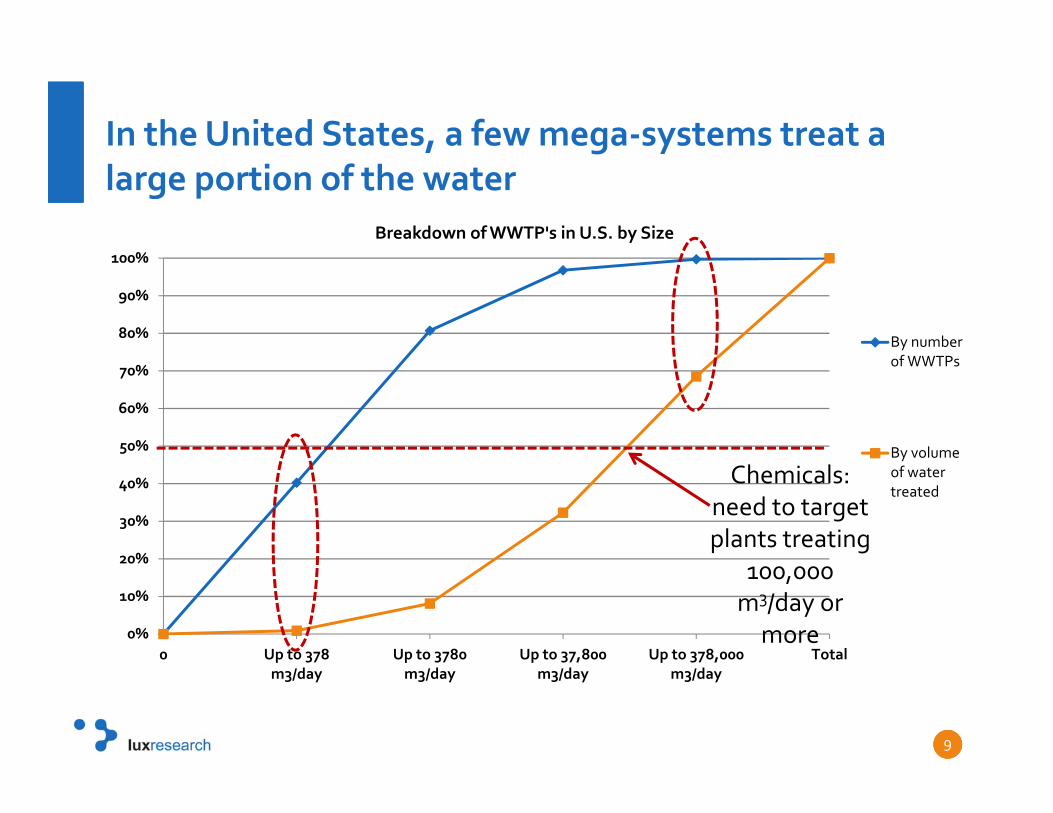
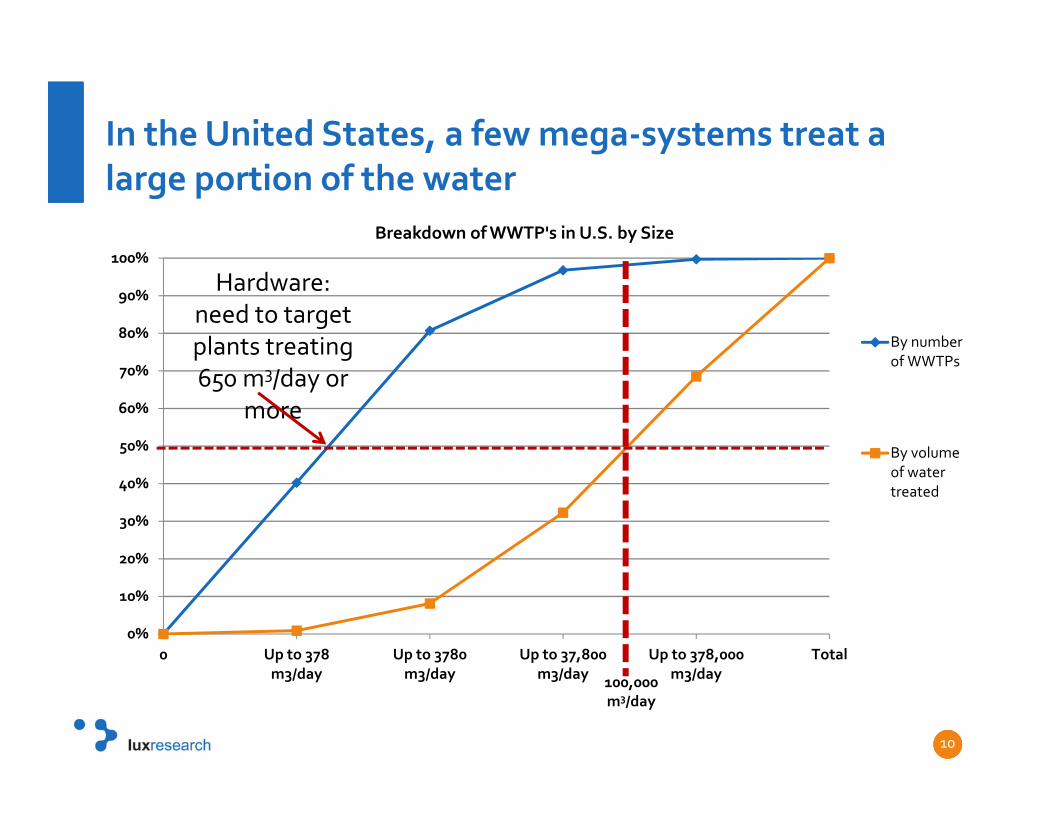
Breakdown of WWTP's in U.S. by Size
By numberof WWTPs
By volumeof watertreated
In the United States, a few mega‐systems treat a large portion of the water
9
Chemicals: need to target plants treating
100,000 m3/day or more
0%
10%
20%
30%
40%
50%
60%
70%
80%
90%
100%
0 Up to 378m3/day
Up to 3780m3/day
Up to 37,800m3/day
Up to 378,000m3/day
Total
Breakdown of WWTP's in U.S. by Size
By numberof WWTPs
By volumeof watertreated
In the United States, a few mega‐systems treat a large portion of the water
10
Hardware: need to target plants treating 650 m3/day or
more
100,000m3/day

Contents
Problems with existing wastewater treatment
A picture of the “average” activated sludge plant
Six innovative technologies go head to head
11
Stickney Water Reclamation Plant, Chicago

The “average” wastewater treatment plant
We compiled a representative sample of activated sludge wastewater treatment plants throughout the U.S.
For each plant, we collected data onAverage daily flowVolume of sludge generatedEnergy consumedNumber of staffFootprint and unused space
12
0
50,000
100,000
150,000
200,000
250,000
300,000
350,000
400,000
450,000
500,000
0 200,000 400,000 600,000 800,000
Ave
rage daily flow (m
3/da
y)
Population
Population vs. wastewater volume
0
5
10
15
20
25
30
35
40
45
50
0 200,000 400,000 600,000 800,000
Foot
print (ac
res)
Average daily flow (m3/day)
Actual and minimum footprint
Actualfootprint
Minimumfootprint
0
2,000
4,000
6,000
8,000
10,000
12,000
14,000
16,000
0 100,000 200,000 300,000 400,000 500,000
Dry solids slud
ge (ton
s/yr)
Average daily flow (m3/day)
Sludge production

13
The “typical” U.S. 100,000 m3/day plant
Wastewater volume: 100,000 m3/day
Population: 180,000 people
Energy consumption: 0.4 kWh/m3
Staff: 46
Sludge production: 3150 tons/year dry, or 12,600
tons/year at 25% solids
Minimum footprint: 12.5 acres
Annual operating cost: $4million/year
13
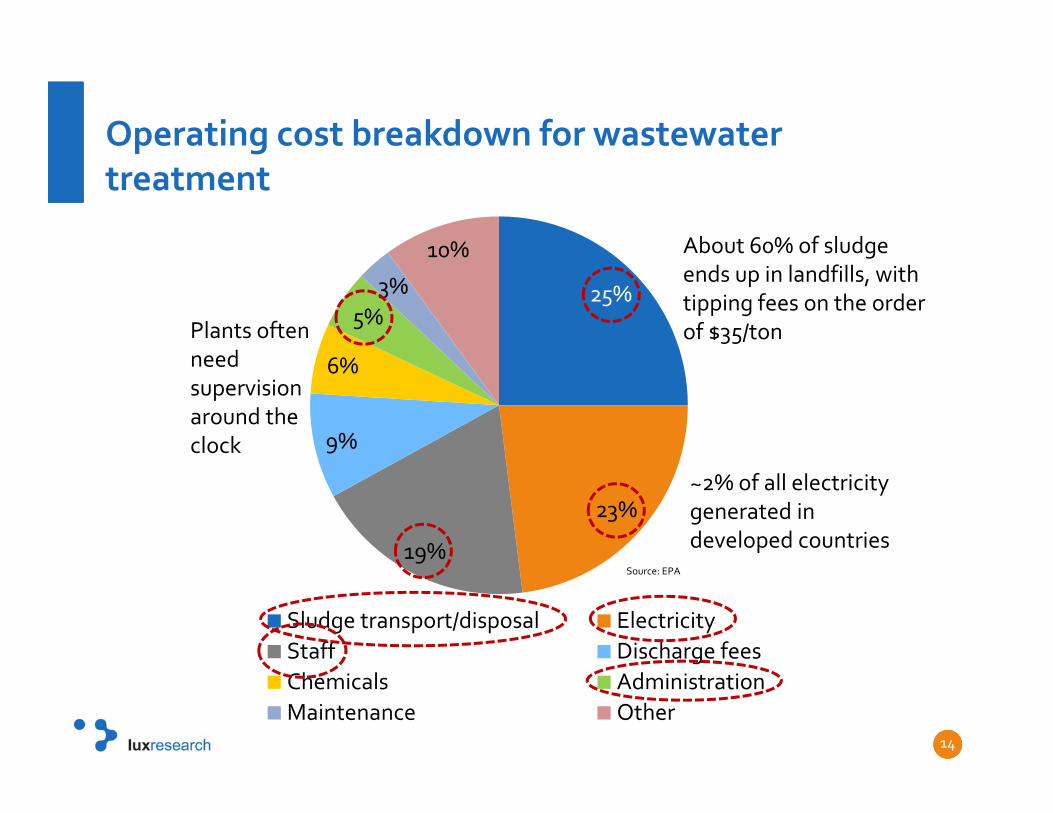
25%
23%
19%
9%
6%
5%3%
10%
Sludge transport/disposal ElectricityStaff Discharge feesChemicals AdministrationMaintenance Other
Operating cost breakdown for wastewater treatment
14
Source: EPA
About 60% of sludge ends up in landfills, with tipping fees on the order of $35/tonPlants often
need supervision around the clock
~2% of all electricity generated in developed countries
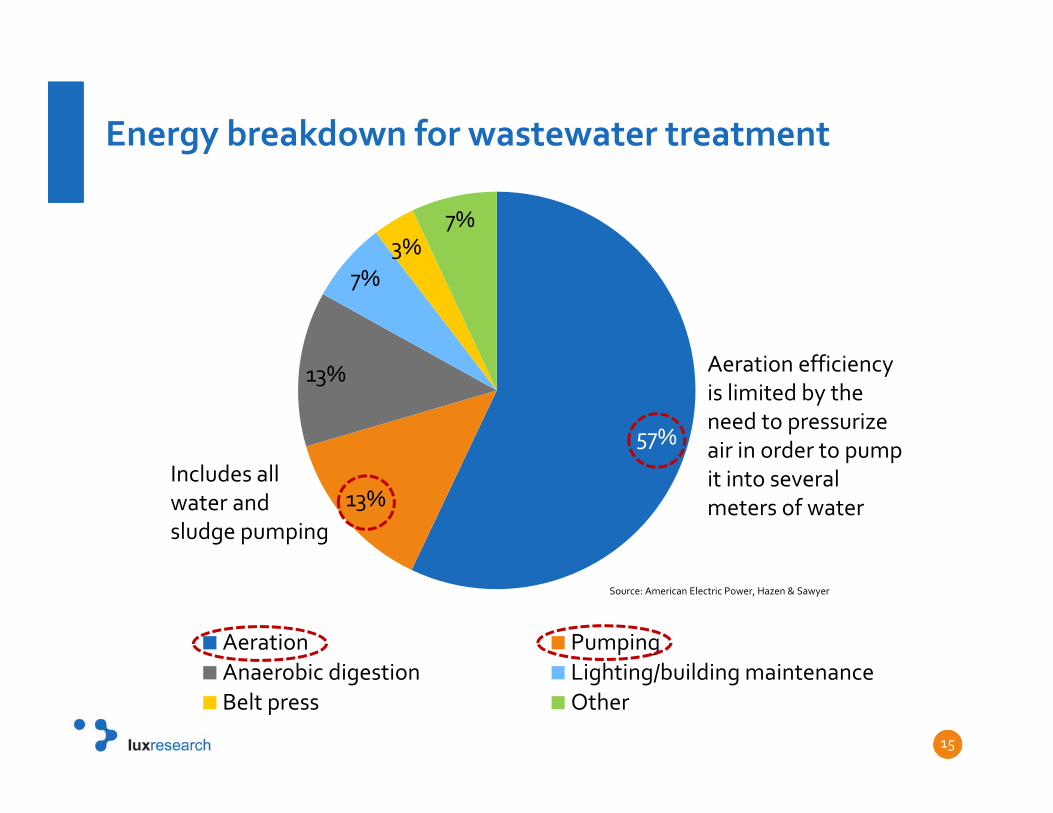
Energy breakdown for wastewater treatment
15
57%
13%
13%
7%3%
7%
Aeration PumpingAnaerobic digestion Lighting/building maintenanceBelt press Other
Source: American Electric Power, Hazen & Sawyer
Includes all water and sludge pumping
Aeration efficiency is limited by the need to pressurize air in order to pump it into several meters of water
Contents
Problems with existing wastewater treatment
A picture of the “average” activated sludge plant
Six innovative technologies go head to head
16
Stickney Water Reclamation Plant, Chicago

How we compared these technologies
17
Based in Founded Revenue Employ‐ees
Australia 2009 $2 million
12
Australia 1996 $4 million
12
U.S. 2004 $7 million
20
Israel 2007 Pre‐revenue
25
U.S. 2006 $10 million
12
Ireland 2013 $500,000 27

BioGill
Ceramic “gill” material supports biofilm
Gills create passive aeration and allow biofilm to slough off due to gravity
18
1
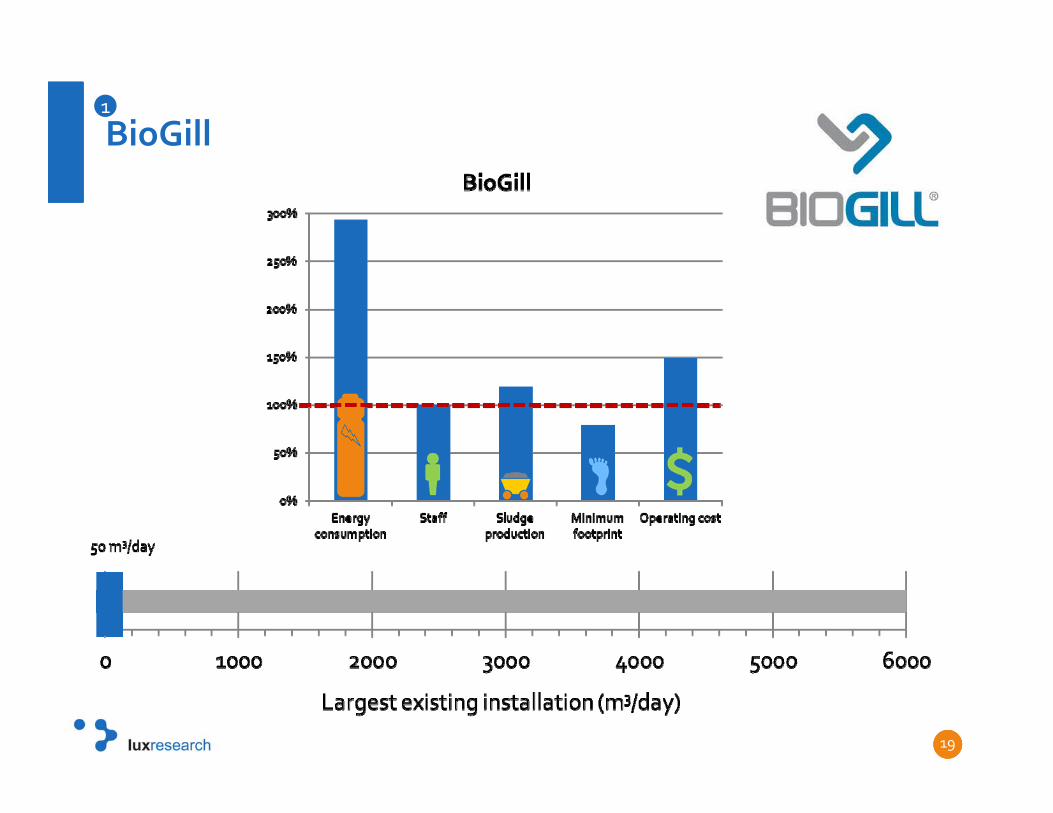
BioGill
19
1

AquaCell
Membrane bioreactors provide high‐quality effluent
Focus on graywater and blackwater recycling systems within a building or campus
20
2

AquaCell
21
2

Baswood
Separates secondary treatment into three reactors
“Dry cycle” reduces sludge volume and removes old biomass
22
3

Baswood
23
3

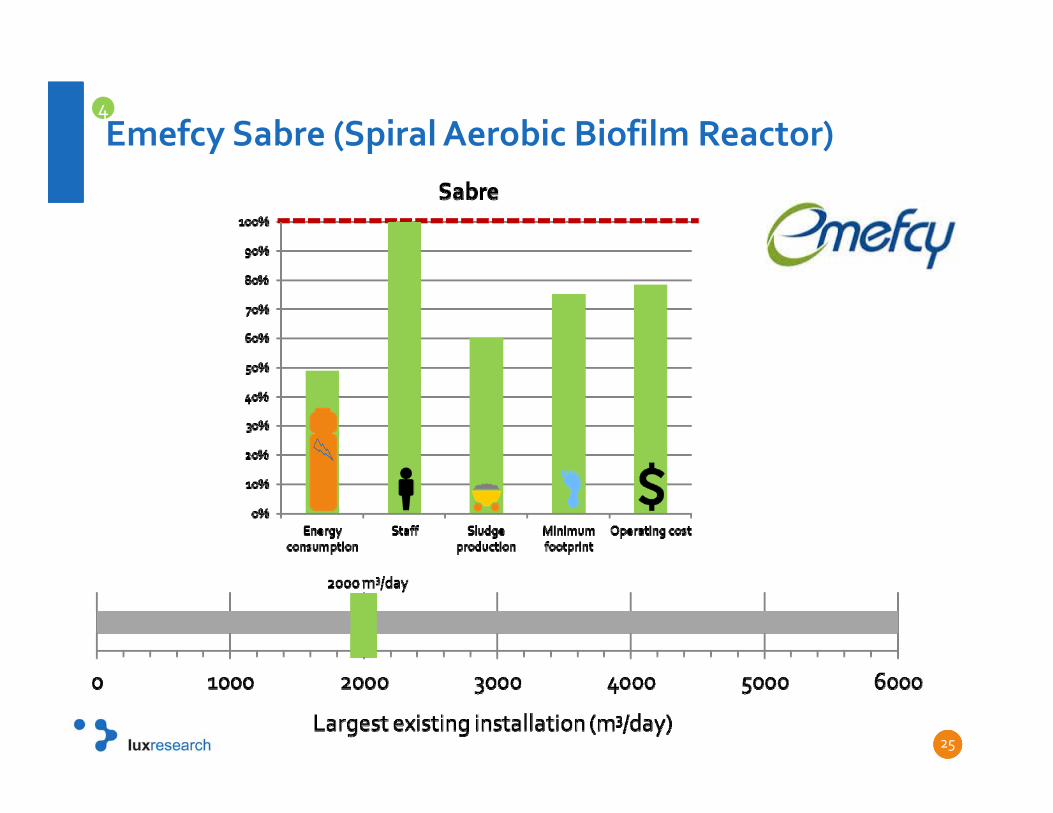
Emefcy Sabre (Spiral Aerobic Biofilm Reactor)
Another take on passive aerationSpiral shape with biofilm on insideIncorporates a backwash cycle
24
4
Emefcy Sabre (Spiral Aerobic Biofilm Reactor)
25
4
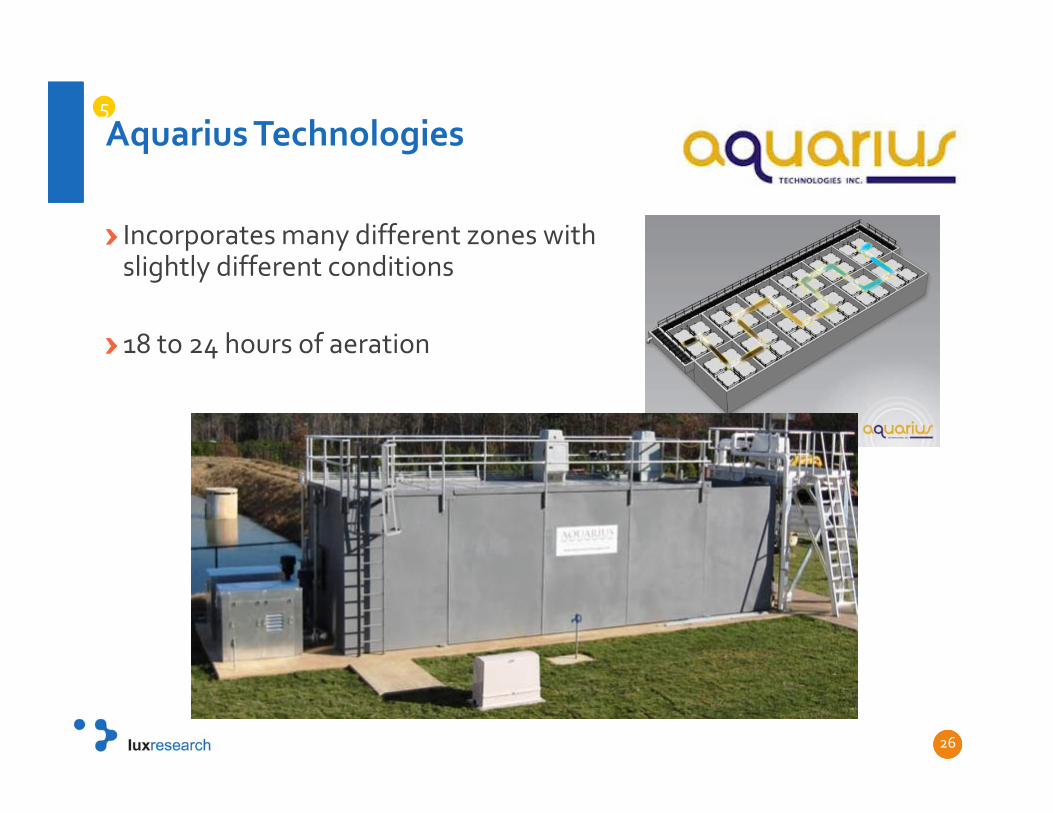
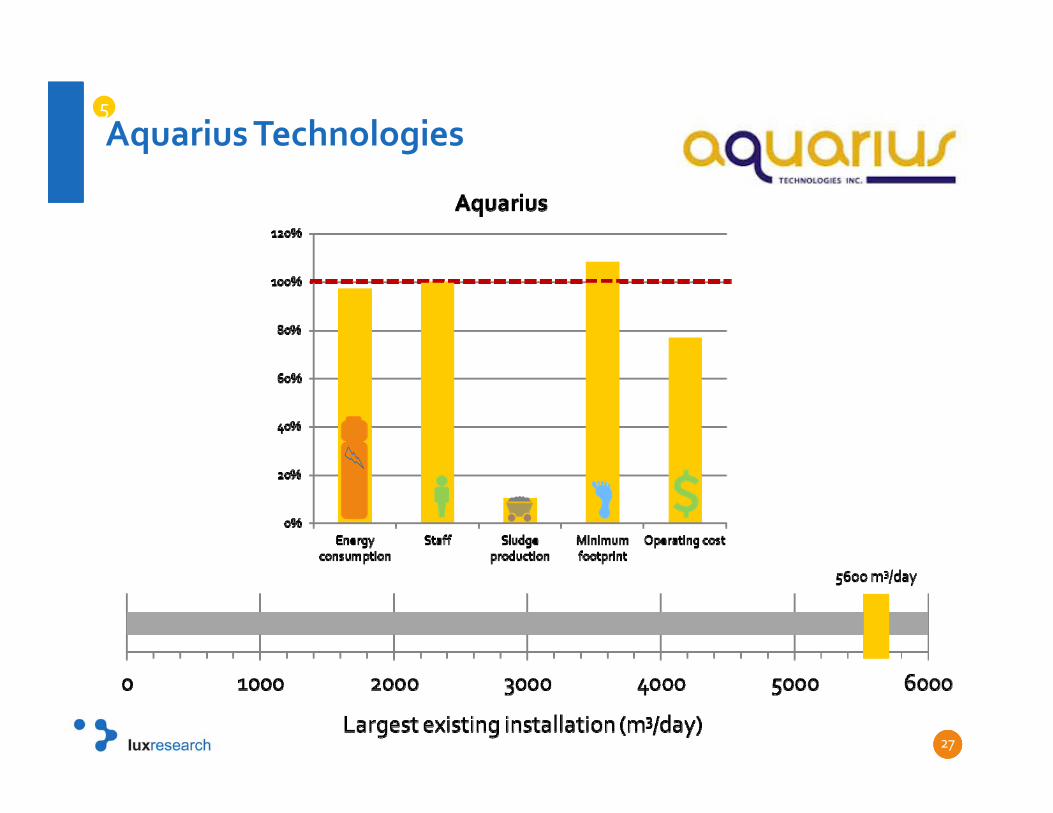
Aquarius Technologies
Incorporates many different zones with slightly different conditions
18 to 24 hours of aeration
26
5
Aquarius Technologies
27
5

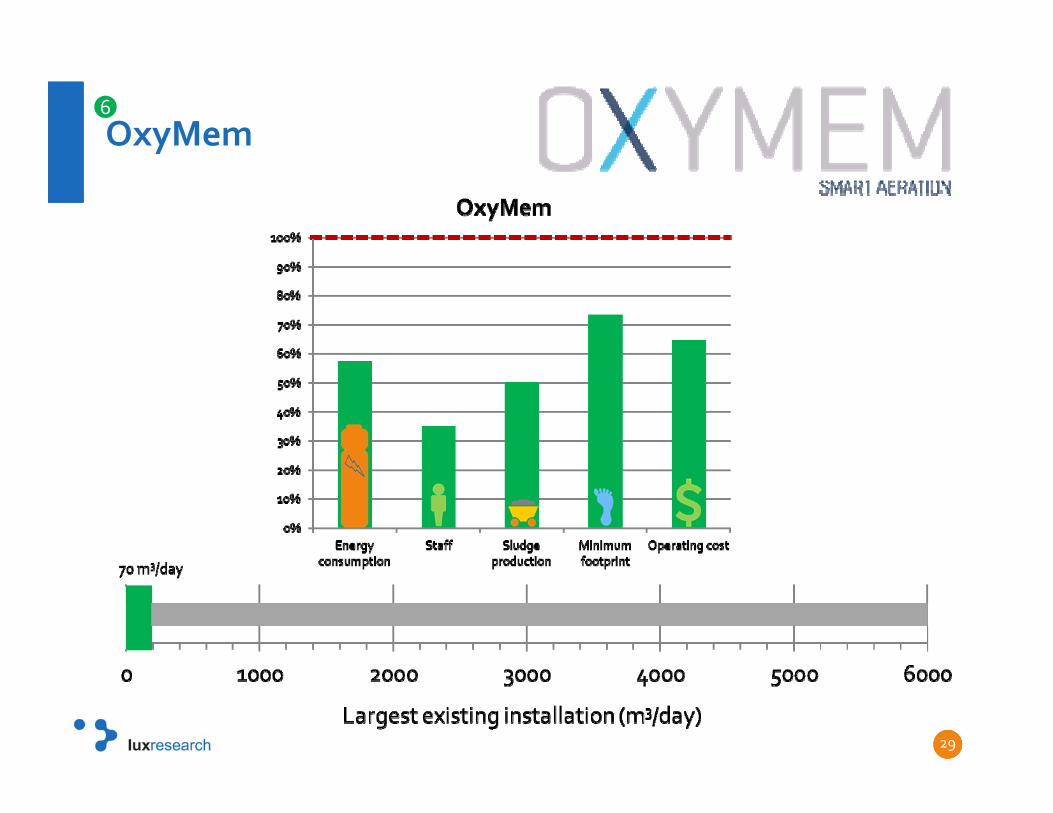
OxyMem
Membrane Aerated Biofilm Reactor (MABR) provides air through the inside of hollow fiber membrane
Monitors biofilm growth by nitrogen production
Developing easy‐retrofit solution
28
6
OxyMem
29
6

0%
50%
100%
150%
200%
250%
300%
350%
400%
450%
500%
Activated sludge BioGill AquaCell Baswood Sabre Aquarius OxyMem
EnergyconsumptionSludgeproductionMinimumfootprintNumber ofstaffOperatingcost
The next generation of secondary wastewater treatment
30
Energy consumption of typical MBR
Operating cost of typical MBR
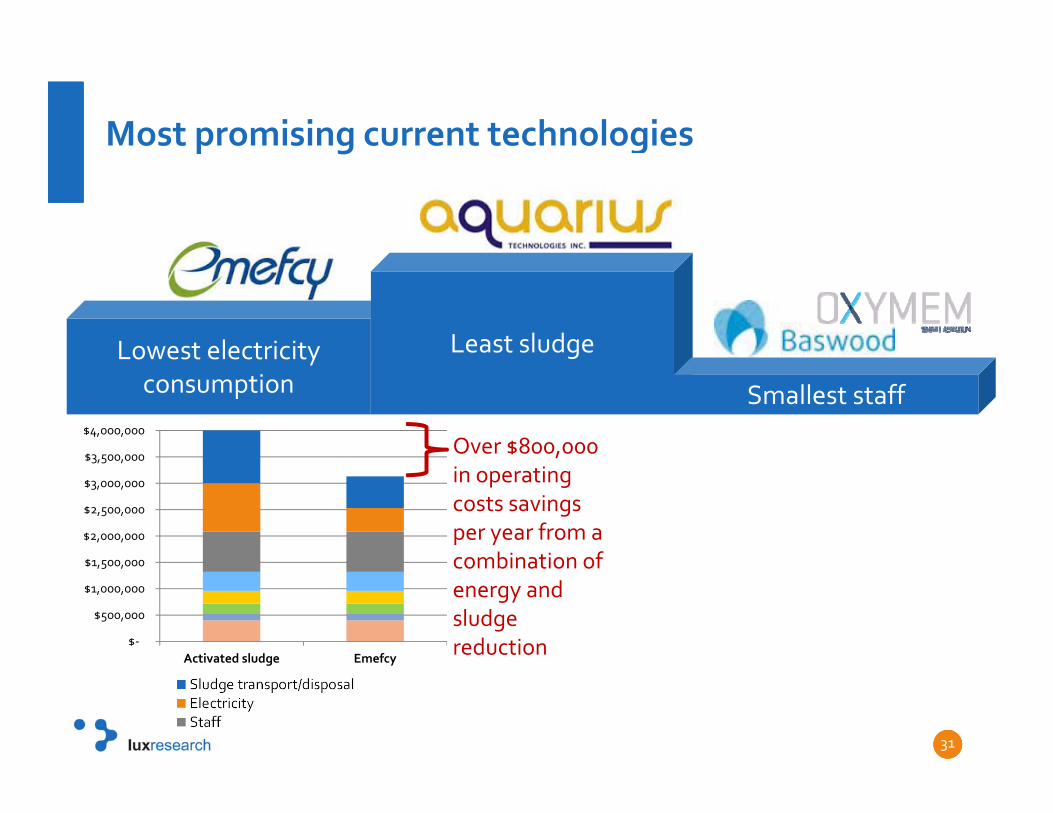
Lowest electricity consumption
Most promising current technologies
31
Least sludge
Smallest staff
Over $800,000 in operating costs savings per year from a combination of energy and sludge reduction $‐
$500,000
$1,000,000
$1,500,000
$2,000,000
$2,500,000
$3,000,000
$3,500,000
$4,000,000
Activated sludge Emefcy

Lowest electricity consumption
Most promising current technologies
32
Least sludge
Smallest staff
$‐
$500,000
$1,000,000
$1,500,000
$2,000,000
$2,500,000
$3,000,000
$3,500,000
$4,000,000
Activated sludge Aquarius
Over $900,000 in operating costs savings per year, mostly from savings on sludge disposal
Lowest electricity consumption
Most promising current technologies
33
Least sludge
Smallest staff
$‐
$500,000
$1,000,000
$1,500,000
$2,000,000
$2,500,000
$3,000,000
$3,500,000
$4,000,000
Activated sludge Baswood OxyMem
Over $1 million in operating cost savings from staff reduction, sludge reduction, and energy savings
