giving stated preference respondents “time to think”: results from four countries
TRANSCRIPT

Environ Resource Econ (2012) 51:473–496DOI 10.1007/s10640-011-9508-4
Giving Stated Preference Respondents “Time to Think”:Results From Four Countries
Joseph Cook · Marc Jeuland · Brian Maskery ·Dale Whittington
Accepted: 4 September 2011 / Published online: 24 September 2011© Springer Science+Business Media B.V. 2011
Abstract Previous studies have found that contingent valuation (CV) respondents whoare given overnight to reflect on a CV scenario have 30–40% lower average willingness-to-pay (WTP) than respondents who are interviewed in a single session. This “time to think”(TTT) effect could explain much of the gap between real and hypothetical WTP observed inexperimental studies. Yet giving time to think is still rare in binary or multinomial discretechoice studies. We review the literature on increasing survey respondents’ opportunities toreflect on their answers and synthesize results from parallel TTT studies on private vaccinedemand in four countries. Across all four countries, we find robust and consistent evidencefrom both raw data and multivariate models for a TTT effect: giving respondents overnightto think reduced the probability that a respondent said he or she would buy the hypotheticalvaccines. Average WTP fell approximately 40%. Respondents with time to think were alsomore certain of their answers, and a majority said they used the opportunity to consult with
Electronic supplementary material The online version of this article (doi:10.1007/s10640-011-9508-4)contains supplementary material, which is available to authorized users.
J. Cook (B)Evans School of Public Affairs, University of Washington, Seattle, WA 98195-3055, USAe-mail: [email protected]
M. JeulandSanford School of Public Policy and Duke Global Health Institute, Durham, NC, USAe-mail: [email protected]
B. MaskeryPolicy and Economic Research Unit, International Vaccine Institute, Seoul, Koreae-mail: [email protected]
D. WhittingtonDepartment of Environmental Sciences and Engineering, University of North Carolina at Chapel Hill,Chapel Hill, NC, USAe-mail: [email protected]
D. WhittingtonManchester Business School, Manchester, UK
123

474 J. Cook et al.
their spouse or family. We conclude with a discussion of why researchers might be hesitantto adopt the TTT methodology.
Keywords Stated preference · Hypothetical bias · Contingent valuation · Stated choice
1 Introduction
Stated preference (SP) valuation methods are now widely used throughout the world to studyindividual and household preferences in various policy sectors (environment, transportation,health, social welfare programs, etc.). From its inception, stated preference research has beensubject to the criticism that it suffers from hypothetical and other biases. The charge is thathypothetical responses do not predict actual behavior, and that welfare estimates arising fromthese studies overestimate true willingness-to-pay. There have now been over two decadesof careful empirical work that has improved SP methodologies, including the well-knownNOAA panel guidelines, the inclusion of “cheap talk” scripts, and the recent attention to theincentive compatibility of SP scenarios (Carson and Groves 2007).1 At virtually every turn,most SP researchers tend to make research design and analysis choices that will provide themost conservative estimates of willingness to pay (WTP) in order to guard against chargesof inflated welfare estimates.
Hypothetical bias probably remains, however (Harrison 2006). The rise of behavioral eco-nomics may soon focus more criticism on this bias in stated preference studies. We discussone SP design feature—“time to think” (TTT)—that has not yet been widely used, yet maycontribute to narrowing the gap between real and hypothetical WTP estimates. Many real-world situations, either in the context of voting for referenda or private purchasing decisions,potentially involve some degree of deliberation. Many consumers and voters will want tothink carefully about the program or referendum with regards to their budget or their annualtax bill before reaching their decision. They may want to confer with partners, family mem-bers or friends. They may seek out alternative sources of information. Other people may donone of these things. Yet a dominant feature of nearly all existing in-person stated preferenceinterviews is that respondents are given the scenario and are asked to quickly make theirdecisions during a single interview. (This is not true of mail surveys, of course, althoughmost SP researchers would probably agree that in-person interviews remain the gold stan-dard for high-quality SP studies because of the ability of a well-trained interviewer to controlthe information and flow of the interview). Beginning in the 1990’s, a handful of split-sam-ple studies gave some respondents overnight to think about the scenario before reaching adecision. Most studies found clear evidence that respondents who had a chance to deliberatewere less likely to say yes to the hypothetical scenario, lowering average willingness-to-payin the sample population. Some respondents who were initially given no time to think werethen given the opportunity to revise their answers overnight. In many cases, they revised theiranswers downwards.
1 There is also evidence that stated preference studies do in fact predict actual behavior with a reasonabledegree of accuracy. Griffin et al. (1995) found that a binary choice stated preference survey predicted wellwhether respondents in Kerala, India would connect to an improved water supply network that had in factbecome available a short time after the survey. In one stated behavior study (though not a SP study), Whitehead(2005) found that stated decisions in 1998 to evacuate from hypothetical hurricanes of varying severities incoastal North Carolina were a reasonably good predictor of actual evacuation decisions from real hurricanesin 1999.
123

Giving Stated Preference Respondents “Time to Think” 475
Despite this, very few SP studies have incorporated a time-to-think design. Researchersmay be wary of the logistical and financial difficulties of implementing TTT (because itrequires two interviews). Some may feel that giving time to think does not in fact replicatereal-world situations since many or most voters (in the public good context) may pay littleattention to an issue until they enter the voting booth. Another valid theoretical objectionis that giving a respondent time to think introduces the possibility of strategic behavior,especially if survey participants have opportunities to discuss their answers with each other.
We synthesize results from four parallel TTT studies conducted in India, Mozambique,Vietnam and Bangladesh between 2002 and 2006. The studies estimated private demandfor improved, “next generation” cholera and typhoid vaccines that are unavailable in thesecountries. Although the research designs differed somewhat, all four studies used the samegeneral split-sample approach to examine the effect of time to think on both single binarydiscrete choice (India, Bangladesh, Mozambique) and a sequence of multinomial choice(Vietnam) responses.2 Although the full results from these studies have recently appeared inthe literature (Cook et al. 2007; Lucas et al. 2007; Whittington et al. 2008; Islam et al. 2008),these papers were not focused on the examination of the effect of TTT [with the exception ofCook et al. (2007)]. Furthermore, because of their public health and development focus, theymay not have come to the attention of many SP practitioners, many of whom are environmen-tal economists. We find consistent and robust results that a time-to-think treatment lowersaverage WTP on the order of 30–40%. This result is statistically-significant and robust toa correction which drops uncertain respondents. In fact, giving respondents’ time to thinkincreases the certainty they have in their answers.
The next section reviews the literature on giving respondents time to think, includingrelated research on test-retest studies, group elicitation approaches, and the “drop-off” pro-tocol. We then discuss seven hypotheses on the underlying mechanisms for why TTT maychange responses. Section 4 describes the research design and the four sites where we gaverespondents time to think. Section 5 describes our main time-to-think results. We concludewith the limitations of the study as well as reflections on the advantages and disadvantagesof giving respondents time to think during stated preference surveys.
2 Literature
Since differences in preferences between respondents with and without time to think couldreflect a lack of stability of preferences, we begin with a brief review of the large num-ber of “test-retest” studies conducted since the mid-1980’s. Test-retest studies measure thereliability of single or repeated binary choices by measuring willingness to pay at two ormore points in time. The earliest of these studies were panels, administering exactly thesame survey to the same respondents separated by a gap of 1 month (Jones-Lee et al. 1985)or 2 weeks (Kealy et al. 1988, 1990). Both studies found no statistical evidence for differ-ences in responses. Because of concerns that respondents simply anchored on their previousanswers, subsequent studies lengthened the interval between interviews to several monthsor years. Loomis (1989, 1990) surveyed the same respondents about water quality improve-ments in Mono Lake 9 months after the initial survey and found that initial and follow-up WTP were significantly correlated. In a more recent example, Brouwer et al. (2008)found that 80% of Bangladeshi respondents who were contacted 6 months after the original
2 There has been some confusion in the literature on the names for various stated preference approaches. Weuse Carson and Louviere’s (2011) nomenclature. Carson and Louviere’s phrase “multinomial discrete choicesequence” is used to describe the approach that has been called discrete choice experiments, choice models,applied choice analysis, choice experiments, stated choice experiments, and conjoint analysis.
123

476 J. Cook et al.
in-person WTP survey (for flood risk reduction) said they would answer the WTP questionin the same way. In addition to panel studies, four “test-retest” studies were conducted withindependent samples from a single population at two time periods (Reiling et al. 1990; Teislet al. 1995; Carson et al. 1997; Whitehead and Hoban 1999). All four studies found thatWTP was stable over the time periods tested, ranging from several months to several years.3
Many of the test-retest studies, as well as other early contingent valuation studies, were mailsurveys, so that respondents could answer at their leisure and in effect had time to think ifthey wanted it. Among test-retest studies, only Carson et al. (1997), Jones-Lee et al. (1985),and Brouwer et al. (2008) have used in-person interviews.
A series of studies in the early 1990’s first examined the effect of giving stated preferencerespondents more “time to think” about their answers to valuation questions. Whittingtonet al. (1992) examined WTP for public water taps and private water connections in Anam-bra State (Nigeria). Half of respondents in the study heard the SP scenario during the firstvisit from interviewers but were given overnight to think about it before responding. Theother half responded during the first interview; these respondents were subsequently giventhe opportunity to revise their answers overnight. Elicitation was a double-bounded (biddinggame) question, analyzed using four different approaches. The researchers found that givingrespondents time to think decreased WTP, program ratings and likelihood of connection forboth public taps and private connections; the results were robust across the four modelingapproaches. Average WTP fell by approximately 37% for public taps and 32% for privatetaps. Informal group interviews conducted after the interview uncovered no evidence thatthe extra time induced people to answer strategically. Similarly, Lauria et al. (1999) foundthat giving respondents time to think reduced bids for improved sanitation services in thePhilippines. They found evidence of a starting point bias in the double-bounded referendumquestions (higher starting bids increased WTP), but found that giving time to think erasedthat bias. In contrast, Whittington et al. (1993) did not find that time to think had a robusteffect on WTP for sanitation services in Ghana. Time to think only reduced WTP for sewerconnections within the subset of respondents with water connections.
There has been little additional empirical investigation on the subject since the 1990’s.Svedsater (2007) examined hypothetical donations to an environmental program among 111students in London. He used a multiple-bounded discrete choice format with explicit levelsof uncertainty (i.e. “I am 90% sure I would pay”; Welsh and Poe 1998), and gave one third ofstudents 1 week to consider their responses. Svedsater found that TTT reduced respondents’uncertainty and lowered WTP. No split sample time-to-think studies have been conducted inthe general population of an industrialized country. However, there have been two parallellines of research that echo some of the same findings.
The first is the use of groups to elicit WTP. Alternately called the “market stall”(Macmillan et al. 2002; Lienhoop and Macmillan 2002) or “citizen jury” approach (Alvarez-Farizo and Hanley 2006), these surveys are typically split sample experiments where half ofrespondents complete a valuation exercise in one interview. The other half of respondentsmeet in groups to discuss the scenarios and ask clarifying questions of a moderator. At theend of the hour-long session they answer the valuation exercise individually and confiden-tially. They then attend another group session 1 week later after they have had a chance todiscuss with family, seek out more information, consider budget constraints, etc., and answer
3 One exception is Whitehead and Hoban (1999), who found that WTP for a generalized scenario of environ-mental protection was lower during the follow-up survey 5 years after the initial survey. They also observed,however, that the percent of the underlying population with favorable views toward government as well as thepercent who ranked environmental concerns highly had decreased over the same period. Controlling for thesechanges, preferences were temporally stable.
123
Giving Stated Preference Respondents “Time to Think” 477
the same valuation question(s). Macmillan et al. (2002) found that respondents who wereinterviewed individually without time to think had mean WTP 2–4 times higher than thosewho participated in this “market stall” group approach. Over one-third of group respondentschanged their answers during the intervening week, and group participants were less certainof their responses than those interviewed individually.
The second line of research is the use of a “drop-off” protocol (Subade 2007; Labaoet al. 2008; Nabangchang 2008). In a study valuing reef protection in the Philippines, Subade(2007) randomly assigned half of respondents to complete a standard in-person CV interview.Interviewers made personal contact with the other half of respondents, but left the survey withthe respondent to complete. They made an appointment to retrieve the completed question-naire and answer any questions. Subade found that WTP among the sample who completedthe drop-off protocol was approximately 50% lower than WTP estimates from the samplerespondents who completed the standard in-person interview. One drawback of this methodis that, like a mail survey, it requires that respondents be literate, which is a problem in somepopulations in developing countries. Like mail surveys, the drop-off protocol also does notcarefully control the flow of the information in the questionnaire, allowing respondents tojump ahead in the survey instrument in unobserved ways. Nevertheless, the design shares acommon feature of TTT designs in that respondents have time to consider their responsesand discuss with family.
3 Why Might Time to Think Change Responses?
In this section we briefly explore seven hypotheses on the underlying mechanisms for whytime to think (TTT) may change responses to valuation questions. They are not mutually-exclusive. Our intent is not to develop a formal model of how time to think enters into indi-viduals’ decision-making processes, but rather to provide a structure for considering whatwe observe in our four study sites and to inform future research on the role and mechanismof the time-to-think effect.
First, TTT may attenuate enumerator bias, or the tendency for respondents to give enumer-ators the answers that they think enumerators want to hear. Good SP surveys, of course, havecarefully-crafted language ensuring respondents that there are no right or wrong answers andproviding socially-acceptable reasons to say no. They are also conducted by enumerators whoare carefully trained to be neutral. Still, respondents may feel pressured to give the “right”answer, and giving TTT may allow respondents to reach their decision overnight (without theenumerator present). In our studies respondents still had to tell the enumerator their decisionthe next day, though it would be possible to pair TTT with a “ballot box” approach (forliterate respondents, this would be very similar to Subade’s “drop-off” protocol).
Second, TTT may attenuate a salience bias. With in-person surveys, someone comes to therespondent’s home and spends 15–30 min describing a good which the respondent probablyhas not spent much time considering before. Despite a warning from the enumerator to con-sider other things that the respondent may spend their money on, they may not adequately con-sider their budget constraint. This phenomenon would be familiar to most used-car salesmen.
Third, the TTT approach may be eliciting group rather than individual preferences.Respondents are allowed, even encouraged, in our studies to consult with their householdmembers and friends. Carlsson (2010) point outs that it is not clear in these circumstanceswhose preferences are being recorded. As he notes, this may be desirable if household-leveldecisions are being studied (as is the case in our vaccine studies), and in fact may be morerepresentative of how individuals make decisions in reality. Time to think may improvepredictive validity.
123

478 J. Cook et al.
Fourth, giving respondents the ability to confer with friends and neighbors could inducestrategic behavior, compromising the incentive compatibility of the elicitation approach. SPsurveys for currently unavailable private goods, like our vaccines, already have incentivecompatibility problems as respondents may overstate their true WTP in order to ensure thatthe good is actually produced and made available in the market, even if they have little inten-tion of actually buying it (Carson and Groves 2007). Giving respondents TTT may allowthem to think strategically in this manner. Even for local public goods (like an improvedpiped water distribution system that a household need not connect to), TTT may increase theprobability that survey respondents could confer, compare the referendum prices they wereoffered, and develop a strategy for answering the valuation question(s) that is not reflectiveof their true WTP. As noted above, though, Whittington et al. (1992) found little evidence ofthis from focus groups.
Fifth, TTT may relax an “attention budget” constraint. Cameron and DeShazo (2010)develop a theoretical model for stated preference and revealed preference data that acknowl-edges that respondents allocate scarce cognitive resources and time to understanding attributesand completing choice tasks in a rational way. They argue that economists may incorrectlyinfer a low marginal utility for an attribute that a respondent cares about but chooses to paylittle attention to because of time constraints or because of small variations in that attribute’slevels. Giving respondents time to think about multinomial discrete choice tasks may relaxthis attention or time constraint, leading to a different pattern of attention allocation acrosstasks than would be the case in the single-interview format.
Sixth, TTT may allow the respondent to learn more about an unfamiliar good by acquiringinformation that was not provided in the survey (e.g.,. from the Internet, friends, etc.). Thisobviously confounds the stated preference experiment. At a minimum, researchers can askabout, and control for, whether respondents sought additional information. For predictivevalidity of the archetypal referendum vote on a public good, however, one would expectsome subset of voters to seek out additional information beyond that provided in a voter’sballot.
Seventh, for unfamiliar goods, TTT may help respondents “discover” their preferences.Thus, TTT may increase respondent’s certainty in their answers. A number of studies (Welshand Poe 1998; Blumenschein et al. 2008) have found that dropping respondents who saythey are not certain eliminates much of the gap between real and hypothetical responses. Weexplore this “uncertainty correction” in our data below. Another approach that has not yetbeen tied to stated preference experiments might be to investigate respondents’ subjectiveexpectations with respect to different aspects of the good being valued (Delavande et al.2010). For example, in the case of vaccines, one might explore whether there is a linkbetween the distribution of subjective expectations about disease risk and WTP, before andafter time-to-think.
4 Study Sites and Research Design
As part of the Diseases of the Most Impoverished (DOMI) program, researchers from theUniversity of North Carolina at Chapel Hill and host-country partners conducted a seriesof studies on private demand for cholera and typhoid vaccines in six countries from 2002to 2006.4 Donors and policymakers were interested in understanding household demand
4 The DOMI program was administered by the International Vaccine Institute (IVI) with support from theBill and Melinda Gates Foundation.
123

Giving Stated Preference Respondents “Time to Think” 479
for “next generation” vaccines which had been the target of scientific research to improvetheir efficacy and lower their cost. Although some respondents had experience with older,less effective versions of these vaccines, the improved “next generation” cholera or typhoidvaccines were generally unavailable in these countries except in limited trials designed toevaluate the vaccines’ protective effectiveness, during which they were distributed free ofcharge (Jeuland et al. 2009c). Because of this unavailability of “next generation” vaccines,we relied on stated preference techniques to measure household demand (Canh et al. 2006;Lucas et al. 2007; Islam et al. 2008; Kim et al. 2008; Whittington et al. 2008). This informa-tion was then used to evaluate the economic attractiveness of investments in these vaccinesusing both benefit-cost and cost-effectiveness techniques (Cook et al. 2008, 2009b; Jeulandet al. 2009a,b). It was also used to examine cross-subsidy schemes where sales to adultscross-subsidize free vaccines for children (Lauria et al. 2009) and optimal vaccine subsidiesin the presence of a herd immunity externality (Cook et al. 2009a). We focus here only on thesubset of these studies that provided stated preference respondents time to think about theiranswers. These were conducted in Hue (Vietnam), Kolkata (India), Beira (Mozambique) andMatlab (Bangladesh).
Although the study team tailored surveys to local conditions and attitudes after carefulfocus groups and pretesting, the structure and content of the questionnaires in all four coun-tries were similar. We begin by describing the research design in Kolkata (India) in somedetail, and then discuss how the design in other sites differed.
4.1 India
Stated preference surveys were conducted in 2004 in two areas of Kolkata (formerly Calcutta):a densely-crowded low income slum (Tiljala), and a neighborhood with more diverse incomesand living conditions (Beliaghata).5 The split-sample TTT experiment was conducted onlyin Beliaghata (n = 559). We randomly selected households that had children under the age of18 and interviewed either the mother or father of the children. We begin by describing thestructure of the survey instrument for the no-time-to-think (NTTT) sample, where the entireinterview was done in one session (Table 1). As in all four countries, interviews were donein person with a team of well-trained local enumerators. The beginning of the survey elicitedviews on vaccines in general, including the households’ vaccination histories. Enumeratorsthen described either a hypothetical cholera or a hypothetical typhoid vaccine in detail. Theythen reminded respondents of their budget constraint and emphasized reasons for and againstpurchasing the vaccine.6 Enumerators also handed respondents a card that read in Bengali:
5 More details on the Kolkata field site, the BC design and results can be found in Whittington et al. (2008).The full bilingual questionnaire used in Kolkata is also available at http://faculty.washington.edu/jhcook/research.html. Similarly, details on the Bangladesh, Mozambique and Vietnam studies can be found in Islamet al. (2008), Lucas et al. (2007) and Cook et al. (2007).6 The script in Kolkata was: “Now I’d like to know whether you would buy the vaccine if it was available ata specified price. Some people say they cannot afford the price of the vaccine or that they are actually notat risk of getting this disease. Other people say that would buy the vaccine because the protection is reallyworth it to them. In other studies about vaccines, we have found that people sometimes say they want to buythe vaccine. They think: ‘I would really like as much protection from this disease as possible.’ However, theymay forget about other things they need to spend their money on. Please try to think carefully about what youwould actually do if you had to spend your own money. There are no right or wrong answers. We really wantto know what you would do… When you give your answer about whether you would or would not buy thevaccine, please consider the following: yours and your family’s income and economic status compared withthe price of the vaccine, and your risk of getting cholera. Apart from the vaccine, remember that we still haveother ways to treat cholera such as oral rehydration solution. Also, remember that the benefit of the vaccine in
123

480 J. Cook et al.
Table 1 Summary of time-to-think studies on cholera and typhoid vaccines
Kolkata, Matlab, Beira, Hue,India Bangladesh Mozambique Vietnam
Vaccine Cholera, typhoid Cholera Cholera Cholera, typhoid
Respondent demandelicitation method
Single binary choice (BC),payment card (PC)
BC PC Sequence of sixmultinomial discretechoices (MDC)
Household demandelicitation method
Open-ended response onquantity demandedbased onrandomly-assignedprice (CT)
CT CT None
Given priceovernight?
No No Yes Yes, given valuation tasksovernight
Sample sizes 559 591 996 400
BC single binary choice, with follow-up for whether the respondent would take a free vaccine and wouldpay anything for it; PC payment card; MDC multinomial discrete choice; CT count of vaccines for householdmembers. Other elicitation approaches were used in these sites (see text); this table refers only to data collectedas part of a TTT split-sample experiment
“In thinking about whether you might want to purchase this vaccine, please keep inmind:
• Yours and your family’s income and economic status• Your risk of getting cholera;• We still have other ways to treat cholera such as oral dehydration solution; and• The vaccine is 50% effective in preventing cholera for 3 years.”
The card for typhoid vaccine had the same information except it substituted typhoid-specific treatment options in place of those for cholera, and used the typhoid vaccine’seffectiveness (70%).
Respondents were then asked to respond to a single binary choice (BC) question aboutwhether they would buy the vaccine for themselves only (what we refer to below as “respon-dent demand”). They were randomly assigned one of four vaccine prices.7 Enumeratorsasked respondents for the reasons for their answers and asked how certain they were of theiranswers (very certain, somewhat certain, not certain/unsure, or no response). Respondentswho said no to the initial vaccine price were also asked if they would take the vaccine iffree, and if so, whether they would pay anything for it, though we did not ask what thatamount would be. Respondents were then asked how many of the vaccines they would buyfor their household members at the randomly-assigned vaccine price (what we call “house-hold demand”), and which household members they would buy a vaccine for. We label thiscount elicitation mechanism “CT” below.
All respondents who either said they would purchase the vaccine for themselves at theassigned price or that they would pay something for the vaccine completed a payment card(PC) exercise. The exercise used the analogy of a traffic light where “green” prices werethose that a respondent was completely sure she would pay, “red” prices were those that
Footnote 6 continuedpreventing cholera is (50% effective for 3 years). Again, the cholera vaccine cannot be used by children under1 year and pregnant women.”7 These were Indian Rs. 10, 25, 50 and 500. At the time of the study US 1$ = Rs. 45.
123

Giving Stated Preference Respondents “Time to Think” 481
Fig. 1 Diagram explaining thetraffic light analogy to Kolkatarespondents for the payment cardexercise
a respondent was completely sure she would not pay, and “yellow” prices were those overwhich the respondent was uncertain (see Fig. 1). Respondents were asked about fifteenprices.8 In summary, we elicited respondent demand using binary choice (BC) and paymentcard (PC) approaches, and demand for vaccines for other household members using a count(CT) approach.
“Time-to-think” respondents were presented with the same information about the hypo-thetical vaccine but were not immediately given the price. Instead, enumerators said thefollowing:
“We are almost at the end of our first interview, and I want to thank you very much foryour time. I would like to return again tomorrow to ask you more questions. I will askyou whether you would want to buy this vaccine for yourself as well as for other mem-bers of your household if it were sold at a certain price. I would encourage you to thinkovernight about how much this new vaccine is worth to you, and the range of prices youmight be willing to pay for this vaccine for yourself and for your household members.You may also want to discuss these decisions with other members of your household.”
The card shown to NTTT respondents (see above) was given to respondents as a “remindercard” to examine overnight. During the second interview, the interviewer asked the exact samesequence of stated preference questions as for NTTT respondents. The interviewer also askedseveral time-to-think debriefing questions, including how long respondents spent thinkingabout the decision, who they discussed the decision with, and other sources of informationthey consulted.
4.2 Bangladesh
Fieldwork was conducted in Matlab, a rural area southeast of Dhaka, in the summer of 2005.The survey focused only on cholera vaccines. The time-to-think research design is nearlyidentical to the one used in Kolkata. Because the PC exercise was completed for the TTTsubsample only, we do not analyze that data here. The final sample size was 591 respondentssplit among six vaccine prices, though nine respondents rejected the vaccine scenario andwere dropped from the analysis. We report results for respondents who lived within the ser-vice delivery area of the International Centre for Diarrhoeal Disease Research (ICDDR-B)
8 These were Indian Rs. 0, 1, 5, 10,15, 25, 50, 75, 100, 200, 300, 400, 500, 1,000, 5,000.
123

482 J. Cook et al.
separately from those who live in the area served by the government. As Islam et al. (2008)note, free access to the ICDDR-B’s nationally-renowned diarrheal disease treatment centermay have lowered stated demand for cholera vaccines.
4.3 Mozambique
This study, conducted in the coastal city of Beira in the summer of 2005, also focused oncholera vaccines. The study design was somewhat different than Kolkata or Matlab. First,respondent demand was elicited only with the PC exercise. Household demand was elic-ited, as in the other two sites, with a count (CT) question with five randomly-assigned prices.There were four subsamples on time-to-think. The first subsample was given no time to think,and completed the PC exercise for respondent demand before answering the CT householddemand question. The second subsample was also given no time to think, but were asked theCT question before the PC exercise. The third subsample completed the PC exercise in thefirst interview, were shown the single randomly-chosen price for household demand, and thengiven overnight to think about the CT question. The fourth subsample were given the singlerandomly-chosen price for household demand and then given overnight to think. During thesecond interview they answered the CT question and completed the PC exercise. Finally, thestarting point on the PC exercise (i.e. whether one starts at a high price first and moves down,or starts at the lowest price first and moves up) was randomized. A figure summarizing theresearch design in Beira is provided in the supplementary appendix (see Figure A1 in theappendix). The final sample size was 991 households.
4.4 Vietnam
Fieldwork was conducted in Hue in the summer of 2003.9 Respondents were asked to com-plete a series of six multinomial discrete choice (MDC) tasks about purchasing a vaccine forthemselves. Each task required the respondent to compare a hypothetical cholera vaccine anda hypothetical typhoid vaccine. The attributes of the vaccines were its effectiveness, duration,and price. Respondents could choose a cholera vaccine, a typhoid vaccine or neither. Thetasks were designed using a standard fractional factorial research design and blocks wererandomly assigned to participants. Half of these MDC respondents were given the set of sixchoice tasks (in the form of laminated cards) to examine and mark overnight (Cook et al.2007). The other half completed the cards in the first interview, but were given the opportunityto revise their answers overnight if they wished, following the approach of Whittington et al.(1992) in Nigeria. The final sample size was 400 households.
Table 2 provides summary statistics for key socioeconomic characteristics by TTT treat-ment in each study site.
5 Results
5.1 Analysis of Respondent Demand
We begin with the raw results from the binomial choice (BC), payment card (PC), andmultinomial discrete choice (MDC) exercises for respondent demand. In the Kolkata and
9 We also used a BC approach to elicit WTP for typhoid vaccines in 2002 (Canh et al. 2006) and choleravaccines in 2003 (Kim et al. 2008). These interviews were all conducted during one interview (i.e. no time tothink) and are thus not discussed further in this paper.
123

Giving Stated Preference Respondents “Time to Think” 483
Table 2 Socioeconomic characteristics by study site and TTT treatment
Kolkata Matlab Beira Hue
NTTT TTT NTTT TTT NTTT TTT NTTT TTT
Male (%) 55 48 47 51 47 47 39 38
Age 36 (8.1) 35 (7.7)** 41 (9.8) 40 (9.6) 37 (11) 37 (12) 46 (8.7) 46 (9.9)
Percent with1–9 yearsof school
42 46 53 53 77a 78a 42 54**
Percent with12 years ofschool orvocational
28 31 10 10 15a 9a*** 29 28
Percent withuniversity orprofessionaldegree
18 16 2 1 14 12 26 11***
Monthly percapitaincome(US$)
$29 (51)b $26 (31)b $14 (10)b $14 (10)b $21 (25)b $20 (25)b $25 (15)b $20 (14)b***
Household size 5.4 (2.4) 5.2 (2.2) 5.6 (2.0) 5.9 (2.0) 6.1 (2.4) 6.0 (2.3) 5.3 (2.1) 5.4 (2.0)
N 278 273 312 279 499 495 200 200
Unless noted, summary statistics are mean (standard deviation). Stars refer to a two-tailed t test for differencein means across TTT subsamples (within sites), *** 1%, ** 5%, * 10%. Per capita income is defined as totalhousehold income divided by the number of household members. a The education categories used in Beirawere 6–7 years and 8–10 years, so this percentage reports those with 1–10 years of education. b This variablehas many missing observations; sample sizes for this variable, starting with Kolkata NTTT and reading to theright are: 278, 273, 312, 279, 258, 159, 176, 180
Matlab BC task, respondents were less likely to say they would buy a cholera or typhoidvaccine for themselves if they were given time to think (Table 3). In all but four cases, thepercentage of NTTT respondents who said yes is higher than the percentage of TTT respon-dents who said yes. Time to think reduced the percentage of respondents who said yes by3–25%. Using a two-tailed Fisher exact test, however, the differences in percent saying yesis statistically significant at the 10% level for only two of the comparisons.
We use information from the payment card (PC) exercise to define lower and upperbounds on WTP, where the lower bound is the highest price that respondents were certainthey would pay (the highest “green” price in the stoplight analogy), and the upper bound isthe lowest price they were certain they would not pay (lowest “red” price). Figure 2 showsthe percentage of Kolkata respondents who said they were completely certain they wouldbuy the vaccine over a range of prices. Giving time to think clearly reduced this percentagefor typhoid vaccines, though somewhat less so for cholera vaccines. For typhoid vaccinesin Kolkata, the lower bound, upper bound, and the midpoint of the interval were all loweramong TTT respondents. The midpoint was 40% lower, and all differences were statisticallysignificant using two-sample t tests (see Table A6 in the appendix). Although the direction ofthe effect is the same for cholera vaccines in Kolkata, none of the differences are statisticallysignificant. Using a nonparametric Kolmogorov–Smirnov test of whether the distributionof values among NTTT respondents is different than the distribution of values among TTTrespondents, we reject the null of no difference at the 10% level for both the lower and upper
123

484 J. Cook et al.
Table 3 Percent of respondents who said they would purchase a vaccine for themselves (BC), by price andtime to think
Matlab respondent BCGov’t service area US$0.15 US$0.37 US$0.74 US$1.1 US$4.5 US$9.0
NTTT—% yes 89 81 68*** 38 15 7
TTT—% yes 85 68 36 33 8 8
ICDDR-B area US$0.15 US$0.37 US$0.74 US$1.1 US$4.5 US$9.0
NTTT—% yes 65 65 54 67*** 22 13
TTT—% yes 78 59 50 31 10 13
Kolkata respondent BC
Cholera US$0.22 US$0.56 US$1.11 US$11.1
NTTT—% yes 89 68 63 18
TTT—% yes 82 60 49 18
Typhoid US$0.22 US$0.56 US$1.11 US$11.1
NTTT—% yes 91 86 63 20
TTT—% yes 88 69 52 9
GSA government service area; ICDDRB area served by ICDDR-B (see Islam et al. 2008 for more details).*, **, and *** refers to statistical significance at the 10, 5 and 1% levels of a difference using a two-tailedFisher’s exact test (for detailed test results, including p values as well as results from one-tailed Fisher’s exacttests and t tests, see Table A9 in the appendix)
Fig. 2 Percent of respondents in Kolkata who were certain that they would purchase the vaccine for them-selves, by price and time to think (from PC exercise)
bound when the cholera and typhoid data are pooled.10 The size of the uncertainty interval, orthe interval between the upper bound and lower bound, is also smaller for TTT respondents,
10 The p values for the pooled dataset are p = 0.058 for a difference in the distribution of lower bounds, andp = 0.03 for a difference in the distribution of lower bounds. For the cholera subsample only, p = 0.107
123

Giving Stated Preference Respondents “Time to Think” 485
Fig. 3 Percent of respondents in Hue (Vietnam), with and without time to think, who chose neither vaccine(18 tasks) (reprinted from Cook et al. 2007). Each data point reflects the answers of ∼132 respondents on eachtask (66 with time to think, and 66 without)
a result to which we return later in the paper. In Beira, the midpoint, lower bound and upperbound were all lower among TTT respondents who did the PC exercise after the CT questionon household demand (Appendix Table A6). The midpoint is 30% lower. For respondentswho did the PC exercise during the first interview, however, only the differences in midpointand upper bound are statistically significant, and the midpoint is 12% lower (and weaklystatistically significant). A Kolmogorov–Smirnov test on pooled Beira data rejects the nullhypothesis of no difference of both the lower and upper bounds at the 1% level.11
Finally, Figure 3 presents raw MDC responses in Vietnam. Because we used exactly thesame choice tasks in the NTTT and TTT subsamples, we are able to directly compare rawresponses. Each data point plotted in the graph reflects the percentage of respondents whosaid they would buy neither vaccine at the offered price in the task. The solid line denotesresponses where the percentage of respondents who said “neither” on a given card is exactlythe same. Points lying above this line indicate that a higher percentage of TTT respondentsbought “neither” vaccine than NTTT respondents. A higher percentage of TTT respondentsopted for “neither vaccine” in 16 of 18 choice tasks.
Although exact multivariate modeling specifications differed somewhat between fieldsites (see Cook et al. 2007; Lucas et al. 2007; Islam et al. 2008; Whittington et al. 2008 formore details), our approaches were similar. We analyzed respondent demand from the BCexercise (Kolkata and Matlab) using a probit model, and analyzed PC data using both OLSand an interval regression model (Cameron and Huppert 1989). We used a random-parame-ters logit model (RPL) for the MDC data in Hue. Our multivariate results confirm the pattern
Footnote 10 continued(lower bounds) and p = 0.894 (upper bounds). For the typhoid subsample only, p = 0.183 (lower bounds)and p = 0.017 (upper bounds).11 For the pooled dataset, p = 0.000 (lower bounds) and p = 0.000 (upper bounds). Among those who didthe PC exercise before the CT, p = 0.437 (lower bounds) and p = 0.045 (upper bounds). Among those whodid the PC exercise after the CT exercise, p = 0.000 (lower bounds) and p = 0.000 (upper bounds).
123

486 J. Cook et al.
Tabl
e4
Res
pond
enta
ndho
useh
old
will
ingn
ess-
to-p
ayes
timat
es(U
S$)
for
chol
era
and
typh
oid
vacc
ines
Res
pond
entW
TP
(mea
n[9
0%C
I])
Hou
seho
ldW
TP
(mea
n[9
0%C
I])
Kri
stro
mm
id-p
oint
(BC
)Pr
obit
(BC
)In
terv
al(P
C)
Mix
edlo
git(
MD
C)
Neg
ativ
ebi
nom
ial
coun
t(C
T)
Kol
kata
chol
era
NT
TT
5.2
[4.2
–6.2
]5.
4[4
.4–6
.3]*
2.7
[2.6
–2.9
]***
n/a
37[3
0–45
]
Kol
kata
chol
era
TT
T4.
6[3
.4–5
.7]
3.2
[2.3
–4.0
]2.
2[2
.1–2
.4]
n/a
28[2
3–35
]
%re
duct
ion
1241
1922
Kol
kata
typh
oid
NT
TT
5.5
[4.5
–6.6
]5.
4[4
.6–6
.2]*
2.8
[2.5
–3.1
]***
n/a
31[2
6–36
]
Kol
kata
typh
oid
TT
T3.
9[3
.0–4
.8]
3.7
[3.0
–4.4
]2.
0[1
.8–2
.2]
n/a
23[2
0–27
]
%re
duct
ion
2931
2823
Bei
rach
oler
aN
TT
Tn/
an/
a0.
76[0
.74–
0.78
]***
n/a
11[1
0–12
]***
Bei
rach
oler
aT
TT
n/a
n/a
0.54
[0.5
2–0.
56]a
n/a
7.2
[6.5
–8.0
]
%re
duct
ion
3226
Mat
lab
(gov
tare
a)ch
oler
aN
TT
T2.
3[1
.7–2
.9]
2.5
[2.1
–2.9
]*n/
an/
a13
[12–
15]*
*
Mat
lab
(gov
tare
a)ch
oler
aT
TT
1.5
[1.0
–2.0
]1.
1[0
.5–1
.8]
n/a
n/a
8.7
[7.6
–9.8
]
%re
duct
ion
3554
34
Mat
lab
(IC
DD
RB
)cho
lera
NT
TT
3.3
[2.1
–4.5
]2.
0[1
.2–2
.8]
n/a
n/a
11[9
.0–1
2]**
Mat
lab
(IC
DD
RB
)cho
lera
TT
T1.
6[1
.1–2
.2]
0.6
[0.0
–1.3
]n/
an/
a6.
9[5
.9–8
.0]
%re
duct
ion
5068
34
Hue
chol
era
NT
TT
bn/
an/
an/
a1.
9[−
0.1–
3.9]
n/a
Hue
chol
era
TT
Tn/
an/
an/
a−0
.09
[−0.
4–0.
2]n/
a
%re
duct
ion
105
123

Giving Stated Preference Respondents “Time to Think” 487
Tabl
e4
cont
inue
d
Res
pond
entW
TP
(mea
n[9
0%C
I])
Hou
seho
ldW
TP
(mea
n[9
0%C
I])
Kri
stro
mm
id-p
oint
(BC
)Pr
obit
(BC
)In
terv
al(P
C)
Mix
edlo
git(
MD
C)
Neg
ativ
ebi
nom
ial
coun
t(C
T)
Hue
typh
oid
NT
TT
n/a
n/a
n/a
4.4
[1.8
–7.0
]n/
a
Hue
typh
oid
TT
Tn/
an/
an/
a1.
7[0
.2–3
.2]
n/a
%re
duct
ion
60
*,**
,and
***
refe
rto
diff
eren
ces
inm
ean
WT
Pw
hich
are
stat
istic
ally
sign
ific
anta
tthe
10,5
,and
1%le
vels
.aE
stim
ates
show
nfo
rth
eB
eira
subs
ampl
eav
erag
esto
geth
erth
egr
oups
who
did
the
“tra
ffic
light
”ex
erci
seaf
ter
the
sing
le-p
rice
hous
ehol
dqu
estio
nan
dvi
ce-v
ersa
(i.e
grou
ps“T
L1”
and
“TL
2”).
bT
heef
fect
iven
ess
and
dura
tion
ofth
eva
ccin
eof
fere
dto
resp
onde
nts
inH
ueva
ried
.Res
ults
here
are
for
the
char
acte
rist
ics
mos
tsim
ilar
toth
ere
al“n
ext-
gene
ratio
n”va
ccin
e:50
%ef
fect
ive
for
3ye
ars
for
chol
era,
and
70%
effe
ctiv
efo
r3
year
sfo
rty
phoi
d
123

488 J. Cook et al.
seen in the raw data (the full results are available in Table A1–A5 in the appendix). Aftercontrolling for a number of covariates for vaccine demand, a dummy variable for whether arespondent was given time to think was negative and statistically significant in all models,including probit, OLS, interval regression, and RPL models of respondent demand.
We find that mean respondent willingness-to-pay is consistently lower in the TTT subs-amples (Table 4). Estimates from the nonparametric Kristrom midpoint model as well asparametric model estimates (probit, interval, OLS and RPL) consistently show these reduc-tions. The smallest difference in WTP is for cholera respondents in Kolkata using the Kristromestimator of mean WTP (12% less). This is largely driven by the fact that the percentage ofcholera respondents who said they would buy a vaccine for themselves was very similarat the highest price in the two subsamples (Table 3). The largest difference in WTP is fordemand for cholera vaccines in Hue from the MDC exercise. (In fact, the RPL model predictsa negative mean WTP for a cholera vaccine that is 50% effective for 3 years, leading to a verylarge difference between the NTTT and TTT subsamples. This negative WTP estimate isdriven by a large coefficient on vaccine effectiveness in the model; respondents were shownvaccines with 50, 70, and 99% effectiveness and valued increasing effectiveness highly. Wepresent in Table 4 the WTP for a 50% effective vaccine because that is the best estimate of theeffectiveness of the real next-generation cholera vaccine). A simple average of the percentreduction in all respondent WTP estimates in Table 4, not weighted by sample size, is 41%.Omitting the 105% reduction from Hue, the average reduction in WTP is 36%.
The differences are not, however, all statistically significant. We construct CIs for theKristrom WTP around standard errors calculated using the method in Vaughan and Rodriguez(2001). None of the differences in Kristom WTP are statistically significant (90% CIs over-lap). We use a simulation approach to calculate CIs around mean WTP calculated from theprobit model;12 90% intervals do not overlap in Kolkata and in Matlab’s government servicearea, though they do (barely) for the ICDDRB study area.13 Difference in mean WTP is,however, statistically significant for PC responses in both Kolkata and Beira. In additionto differences in predicted WTP from the interval regression models,14 a two-sided t testshows a statistically significant difference at the 10% level in the midpoint of the uncertaintyinterval from the PC exercise for cholera in Beira and typhoid in Kolkata, although not forcholera in Kolkata (see Table A6 in the appendix). WTP distributions from the RPL modelsin Hue were not statistically different.15
12 These distributions were calculated in Stata by drawing 10,000 sets of coefficient estimates from a multi-variate normal distribution with means set to the vector of parameter coefficients estimated by the probit modeland the covariance structure set to the model’s estimated variance-covariance matrix. WTP was then calculatedfor each draw at the sample means of independent variables. The empirical distribution of those 10,000 WTPestimates provides the 90% confidence intervals shown. A similar approach was used for confidence intervalsof household WTP from the negative binomial model.13 Because our simulation approach (for probit and negative binomial) draws the WTP estimates for NTTTand TTT from the same underlying model, the covariance of the two measures is likely nonzero, so non-over-lapping confidence intervals are not equivalent to a statistically-significant difference.14 The prediction from the interval model is the estimate of mean WTP, so here we simply predict WTP forthe NTTT and TTT subsamples separately, constructing confidence intervals using Stata’s post-estimate “ci”command. See Table 4.15 Because we used a mixed logit-hierarchical Bayes approach, we were able to estimate an individual-levelWTP estimate for each of the 200 NTTT respondents and 200 TTT respondents. The confidence intervals inTable 4 are constructed around empirical standard errors among each of the subsamples (i.e standard devia-tion/sqrt(200)). We tested statistical significance with a two-tailed t test comparing the 200 NTTT and 200TTT WTP estimates.
123
Giving Stated Preference Respondents “Time to Think” 489
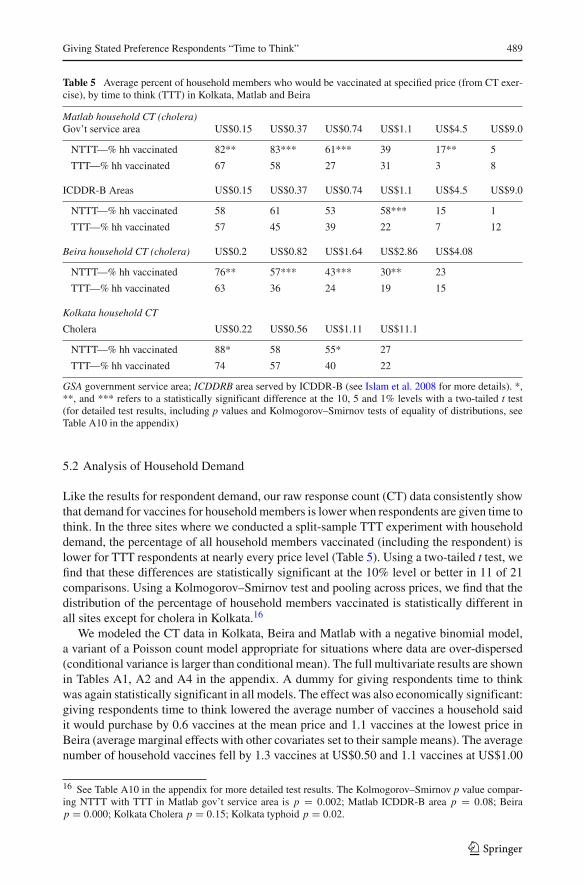
Table 5 Average percent of household members who would be vaccinated at specified price (from CT exer-cise), by time to think (TTT) in Kolkata, Matlab and Beira
Matlab household CT (cholera)Gov’t service area US$0.15 US$0.37 US$0.74 US$1.1 US$4.5 US$9.0
NTTT—% hh vaccinated 82** 83*** 61*** 39 17** 5
TTT—% hh vaccinated 67 58 27 31 3 8
ICDDR-B Areas US$0.15 US$0.37 US$0.74 US$1.1 US$4.5 US$9.0
NTTT—% hh vaccinated 58 61 53 58*** 15 1
TTT—% hh vaccinated 57 45 39 22 7 12
Beira household CT (cholera) US$0.2 US$0.82 US$1.64 US$2.86 US$4.08
NTTT—% hh vaccinated 76** 57*** 43*** 30** 23
TTT—% hh vaccinated 63 36 24 19 15
Kolkata household CT
Cholera US$0.22 US$0.56 US$1.11 US$11.1
NTTT—% hh vaccinated 88* 58 55* 27
TTT—% hh vaccinated 74 57 40 22
GSA government service area; ICDDRB area served by ICDDR-B (see Islam et al. 2008 for more details). *,**, and *** refers to a statistically significant difference at the 10, 5 and 1% levels with a two-tailed t test(for detailed test results, including p values and Kolmogorov–Smirnov tests of equality of distributions, seeTable A10 in the appendix)
5.2 Analysis of Household Demand
Like the results for respondent demand, our raw response count (CT) data consistently showthat demand for vaccines for household members is lower when respondents are given time tothink. In the three sites where we conducted a split-sample TTT experiment with householddemand, the percentage of all household members vaccinated (including the respondent) islower for TTT respondents at nearly every price level (Table 5). Using a two-tailed t test, wefind that these differences are statistically significant at the 10% level or better in 11 of 21comparisons. Using a Kolmogorov–Smirnov test and pooling across prices, we find that thedistribution of the percentage of household members vaccinated is statistically different inall sites except for cholera in Kolkata.16
We modeled the CT data in Kolkata, Beira and Matlab with a negative binomial model,a variant of a Poisson count model appropriate for situations where data are over-dispersed(conditional variance is larger than conditional mean). The full multivariate results are shownin Tables A1, A2 and A4 in the appendix. A dummy for giving respondents time to thinkwas again statistically significant in all models. The effect was also economically significant:giving respondents time to think lowered the average number of vaccines a household saidit would purchase by 0.6 vaccines at the mean price and 1.1 vaccines at the lowest price inBeira (average marginal effects with other covariates set to their sample means). The averagenumber of household vaccines fell by 1.3 vaccines at US$0.50 and 1.1 vaccines at US$1.00
16 See Table A10 in the appendix for more detailed test results. The Kolmogorov–Smirnov p value compar-ing NTTT with TTT in Matlab gov’t service area is p = 0.002; Matlab ICDDR-B area p = 0.08; Beirap = 0.000; Kolkata Cholera p = 0.15; Kolkata typhoid p = 0.02.
123
490 J. Cook et al.
in Matlab. Similarly, we find total household WTP is consistently lower among those giventime to think (Table 4). A simple average of the percent reduction in all household WTPestimates in Table 4, not weighted by sample size, is 28%. We use a simulation approach(identical to the one described above for the probit model) to calculate confidence intervalsaround mean WTP calculated from the negative binomial model. 90% confidence intervalsdo not overlap in Beira and Matlab, though they do in Kolkata.
5.3 Interactions of Time to Think with Bid Prices, Income and Education
To test whether time to think had a differential effect on respondents who were randomlyassigned higher bid prices, we interacted the offered hypothetical price with time to thinkand re-ran the probit and negative binomial models. The interaction term was negative andsignificant in models of Kolkata and Beira household demand, but was not statistically sig-nificant for Kolkata respondent demand, Matlab respondent demand and Matlab householddemand. We also interacted time to think with income, both continuous income and incomequartile dummies. These interaction terms were only significant for household demand inBeira: an interaction with the highest income quartile and time to think was positive (0.69)and statistically-significant at the 5% level. Finally, we interacted time to think with dummyvariables for education levels in respondent and household models. In Matlab, the interactionswere positive and statistically significant for having either an education level of 1–9 yearsor having 12 years or vocational training. This would suggest that, compared to respondentswith no formal schooling who were also given TTT, respondents with intermediate levels ofeducation said they would purchase more vaccines for household members if given time tothink. They were not statistically-significant in the other models.
5.4 Certainty and Preference Errors
We find evidence that providing time to think increases the certainty that respondents have intheir responses. In Kolkata, 86% of TTT respondents felt “very certain” about their answerabout buying a cholera vaccine for themselves, compared to 68% of NTTT respondents. Thisdifference was statistically significant at the 1% level (paired t test). There was, however, nostatistical difference in certainty among respondents who were asked about a typhoid vaccine.In Beira, 75% of the “uncertain” respondents were in the NTTT subsample. Giving TTT alsoreduced the length of the uncertainty interval from the PC exercise for the respondents inBeira and the cholera typhoid respondents in Kolkata (see Table A3 and A6 in the appen-dix). We re-ran all the multivariate models of respondent demand (probit) and householddemand (negative binomial) dropping a) all respondents who reported being “uncertain” andb) all respondents who reported being “uncertain” or “somewhat uncertain”.17 In all cases,a dummy variable for TTT was still statistically significant and negative. In most cases, themagnitude of the coefficient actually increased when we dropped uncertain respondents (seeTable A7 in appendix).
We also found from the MDC data in Hue that giving TTT reduced the number of respon-dents who made preference errors (violations of stability, monotonicity, or transitivity). Of the200 respondents in NTTT subsample, 22 (11%) made some type of preference errors. Four-
17 In Beira, respondents were not asked how certain they were about the number of vaccines they wantedto purchase for other household members, but rather how confident they were that they could afford thatnumber. This is a different question, so we did not test for the effect of dropping uncertain respondents onBeira household demand.
123

Giving Stated Preference Respondents “Time to Think” 491
05
1015
20
Per
cent
0 50 100 150
Time spent thinking about tasks (mins)
Fig. 4 Amount of time that time-to-think respondents reported spending on the task, all four sites pooled(n = 1,449). The rightmost bar collapses all times longer than 150 min
teen of 200 (7%) respondents in the TTT subsample made a preference error, a statisticallysignificant difference (one-tailed t test, p = 0.05). Furthermore, when NTTT respondentswere given the opportunity to revise their answers overnight, their revised responses showedfewer preference errors and were no longer statistically different than the TTT responses.A probit model confirmed that giving TTT reduced the probability of making a preferenceerror (at the 10% level). When TTT was interacted with education, the model showed thatTTT reduced preference errors in respondents with secondary school education by 35% butonly 6% for respondents with a primary school education. All TTT variables and interactionterms were highly significant in this interaction model.
5.5 Debriefing Questions: Time Spent Thinking and Discussion with Others
Most respondents who were given the opportunity to think about the valuation question didso. In Vietnam, Kolkata, Matlab and Beira, only 2, 11, 5, and 5% of TTT respondents respec-tively reported spending no time on the task. Figure 4 shows the distribution of time spentthinking across all four sites, with a significant fraction reporting either 30 min or 1 h. Theaverage time spent across all four sites was 37 min, with a median of 20 min (Table 6).
A strong majority in all four sites reported discussing the decision with their spouse(Table 6); across all four sites, 69% of respondents consulted with their spouse. Fewer con-sulted with someone outside the household (23% across all sites), and, in Kolkata and Hue,even fewer reported using other information (we did not ask questions about use of otherinformation in Beira and Matlab).
We used these debriefing questions to explore which elements of the time-to-think pro-tocol might be influencing responses. First, we replaced the continuous variable of minutesspent thinking (imputing a zero for all NTTT respondents) for the time-to-think dummyvariable in the multivariate models of respondent and household demand. We did not finda statistically significant relationship between minutes spent on the task and responses tothe BC question (probit models). We did find that more minutes spent thinking lowered thenumber of vaccines purchased for the household in Kolkata and Matlab (though not in Beira)and lowered the midpoint of the uncertainty interval in OLS models of respondent demand
123

492 J. Cook et al.
Table 6 Debriefing questions for time to think respondents
Kolkata Hue Beira Matlab All sites
Time spent thinkingMean (SD)a 28 (37) 32(38) 52 (52) 30 (35)b 37 (43)
Mediana 15 20 30 20 20
Percent who consultedwith a householdmember
74 56 81 64 69
Percent whoconsulted withsomeone outside thehousehold
25 4 36 27 23
Percent who usedotherinformation
6 2 n/a n/a 3
N 272 400 487 279 1,438
a Drops 11 records where reported time spent thinking was over 5 h, including one respondent who reportedthinking about the task for 24 hb This data based on n = 436 for this question in Beira
from the PC exercise in Kolkata. We also explored whether, among only TTT respondents,those who spent longer on the task reported lower respondent or household demand. We didnot find any statistically significant relationships.
Next, we added a variable tracking whether the respondent had discussed the questionwith anyone inside or outside the household along with the TTT dummy.18 Since such a highpercentage of TTT respondents reported discussing the decision (and because NTTT respon-dents did not by definition have this opportunity to discuss), this analysis does not have muchstatistical power. The coefficient on discussion was generally positive while the TTT dummyvariable became more negative, suggesting that discussing the decision with someone actu-ally increased respondent and household demand and counter-balanced other elements ofTTT which reduced demand. None of the discussion coefficients, however, were statisticallysignificant. A parallel approach examined responses among only the TTT subsample. Herethe coefficient on discussion was positive in seven of nine models, and statistically significantat the 10% level in two models (Kolkata probit and OLS). Finally, we looked at the effectof TTT among only those respondents who did not discuss the decision (dropping the TTTrespondents who said they conferred). The coefficient on the TTT dummy remained nega-tive, statistically significant, and generally had a higher magnitude than the models includingthose TTT respondents who did discuss the decision. Interested readers can find the resultson discussion in Table A8 of the appendix.
6 Discussion
In summary, we find that giving respondents overnight to think about their responses hasa large and consistent effect across all four study sites. This was true for both the BC andMDC methods. Time-to-think lowered the percentage of respondents who said they would
18 We also replaced the TTT dummy with this discussion dummy, and found consistent effects on the negativebinomial models in all sites, but mixed significance for the respondent data (see “Model B” in Table A8).
123

Giving Stated Preference Respondents “Time to Think” 493
purchase a cholera or typhoid vaccine for themselves across a range of bid prices, andlowered the percentage of household members for whom the respondent said they wouldpurchase a vaccine. It decreased average response WTP by 41% and household WTP by28%, though the differences were not all statistically significant. It reduced the likelihoodthat a MDC respondent made a preference error. We find that, given the opportunity, over halfof respondents consulted with their spouse about their vaccine purchase decision, and spent20–30 min thinking about the decision. We also find suggestive evidence that consultationwith others actually increased demand for vaccines, counteracting other components of TTTwhich reduced demand.
In most cases, time-to-think also increased the certainty that respondents had in theiranswers. Our result stands in contrast to Macmillan et al. (2002), who find that respondentswho were given time and who completed a group elicitation approach were less certain thanrespondents who completed the survey in one session individually. Group interactions, how-ever, could have been the driver of increased uncertainty in Macmillan et al. (2002) results,rather than the effect of time to think. Our finding is similar, however, to Svedsater (2007),who found that TTT reduced respondents’ uncertainty. Comparing real versus hypotheti-cal (stated) purchases of a diabetes management program, Blumenschein et al. (2008) findthat dropping respondents who said they were less than “absolutely sure” from the analysisreduced nearly all of the gap between real and hypothetical choice (a standard cheap talkscript had no significant effect). We find that our TTT treatment effect remains, however,even after we similarly drop respondents who are “uncertain” or “somewhat certain” of theiranswers.
One limitation of our study is that although we speculate the reduction in WTP is a reduc-tion in “hypothetical bias”, we do not test for hypothetical bias directly. We only offeredrespondents hypothetical vaccines and were unable to give a comparison group the opportu-nity to buy the real vaccine. A more direct test of the effect of time-to-think in a real versushypothetical laboratory experiment would be useful. A second limitation, noted above, isthat stated preference surveys for private goods may have higher levels of hypothetical biasthan those for public goods. Respondents may say yes in order to increase the probability ofthe hypothetical product being provided in the marketplace. It is possible that TTT has theeffect of reducing this potential inherent bias in using SP to elicit demand for hypotheticalprivate goods, and may not be more generally applicable to public good contexts.
Why have so few TTT studies been conducted? For many researchers who are aware ofthe TTT protocol, the first response to this question may be cost. In-person stated prefer-ence surveys are already expensive endeavors. Most of this expense derives from the factthat skilled interviewers must be employed and respondents compensated for their time incompleting the interview. Although there is a substantial fixed cost to developing the sur-vey instrument and training enumerators, adding a second follow-up interview will certainlyincrease survey expenses. It is also probably no coincidence that all existing time to thinkstudies have been conducted in developing countries where the cost of implementing a high-quality stated preference survey is much lower because both interviewer salaries and anyhousehold compensation are much lower than in industrialized countries. Here is anotherway of viewing this dilemma: for the same total cost, a researcher might implement a TTTstudy but be forced to reduce the sample size. The researcher might then be concerned withthe decrease in statistical precision surrounding estimation of WTP. This should be weighedagainst the risk (for policy analysis) that welfare estimates from conventional single-visitsurvey methodologies might be 30–40% too high.
Conducting a survey with a time-to-think protocol is also logistically complicated. Asdescribed earlier, the study in Kolkata interviewed households in one of the poorest slums
123

494 J. Cook et al.
in Kolkata called Tiljala. Because of safety concerns (our interviewers were not comfort-able interviewing households after dark, and there was a large riot during our fieldwork), wedecided to finish the survey work quickly and did not give respondents time to think. To avoidthe potential for strategic bias and for households to receive prior (and unobserved) informa-tion about the survey from their neighbors, we also completed the sites where respondentswere given no time to think first and then completed interviews with the TTT subsample.This sort of logistical problem, however, exists for all split-sample studies, and might be lessof a concern for studies in which all respondents are given time to think (though researchersmay still want to ask households if they have heard about the study and what informationthey have already learned).
Another reason why time-to-think designs are still rare may be the fact that in-personinterviews for valuation work in industrialized countries are now the exception rather thanthe norm. The need for such a design decreases considerably for more commonly used mailsurveys, which allow respondents to reflect longer on their choices. For other survey modes inwhich response rates and selection problems are a major concern, such as telephone surveys,it may be even more difficult to contact respondents multiple times. Researchers would havedifficulty in estimating population WTP if a sizeable number of respondents completed onlythe first half of the interview. We did not find this type of sample selection problem in ourfour TTT studies.19 Representative Internet panels are also increasingly being used in devel-oped countries. They have the flexibility to allow respondents time to reflect, though we areunaware of any internet-mode studies that have examined the role of reflection specifically.
Acknowledgments We would like to thank the International Vaccine Institute and its director John Clemens,along with a number of the DOMI project staff, including Jacqueline Deen, Lorenz von Seidlein, R. LeonOchiai, and Andrew Nyamete. We are also thankful for the assistance of our partners in each of the four coun-tries, including: India’s NICED (Dr. Susmita Chatterjee, Dr. S. K. Bhattacharya, and Dr. Dipika Sur), Viet-nam’s NIHE (Dr. Do Gia Cahn), Mozambique’s Center for Environmental Hygiene and Medical Examination(Dr. Marcelino Lucas, Dr. Avertino Barreto, Dr. Francisco Songane, Arnaldo Cumbane, Arminda Macamuale,and Nivalda Nazaro) and Bangladesh’s ICDDR-B (Dr. Ziaul Islam). All four country studies were fundedwith support from the Bill and Melinda Gates Foundation. We thank the Associate Editor Christian Vosslerfor very helpful and detailed suggestions that have demonstrably improved the paper, as well as Sonia Akterand two anonymous reviewers for thoughtful comments and suggestions.
References
Alvarez-Farizo B, Hanley N (2006) Improving the process of valuing non-market benefits: combining citizens’juries with choice modelling. Land Econ 82(3):465–478
Blumenschein K, Blomquist GC, Johannesson M, Horn N, Freeman P (2008) Eliciting willingness to paywithout bias: evidence from a field experiment. Econ J 118(525):114–137
Brouwer R, Akter S, Brander L, Haque E (2008) Economic valuation of flood risk exposure and reduction ina severely flood prone developing country. Environ Dev Econ 14:397–417
Cameron TA, DeShazo JR (2010) Differential attention to attributes in utility-theoretic choice models. J ChoiceModel 3(3):73–115
Cameron TA, Huppert DD (1989) OLS versus ML estimation of non-market resource values with paymentcard interval data. J Environ Econ Manag 17(3):230–246
Canh DG, Whittington D, Thoa LTK, Utomo N, Hoa NT, Poulos C, Thuy DTD, Kim D, Nyamete A (2006)Household demand for typhoid fever vaccines in Hue, Vietnam. Health Policy Planning 21(3):241–255
Carlsson F (2010) Design of stated preference surveys: is there more to learn from behavioral economics?.Environ Resour Econ 46(2):167–177
19 In Kolkata, Matlab and Vietnam all TTT respondents completed the second interview at least through themain valuation questions (and nearly all completed the whole survey). In Beira, all TTT respondents began asecond interview, though one did not complete the main valuation questions.
123

Giving Stated Preference Respondents “Time to Think” 495
Carson R, Groves T (2007) Incentive and informational properties of preference questions. Environ ResourEcon 37(1):1502–1573
Carson RT, Hanemann WM, Kopp RJ, Krosnick JA, Mitchell RC, Presser S, Ruud PA, Smith VK, Conaway M,Martin K (1997) Temporal reliability of estimates from contingent valuation. Land Econ 73(2):151–163
Carson RT, Louviere JJ (2011) A common nomenclature for stated preference elicitation approaches. EnvironResourc Econ 49(4):539–559
Cook J, Jeuland M, Maskery B, Lauria D, Sur D, Clemens J, Whittington D (2009) Re-visiting socially-optimalvaccine subsidies: an empirical application in Kolkata, India. J Policy Anal Manag 28(1):6–28
Cook J, Jeuland M, Whittington D, Poulos C, Clemens J, Sur D, Anh DD, Agtini M, Bhutta Z, DTES Group(2008) The cost-effectiveness of typhoid Vi vaccination programs: calculations for four urban sites infour Asian countries. Vaccine 26:6305–6316
Cook J, Sur D, Clemens J, Whittington D (2009) Evaluating investments in typhoid vaccines in two slums inKolkata, India. J Health Popul Nutr 27(6):711–724
Cook J, Whittington D, Canh DG, Johnson FR, Nyamete A (2007) The reliability of stated preferences forcholera and typhoid vaccines with time to think in Hue, Vietnam. Econ Inq 45(1):100–114
Delavande A, Giné X, McKenzie D (2010) Measuring subjective expectations in developing countries: acritical review and new evidence. J Dev Econ 94(2):151–163
Griffin CC, Briscoe J, Singh B, Ramasubban R, Bhatia R (1995) Contingent valuation and actual behav-ior: predicting connections to new water systems in the state of Kerala, India. World Bank Econ Rev9(3):373–395
Harrison GW (2006) Experimental evidence on alternative environmental valuation methods. Environ ResourEcon 34:125–162
Islam Z, Maskery B, Nyamete A, Horowitz M, Yunus M, Whittington D (2008) Private demand for choleravaccines in rural Matlab, Bangladesh. Health Policy 85(2):184–195
Jeuland M, Clemens J, Cook J, Whittington DDCES Group (2009) Incorporating herd protection into cost-effectiveness calculations of new-generation oral cholera vaccines: a multi-site analysis. Value Health12(6):899–908
Jeuland M, Lucas M, Clemens J, Whittington D (2009) A cost-benefit analysis of cholera vaccination programsin Beira, Mozambique. World Bank Econ Rev 23(2):235–267
Jeuland M, Lucas M, Deen J, Lazaro N, Whittington D (2009) Estimating the private benefits of vaccinationagainst cholera in Beira, Mozambique: a travel cost approach. J Dev Econ 91:310–322
Jones-Lee MW, Hammerton M, Phillips PR (1985) The value of safety: results of a national sample survey.Econ J 95(377):49–72
Kealy MJ, Dovidio JF, Rockel ML (1988) Accuracy in valuation is a matter of degree. Land Econ 64(2):158–173
Kealy MJ, Montgomery M, Dovidio JF (1990) Reliability and predictive validity of contingent values: doesthe nature of the good matter?. J Environ Econ Manag 19:244–263
Kim D, Canh DG, Poulos C, Thoa LTK, Cook J, Hoa NT, Nyamete A, Thuy DTD, Deen J, Trach DD,Clemens J, Thiem VD, Anh DD, Whittington D (2008) Private demand for cholera vaccines in Hue,Vietnam. Value Health 11(1):119–128
Labao R, Francisco H, Harder D, Santos F (2008) Do colored photographs affect willingness to pay responsesfor endangered species conservation?. Environ Resour Econ 40(2):251–264
Lauria DT, Maskery B, Poulos C, Whittington D (2009) An optimization model for reducing typhoid casesin developing countries without increasing public spending. Vaccine 27:1609–1621
Lauria DT, Whittington D, Choe K, Turingan C, Abiad V (1999) Household demand for improved sanitationservices: a case study of Calamba, Phillipines. In: Willis K, Bateman I (eds) Valuing environmentalpreferences: theory and practice of the contingent valuation method. Oxford University Press, Oxford,pp 540–584
Lienhoop N, Macmillan D (2002) Valuing wilderness in Iceland: new approaches in contingent valuation. IcelJ Geogr 18(19(1):29–40
Loomis JB (1989) Test-retest reliability of the contingent valuation method: a comparison of general populationand visitor responses. Am J Agric Econ 71(1):76–84
Loomis JB (1990) Comparative reliability of the dichotomous choice and open-ended contingent valuationtechniques. J Environ Econ Manag 18:78–85
Lucas M, Jeuland M, Deen J, Lazaro N, MacMahon M, Nyamete A, Barreto A, Seidlein LV, Cumbane A,Songane FF, Whittington D (2007) Private demand for cholera vaccines in Beira, Mozambique. Vaccine25(14):2599–2609
Macmillan DC, Philip L, Hanley N, Alvarez-Farizo B (2002) Valuing the non-market benefits of wild gooseconservation: a comparison of interview and group-based approaches. Ecol Econ 43:49–59
123

496 J. Cook et al.
Nabangchang O (2008) Mobilizing resources for marine turtle conservation in Asia: a cross-country perspec-tive. ASEAN Econ Bull 25(1):60–69
Reiling SD, Boyle KJ, Phillips ML, Anderson MW (1990) Temporal reliability of contingent values. LandEcon 66(2):128–134
Subade RF (2007) Mechanisms to capture economic values of marine biodiversity: the case of TubbatahaReefs UNESCO World Heritage Site, Philippines. Marine Policy 31(2):135–142
Svedsater H (2007) Ambivalent statements in contingent valuation studies: inclusive response formats andgiving respondents time to think. Aust J Agric Resour Econ 51(1):91–107
Teisl MF, Boyle KJ, McCollum DW, Reiling SD (1995) Test-retest reliability of contingent valuation withindependent sample pretest and posttest control groups. Am J Agric Econ 77:613–619
Vaughan WJ, Rodriguez DJ (2001) Obtaining welfare bounds in discrete-response valuation studies: comment.Land Econ 77(3):457–465
Welsh MP, Poe GL (1998) Elicitation effects in contingent valuation: comparisons to a multiple boundeddiscrete choice approach. J Envir Econ Manag 36(2):170–185
Whitehead J (2005) Environmental risk and averting behavior: predictive validity of jointly estimated revealedand stated behavior data. Environ Resour Econ 32(3):301–316
Whitehead JC, Hoban TJ (1999) Testing for temporal reliability in contingent valuation with time for changesin factors affecting demand. Land Econ 75(3):453–465
Whittington D, Lauria DT, Wright AM, Choe K, Hughes JA, Swarna V (1993) Household demand forimproved sanitation services in Kumasi, Ghana: a contingent valuation study. Water Resour Res29(6):1539–1560
Whittington D, Smith VK, Okorafor A, Okore A, Liu JL, McPhail A (1992) Giving respondents time to thinkin contingent valuation studies: a developing country application. J Environ Econ Manag 22:205–225
Whittington D, Sur D, Cook J, Chatterjee S, Maskery B, Lahiri M, Poulos C, Boral S, Nyamete A, DeenJ, Ochiai L, Bhattacharya SK (2008) Rethinking cholera and typhoid vaccination policies for the poor:private demand in Kolkata, India. World Dev 37(2):399–409
123