gis
DESCRIPTION
TRANSCRIPT

GEOGRAPHICAL
INFORMATION SYSTEM

An organized collection of computer hardware, software, Geographical data and personnel
designed to efficiently capture, store, update, manipulate, analyze & display all forms of
Geographically referenced information
GEOGRAPHIC INFORMATION SYSTEM

What is a GIS?
Geographic Information System
• “There are as many definitions as there are disciplines using a GIS”(Huxhold, 1991)
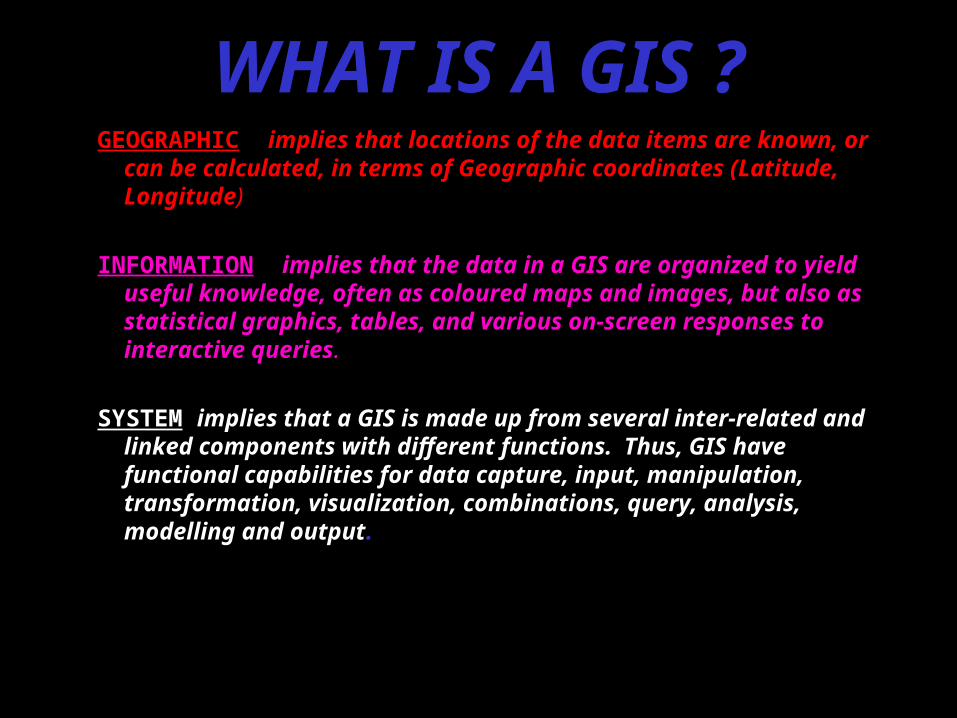
WHAT IS A GIS ?GEOGRAPHIC implies that locations of the data items are known, or can
be calculated, in terms of Geographic coordinates (Latitude, Longitude)
INFORMATION implies that the data in a GIS are organized to yield useful knowledge, often as coloured maps and images, but also as statistical graphics, tables, and various on-screen responses to interactive queries.
SYSTEM implies that a GIS is made up from several inter-related and linked components with different functions. Thus, GIS have functional capabilities for data capture, input, manipulation, transformation, visualization, combinations, query, analysis, modelling and output.

What is a GIS?A GIS is a database management system forspatially distributed features and the associated attributes.
• Spatial data capture• Management• Analysis• Display• Decision making• Research

GEOSPATIALDATA
USERS
COMPUTER SYSTEM
KEY COMPONENTS OF GISKEY COMPONENTS OF GIS
Hardware&SoftwareCapture, Storage, processing
Analysis, Display etc.,
Maps, Aerial photographs, SatelliteImages, Statistic Tables etc,
Design of Standards, Updating, Analysis and Implementations

*COMPUTERISED CARTOGRAPHY-- performing cartographic functions by means computer hardware and software
*CARTOGRAPHY -- art and science of map making
A map represents geographic features or other spatial phenomena by graphically conveying information aboutlocations and attributes
*MAP
•Map(graphic) information * only graphic data is available and retrieval * networks are not defined.•Map publication * spatial relationship not defined
Computer Assisted Mapping
INTRODUCTION
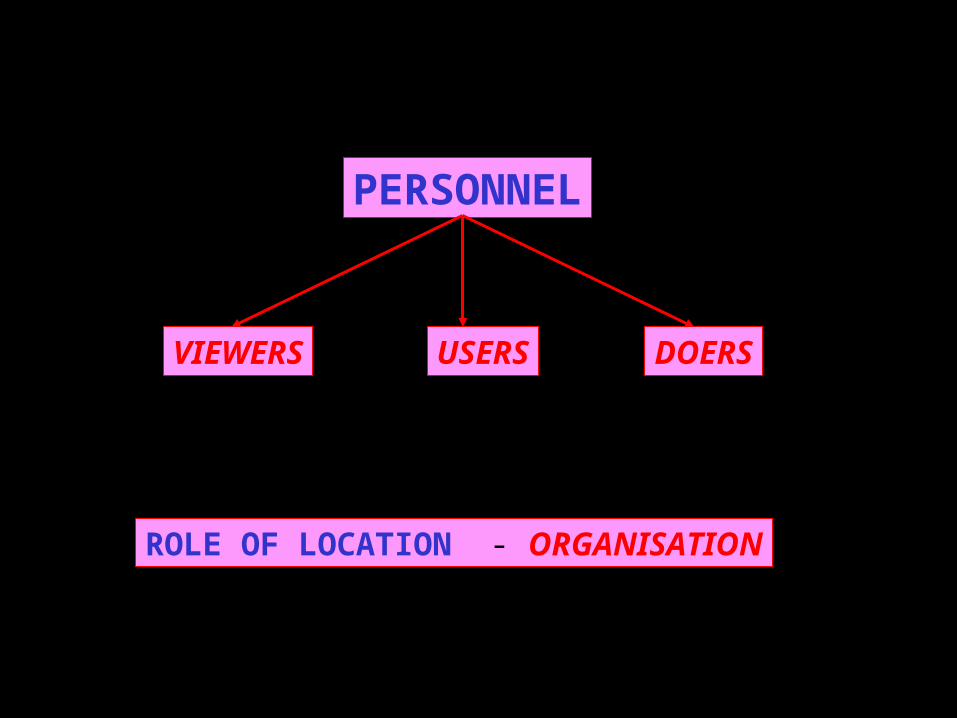
PERSONNEL
ROLE OF LOCATION - ORGANISATION
VIEWERS USERS DOERS

BASIC FUNCTIONS OF GISBASIC FUNCTIONS OF GIS
WHAT IS IT….?WHAT IS IT….?(LOCATIONS)(LOCATIONS)
JFM AREAJFM AREA
(X,Y)
WHERE IS IT ….?WHERE IS IT ….?(CONDITIONS)(CONDITIONS)
WITHIN THE WITHIN THE FOREST BLOCK FOREST BLOCK
HOW HAS IT HOW HAS IT CHANGED …?CHANGED …?(TRENDS)(TRENDS)
IMPROVEMENT INIMPROVEMENT INFOREST GROWTHFOREST GROWTHIN FIVE YEARSIN FIVE YEARS
WHICH DATA AREWHICH DATA ARERELATED ….?RELATED ….?(PATTERNS)(PATTERNS)
NEARESTNEARESTJFM VILLAGEJFM VILLAGE
WHAT IF….?WHAT IF….?(MODELS)(MODELS)
FINDING SOLUTIONS TO FINDING SOLUTIONS TO THE FORTH QUESTIONSTHE FORTH QUESTIONS

DATA
ATTRIBUTE DATA
SPATIAL DATA

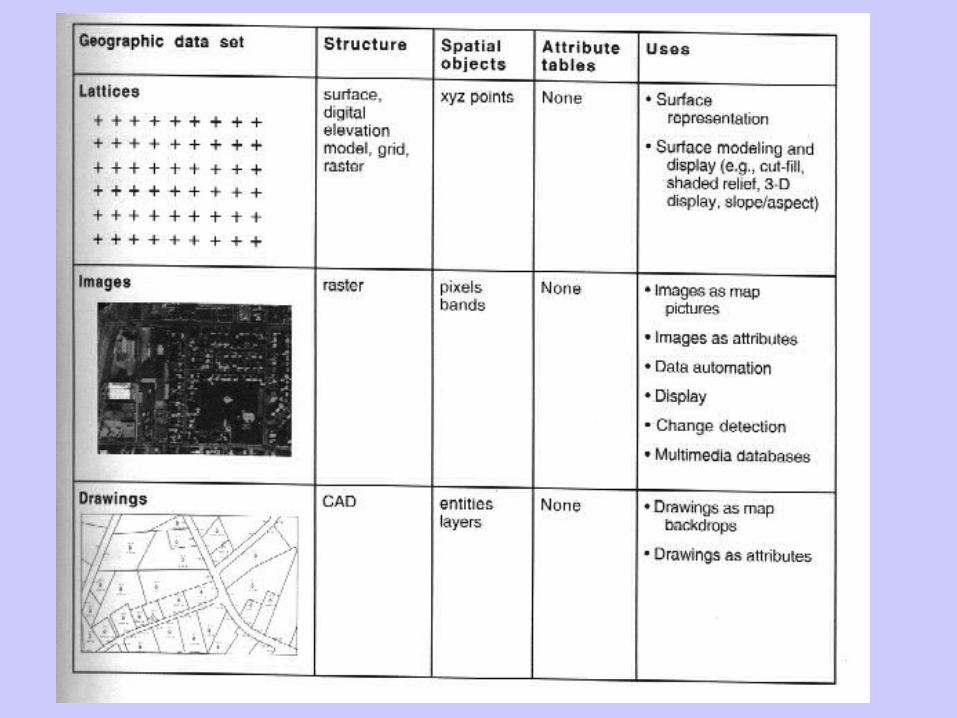
SPATIAL DATARaster
Vector
DATA MODEL AND STRUCTUREDATA MODEL AND STRUCTURE
RASTER MODELRASTER MODEL VECTOR MODELVECTOR MODEL

ADVANTAGES OF VECTOR MODELADVANTAGES OF VECTOR MODEL
• PRECISE EXPRESSIONPRECISE EXPRESSION• LESS DATA VOLUMELESS DATA VOLUME• FULL TOPOLOGYFULL TOPOLOGY• FAST RETRIEVALFAST RETRIEVAL• FAST CONVERSIONFAST CONVERSION
ADVANTAGES OF RASTER MODELADVANTAGES OF RASTER MODEL
• SIMPLE DATA STRUCTURESIMPLE DATA STRUCTURE• EASY FOR OVERLAY AND EASY FOR OVERLAY AND MODELLINGMODELLING• SUITABLE FOR 3D DISPLAYSUITABLE FOR 3D DISPLAY• INTEGRATION OF IMAGE DATAINTEGRATION OF IMAGE DATA• AUTOMATED DATA CAPTUREAUTOMATED DATA CAPTURE
DISADVANTAGES OF VECTOR MODELDISADVANTAGES OF VECTOR MODEL
• COMPLICATED STRUCTURECOMPLICATED STRUCTURE• DIFFICULTY IN OVERLAYDIFFICULTY IN OVERLAY• DIFFICULTY IN UPDATINGDIFFICULTY IN UPDATING• EXPENSIVE DATA CAPTUREEXPENSIVE DATA CAPTURE
DISADVANTAGES OF RASTER MODELDISADVANTAGES OF RASTER MODEL
• LARGE DATA VOLUMELARGE DATA VOLUME• LOW PRECISIONLOW PRECISION• DIFFICULTY IN NETWORK DIFFICULTY IN NETWORK ANAYLYSISANAYLYSIS• SLOW CONVERSIONSLOW CONVERSION

What Data is in Your GIS?
• What features do you map?
• What attributes do you need to collect data on?
• What attribute values can you give the attribute?

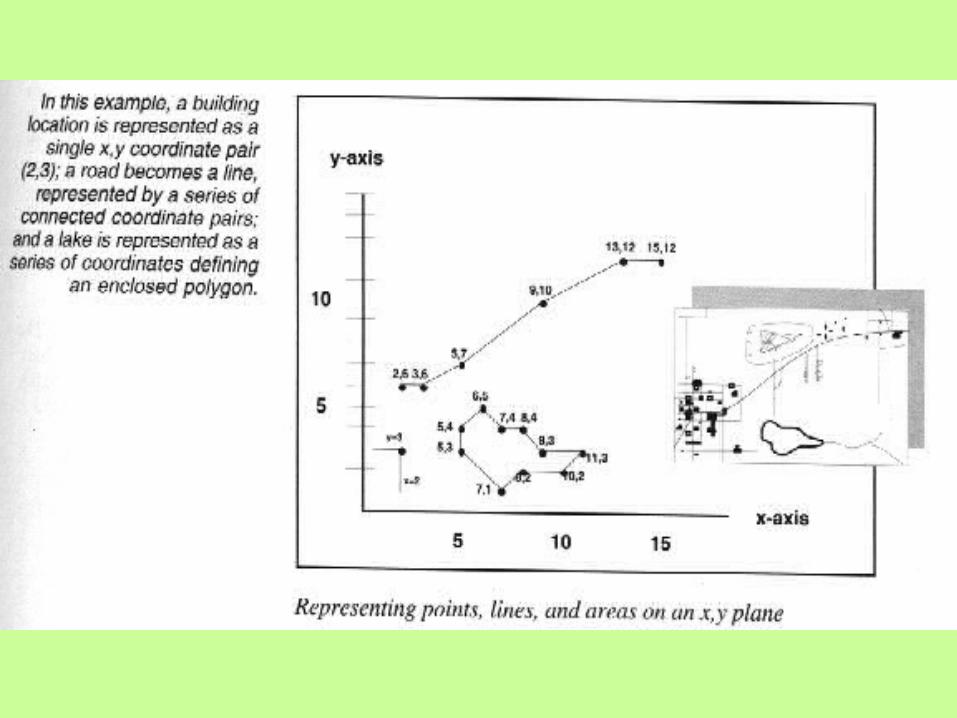
Point Features
Spatially distributed entities, activities orevents
• Points have a single geographic coordinate such as:– Tree– Traffic accident– Lamp post

Line Features
Spatially distributed entities, activities orevents
• Lines (Arcs) are a series of geographic coordinates joined to form a line such as:– Road– Stream – Railway

Area FeaturesSpatially distributed entities, activities orevents
• Areas (Polygons) are a series of geographic coordinates joined together to form a boundary such as: – Lake– Soil types

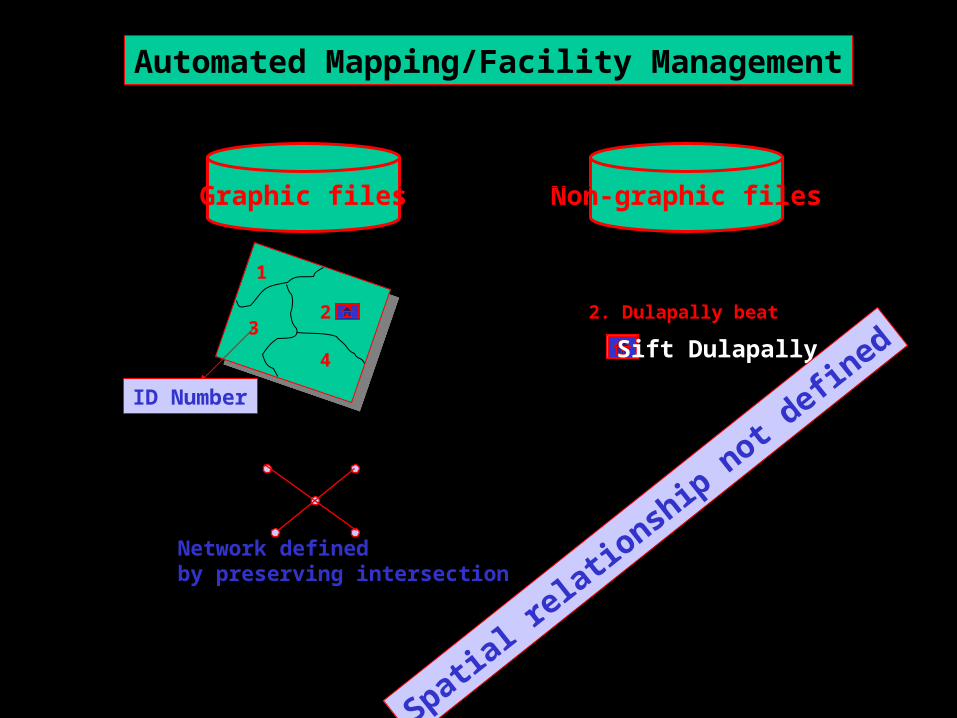
Automated Mapping/Facility Management
Graphic files Non-graphic files
1
23
4
2. Dulapally beat
Sift Dulapally
Network definedby preserving intersection
ID Number
Spatial r
elatio
nship not d
efined

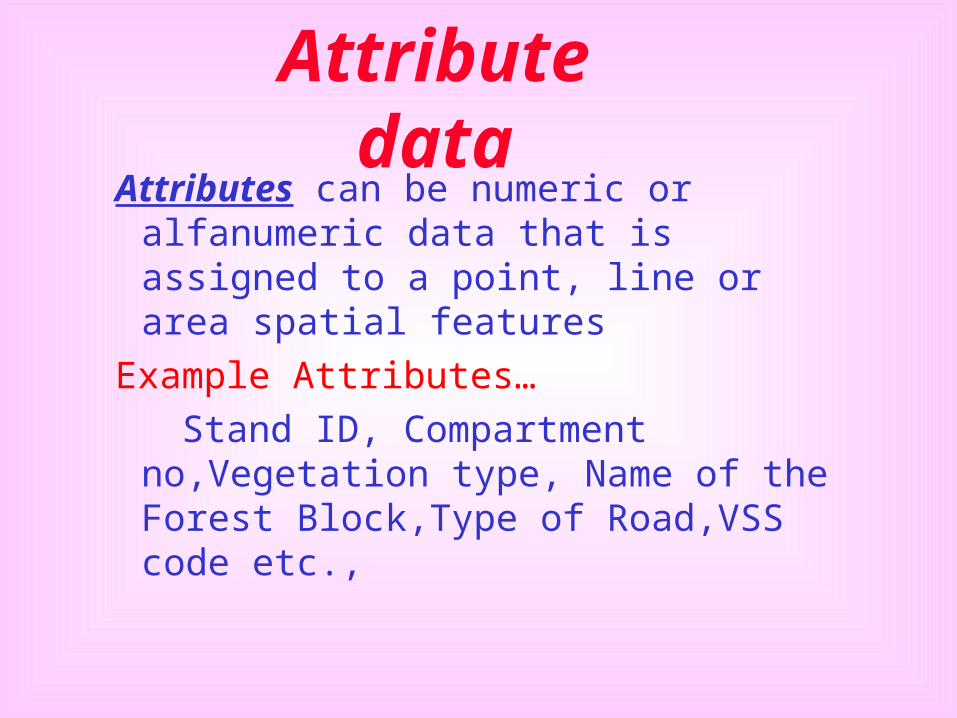
Attribute dataAttributes can be numeric or alfanumeric
data that is assigned to a point, line or area spatial features
Example Attributes…
Stand ID, Compartment no,Vegetation type, Name of the Forest Block,Type of Road,VSS code etc.,

Data Capture Sources
• Digitizing from paper maps
• Scanning
• Traditional surveying techniques
• Paper records & field notes
• Photogrammetry
• Remote sensing
• GPS
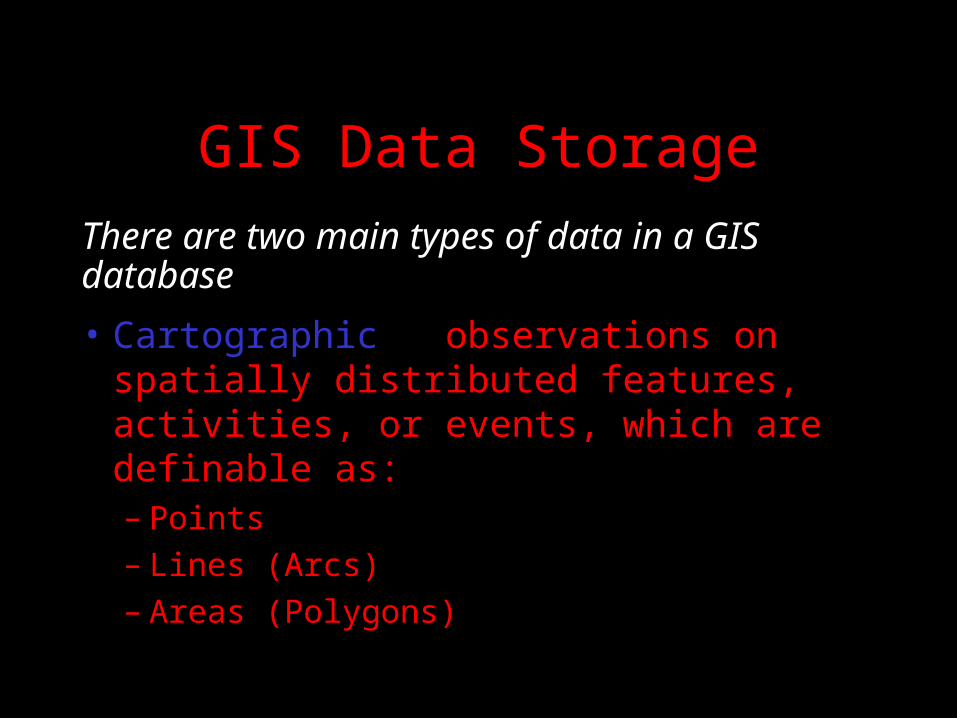
GIS Data Storage
There are two main types of data in a GISdatabase
• Cartographic - observations on spatially distributed features, activities, or events, which are definable as:– Points– Lines (Arcs)– Areas (Polygons)

GIS Data Storage
• Non-Cartographic - descriptive information in a database about the cartographic features located on a map.– Attributes– Attribute Values
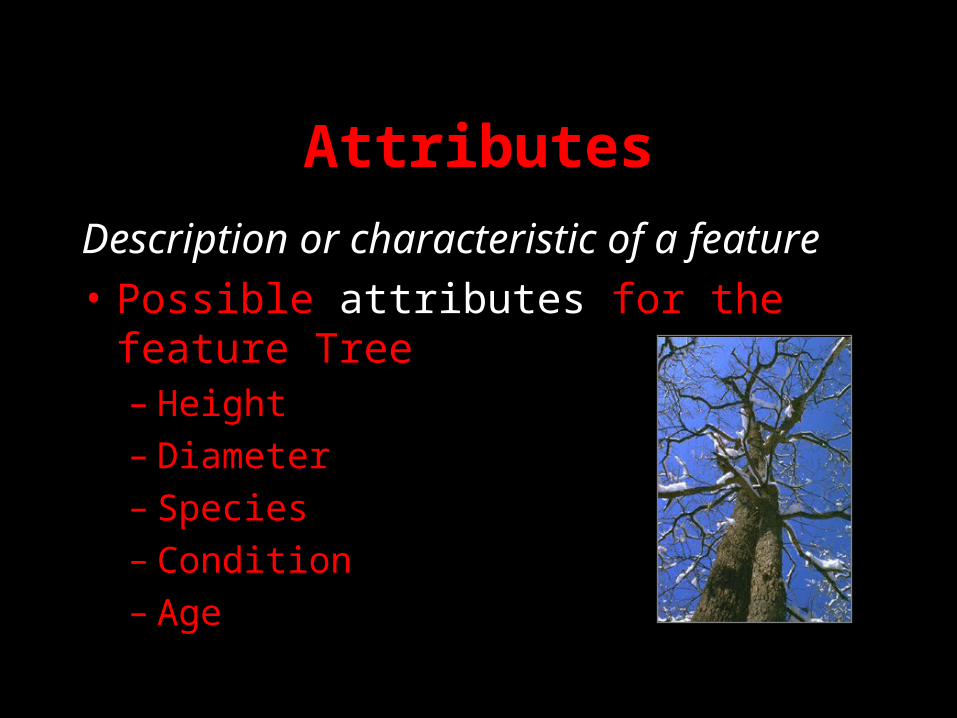
Attributes
Description or characteristic of a feature
• Possible attributes for the feature Tree– Height– Diameter– Species– Condition– Age
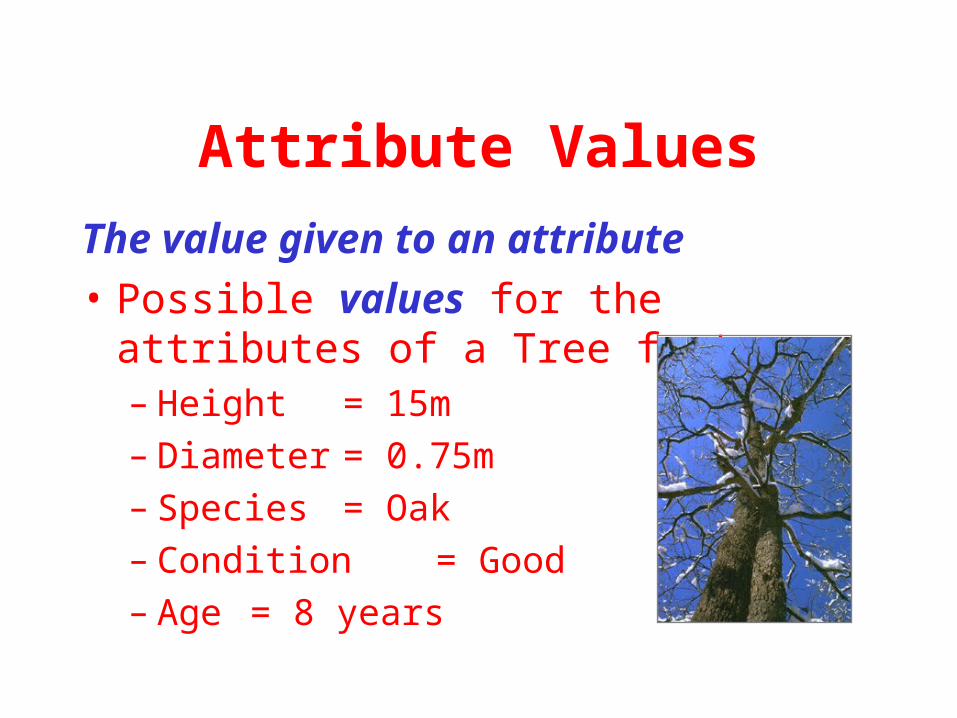
Attribute Values
The value given to an attribute
• Possible values for the attributes of a Tree feature– Height = 15m– Diameter = 0.75m– Species = Oak– Condition = Good– Age = 8 years
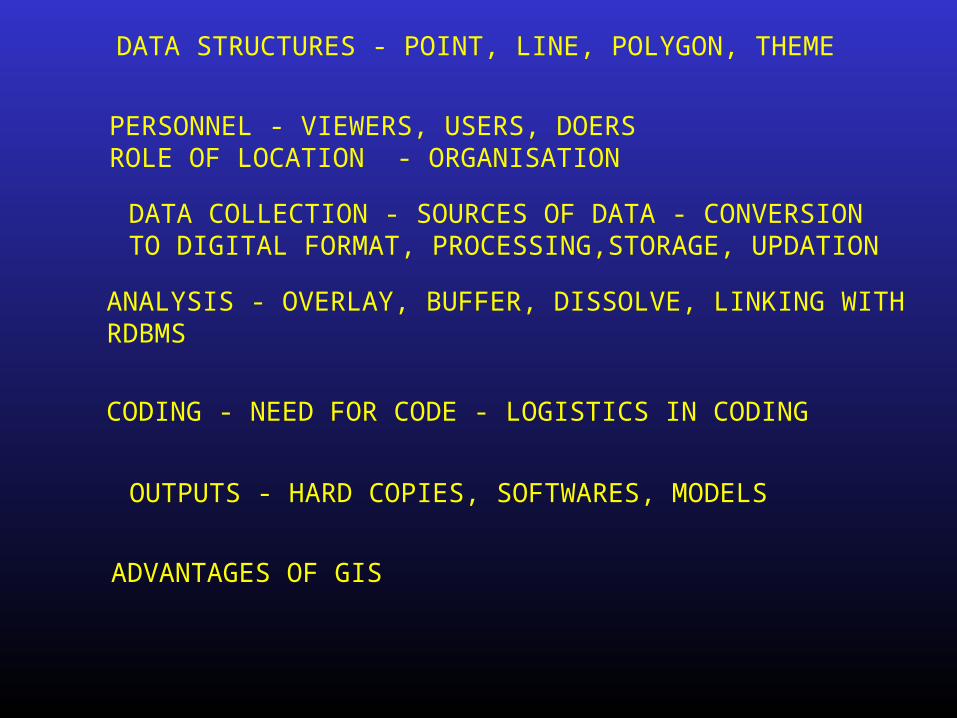
DATA STRUCTURES - POINT, LINE, POLYGON, THEME
PERSONNEL - VIEWERS, USERS, DOERSROLE OF LOCATION - ORGANISATION
DATA COLLECTION - SOURCES OF DATA - CONVERSIONTO DIGITAL FORMAT, PROCESSING,STORAGE, UPDATION
ANALYSIS - OVERLAY, BUFFER, DISSOLVE, LINKING WITHRDBMS
CODING - NEED FOR CODE - LOGISTICS IN CODING
OUTPUTS - HARD COPIES, SOFTWARES, MODELS
ADVANTAGES OF GIS

Type of Errors
• Dangle Node • Undershoot• Overshoot• Missing Labels • Duplicate labels • Pseudo nodes • Unclosed polygon• Incorrect user ID to the features

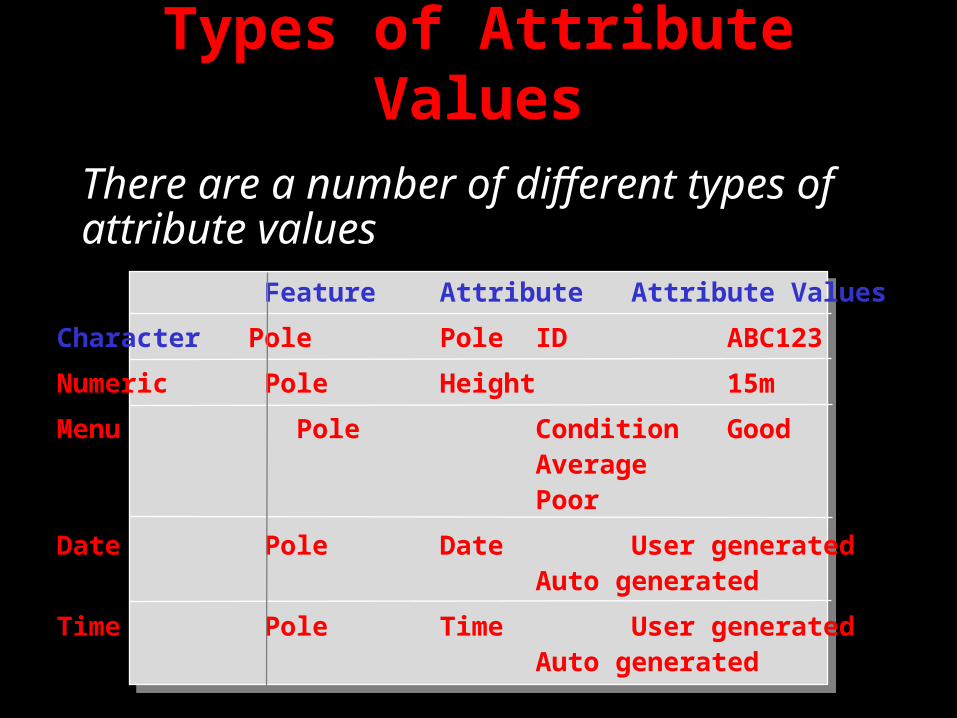
Types of Attribute ValuesThere are a number of different types ofattribute values
Feature Attribute Attribute Values
Character Pole Pole ID ABC123
Numeric Pole Height 15m
Menu Pole Condition GoodAveragePoor
Date Pole Date User generatedAuto generated
Time Pole Time User generatedAuto generated
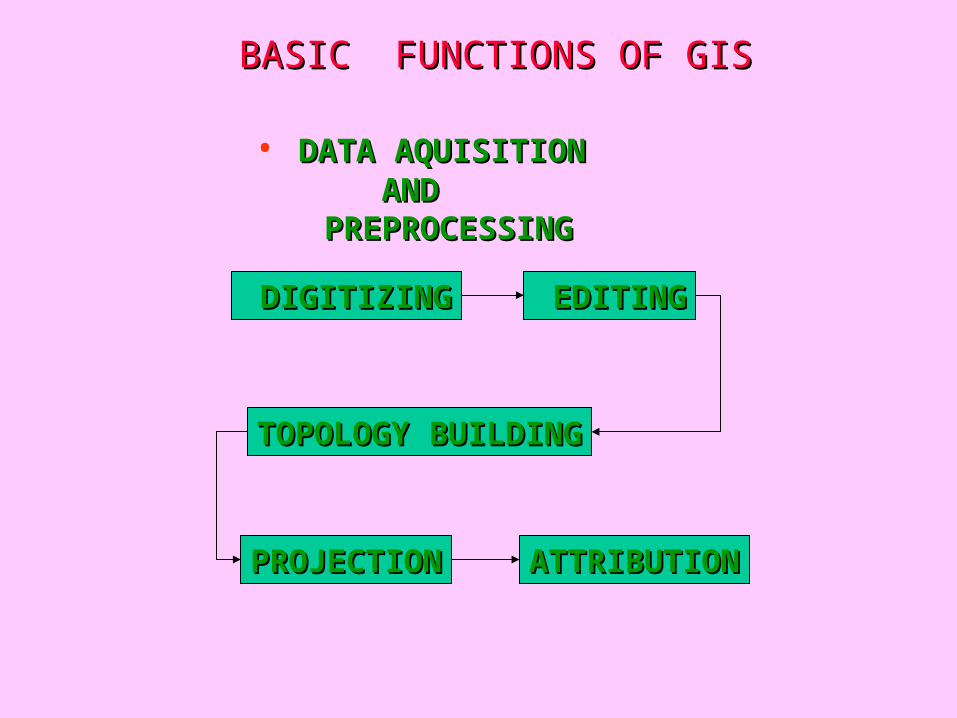
BASIC FUNCTIONS OF GISBASIC FUNCTIONS OF GIS
• DATA AQUISITION AND DATA AQUISITION AND PREPROCESSINGPREPROCESSING
DIGITIZINGDIGITIZING EDITINGEDITING
TOPOLOGY BUILDINGTOPOLOGY BUILDING
PROJECTIONPROJECTION ATTRIBUTIONATTRIBUTION

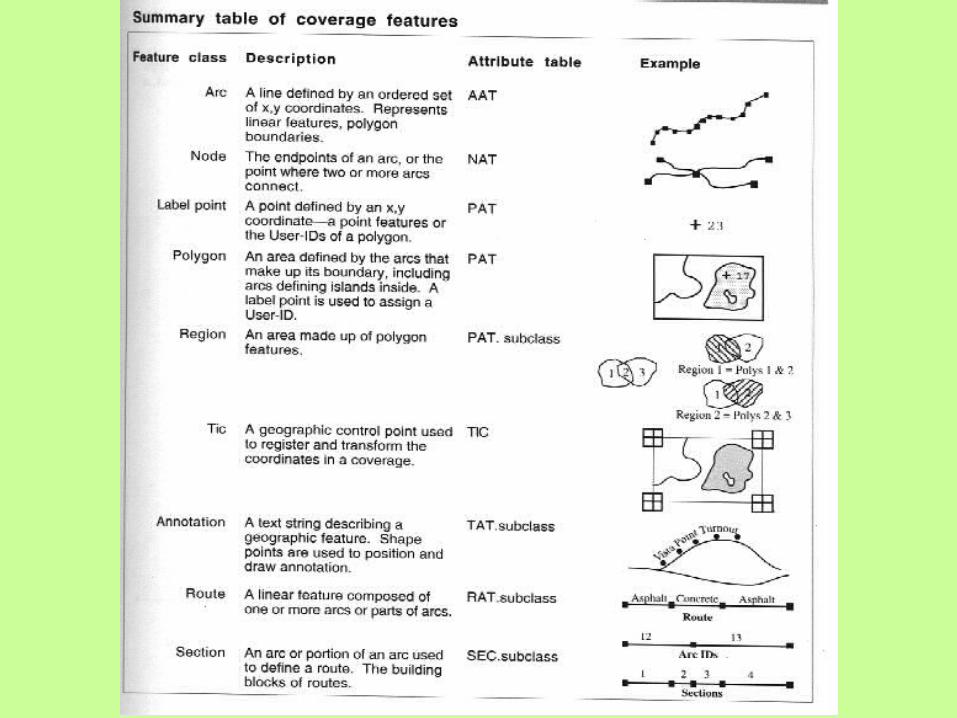
TOPOLOGY
• Topology mathematical representation of geographic features(arcs, nodes, polygons and points)
• When topology is built,it creates spatial relationship among the features
• Topology can be very important for certain types of analysis.

TOPOLOGIC DATA ELEMENTS
Node
Line (Arc)
Area(polygon)
Nodes: defines beginning and end of the lineLine: defines roads,utilities,boundaries,etc.,Areas: administrative boundaries, forest block,JFM areas,lakes
Supports spatial analysis
Supports network analysis
Supports map publication

LOGISTICS IN CODING
CODING
NEED FOR CODE
JFM_CODECOMPT_CODEDDRB_CODE
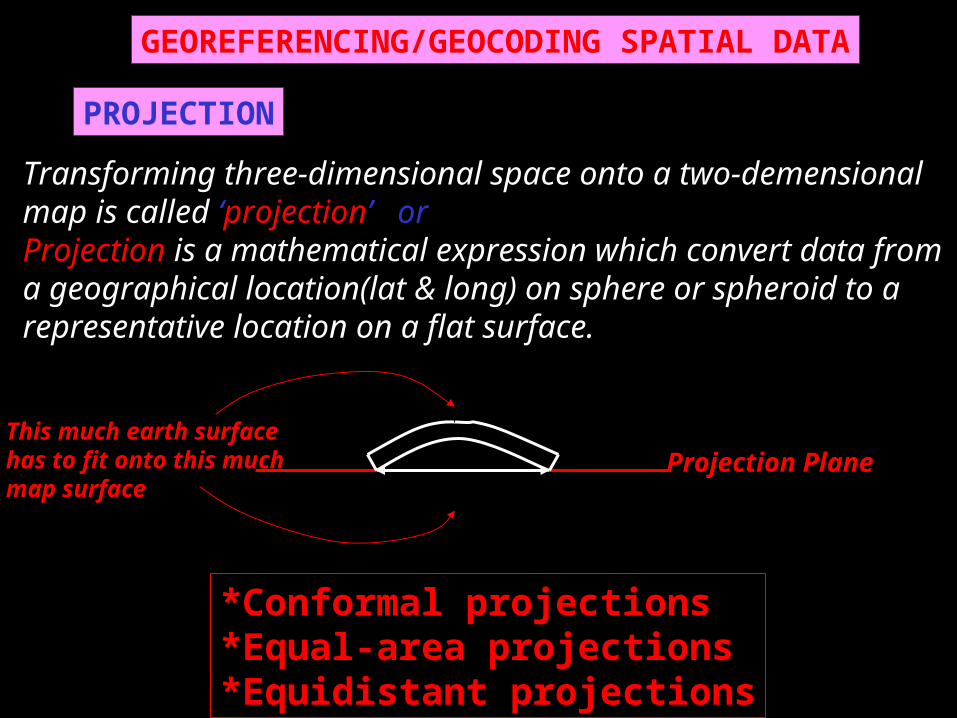
PROJECTION
GEOREFERENCING/GEOCODING SPATIAL DATA
Transforming three-dimensional space onto a two-demensionalmap is called ‘projection’ orProjection is a mathematical expression which convert data froma geographical location(lat & long) on sphere or spheroid to arepresentative location on a flat surface.
This much earth surfacehas to fit onto this muchmap surface
Projection Plane
*Conformal projections*Equal-area projections*Equidistant projections
WHY GIS ?
• To inventory and monitor resources
• To test the sensitivity of our analysis assumptions
• To simulate potential impacts of management alternatives
• To make the map the 2nd time, the 50th time, the 100th time...
Uses of a GIS
• Mapping geographical characteristics for analysis
• Modeling alternative processes for management plans
• Managing a utility’s assets
• Monitoring changes in environmental factors

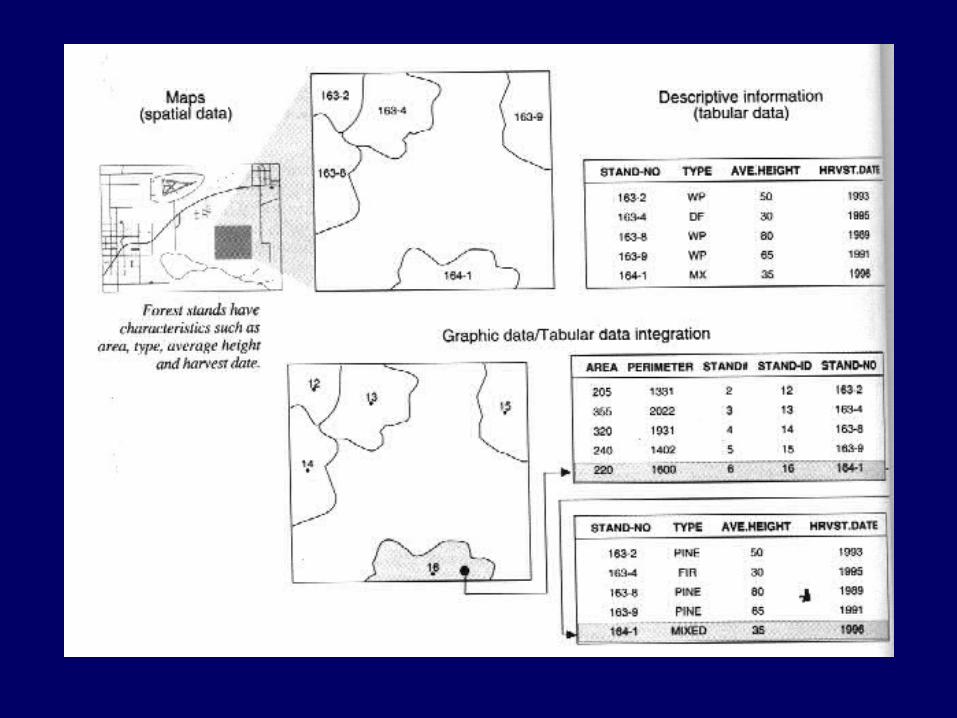
Integration of Data
GIS data
• A GIS allows integration of data collected: – At different times– At different scales– Using various methods of capture

GIS Data Analysis
• A GIS identifies relationships among features in the database
• Provide answers to queries that are spatial (geographic)

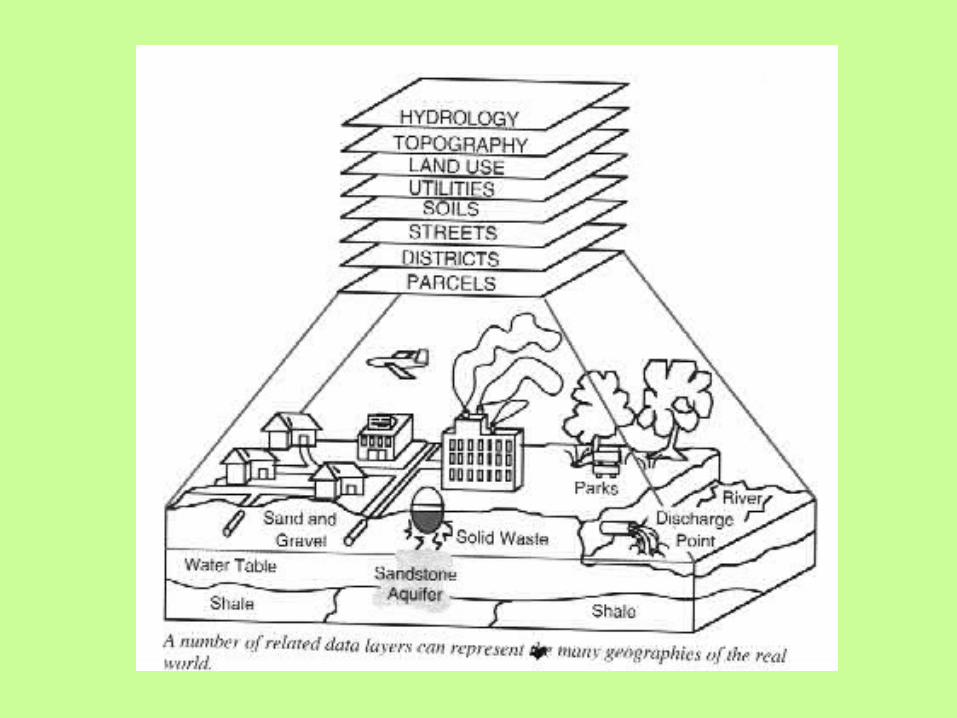
THEMATIC OVERLAYTHEMATIC OVERLAY
1. TOPOGRAPHY1. TOPOGRAPHY
2. BOUNDARIES2. BOUNDARIES
3. VEGETATION3. VEGETATION
4. ROADS4. ROADS
5. RIVERS5. RIVERS
6. SOILS6. SOILS

Query and Analysis
Data Query Output
Veg_type - Area feature
-Potential are available for jfm
- 3 Village locations with density-type classes
MT
MISC
Identify areaswhere densityis lt 0.2 within5km from thecenter of the
village
Density map1-dense2-open3-scrub4-blanks
Report
TEAK
BAMBOO
4
32
3
1
21
4
VillageBuffer 5km
12
3
4 5
6
3
4 5

DATABASE MANAGEMENT AND DATABASE MANAGEMENT AND RETRIEVALRETRIEVAL
HIERARCHICAL MODELINGHIERARCHICAL MODELING
NETWORK MODELINGNETWORK MODELING
RELATIONAL MODELINGRELATIONAL MODELING
ATTRIBUTE QUERRYATTRIBUTE QUERRY
DATABASE: COLLECTION OF INFORMATION ABOUT THINGS AND THEIR RELATIONSHIP TO EACH OTHER
DBMS : A SET OF PROGRAMS THAT IS DESIGNED TO MANIPULATE MAINTAIN DATA IN A DATABSE

UNIVERSITY
DEPARTMENT
STUDENTS PROFESSORS
REGISTRATION COURSES
Hierarchical modeling
M
I IIa cb d
1 3 122 43 4
fe gc
3 5 634 65 4
I II
e
g
c
d
b
af
1
2
4 6
53
MAP M
MI II
a b c d e f g
1 2 3 4 5 6
Network linkages

ADVANTAGES OF GIS IN SIMPLE TERMS
• Though collection of data is difficult once it is collected, it can be stored safely in digital form (in computer) forever without damage, which usually happens to our maps.
• Once if a map is prepared accurately it can be printed in any scale without any redrawing.
• Large scale maps at smaller units (Beats) level can be joined for creating maps at divisions or district level, very accurately within few minutes.
• Changes can be incorporated very easily in computer and it doesn’t require any redrawing.
• Same map can be generated even after 100s of years later.• New things can be known after overlay of different themes and a new types of
maps can be generated.• Work can be done faster than manually.• The work of decision makers and end users will become easier.