gis, remote sensing and spatial analysis for vector-borne … · gis, remote sensing and spatial...
TRANSCRIPT

GIS, Remote Sensing and Spatial Analysis for Vector-Borne Diseases
Prof. Uriel Kitron and Dr. Gonzalo Vazquez-Prokopec
1The screen versions of these slides have full details of copyright and acknowledgements
GIS, Remote Sensing and Spatial Analysis
for Vector-Borne Diseases
1
Prof. Uriel Kitron and Dr. Gonzalo Vazquez-Prokopec
Department of Environmental Studies, Emory University
Spatial analysis for vector-borne diseases
1. Spatial aspects in surveillance and research
2. Tools for spatial analysis
3. Spatial statistics
2
4. Landscape ecology
5. Scale and resolution
6. Risk maps
7. Opportunities and limitations
Research questions
• Spatial determinants of transmission and risk
• Spatial associations of risk factors with disease and interaction with temporal processes
3
• Origins of diseases and hazards

GIS, Remote Sensing and Spatial Analysis for Vector-Borne Diseases
Prof. Uriel Kitron and Dr. Gonzalo Vazquez-Prokopec
2The screen versions of these slides have full details of copyright and acknowledgements
Surveillance and control questions
• Spatial and temporal distribution of disease and risk factors
• Planning of surveillance program and presentation of surveillance findings and control activities
4
of surveillance findings and control activities
• Focusing of control efforts – improved allocation of limited resources
Sources & existing tools for spatial data
• GPS– Field data
• GIS– Surveillance data
Field data
5
– Field data
– Environmental data
• Remote sensing
• Spatial statistics, time series, dynamic models– Data analysis
• Approaches:– Landscape ecology & epidemiology,
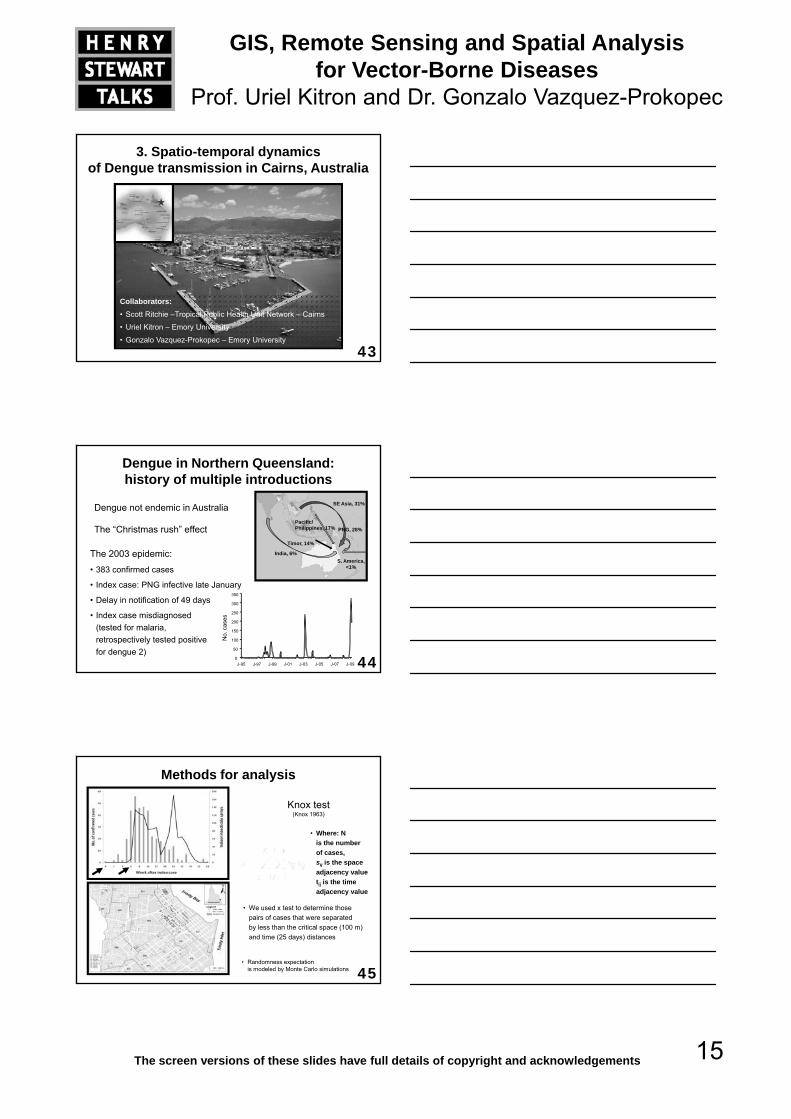
metapopulation biology ecological risk assessment
Scale
Temporal and spatial scale and resolution
• Geographic - ranging from the village/town to the continental level
• Temporal - ranging from the duration of an outbreak,
6
through the seasonal to multi-year models
• Multiple scales can be considered simultaneously or in succession, but with caution

GIS, Remote Sensing and Spatial Analysis for Vector-Borne Diseases
Prof. Uriel Kitron and Dr. Gonzalo Vazquez-Prokopec
3The screen versions of these slides have full details of copyright and acknowledgements
Global Positioning System (GPS)
• A system that allows for calculation of position with a high degree of accuracy
• based on a a ground receiver and a system of 32 satellites
7
and a system of 32 satellites orbiting earth
• Triangulation to determine the location of an object with a 5-10 m accuracy (or less)
What is remote sensing?Is the collection of information about an object
without being in direct physical contact with the object
8
Most often through satellites
9
Sensors on satellites vary with regard to spatial, spectral, and temporal resolution

GIS, Remote Sensing and Spatial Analysis for Vector-Borne Diseases
Prof. Uriel Kitron and Dr. Gonzalo Vazquez-Prokopec
4The screen versions of these slides have full details of copyright and acknowledgements
Environmental parameters
Rainfall Formation of breeding sites
Temperature Survival of pathogens, vectors, hosts/reservoirs
Soil type Survival of ticks, helminths, mosquitoes
El ti /t h V t di t ib ti
10All parameters can be sensed remotely
and modeled spatially
Elevation/topography Vector distribution
Human activities Creation of new habitats; Contact risk
Water bodies Mosquitoes, snails
Vegetation Resting sites; Food sources; Vector habitat characteristics
Geographic Information Systems (GIS)
• A system to capture, manage, manipulate, analyze, model, display
Human cases
Human settlements........ ....
... ....
11
model, display spatially referenced data for research, management, and planning purposes
Vegetation data
Water bodies
. . .. .... .... ......
Soil type
Adult mosquitoes
First law of geography (Tobler 1979)
Spatial statistics
12
Everything is related to everything else, but near things are more related
than distant things

GIS, Remote Sensing and Spatial Analysis for Vector-Borne Diseases
Prof. Uriel Kitron and Dr. Gonzalo Vazquez-Prokopec
5The screen versions of these slides have full details of copyright and acknowledgements
Calculation of spatial statistics
• Based on giving weight to the distances between items of interest:
– No. of malaria cases in village or groups of houses
13
– No. of mosquito larvae in aquatic habitats
– Water conductivity or pH
– Amount of rainfall in a given location
Spatial scale & resolution • Ranges from local to global
• Determines appropriate digitized data bases
• Satellite images range from Ikonos (<5m) to AVHRR (1 km)
D t i i t ti l t ti ti
14
• Determines appropriate spatial statistics
• Multiple scales can be considered simultaneously or in succession
Prerequisites for an active zoonotic VBD focus
• Vector survival
• Presence of reservoir hosts
• Pathogen transmission
• Opportunities
Dead end host
Dead end host
EEE & WNVEncephalitis
cycle
15
Opportunities for human/animal exposure
Dead end host
Dead end host

GIS, Remote Sensing and Spatial Analysis for Vector-Borne Diseases
Prof. Uriel Kitron and Dr. Gonzalo Vazquez-Prokopec
6The screen versions of these slides have full details of copyright and acknowledgements
Examples
• Human vector-borne diseases: Malaria, Dengue
• Mosquito borne Zoonoses – West Nile virus and other Arboviruses
16
• Other vector-borne zoonoses – African trypanosomiasis, Chagas disease, Leishmaniases, Lyme disease
1. West Nile virus: eco-epidemiology of disease emergence in urban areas*
• Develop a spatial model and risk maps based on:– Demographic and environmental risk factors for WNV and SLE
in birds, mosquitoes and humans
– Reservoir capacity and differential effects of WNV
17
p yon various bird species
– Anthropogenic features of the urban environment that support Culex mosquito production, mosquito-bird transmission and virus amplification
– Dynamics of viral transmission over space and time using molecular evolutionary and phylogeographic techniques
* Funded by NSF/NIH ecology of infectious disease program
Research team
Co-InvestigatorsUniversity of Illinois• Uriel Kitron
• Marilyn Ruiz
• Tony Goldberg
CollaboratorsAudubon Chicago Region• Karen Glennemeier• Judy Pollack
Illi i D t t f P bli H lth
18
• Jeff Brawn
• Scott Loss
Michigan State University• Edward Walker
• Gabe Hammer
Illinois Department of Public Health• Constance Austin• Linn Haramis
Illinois State Water Survey• Kenneth Kunkel

GIS, Remote Sensing and Spatial Analysis for Vector-Borne Diseases
Prof. Uriel Kitron and Dr. Gonzalo Vazquez-Prokopec
7The screen versions of these slides have full details of copyright and acknowledgements
West Nile Virus in Illinois• 2001 - 123 positive bird specimens, 0 human cases
• 2002 - 884 human cases, 66 deaths, more than any other state that year (U.S. - 4,156/284)
Over 680 cases occurred in Chicago and surroundings
• 2003 - 54 human cases, 1 death (U.S – 9,862/264)
• 2004 - 60 human cases, 4 deaths (U.S. – 2,539/100)
( S / )
19
• 2005 - 252 human cases, 12 deaths (U.S. – 3000/119)
• 2006 – 210 human cases, 9 deaths (U.S. – 4180/149)
2002 2003
2002,2005,2006,
hot and dry
WNV cases in Illinois 2002-2006
20
21
Mosquito poolsBirdsAt least one Human caseAt least one Equine casePositive countries - No human cases
Humans

GIS, Remote Sensing and Spatial Analysis for Vector-Borne Diseases
Prof. Uriel Kitron and Dr. Gonzalo Vazquez-Prokopec
8The screen versions of these slides have full details of copyright and acknowledgements
22
Locations of human WNV cases in 2002 with land cover
Human WNV case rate per 10,000 people
WNV human cases with housing density
• Human cases tend to be outside of the more densely populated urban core
• 3 areas with most cases (circled on map):
1
23
( p)– In the south, near Oak Lawn
– In north, around Skokie
– Southwest of Skokie
3
2
Vegetation Physiographic region
24

GIS, Remote Sensing and Spatial Analysis for Vector-Borne Diseases
Prof. Uriel Kitron and Dr. Gonzalo Vazquez-Prokopec
9The screen versions of these slides have full details of copyright and acknowledgements
• Each different colored area represents a place with a common set of factors
Dominant patterns in the Chicago
urban landscape
25
with a common set of factors related to housing, vegetation, socio-economics, and land use
Ruiz et al., Int'l J Health Geog 2005
• Urban type 5, dominated by 40s, 50s, and 60s housing; Mostly white, moderate vegetation and moderate population density
• 435 cases (64%) were in this group, 2.27 cases per 10,000 people (RR>3.5); (all other types <0.65 cases per 10,000)
26
• Area characterized b d t d
• In hot dry years standing waterith i tt id
27
by many undocumented storm drains
with organic matter providehabitat for Culex mosquito larvae

GIS, Remote Sensing and Spatial Analysis for Vector-Borne Diseases
Prof. Uriel Kitron and Dr. Gonzalo Vazquez-Prokopec
10The screen versions of these slides have full details of copyright and acknowledgements
Important processes behind the cluster patterns
• Ecological
– Mosquito and bird habitat suitability
– Housing, landscape and catch basins
• Socioeconomic
28
– Lifestyle
– Race, income
– Access to healthcare, biased reporting
• Mosquito abatement districts
– Control methods
– Geographic location
2. Eco-epidemiology of Chagas disease in northwest Argentina
• Univ. of Buenos Aires, Argentina
29
• National Vector Control Program, Argentina
• Instituto Fatala Chabén, Argentina
• CNRS-IRD, France
• Rockefeller University, NY, USA
• CDC, USA
• Univ. of IllinoisSupported by NIH/NSF EID Program through FIC
Tintina
Eco-Epidemiology of Chagas disease In Northwest Argentina – study area
30
DepartamentoMoreno
Santiago del Estero Province
Argentina
Landsat Thematic Mapper
Amama

GIS, Remote Sensing and Spatial Analysis for Vector-Borne Diseases
Prof. Uriel Kitron and Dr. Gonzalo Vazquez-Prokopec
11The screen versions of these slides have full details of copyright and acknowledgements
Typical compound with home and multiple peridomestic structures
31
Domiciliary area
Peridomestic structures – refuge for bugs and sources for reinfestation
32Goat corral
Pig corral Storeroom
Chicken coop
Ikonos satellite imagery (1-4m2)
Mapping and geostatistical tools
Sketch maps made in the field during 1993-2002
33Spatial statistics
Digital map for each village
Joining of attribute
data to a GIS file
Clusters of high infestation and potential sources
of community reinfestation

GIS, Remote Sensing and Spatial Analysis for Vector-Borne Diseases
Prof. Uriel Kitron and Dr. Gonzalo Vazquez-Prokopec
12The screen versions of these slides have full details of copyright and acknowledgements
Georeferencing - relating infestation data to locations
34
Reinfestation by T. infestans (5 years post-spraying)
35
012 - 56 - 1011 - 2021 - 30 Canal
Paved roadDirt road No. of T. infestans
31 - 40
Gi(d) local spatial statistic
We used Gi(d) to detect local and focal clustering of infestations (number of bugs per structure)
Gi(d) = Σj Wij(d) xj
Σj xj
36
• Specific location of potential for infestation sources
• Wij(d) is a spatial weights matrix with values of one for all links within distance d of a given i
• Concern about multiple comparisons (need to adjust significant z value)
Σj xj

GIS, Remote Sensing and Spatial Analysis for Vector-Borne Diseases
Prof. Uriel Kitron and Dr. Gonzalo Vazquez-Prokopec
13The screen versions of these slides have full details of copyright and acknowledgements
No. of bugs in November 199501 - 23 - 5
No. of bugs in November 1996G 0
G 1 - 2G 3 - 5G >5
CanalP d d
Primary source of T. infestans 1993
Focal analysis of reinfestation in Amamá
• Subsequent infestations were clustered around an initial focus at a distance of 450 mts
• Potential secondary sources fell within the range
+
37
Paved roadDirt road
fell within the range of the clustering around the primary source
Cecere et al., 2005; Am. J. Trop. Med. Hyg., 71 (6): 803–810
Moving upscale - including other villages;Internal and external sources
of reinfestation
38
Internal source
External source
• External sources: villages not sprayed and located within 1,500 m of the treated villages
Cecere et al., EID, 2006
An effective control program on the community level would entail residual spraying
with insecticides of the colonized site
Recommendation
39
with insecticides of the colonized site and all sites within a radius of 450 m, and all communities within 1,500 m
of the target community in order to prevent the subsequent propagation of T. infestans

GIS, Remote Sensing and Spatial Analysis for Vector-Borne Diseases
Prof. Uriel Kitron and Dr. Gonzalo Vazquez-Prokopec
14The screen versions of these slides have full details of copyright and acknowledgements
Moreno department
405,439 houses, 2,911 rural houses, 275 villages, ~25,000 habitants
Vazquez-Prokopec et al., in prep.
T. infestans domestic infestation
41Associated with density of rural houses, maximum temperature,
elevation and land-cover type (% degraded forest)
Role of RS/GIS in Chagas study
• Detection and mapping of houses, peridomestic structures, and sylvatic habitats
• Integration of demographic, entomological, and epidemiological data
• Determining sources of colonizing vectors and of T. cruzi infection
42
• Statistical analysis and modeling of re-infestation and infection processes
• Targeting of NVCP surveillance and control program
• Anthropogenic changes in land cover and land use, and resulting migration and subsistence farming patterns on the department and province levels
GIS, Remote Sensing and Spatial Analysis for Vector-Borne Diseases
Prof. Uriel Kitron and Dr. Gonzalo Vazquez-Prokopec
15The screen versions of these slides have full details of copyright and acknowledgements
3. Spatio-temporal dynamics of Dengue transmission in Cairns, Australia
43
Collaborators:• Scott Ritchie –Tropical Public Health Unit Network – Cairns
• Uriel Kitron – Emory University
• Gonzalo Vazquez-Prokopec – Emory University
Dengue in Northern Queensland: history of multiple introductions
Dengue not endemic in Australia
The “Christmas rush” effect
The 2003 epidemic:
SE Asia, 31%
Pacific/Philippines, 17%
India, 6%
PNG, 28%
Timor, 14%
44
• 383 confirmed cases
• Index case: PNG infective late January
• Delay in notification of 49 days
• Index case misdiagnosed (tested for malaria, retrospectively tested positivefor dengue 2)
0
50
100
150
200
250
300
350
J-95
No.
cas
es
J-97 J-99 J-01 J-03 J-05 J-07 J-09
S. America,<1%
Methods for analysis
Knox test(Knox 1963)
• Where: N is the number of cases, sij is the space dj l
45
• We used x test to determine those pairs of cases that were separated by less than the critical space (100 m) and time (25 days) distances
adjacency value tij is the time adjacency value
• Randomness expectation is modeled by Monte Carlo simulations

GIS, Remote Sensing and Spatial Analysis for Vector-Borne Diseases
Prof. Uriel Kitron and Dr. Gonzalo Vazquez-Prokopec
16The screen versions of these slides have full details of copyright and acknowledgements
Space-time analysis
46250/383 cases (65%) belonged to 15 space-time clusters
Progression of cases over space and time
47
Prop
ortio
n of
cas
es
Improving vector control
Recommendations:
• During the “Christmas rush” consider every dengue-like case as dengue and apply rapid response
• Consider spatial heterogeneity when designing
48
and implementing surveillance and control interventions (decision support system)
• Spraying needs to be contextualized according to time since introduction

GIS, Remote Sensing and Spatial Analysis for Vector-Borne Diseases
Prof. Uriel Kitron and Dr. Gonzalo Vazquez-Prokopec
17The screen versions of these slides have full details of copyright and acknowledgements
Vector borne disease transmission dynamics
• Host/reservoir/vector heterogeneity:– Genetics, age/sex, location, behavior, reproduction,
movement patterns
• Population heterogeneity:– Herd immunity, meta-population dynamics, social structure
49
• Environmental heterogeneity:– Gradients, suitable/unsuitable patches, barriers
• Socio-economic factors– Exposure, impact, interventions
• Host-pathogen interactions:– Parasitism, co-evolution
• Dependent on scale (spatial/temporal) and mode of transmission
Spatial tools - opportunities
• New impetus for ecological research
– Landscape determinants of disease transmission
• Comprehensive multi-scale picture
– Local/regional/global epidemiology of infectious diseases
50
or environmental assessments
• Consideration of temporal changes
– Emerging infectious diseases & effects of climate change
• Interdisciplinary research, integration of molecular, entomological and epidemiological studies and findings
Spatial data - concerns and limitations
• Massive amounts of environmental data
• Paucity of accurate epidemiological data
• Heterogeneity of transmission patterns
51
Heterogeneity of transmission patterns
• Lack of data readily masked
• Meaning of area boundaries
• Spatial autocorrelation and interpolation
• Meta analysis

GIS, Remote Sensing and Spatial Analysis for Vector-Borne Diseases
Prof. Uriel Kitron and Dr. Gonzalo Vazquez-Prokopec
18The screen versions of these slides have full details of copyright and acknowledgements
Challenges and new studies
• Addressing loss in heterogeneity across scales
• Consideration of social, economic, institutional processes
• Integration of fine scale (biotic factors) with coarse-scale (environmental factors) efforts
52
• Construction of risk maps that go beyond showing a pattern (pretty picture) to understanding the underlying biological process
53