gis best practices: gis for climate change
TRANSCRIPT

GIS Best Practices
GIS for Climate Change
November 2008

i
Table of Contents
What Is GIS? 1
Science and our Changing Climate 3
Conserving Bolivia's Critical Resources 7
NCAR Publishes Climate Change Models in ESRI GIS Format 11
Carbon Nation 15
Mapping the Ayles Ice Shelf Break 21
Long-Term Environmental Monitoring at McMurdo Station, Antarctica, Supported With GIS 27
Traditional Knowledge Meets New Tools 33
GIS BEST PRACTICES 1 WWW.ESRI.COM
What Is GIS?Making decisions based on geography is basic to human thinking. Where shall we go, what will it be like, and what shall we do when we get there are applied to the simple event of going to the store or to the major event of launching a bathysphere into the ocean's depths. By understanding geography and people's relationship to location, we can make informed decisions about the way we live on our planet. A geographic information system (GIS) is a technological tool for comprehending geography and making intelligent decisions.
GIS organizes geographic data so that a person reading a map can select data necessary for a specifi c project or task. A thematic map has a table of contents that allows the reader to add layers of information to a basemap of real-world locations. For example, a social analyst might use the basemap of Eugene, Oregon, and select datasets from the U.S. Census Bureau to add data layers to a map that shows residents' education levels, ages, and employment status. With an ability to combine a variety of datasets in an infi nite number of ways, GIS is a useful tool for nearly every fi eld of knowledge from archaeology to zoology.
A good GIS program is able to process geographic data from a variety of sources and integrate it into a map project. Many countries have an abundance of geographic data for analysis, and governments often make GIS datasets publicly available. Map fi le databases often come included with GIS packages; others can be obtained from both commercial vendors and government agencies. Some data is gathered in the fi eld by global positioning units that attach a location coordinate (latitude and longitude) to a feature such as a pump station.
GIS maps are interactive. On the computer screen, map users can scan a GIS map in any direction, zoom in or out, and change the nature of the information contained in the map. They can choose whether to see the roads, how many roads to see, and how roads should be depicted. Then they can select what other items they wish to view alongside these roads such as storm drains, gas lines, rare plants, or hospitals. Some GIS programs are designed to perform sophisticated calculations for tracking storms or predicting erosion patterns. GIS applications can be embedded into common activities such as verifying an address.
From routinely performing work-related tasks to scientifi cally exploring the complexities of our world, GIS gives people the geographic advantage to become more productive, more aware, and more responsive citizens of planet Earth.
GIS BEST PRACTICES 3 WWW.ESRI.COM
Science and our Changing ClimateGIS Creates a Framework for Research and Modeling
By Matt Artz, ESRI
The Medieval Warm Period (10th to 14th centuries). The Little Ice Age (16th to 19th centuries). The Year Without a Summer (1816). Earth’s climate has undergone radical changes in the distant as well as recent past, and is certain to undergo more radical changes in the not-too-distant future. And as industrialization, population, and urbanization continue to increase, so too will stressors on the environment such as pollution.
Such change in climate and environmental quality could have huge impacts on our quality of life. Regardless of where you stand on the often politically-charged issue of “global warming” or “global climate change,” we owe it to ourselves and our children to take a cold, hard look at the data.
We live in an age of readily and freely available information. The Internet has given us unprecedented awareness of and access to vast quantities of climate data. Never before have scientists and non-scientists had such easy and open access to the data and tools needed to study our climate.
Two general types of data are useful in studying climate change: past observations and future predictions. Examining and cross-referencing past and future data can help us identify changes already occurring, as well as help us predict patterns and trends that could impact our long-term fate.
For centuries, mankind has been keeping careful records of rainfall, temperature, lake level, stream fl ow, etc. for thousands of locations across the globe. Beyond these historical records, additional records of climate change stretch back even further when you consider fi elds such as dendrochronology (measuring the size of tree rings), which reveals climate data stretching back for thousands of years, and palynology (changes in the type and distribution of fossil pollen), which gives us clues about climate going back millions of years. The result of all this collection and research is vast stores of data describing conditions at particular locations on the planet at particular points in time.
The Age of Information
Observing the Past

NOVEMBER 2008 4 GIS FOR CLIMATE CHANGE
Careful observation and analysis of past records might help us answer questions such as: Are recent weather phenomena a short-term blip or a long-term trend? What past climate changes are due to the Earth’s natural cycle versus what changes may have been caused by volcanic eruption, meteorite impact, or other cataclysmic disasters?
Anyone who watches the weather forecast on the evening news knows how frustrating it is to predict the future. But prediction of short term, highly-localized conditions such as the chance of rain in Redlands on Friday afternoon is quite different from predicting long-term, more general phenomena such as global climate change. Scientists for years have been using sophisticated computer models such as general circulation, atmosphere-ocean interaction, and radiative-convective process models in an attempt to visualize the future of earth’s climate. The output of a particular model can be enlightening, but combining data from multiple sources, both past and future, gives us the best chance for a comprehensive and accurate vision of what the future holds for our planet.
The key to understanding our dynamic climate is creating a framework to take many different pieces of past and future data from a variety of sources and merge them together in a single system. Information technology brings together data from these many different sources into a common computer database. A geographic information system (GIS) is a sophisticated technology tool used by planners, engineers, and scientists to display and analyze all forms of location-referenced data including meteorological information. GIS creates a new framework for studying global climate change by allowing users to inventory and display large, complex spatial data sets. They can also analyze the potential interplay between various factors, getting us closer to a true understanding of how our dynamic climate may change in the coming decades and centuries.
Environmental Systems Research Institute (ESRI), located in Redlands, produces GIS technology used by a wide variety of professionals for a broad range of applications. The National Oceanic and Atmospheric Administration (NOAA) uses GIS to monitor the world’s storm activity; the U.S. Geological Survey uses GIS to collect and analyze data about volcanoes, earthquakes and tsunamis; and the U.S. Department of Agriculture uses GIS to track the effects of drought on the nation’s crops. From conservation organizations to international agencies, scientists across the globe are using GIS as an integrative platform that gives those researching and analyzing our environment and climate unprecedented vision and fl exibility.
Predicting the Future
The Role of GIS

WWW.ESRI.COMGIS BEST PRACTICES 5
Is the Earth getting hotter or colder? Is the stress human populations are putting on the planet contributing to climate change? What potential factors may signifi cantly impact our ability to thrive and survive as a species? What additional sorts of environmental monitoring can we be doing today to improve climate change tomorrow? Only through careful observation of the data, application of scientifi c principals, and by using the latest technology do we have any hope of truly understanding the stressors and impacts on the incredibly complex system of Earth’s climate.
(Reprinted from the January 30, 2008, issue of Redlands Daily Facts)
Where do we go from here?

GIS BEST PRACTICES 7 WWW.ESRI.COM
Conserving Bolivia's Critical Resources GIS Helps Gauge Land Change Effects on the Nation's Endemic Biodiversity
By James Toledano, J. Ronald Eastman, and Florencia Sangermano, Clark Labs, Clark University; and Tim Killeen, Conservation International
Due in part to a tremendous amount of economic growth in recent decades, the Bolivian lowlands saw forest loss of almost 3 million hectares between the years of 1992 and 2004, with almost half of this loss coming between 2001 and 2004 alone. This land change is expected to be the major contributor to biodiversity loss (even more important than climate change) and contributes to habitat degradation, fragmentation, and destruction. Indeed, the rate of deforestation is second only to that of Brazil. With forests dominating more than 65 percent of the land cover in lowland Bolivia, it is essential that this land-change dynamic be appropriately analyzed, particularly as we now know tropical forests are a critical component for maintaining climate system function and that they also represent the habitat for a wide range of species.
Conservation International, based in Arlington, Virginia, is an organization at the forefront of preserving natural systems in a sustainable manner. It has focused much attention on land-cover change in the Amazon, particularly in Bolivia, and it has relied more in recent years on the scientifi c application of GIS for insights into managing habitat loss and predicting future scenarios of change. To better implement this effort, Conservation International has prioritized the oversight of the development of essential integrated tools for identifying hot spots and conserving habitat and biodiversity—tools to better manage, monitor, and prioritize the risks to the environment associated with economic development.
Clark Labs (an ESRI Business Partner located in Worcester, Massachusetts, and based within the Graduate School of Geography at Clark University) partnered with Conservation International over several years to develop a land-change modeling software environment to analyze land-cover change and assess the potential impacts of these scenarios on biodiversity.
The result of this collaboration was the development of the Land Change Modeler (LCM), implemented within Clark's IDRISI GIS and image processing software and recently as an extension for ArcGIS software.

NOVEMBER 2008 8 GIS FOR CLIMATE CHANGE
These land-cover maps depict dramatic lowland deforestation (red) over time between 1992, 2001, and 2004 (data: the Geography Department at Bolivia's Noel Kempff Mercado
Natural History Museum).

GIS BEST PRACTICES 9 WWW.ESRI.COM
For a recent showcasing of LCM, Clark used land-cover maps depicting dramatic deforestation over time that were developed by the Geography Department at Bolivia's Noel Kempff Mercado Natural History Museum for that nation's lowlands. These maps showed forest change that occurred between 1992 and 2001. A set of 28 static and dynamic driver variables that may have impacted this change, such as proximity to infrastructure, slope, and soil type, were also included. Information on known road improvements for Bolivia as part of the planned intervention input to the prediction phase further refi ned the model. For this project, a multilayer perceptron neural network was used to create a predictive model, relating the observation of deforestation with the driver variables. Clark chose this method because of its high accuracy for mapping the transition potential of land-cover classes. To assess the quality of the model, a prediction was made to 2004 and the output was validated against known conditions in 2004.
Once the model was calibrated, additional future scenarios were then produced. One such scenario included both a soft and hard prediction of land change in the Bolivian Lowlands for the year 2015. The hard prediction yielded one possible scenario of the locations of change, while the soft prediction gave an indication of the deforestation vulnerability in 2015. Results from this scenario were then combined with biodiversity data to uncover the potential impact on biodiversity.
Using collections of species range polygons, initially supplied by NatureServe and subsequently recalibrated in Land Change Modeler for ArcGIS, a species richness map was developed for all birds, mammals, and amphibians. A total of 73 species endemic to Bolivia were identifi ed, including 36 amphibians, 16 mammals, and 21 birds. This map was combined with the 2015 soft prediction (deforestation vulnerability map) to derive a risk of biodiversity, or endemic loss.
Bolivian Land-Change Dynamics
and Implications on Biodiversity
A species richness map was developed, then combined with the 2015 soft prediction to derive a risk of biodiversity, or
endemic loss.

NOVEMBER 2008 10 GIS FOR CLIMATE CHANGE
The results are alarming. Assuming business as usual, the potential forest loss could be devastating to biodiversity in Bolivia. For example, one of the endemic species, the masked antpitta (Hylopezus auricularis), an already threatened species, is projected to lose one-third of its habitat by 2015. Indeed, for the base time period of this study, 2001–2004, 4 percent of the current endemic mammal habitat has already been lost. The implications of land change on biodiversity are occurring now.
Land Change Modeler for ArcGIS provides a means to combat threats, such as economic development, and to assist those engaged in important conservation practices to prioritize threatened environments. Clark Labs, in conjunction with Conservation International, is currently conducting training in the use of these important tools for land-use planning and sustainable development in countries undergoing high biodiversity loss to further prioritize their planning interventions.
James Toledano is executive director of Clark Labs, Clark University. Ron Eastman is the director and founder of Clark Labs. Florencia Sangermano is a research associate at Clark Labs. Tim Killeen is a senior research scientist at the Center for Applied Biodiversity Science, Conservation International.
For more information on Conservation International, visit www.conservation.org. For more information on Land Change Modeler for ArcGIS, contact Clark Labs (Web: www.clarklabs.org). Noel Kempff Mercado Natural History Museum is a recipient of GIS software from ESRI's conservation programs and has received additional support from the Bolivian government, Conservation International, The Nature Conservancy, and the World Wildlife Fund.
(Reprinted from the Spring 2008 issue of ArcNews magazine)
Habitats Already Lost
About the Authors
More Information
GIS BEST PRACTICES 11 WWW.ESRI.COM
NCAR Publishes Climate Change Models in ESRI GIS Format Model Output Data Is Available to GIS Users
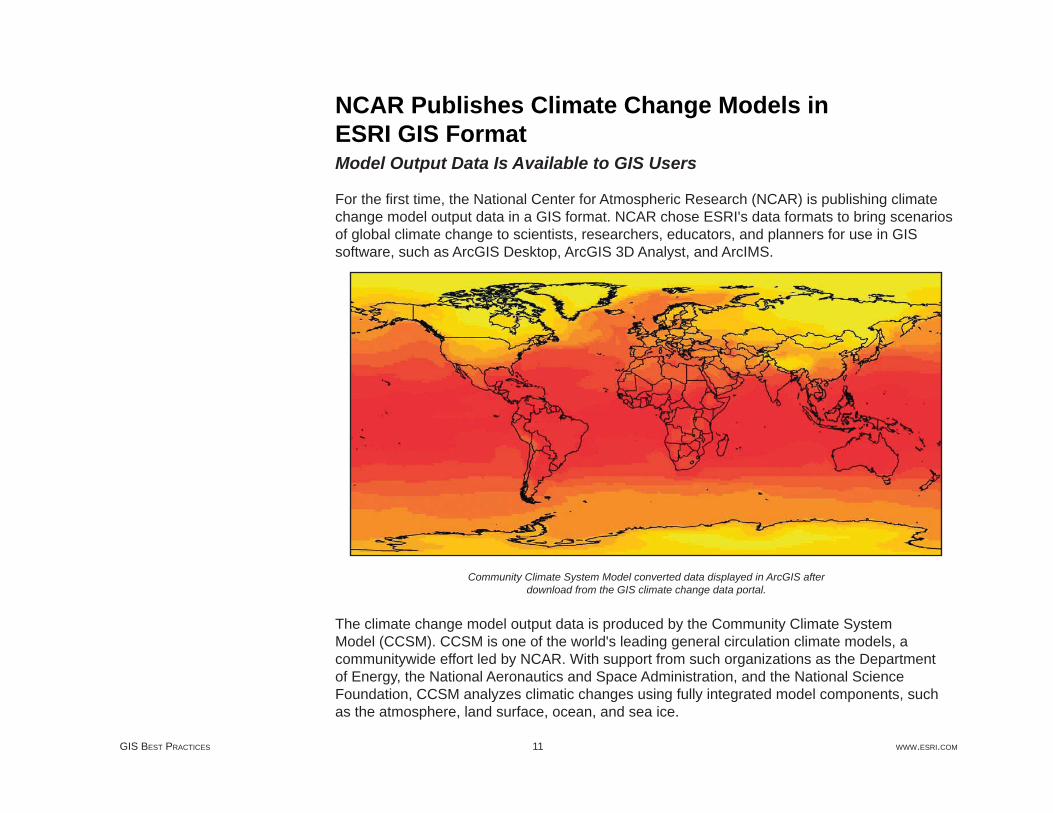
For the fi rst time, the National Center for Atmospheric Research (NCAR) is publishing climate change model output data in a GIS format. NCAR chose ESRI's data formats to bring scenarios of global climate change to scientists, researchers, educators, and planners for use in GIS software, such as ArcGIS Desktop, ArcGIS 3D Analyst, and ArcIMS.
Community Climate System Model converted data displayed in ArcGIS after download from the GIS climate change data portal.
The climate change model output data is produced by the Community Climate System Model (CCSM). CCSM is one of the world's leading general circulation climate models, a communitywide effort led by NCAR. With support from such organizations as the Department of Energy, the National Aeronautics and Space Administration, and the National Science Foundation, CCSM analyzes climatic changes using fully integrated model components, such as the atmosphere, land surface, ocean, and sea ice.
NOVEMBER 2008 12 GIS FOR CLIMATE CHANGE
Changes in climate, whether man-made or natural, involve a complex interplay of physical, chemical, and biological processes of the earth. Development of a comprehensive CCSM that accurately represents the principal components of the climate system and their interactions requires both wide intellectual participation and computing capabilities beyond those available in many institutions. CCSM provides an active program of simulations and evaluations of climatic change using an evolving model to address scientifi c issues and problems of national and international policy interest. Now, outputs produced as a result of the model simulations are available to anyone interested in viewing and analyzing them in a more interdisciplinary way through GIS.
NCAR is pleased to bring the CCSM model output data to GIS users interested in understanding climate change and the impacts of this change. NCAR anticipates this data will provide another variable in modeling for looking at future climate when coupled with traditional GIS data, such as environmental, socioeconomic, and demographic. "Scientists at NCAR have been studying climate change and its impacts for years," says Olga Wilhelmi, project scientist with NCAR's Institute for the Study of Society and the Environment and principal investigator of NCAR's GIS Initiative. "Publishing climate change model output data in a GIS format will open NCAR climate science to a broader community of users interested in interdisciplinary issues of global climate change," she adds.
NCAR is publishing this data in a GIS format free of charge at www.gisclimatechange.org. A GIS user simply needs to visit the Web site, register, and either download the data or view it on the Web using ArcIMS. Since many GIS users have not historically been able to use climate change data, there will be a host of information available on CCSM, such as climate change and metadata for different scenarios and variables.
ESRI and NCAR fi rst formed a strategic relationship in 2003 to advance GIS within the realm of atmospheric research. Both organizations have been working together to explore the development of atmospheric applications, information, and data models within GIS domains. A key initiative was to provide GIS education and training for atmospheric scientists and researchers to expand GIS use at NCAR. NCAR's GIS Initiative has been busily providing seminars and a series of lectures on GIS technology and concepts and how to use ArcGIS Desktop, ArcIMS, and ArcSDE. Many NCAR employees have attended these sessions, and more seminars continue to be scheduled to accommodate the changing population of scientists.
ESRI and NCAR Continue Strategic
Relationship

GIS BEST PRACTICES 13 WWW.ESRI.COM
Jennifer Boehnert, NCAR's GIS coordinator, explains, "Traditionally, scientists have viewed and analyzed atmospheric data using in-house software but haven't looked at weather or climate data in a GIS context. Looking at the atmospheric data in relation to basemap data is an exciting concept."
Another area of strategic alliance between ESRI and NCAR is the development of an atmospheric data model for GIS. The organizations are collaborating with many other leaders in the discipline to address the creation of an atmospheric data model that will help promote the sharing of climate and weather data formats new to GIS users. A special interest group (SIG) formed at the 2003 ESRI International User Conference met for a data modeling workshop at the National Oceanic and Atmospheric Administration's Pacifi c Marine Environmental Laboratory in Seattle, Washington, in January 2004. The goal of SIG is to extend the GIS data model to manage the representation of atmospheric data, in particular temporal and raster data.
(Reprinted from the Winter 2004/2005 issue of ArcNews magazine)

GIS BEST PRACTICES 15 WWW.ESRI.COM
Carbon NationAutomated GIS process is creating a snapshot of biomass and carbon in U.S. forests
By Gregory J. Fiske, Woods Hole Research Center, Falmouth, Massachusetts
Carbon is a hot topic these days. People everywhere are increasingly aware that carbon in the form of carbon dioxide (CO2) is one of the greatest contributors to the global climate change problem. Even school-aged children now know about fossil fuels and how our excessive use of them contributes to the accumulation of greenhouse gases in the atmosphere. At the same time, researchers around the world are working to understand where carbon is being stored, how much is being stored over time, and how this information can be used to better understand the global carbon budget. But while coal-fi red power plants and SUVs have become icons of carbon imbalance, we tend to overlook another leading contributor to human-induced carbon emissions: land-cover change.
Modeling and prediction activities for NBCD2000 are being carried out using ecoregional zones developed by the Multi-Resolution Land
Characteristics Consortium.

NOVEMBER 2008 16 GIS FOR CLIMATE CHANGE
The connection between the carbon cycle and land cover is complex. Understanding the role of land-cover change, such as the conversion of forest to pasture or prairie to pavement, is a chief objective of scientists at the Woods Hole Research Center (WHRC), an environmental science, education, and policy institution on Cape Cod in Massachusetts. The center's staff have been pursuing answers to this question for many years, employing tools such as GIS and remote sensing to aid them in determining how much carbon exists, where it is located, and why it matters.
A team at WHRC has undertaken an ambitious project to quantify the amount of biomass and, in turn, the amount of carbon that blankets the 48 conterminous United States. Dr. Josef Kellndorfer, an associate scientist at WHRC, and his team are generating the National Biomass and Carbon Dataset for the year 2000 (NBCD2000). This project makes use of high-resolution (30 meter) National Aeronautics and Space Administration (NASA) satellite datasets, topographic survey data, national land-use/land-cover data, and extensive forest inventory data collected by the United States Department of Agriculture Forest Service.
With this large collection of data layers at a nationwide scale, the challenge is managing data systematically and automating processing tasks wherever possible. Modeling and prediction activities are being carried out using polygons describing the 67 ecoregional zones that were developed by the Multi-Resolution Land Characteristics Consortium (MRLC) as a basis for mapping. [MRLC (www.mrlc.gov) is a group of federal agencies that joined together to purchase Landset 7 imagery and coordinate production of the National Land Cover Database.]
Use of this data required that each of the dozens of GIS procedures employed in data preparation and analyses be repeated 67 or more times. Additional processing resulted from model updates, data modifi cations, or error fi xes. Many data preparation tasks—such as reprojecting, clipping, raster-based math, and associated analyses—were conducted in the desktop environment. To automate these tasks in ArcGIS Desktop 9.2 (ArcInfo), the NBCD2000 team turned to Python scripting. For each task, a Python script was written and linked to a toolbox GUI in ArcToolbox. The collection of scripts was gathered into a single NBCD toolbox and shared with each WHRC team member via a local server running ArcGIS Server 9.2. Kellndorfer felt the development of an automated strategy was crucial for maintaining workfl ow and continuity from zone to zone because data preparation tasks were divided among the team members.
Looking at Biomass and Carbon
Automating Data Preparation

GIS BEST PRACTICES 17 WWW.ESRI.COM
The actual statistical modeling of biomass is accomplished using a Linux-based high-performance computing cluster with multiple processing nodes. Both commercial and open-source image processing software was also used for a variety of analysis tasks. The team made every effort to ensure that all software packages worked together smoothly. For ease of integration in subsequent processing steps, Python scripts were written to generate fi les with the appropriate format and data type.
The core data layers for estimating carbon are two nationwide estimates of elevation: the 2000 Shuttle Radar Topography Mission (SRTM) digital surface model and the National Elevation Dataset (NED) digital terrain model. Essentially, these datasets are "differenced" to produce an estimate of vegetation canopy height that is used in subsequent biomass prediction.
The key tool in the ArcGIS NBCD toolbox generates this difference layer for each mapping zone. The necessary SRTM and NED tiles, acquired from the United States Geological Survey (USGS) seamless server (seamless.usgs.gov), are mosaicked. The NED surface is subtracted from the SRTM surface using raster math. In the fi nal operation, the raster is clipped to the mapping zone boundary and converted to the proper bit depth required by the statistical modeling routine.
The tool performs a series of multistep, often time-consuming, GIS tasks within minutes. Previously, these tasks could require nearly an hour of setup time but now they are fully automated. Automating these tasks using Python scripting has greatly increased processing effi ciency and saved hundreds of hours. Because help for the toolbox GUIs has been completely documented, new NBCD2000 team members can quickly become familiar with each tool and perform data processing with greater ease and confi dence.
New NBCD2000 project team members can quickly be productive because the tools in the NBCD toolbox
have been completely documented.
NOVEMBER 2008 18 GIS FOR CLIMATE CHANGE
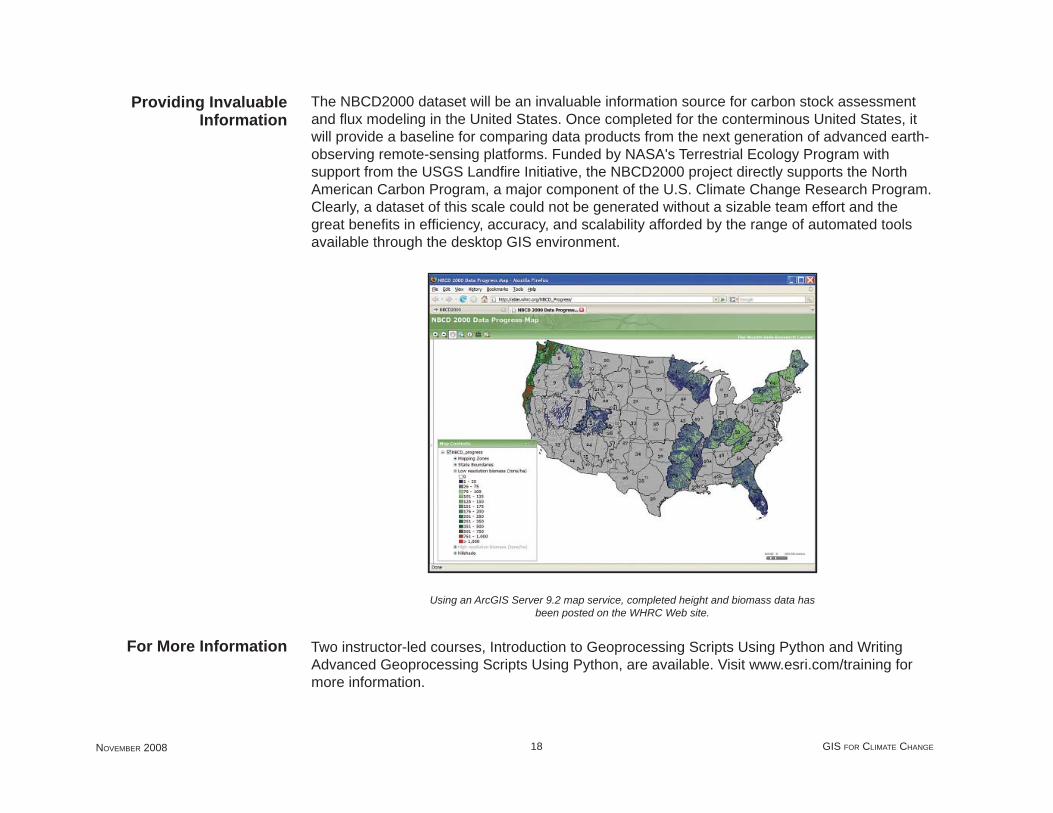
The NBCD2000 dataset will be an invaluable information source for carbon stock assessment and fl ux modeling in the United States. Once completed for the conterminous United States, it will provide a baseline for comparing data products from the next generation of advanced earth-observing remote-sensing platforms. Funded by NASA's Terrestrial Ecology Program with support from the USGS Landfi re Initiative, the NBCD2000 project directly supports the North American Carbon Program, a major component of the U.S. Climate Change Research Program. Clearly, a dataset of this scale could not be generated without a sizable team effort and the great benefi ts in effi ciency, accuracy, and scalability afforded by the range of automated tools available through the desktop GIS environment.
Using an ArcGIS Server 9.2 map service, completed height and biomass data has been posted on the WHRC Web site.
Two instructor-led courses, Introduction to Geoprocessing Scripts Using Python and Writing Advanced Geoprocessing Scripts Using Python, are available. Visit www.esri.com/training for more information.
Providing Invaluable Information
For More Information

GIS BEST PRACTICES 19 WWW.ESRI.COM
Currently, height and biomass mapping has been completed for approximately 20 zones. This data has been posted on the WHRC Web site. An ArcGIS Server 9.2 map service has been set up on the NBCD2000 project Web site. This interactive Web map will be updated regularly as data from the remaining zones becomes available. For more information about the NBCD2000 project, visit the project Web site (whrc.org/nbcd).
Gregory J. Fiske, a research associate with WHRC, is a geographer and an aspiring Python programmer.
(Reprinted from the Summer 2008 issue of ArcUser magazine)
About the Author
GIS BEST PRACTICES 21 WWW.ESRI.COM
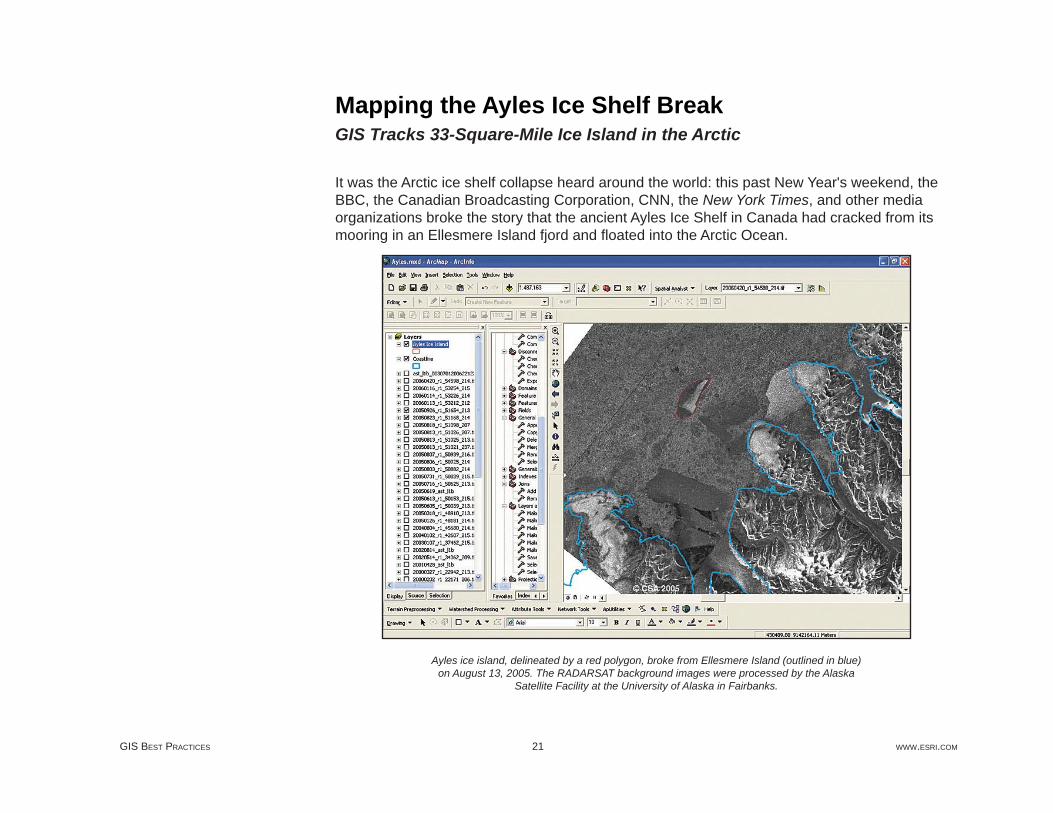
Mapping the Ayles Ice Shelf Break GIS Tracks 33-Square-Mile Ice Island in the Arctic
It was the Arctic ice shelf collapse heard around the world: this past New Year's weekend, the BBC, the Canadian Broadcasting Corporation, CNN, the New York Times, and other media organizations broke the story that the ancient Ayles Ice Shelf in Canada had cracked from its mooring in an Ellesmere Island fjord and fl oated into the Arctic Ocean.
Ayles ice island, delineated by a red polygon, broke from Ellesmere Island (outlined in blue) on August 13, 2005. The RADARSAT background images were processed by the Alaska
Satellite Facility at the University of Alaska in Fairbanks.

NOVEMBER 2008 22 GIS FOR CLIMATE CHANGE
The ice shelf calving was discovered by Laurie Weir of the Canadian Ice Service in September 2005 while she was comparing satellite images of the ice shelves. She contacted Luke Copland from the Laboratory for Cryospheric Research at the University of Ottawa in Canada, who launched a scientifi c investigation into what occurred. Though the news spread in some scientifi c circles and was reported at a conference, journalists did not catch word of the story for 15 months.
With the possible culprit being global warming, all eyes turned north, where the newly formed ice island sits safely—so far—in sea ice about 10 miles off Ellesmere. "Right now it's frozen in off the coast," says Derek Mueller, a geographer and postdoctoral researcher at the Geophysical Institute University of Alaska Fairbanks, who helped to investigate and write a paper about what happened to the 33-square-mile Ayles Ice Shelf.
Though the ice island has only traveled a short way since the August 13, 2005, incident and there's no obvious current danger to ships or oil drilling platforms, the chance of trouble ahead exists, Mueller says. "It could break away at any time and fl oat further down to the south, and it would likely start breaking up as it fl oats," he states. "These ice islands will be tracked by the Canadian Ice Service so that ships will be warned," adding that the possibility exists, though slim near term, that the ice island could drift down toward the coast of Alaska with the Beaufort Gyre current and into shipping lanes and toward oil drilling operations. "Worst-case scenario, if it did hit one of the oil drilling platforms, it could cause a lot of damage," Mueller adds.
Though not enough evidence exists to blame global warming for the collapse of the Ayles Ice Shelf, Mueller says that what occurred is consistent with other signs of climate change in the Arctic. "Taken together, all of these signs are worrisome," he says.
Having studied the ecosystems on the Ellesmere Island ice shelves as part of his Ph.D. research in biology, Mueller was invited to help investigate the Ayles Ice Shelf breakup and contribute to a paper the researchers were writing about the calving. In his work, through the university's ESRI campuswide site license, Mueller used ArcInfo software to create a map that helped researchers visualize the chain of events and learn how much ice was lost from the fjord on the north end of Ellesmere Island.
Sizing Up the Ayles Ice Shelf

GIS BEST PRACTICES 23 WWW.ESRI.COM
Eric Bottos from McGill University, Derek Mueller from the Geophysical Institute at the University of Alaska, and Alexandra Pontefract from McMaster University sample microbial
mats on the Markham Ice Shelf (August 2005). (Photo courtesy of Denis Serrazin).
"The break was visible, but what we wanted to know was, What was the size of the ice island when it broke away?" Mueller says, adding that mapping and analysis showed it shrank from about 41 square miles to 33 square miles. "Aside from the loss of the Ayles Ice Shelf, 20 percent of the nearby Petersen ice shelf was also lost just after August 13, 2005. And some multiyear landfast sea ice (MLSI) that had been there since the 1940s was lost from Yelverton Bay to the west of Ayles Fjord."
After georeferencing and projecting RADARSAT images (provided to the Alaska Satellite Facility by the Canadian Space Agency and its private partners) before and after the ice shelf breakup, Mueller imported the geographic TIFF (GeoTIFF) format into ArcInfo. With vector layers, such as coastline contour lines, from the Canadian government laid down, he traced polygons over the top of the RADARSAT images of the ice shelf taken at different times.

NOVEMBER 2008 24 GIS FOR CLIMATE CHANGE
A Moderate Resolution Imaging Spectroradiometer (MODIS) image of the Ayles Ice Shelf breaking away from Ellesmere Island (August 13, 2005, at 20:45 Coordinated Universal Time (UTC). (Image courtesy of NASA.)
"Using GIS, I put down several images that I could fl ick back and forth showing where the ice was before any of the activity, calculated the square kilometers—the area of that polygon—then looked again and saw where ice wasn't located," he says. "Then we could essentially calculate the ice loss," which was about 54 square miles, according to Mueller.
"GIS also helps interpret satellite images," Mueller states. "What is good about that method is you can keep those polygons and fl ick the image to another time. Sort of like a time machine, you can fl ick backward in time and forward in time and watch for changes. And if you have a polygon or a vector overlay in ArcInfo, then you can look for your border underneath and, if it alters over time, you know you've got a change."
GIS BEST PRACTICES 25 WWW.ESRI.COM
In studying the Ayles Ice Shelf breakup, the researchers found that factors in addition to possible long-term climate changes likely contributed to the calving.
In addition to higher-than-usual temperatures that summer, Ellesmere Island was struck by strong winds, according to Mueller. "A lot of the multiyear landfast sea ice broke away from the shore—from the front of the Ayles Ice Shelf—and a lot of the sea ice was pushed away as well," he says. "That was caused by very strong winds pushing offshore and alongshore. Those winds pushed away the sea ice, and that allowed the ice shelf itself the freedom to move away."
Though the new ice island stayed put in the summer of 2006, Mueller says it's not stuck permanently. "It may last another year. It may last another few months. It's not necessarily stable ice."
Even in winter, the humongous chunk of ice could begin moving again. "It's fairly exposed to all the currents that are churning around in that area," Mueller says.
Mueller also used ArcInfo several years ago when he mapped ice types while studying microbial mats on the ice shelves. Microbial mats, often present in extreme environments, are this planet's oldest known ecosystems.
"I was interested in looking at cold-tolerant organisms in ecosystems that are ice dependent, he says, adding that "microbial mats composed of algae, microinvertebrates, and bacteria are commonly found on the surface of Arctic ice shelves. The ice shelves are a unique habitat for microbial mats, which can perhaps provide some clues as to what types of life existed when the planet was younger and how that life evolved."
In ArcInfo, he mapped the ice types, such as the marine "basement" ice and the meteoric or atmospheric iced fi rn, and also noted the sites where he took samples of microbial mats. Mueller will use that map to refer to as he continues studying the changes in the Arctic ice shelves in the years ahead.
"I'm looking for baseline information on the cryosphere—the cold parts of the earth—to look for changes due to climate warming." He adds. "Ice shelves may be a valuable indicator of climate change. When the ice shelves disintegrate, it represents a loss of habitat." He is concerned that the ice shelves may completely break up within his lifetime based on predicted warming of the Arctic.
Mapping Ice Types

NOVEMBER 2008 26 GIS FOR CLIMATE CHANGE
"Working to preserve habitats and biodiversity is important," Mueller concludes. "These ice shelves may harbor some cold-adapted organisms that could be interesting for biotechnology. Or you might simply value the habitats that we are losing from our landscape."
(Reprinted from the Spring 2007 issue of ArcNews magazine)

GIS BEST PRACTICES 27 WWW.ESRI.COM
Long-Term Environmental Monitoring at McMurdo Station, Antarctica, Supported With GISBy Andrew Klein, Mahlon C. Kennicutt II, and Steve Sweet, Texas A&M University; and Paul Montagna and Sally Applebaum, University of Texas
In 1996, Texas A&M University and University of Texas researchers began developing a long-term environmental monitoring program for McMurdo Station, Antarctica. McMurdo Station is the largest U.S. Antarctic base and the logistical hub of the U.S. Antarctic Program (USAP) run by the National Science Foundation (NSF). It is located on the southernmost ice-free tip of Ross Island (77° 51´ S, 166° 40´ E). The station has been in continuous operation since 1955. The site was fi rst visited by Sir Robert F. Scott's Discovery Expedition of 1901-1904, which overwintered there. Later British expeditions would utilize the historic hut, which still stands today, that was constructed during Scott's fi rst expedition.
A panoramic view of the McMurdo station.

NOVEMBER 2008 28 GIS FOR CLIMATE CHANGE
Environmental stewardship is a cornerstone of USAP activities, and the logistics provided by McMurdo Station enable environmentally sound science to be conducted across Antarctica. All activities in Antarctica are governed by the international Antarctic Treaty, which reserves the region south of 60° S latitude for peaceful purposes and fosters international cooperation in scientifi c research. In October 1998 the Protocol on Environmental Protection to the Antarctic Treaty entered into force. This protocol requires that activities in Antarctica be planned and conducted to limit adverse environmental impacts. McMurdo Station's long-term environmental monitoring program, developed jointly by Texas A&M University and the University of Texas researchers, fulfi lls the protocol's requirements for monitoring the impact of ongoing activities.
GIS aided University of Texas marine biologists in determining the location of marine sampling sites in McMurdo Sound. They located sampling sites at specifi c depths along four transects across
areas of known disturbances. A fi fth control transect was located in an undisturbed area near the station. Sampling sites were determined by depth and by viewing relevant infrastructure overlaid
on bathymetric contours, including the station's sewage outfall and seawater intake.

GIS BEST PRACTICES 29 WWW.ESRI.COM
Because of the small spatial extent (meters or less) of much of the human impacts at McMurdo Station, careful consideration of geographic location is important in undertaking any environmental monitoring program. ArcGIS Desktop (ArcView and ArcInfo) and its ArcMap application were used extensively throughout the project's year-long planning phase and its three-year pilot phase, beginning in 1999, and continue to be used during implementation of the monitoring program beginning in 2003.
During the planning phase, researchers used ArcView to compile a spatially referenced database of historical environmental studies. Using ArcView to visualize the locations of known contamination and historical environmental sampling over station infrastructure maps and orthorectifi ed aerial photographs aided greatly in developing strategies to sample the landscape surrounding and adjacent to the station.
The largest environmental contaminant at McMurdo Station is fuel, on which the entire USAP runs. Fuel spills, largely a legacy of former practices, have resulted in meter-sized areas of contamination. Researchers used ArcView and ArcInfo to design and test several stratifi ed random sampling schemes capable of effi ciently detecting changes in the overall levels of contamination at the station and to monitor changes at specifi c areas of concern. Nested sets of square and hexagonal sampling grids were created using ArcInfo and its ARC Macro Language (AML). Coarse 100 m grids enabled sampling across the entire station, while fi ner 25 m and 5 m grids allowed sampling of the heterogeneous patterns of contamination at impacted sites, such as around fuel tanks.
GIS helped assure the collection of a spatially random sample. Researchers randomly selected grid cells to sample and determined the sampling location within each cell through loose coupling of ArcInfo with statistical and other mathematical software packages. They navigated to the random sampling sites in the fi eld using maps created in ArcView in conjunction with a differential GPS unit. Once a sampling site was located, they collected a surface sample and later geochemists at the Geochemical and Environmental Research Group (GERG) at Texas A&M University analyzed it for total petroleum hydrocarbons (TPH) and selected metals.
Using this GIS-enabled approach, nearly 2,000 terrestrial samples have been collected to date during four fi eld seasons. This fi eld collection program would not be possible without the GPS support and expertise provided for Antarctic research by UNAVCO, Inc. (www.unavco.org), a nonprofi t organization that supports and promotes GPS and other high-precision geodetic techniques in the earth sciences.

NOVEMBER 2008 30 GIS FOR CLIMATE CHANGE
Using the GIS-enabled approach, nearly 2,000 terrestrial samples have been collected todate during four fi eld seasons.
ArcView, and more recently its ArcMap application, serves as the primary means of analyzing the spatial patterns of specifi c measured contaminants, such as TPH or lead. Maps produced by ArcMap are a primary vehicle for disseminating information to a wide range of audiences. Information dissemination is important as the monitoring program is designed to support environmental management and decision making.
ArcView aided University of Texas marine biologists in determining the location of marine sampling sites in McMurdo Sound. They located sampling sites at specifi c depths along four transects across areas of known disturbances. A fi fth control transect was located in an undisturbed area near the station. Sampling sites were determined by depth and by viewing relevant infrastructure overlaid on bathymetric contours, including the station's sewage outfall and seawater intake.
GIS BEST PRACTICES 31 WWW.ESRI.COM
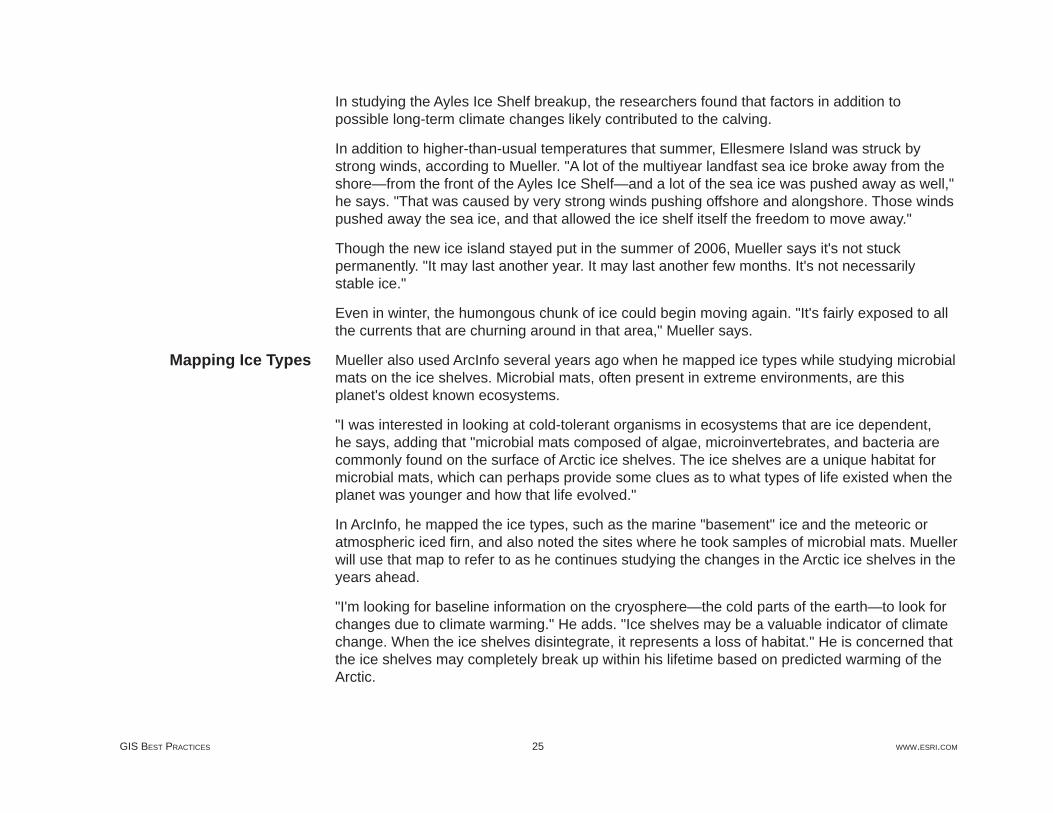
The sites are reoccupied each year to assess change over time in response to changes in station operations, such as a new sewage treatment plant, and to capture gradual long-term changes. At each marine site, divers from Raytheon Polar Services, the primary support contractor to USAP, collect sediment cores for community structure analysis, sediment chemistry, and toxicity. Sediment toxicity is analyzed on the station by University of Texas marine biologists using light producing bacteria (Microtox). The sediment cores and terrestrial samples are shipped back to Texas via cargo ship. At Texas A&M University, geochemists measure levels of TPH and polycyclic aromatic hydrocarbons (PAH), polychlorinated biphenyls (PCB), and selected metals in the terrestrial and marine samples. University of Texas researchers use the community structure of organisms in the cores to compute a benthic index of biological integrity, which measures the ecological integrity of each marine site.
Levels of disturbance in McMurdo Sound near the station as measured by a Benthic Index of Biotic Integrity and Total Petroleum Hydrocarbon Levels measured at the station overlaid on an orthorectifi ed aerial photograph and color-coded bathymetry. Most
human impact is confi ned to areas within a few hundred meters of the station.
NOVEMBER 2008 32 GIS FOR CLIMATE CHANGE
An extensive archive of aerial photography owned by the United States Geological Survey (USGS) exists for Antarctica, including McMurdo Station. Using the ArcGIS Desktop application ArcMap, researchers mapped footprints of buildings, fuel tanks, and roads from aerial photographs dating as far back as 1960. They created a disturbance history of the station by overlaying a hexagonal grid over the station and its immediate environs. The date of the aerial photograph recording the initial physical disturbance in each polygon was then identifi ed in ArcMap. This mapping revealed that the majority of physical disturbance around McMurdo Station occurred within the fi rst 15 years of the station's existence.
ArcGIS will continue to play an important role in supporting McMurdo Station's long-term environmental monitoring program. By allowing a user's current position to be viewed over aerial photographs and station maps, mobile GIS technologies—such as ArcPad—will allow fi eld sampling to be accomplished more effi ciently. Moreover, GPS is currently being used to collect extensive location information about operational activities across USAP, including helicopter landing sites, fuel caches, and spills. As the quantity of this geolocated, environmentally relevant information increases, GIS will play an increasingly important role in environmental stewardship of United States activities in Antarctica.
The project's Web site (www.gerg.tamu.edu/antarctica) is hosted by the Geochemical and Environmental Research Group at Texas A&M University.
(Reprinted from the Fall 2004 issue of ArcNews magazine)

GIS BEST PRACTICES 33 WWW.ESRI.COM
Traditional Knowledge Meets New ToolsEskimos and Ecologists Aided by Landfast Ice Mapping
The science of sea ice is an ancient discipline for indigenous people living north of the Arctic Circle. Ice science is a matter of survival for the Inupiat Eskimos in the northernmost regions of Alaska whose subsistence depends on hunting marine mammals, including whales, seals, walruses, and polar bears, and shorebirds. More than 7,000 Inupiat Eskimos live along the Beaufort Sea and Chukchi coast of the Arctic Ocean—the traditional lands along the North Slope. For thousands of years, these hardy subsistence hunters have made seasonal trips to the ice edge seeking fi sh and game. GIS is helping these people better understand and survive in an extreme environment, which is seeing the impacts of climate change in terms of coastal erosion, fl ooding, permafrost melting, increased intensity of storm events, and so forth.
The Inupiats have a vast amount of traditional ecological knowledge passed on from generation to generation. This includes a wealth of terminology for ice and snow and the various conditions associated with them. Hunting parties hike across pressure ridges, sit by seal holes for days, set up temporary igloos to wait for bowhead whales to swim by them, and camp on areas of landfast ice. (The coastal landfast ice extension is sea ice that forms and is often grounded by pressure ridges and remains attached to the coast for much of the winter.) To survive in this region, the people must understand the signs that indicate changes in the environment. For example, they need to know that a shift of wind velocity or a change in the sea current's direction may cause a land extension of ice to break off the coast, which has the potential to strand hunting parties or crush houses.
For the last century, western scientists have studied this frozen region of the world hoping to learn more about climate, light, polar ice caps, astronomy, the atmosphere, and so on. The study of landfast ice and pack ice is important for understanding ecology, climate change, minerals management, and navigation. Indigenous people have much to offer western researchers in the understanding of ice science. The National Science Foundation (NSF) is funding a program known as the Human Dimensions of the Arctic System that helps researchers and Inupiats develop a method of integrating traditional knowledge with modern scientifi c fi ndings. GIS technology has proven to be an excellent tool in cross-cultural communication for discussions that synthesize both forms of ecological knowledge.

NOVEMBER 2008 34 GIS FOR CLIMATE CHANGE
April 26, 2004, a spring sea ice lead developed along the coast of the Iñnupiat village of Barrow, Alaska, which is the northernmost community in the United States. Near real-time SAR imagery is incorporated into a user-friendly
Web interface for use by native hunters and sea ice researchers.
Allison Graves Gaylord, founder of Nuna Technologies in Homer, Alaska, is part of a team of researchers who received funding from NSF to develop the methodology for incorporating traditional ecological knowledge and western science to study sea ice. Because of global warming, the Arctic pack ice is thinning and coastal communities are more vulnerable to storms and dangerous ice events. A landfast ice extension may extend several hundred meters or kilometers from the coast and act as a platform for both traditional subsistence hunting activities and sea ice research. The sea ice environment is dynamic and even landfast ice can be hazardous and can break into drifting ice fl oes. Using ArcGIS Desktop software (ArcInfo, ArcView), Gaylord georectifi es satellite imagery from the Canadian Space Agency and European Space Agency. She incorporates additional information about Inupiat hunting camps and trails as data layers.
GIS BEST PRACTICES 35 WWW.ESRI.COM
Gaylord explains, "Since 2000, I have acquired near-real-time satellite imagery of Synthetic Aperture Radar (SAR) sensors. SAR works both day and night, through darkness and clouds, and produces excellent data about ice. People in the community are very excited about being able to see these images. The Inupiat people say that the ice conditions have become less predictable. The animals behave differently, sometimes migrating at different times and sometimes staying longer. Marine mammals typically travel with the polar pack ice. In recent years, the pack ice has retreated far offshore during the summer and fall months. Polar bears lingered at Point Barrow for weeks while the pack ice remained far offshore. The ice is thinner and less stable. Ice conditions erode earlier in the spring and set up later in the fall. Therefore, landfast ice is not getting grounded and lacks its normal stability. It is dangerous to be out on it." The traditional knowledge of the Inupiat people is challenged by impacts of global warming, which makes the Arctic environment less predictable.
A GIS-enabled Web site, built with ArcIMS, is used to distribute sea ice information to enhance the safety of the community of native hunters and sea ice researchers. This site, called the Barrow Area Information Database—Internet Map Server (BAID-IMS), is designed to enhance logistics and research planning efforts supported by the Barrow Arctic Science Consortium. Scientists, land managers, educators, and the local community use BAID-IMS to access spatial information pertaining to terrestrial, marine, freshwater, and atmospheric research in the Barrow area.
Gaylord says, "The BAID-IMS Web site has been a huge success. It is a resource available to local residents and researchers that are doing work in Barrow. Many sea ice specialists consider it to be a model application for the emerging Arctic GIS initiative. Another project we are hoping to get funded soon is a portal that connects research nodes across the Arctic through ArcIMS technology. Many of the nodes are near native communities similar to Barrow. Web applications can provide access to high-resolution satellite imagery, as well as information about historic and current research activity, infrastructure, landownership data, etc. This would be the beginning of developing an Arctic Spatial Data Infrastructure."
The Minerals Management Service (MMS), a bureau in the U.S. Department of the Interior, is also interested in the dynamics of landfast ice. MMS in the Alaska region is a federal agency that has a mission to manage the mineral resources of the Alaskan Outer Continental Shelf in an environmentally sound and safe manner. It is tasked with fi nding a way to provide the opportunity to explore for petroleum and still preserve the environment and the lifestyle of the

NOVEMBER 2008 36 GIS FOR CLIMATE CHANGE
people living adjacent to its coast. Naturally, MMS is interested in Nuna Technologies' research efforts and has funded the company to conduct further research in the region.
For example, MMS needs to know how spring leads and moving ice packs interact. The seaward limit of stable landfast ice defi nes where spilled oil might pool under the ice and where fast ice conditions apply to the design and operation of offshore facilities. This landfast ice also defi nes the furthermost landward boundary of possible whale routes during the springtime migration period.
Nuna Technologies has teamed with sea ice specialists from the Geophysical Institute of the University of Alaska to map the average monthly shoreward landfast ice extent. GIS is also used to process datasets to summarize the spatial distribution of spring leads. ArcGIS grids and shapefi les are used to show monthly distribution of the shoreward landfast ice across the Alaskan Beaufort Sea to the Canadian McKenzie Delta. The extent and stability of the landfast ice along this stretch of coast is being analyzed. Remote sensing imagery, specifi cally Radarsat synthetic aperture radar and advanced very high-resolution radiometer data, has been analyzed for the time period between 1993 and 2004. This data will be compared with the university's archived data from the 1970s and 1980s.
The information from this study of both temporal and spatial aspects of landfast ice is the foundation for improving the MMS oil spill risk analysis. The study meets an ongoing need for future sales policy, oil spill contingency planning, and National Environmental Impact Act analysis.
For more information, visit Nuna Technologies at www.nunatech.com.
(Reprinted from the Summer 2006 issue of ArcNews magazine)
More Information

Copyright © 2008 ESRIAll rights reserved.Printed in the United States of America.
The information contained in this document is the exclusive property of ESRI. This work is protected under United States copyright law and other international copyright treaties and conventions. No part of this work may be reproduced or transmitted in any form or by any means, electronic or mechanical, including photocopying and recording, or by any information storage or retrieval system, except as expressly permitted in writing by ESRI. All requests should be sent to Attention: Contracts and Legal Services Manager, ESRI, 380 New York Street, Redlands, CA 92373-8100, USA.
The information contained in this document is subject to change without notice.
U.S. GOVERNMENT RESTRICTED/LIMITED RIGHTSAny software, documentation, and/or data delivered hereunder is subject to the terms of the License Agreement. In no event shall the U.S. Government acquire greater than RESTRICTED/LIMITED RIGHTS. At a minimum, use, duplication, or disclosure by the U.S. Government is subject to restric-tions as set forth in FAR §52.227-14 Alternates I, II, and III (JUN 1987); FAR §52.227-19 (JUN 1987) and/or FAR §12.211/12.212 (Commercial Technical Data/Computer Software); and DFARS §252.227-7015 (NOV 1995) (Technical Data) and/or DFARS §227.7202 (Computer Software), as applicable. Contractor/Manufacturer is ESRI, 380 New York Street, Redlands, CA 92373-8100, USA.
@esri.com, 3D Analyst, ACORN, ADF, AML, ArcAtlas, ArcCAD, ArcCatalog, ArcCOGO, ArcData, ArcDoc, ArcEdit, ArcEditor, ArcEurope, ArcExplorer, ArcExpress, ArcGIS, ArcGlobe, ArcGrid, ArcIMS, ARC/INFO, ArcInfo, ArcInfo Librarian, ArcInfo—Professional GIS, ArcInfo—The World’s GIS, ArcLocation, ArcLogistics, ArcMap, ArcNetwork, ArcNews, ArcObjects, ArcOpen, ArcPad, ArcPlot, ArcPress, ArcQuest, ArcReader, ArcScan, ArcScene, ArcSchool, ArcSDE, ArcSdl, ArcSketch, ArcStorm, ArcSurvey, ArcTIN, ArcToolbox, ArcTools, ArcUSA, ArcUser, ArcView, ArcVoyager, ArcWatch, ArcWeb, ArcWorld, ArcXML, Atlas GIS, AtlasWare, Avenue, Business Analyst Online, BusinessMAP, Community, CommunityInfo, Data Automation Kit, Database Integrator, DBI Kit, EDN, ESRI, ESRI—Team GIS, ESRI—The GIS Company, ESRI—The GIS People, ESRI—The GIS Software Leader, FormEdit, Geographic Design System, ESRI BIS, Geography Matters, Geography Network, GIS by ESRI, GIS Day, GIS for Everyone, GISData Server, JTX, MapBeans, MapCafé, MapData, MapObjects, Maplex, MapStudio, ModelBuilder, MOLE, NetEngine, PC ARC/INFO, PC ARCPLOT, PC ARCSHELL, PC DATA CONVERSION, PC STARTER KIT, PC TABLES, PC ARCEDIT, PC NETWORK, PC OVERLAY, PLTS, Rent-a-Tech, RouteMAP, SDE, Site·Reporter, SML, Sourcebook·America, Spatial Database Engine, StreetEditor, StreetMap, Tapestry, the ARC/INFO logo, the ArcAtlas logo, the ArcCAD logo, the ArcCAD WorkBench logo, the ArcCOGO logo, the ArcData logo, the ArcData Online logo, the ArcEdit logo, the ArcEurope logo, the ArcExplorer logo, the ArcExpress logo, the ArcGIS logo, the ArcGIS Explorer logo, the ArcGrid logo, the ArcIMS logo, the ArcInfo logo, the ArcLogistics Route logo, the ArcNetwork logo, the ArcPad logo, the ArcPlot logo, the ArcPress for ArcView logo, the ArcPress logo, the ArcScan logo, the ArcScene logo, the ArcSDE CAD Client logo, the ArcSDE logo, the ArcStorm logo, the ArcTIN logo, the ArcTools logo, the ArcUSA logo, the ArcView 3D Analyst logo, the ArcView Business Analyst logo, the ArcView Data Publisher logo, the ArcView GIS logo, the ArcView Image Analysis logo, the ArcView Internet Map Server logo, the ArcView logo, the ArcView Network Analyst logo, the ArcView Spatial Analyst logo, the ArcView StreetMap 2000 logo, the ArcView StreetMap logo, the ArcView Tracking Analyst logo, the ArcWorld logo, the Atlas GIS logo, the Avenue logo, the BusinessMAP logo, the Community logo, the Data Automation Kit logo, the Digital Chart of the World logo, the ESRI Data logo, the ESRI globe logo, the ESRI Press logo, the Geography Network logo, the MapCafé logo, the MapObjects Internet Map Server logo, the MapObjects logo, the MOLE logo, the NetEngine logo, the PC ARC/INFO logo, the Production Line Tool Set logo, the RouteMAP IMS logo, the RouteMAP logo, the SDE logo, The World’s Leading Desktop GIS, Water Writes, www.esri.com, www.esribis.com, www.geographynetwork.com, www.gis.com, www.gisday.com, and Your Personal Geographic Information System are trademarks, registered trademarks, or service marks of ESRI in the United States, the European Community, or certain other jurisdictions.
Other companies and products mentioned in the ESRI Web site may be trademarks or registered trademarks of their respective trademark owners.
G33372_mg

ESRI • 380 New York Street • Redlands, CA 92373-8100 • 909-793-2853 • FAX 909-793-5953 • www.esri.com
Since 1969, ESRI has been giving customers around
the world the power to think and plan geographically.
The market leader in geographic information system
(GIS) solutions, ESRI software is used in more than
300,000 organizations worldwide including each
of the 200 largest cities in the United States, most
national governments, more than two-thirds of Fortune
500 companies, and more than 5,000 colleges and
universities. ESRI applications, running on more than one
million desktops and thousands of Web and enterprise
servers, provide the backbone for the world’s mapping
and spatial analysis. ESRI is the only vendor that provides
complete technical solutions for desktop, mobile, server,
and Internet platforms. Visit us at www.esri.com.