gis-based public services analysis based on …file.scirp.org/pdf/jgis_2013073015534389.pdf · on a...
TRANSCRIPT

Journal of Geographic Information System, 2013, 5, 378-395 http://dx.doi.org/10.4236/jgis.2013.54036 Published Online August 2013 (http://www.scirp.org/journal/jgis)
GIS-Based Public Services Analysis Based on Municipal Election Areas: A Methodological Approach for
the City of Makkah, Saudi Arabia
Gomaa M. Dawod, Meraj N. Mirza, Ramze A. Elzahrany, Khalid A. Al-Ghamdi Deaprtment of Geography, Umm Al-Qura University, Makkah, Saudi Arabia
Email: [email protected]
Received May 23, 2013; revised June 25, 2013; accepted July 15, 2013
Copyright © 2013 Gomaa M. Dawod et al. This is an open access article distributed under the Creative Commons Attribution Li-cense, which permits unrestricted use, distribution, and reproduction in any medium, provided the original work is properly cited.
ABSTRACT
The spatial fairness of public services is a major aspect in offering a healthy and cheerful living environment in a city. The Geographic Information System (GIS) technology has been applied to investigate the spatial distribution of some selected public services over the municipal election areas within Makkah city, Saudi Arabia. These services include education, health, security, religious, commercial, and sports services. The attained results show that except for reli- gious services, other public services are not quantitatively proportional with the population variations in Makkah. It has been found that the third election area posses almost one third of five public services and two thirds of the sport services. That might be attributed to the fact that the third election area possesses almost a quarter of the city population. But, although the first election area has a closer percentage of the total population, it does not include a comparable percent-age of public services. On a spatial basis, results of GIS spatial analysis (particularly the Euclidian distance, the mean distance band to a neighbor, the standard distance, the directional distribution ellipse, and the average nearest neighbor ratio tools) have concluded that there is inequity in the services distribution over municipal election areas in Makkah city. Consequently, it is recommended that local planners and decision makers should take the obtained results into consideration to achieve fair and better distribution of public services in the city. Keywords: Public Services; Spatial Analysis; GIS; Saudi Arabia
1. Introduction
Public services and facilities are essential for residents in any city all over the world in general, and in developing countries in particular. Governments start to rethink the delivery of public services in order to enhance their qual-ity and quantity, to meet public’s needs and expectations [1]. Improving efficiency of basic public services for residents has been recognized as one of the major ways of promoting sound human settlements, good health, and appropriate and decent living conditions. Assessing effi-ciency of public services is multidimensional and in-cludes several factors such as geographic and financial accessibility, availability, quantity, distribution, quality, and clients’ satisfaction. However, spatial distribution is of great importance. Thus, spatial analysis of public ser-vices distribution gains an increasing attention in the last decades from both geographic and environmental per-spectives [2]. Moreover, the issue of spatial equity of urban public facilities has proliferated recently from both
planning and geographic points of view, trying to arrive to the so-called spatial justice [3]. Diagnosing the current situation of a public service is quite essential in planning its new spatial locations in order to increase the service availability and accessibility to residents [4]. Geographic Information System (GIS) plays an important technical role in spatial analysis of geographic features. GIS has been utilized in a wide range of mapping and analysis applications all over the world in general, and in King-dom of Saudi Arabia (KSA) in particular. Such GIS ap-plications include, for instance, urban growth monitoring [5], flood management [6], and health services’ spatial analysis [7]. Concerning services spatial analysis, GIS has been applied in several studies. For example, Zhou et al. [8] have utilized GIS to identify and map the distribu-tion pattern of public and community facilities in a study area in four neighboring sub-districts in Beijing, China and to analyze their spatial equity. Moreover, Mavo et al. [9] investigated the utilization of GIS to assess accessi-bility of public transit in New Zealand. Similarly, GIS
Copyright © 2013 SciRes. JGIS

G. M. DAWOD ET AL. 379
was used to develop a site suitability model for social services in Atlanta city [10]. In addition, GIS has been applied to identify spatio-temporal gaps in public trans- portation services in Belgium [11]. In Saudi Arabia, pub- lic services are mainly provided by the government with significant attention to the holy city of Makkah. During the period 1990 to 2010, Makkah total residential area had been increased from 99.23 to 158.58 square kilome- ters, with 4.8% annual rate [5]. In addition, the annual population growth rate in KSA is almost 2.9%. Both growing rates emphasize the need for new public ser- vices in terms of quantities and spatial distribution. This paper utilizes GIS for mapping and analyzing the distri- bution of existing public services based on municipal election areas in Makkah.
2. The Study Area
Makkah city is located in the western region of the King- dom of Saudi Arabia (KSA), about 80 km east of the Red Sea (Figure 1). It extends from longitudes 39˚35'E to 40˚02'E, and from latitudes 21˚09'N to 21˚37'N. Makkah city is a sacred city for all Muslims; since it houses Al-Masjid Al-Haram (the Holy Mosque). All Muslim are expected to perform Hajj “pilgrimage” to Makkah once
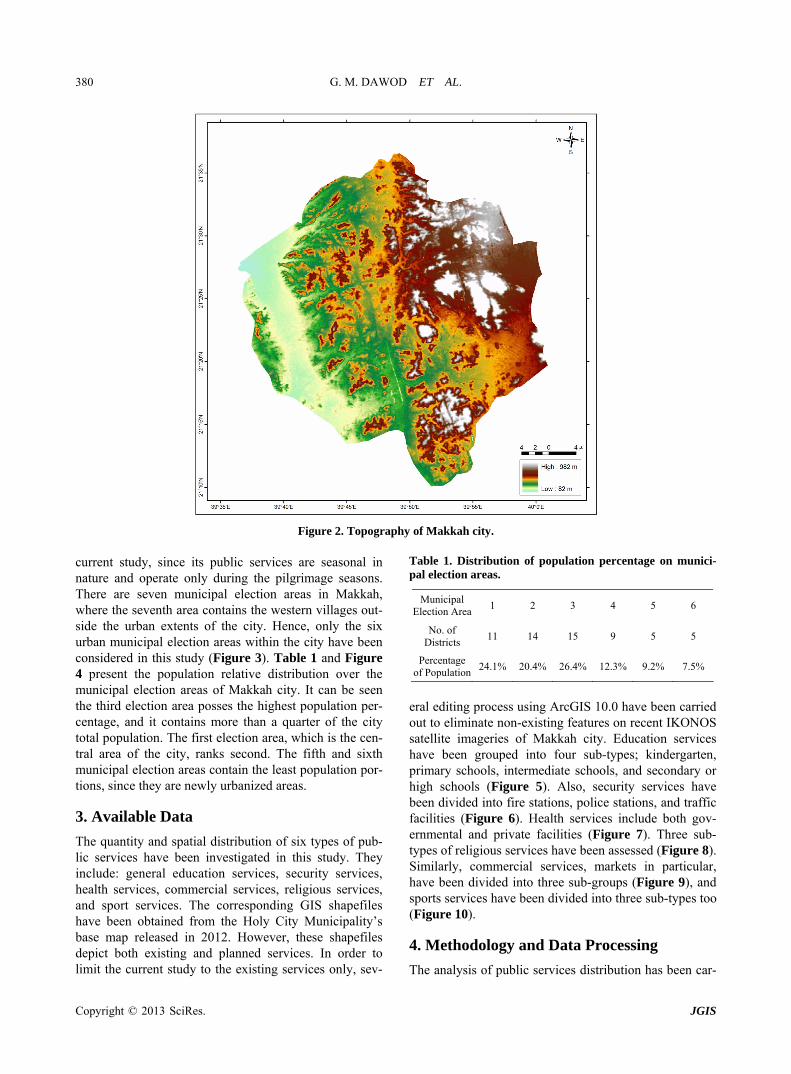
in their life time if they can afford it. Thus, million Mus-lims gather in Makkah yearly. Also, Muslims perform Omrah “a religious visit to Makkah” all over the years. The religious functionality of Makkah is an important factor to be considered when analyzing its services dis-tribution. For instance, there are several seasonal alloca-tions of public services, e.g. health and security services, in the holy sites. The seasonal services have been ex-cluded in the current research. Moreover, the topography of Makkah is complex, and several mountainous areas exist inside its metropolitan area. That is a vital element in investigating the spatial pattern of Makkah sprawl and service spatial locations. Terrain elevations in Makkah (Figure 2) range from 82 to 982 meters above sea level [12]. Al-Ghamdi et al. [5] have concluded that the urban growth in Makkah city (between 1947 and 2010) take a radial (or spoke) pattern. That is logically understood knowing that the holy mosque is considered the center of the city, and the central area around it has the highest population density since residents and pilgrims prefer to stay close to this holy mosque.
Makkah city is composed of 60 districts, one of them is a special area containing the holy sites of Mina, Muz-dalifa, and Arafat. This last district is excluded from the
Figure 1. Study area.
Copyright © 2013 SciRes. JGIS
G. M. DAWOD ET AL. 380
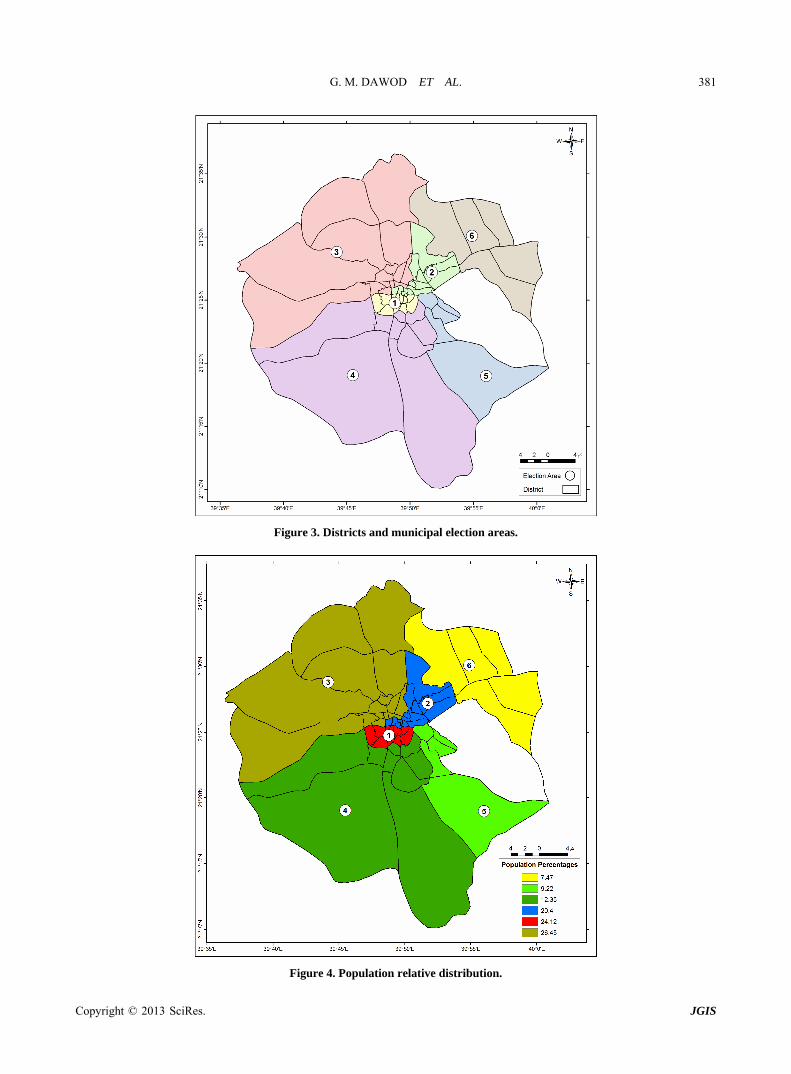
Figure 2. Topography of Makkah city. current study, since its public services are seasonal in nature and operate only during the pilgrimage seasons. There are seven municipal election areas in Makkah, where the seventh area contains the western villages out-side the urban extents of the city. Hence, only the six urban municipal election areas within the city have been considered in this study (Figure 3). Table 1 and Figure 4 present the population relative distribution over the municipal election areas of Makkah city. It can be seen the third election area posses the highest population per-centage, and it contains more than a quarter of the city total population. The first election area, which is the cen-tral area of the city, ranks second. The fifth and sixth municipal election areas contain the least population por-tions, since they are newly urbanized areas.
3. Available Data
The quantity and spatial distribution of six types of pub-lic services have been investigated in this study. They include: general education services, security services, health services, commercial services, religious services, and sport services. The corresponding GIS shapefiles have been obtained from the Holy City Municipality’s base map released in 2012. However, these shapefiles depict both existing and planned services. In order to limit the current study to the existing services only, sev-
Table 1. Distribution of population percentage on munici- pal election areas.
Municipal Election Area
1 2 3 4 5 6
No. of Districts
11 14 15 9 5 5
Percentage of Population
24.1% 20.4% 26.4% 12.3% 9.2% 7.5%
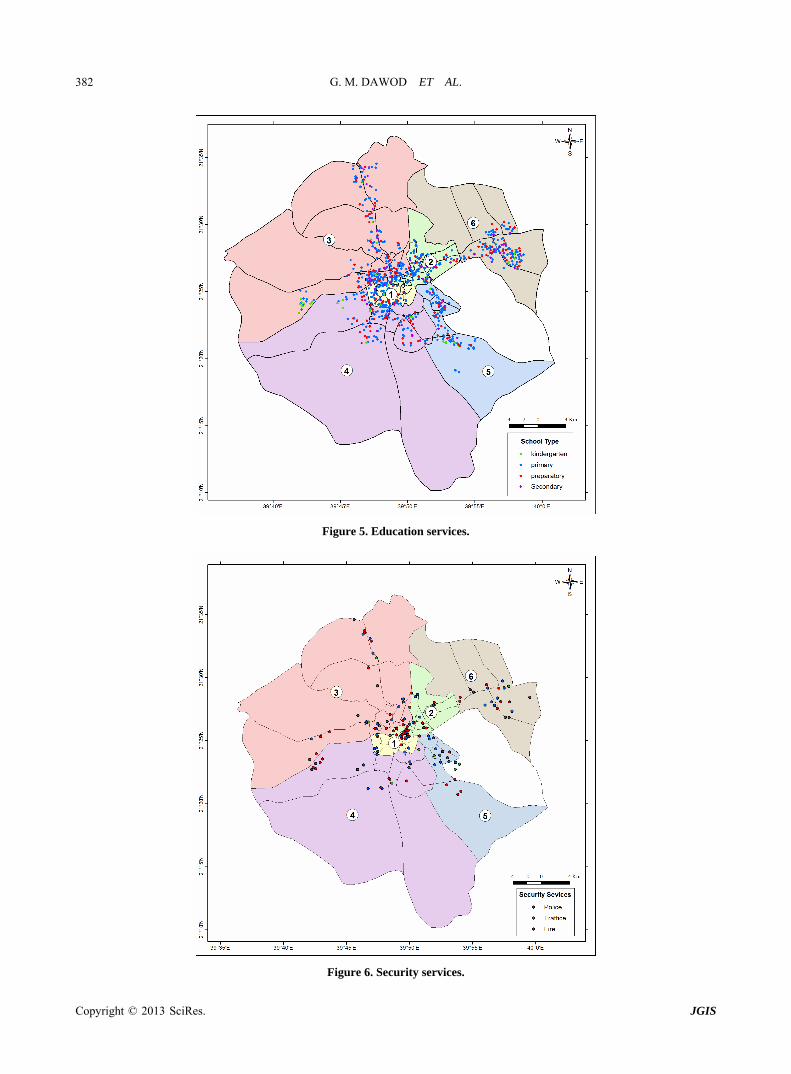
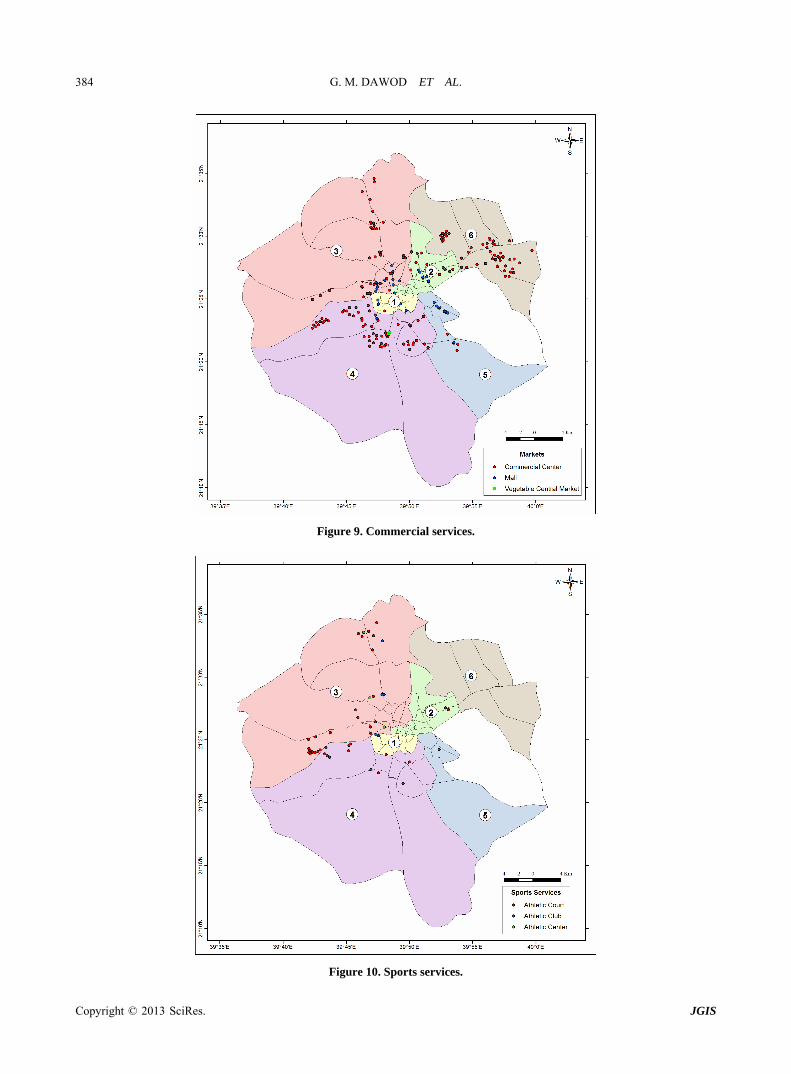
eral editing process using ArcGIS 10.0 have been carried out to eliminate non-existing features on recent IKONOS satellite imageries of Makkah city. Education services have been grouped into four sub-types; kindergarten, primary schools, intermediate schools, and secondary or high schools (Figure 5). Also, security services have been divided into fire stations, police stations, and traffic facilities (Figure 6). Health services include both gov-ernmental and private facilities (Figure 7). Three sub- types of religious services have been assessed (Figure 8). Similarly, commercial services, markets in particular, have been divided into three sub-groups (Figure 9), and sports services have been divided into three sub-types too (Figure 10).
4. Methodology and Data Processing
The analysis of public servic stribution has been car- es di
Copyright © 2013 SciRes. JGIS
G. M. DAWOD ET AL. 381
Figure 3. Districts and municipal election areas.
Figure 4. Population relative distribution.
Copyright © 2013 SciRes. JGIS
G. M. DAWOD ET AL. 382
Figure 5. Education services.
Figure 6. Security services.
Copyright © 2013 SciRes. JGIS

G. M. DAWOD ET AL. 383
Figure 7. Health services.
Figure 8. Religious services.
Copyright © 2013 SciRes. JGIS
G. M. DAWOD ET AL. 384
Figure 9. Commercial services.
Figure 10. Sports services.
Copyright © 2013 SciRes. JGIS
G. M. DAWOD ET AL.
Copyright © 2013 SciRes. JGIS
385
mulative frequency curve that compares the distribution of a specific variable with the uniform distribution that represents equality. This equality distribution is repre-sented by a diagonal line, and the greater the deviations of the Lorenz curve from this line, the greater the ine-quality. By putting commutative proportion of a particu-lar public service in the y axis and commutative propor-tion of population of the election area in the x axis, the area of equality is being calculated. A low Gini coeffi-cient indicates a more equal distribution, with 0 corre-sponding to complete equality. While higher Gini coeffi-cients indicate more unequal distributions, with 1 corre-sponding to complete inequality. In addition, correlation and geographically weighted regression analysis have been performed to investigate the statistical characteris-tics between the public services quantity and distribution and the population variations in the municipal election areas. Then, a prediction has been attained to estimate the required public services in Makkah city in 2020. The spatial analysis stage includes the utilization of selected four main spatial tools available in ArcGIS. The Euclid- ian distance, the standard distance, the directional distri- bution ellipse, and the average nearest neighbor ratio. The Euclidian distance tool calculates for each cell or feature the zone of the closest source location in Euclid-ean distance. Hence, the attained raster represents the spatial variation of a specific public service over the mu-nicipal election areas of Makkah city. The standard dis-tance and the directional distribution ellipse are spatial analysis tools measure the geographic distribution. On the other hand, the directional distribution tool measures whether a distribution of features exhibits a directional trend, i.e. whether features are farther from a specified point in one direction than in another direction.
ried out on both statistical and spatial scales within the municipal election areas of Makkah. First, ArcGIS has been used to split each service’s spatial distribution over the municipal election areas. Thus, the quantity of each sub-type of the utilized public services has been obtained. So, a percentage portion has been computed for each sub-category of a specific service for each election area. For more simplicity, these percentage figures have been scaled by 10 in order to obtain a simple measure on a scale ranges from 1 to 10. Let us denote such a scale Ri, j, where i denotes a public service, and j denotes sub-types within that service. So, i in our study ranges from 1 to 6 (number of available public services types), and j varies from 1 to 7 according to numbers of sub-categories in each public service. Another factor, Ti, has been com-puted that represents, on a scale from 1 to 10, the relative portion of each public service located within each elec-tion area. That means that Ti accounts generally for a specific service, while Ri, j accounts for sub-types within each service. Next, an overall indicator has been com-puted to describe the availability and relative distribution of public services over the municipal election areas in Makkah city. This indicator is called Public Services Index (PSI) as:
6 7
i 1 j 1PSI 1 m Ri, j
(1)
where m equals the total numbers of public services’ sub-types (that is 24 in the current study). PSI, also, has a value ranges from 0 to 10 for simplicity, and the sum of PSI's indices equals 10 for a certain public service. Thus, it can be though of as a measure of justifiable distribution of public services over municipal election areas in Mak-kah city.
In the next processing stage, the equity issue of public services distribution, with respect to population varia-tions, has been investigated. In this regard, the Lorenz curve and the Gini index have been utilized. The Gini index or coefficient is based on the Lorenz curve, a cu-
5. Results and Discussion
Starting with the statistical analysis, Table 2 and Figure 11 present the index of relative portion of each public
Table 2. Relative distribution of public services (on a scale 0 to 10).
Municipal election areas Public Service
1 2 3 4 5 6
Education 1.2 1.5 2.9 1.6 1.3 1.6
Health 1.1 1.3 2.9 2.2 1.1 1.4
Security 1.4 2.0 2.6 1.3 1.1 1.7
Religious 1.9 1.7 2.7 1.6 0.8 1.4
Commercial 0.3 0.9 2.5 3.1 0.7 2.5
Sports 0.6 0.4 6.5 2.3 0.2 0.0
Overall Average Scale (PSI index) 1.1 1.2 3.5 1.8 1.1 1.3
G. M. DAWOD ET AL. 386
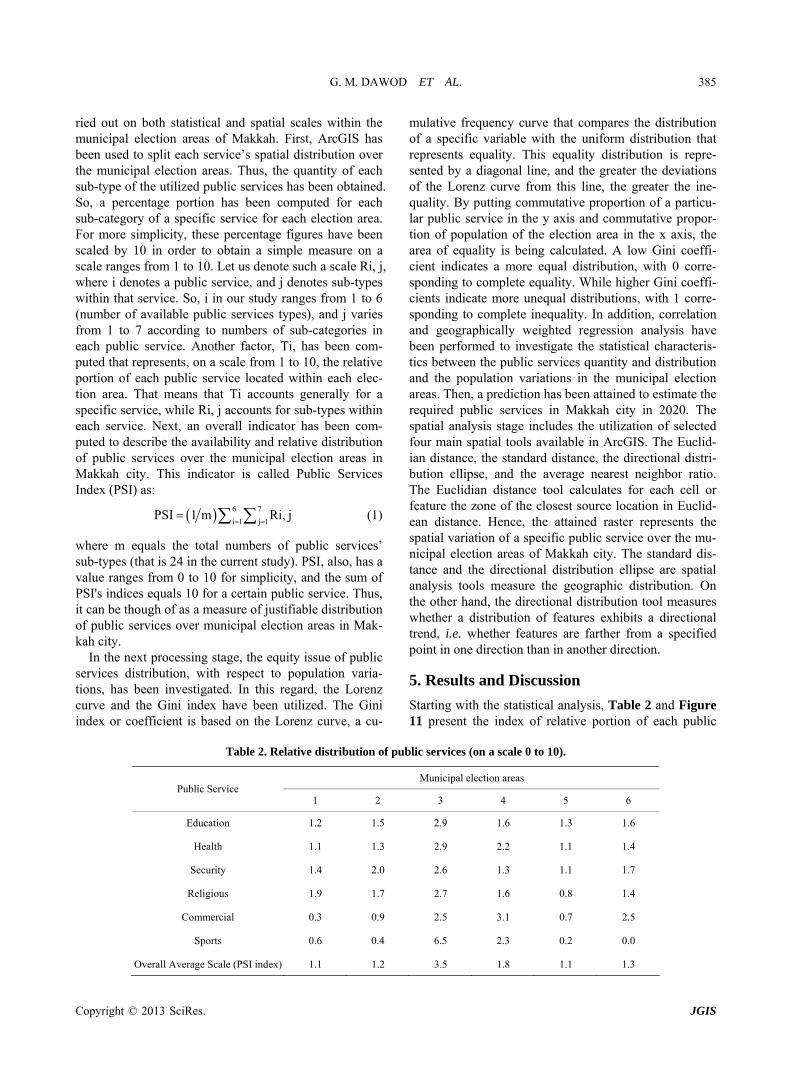
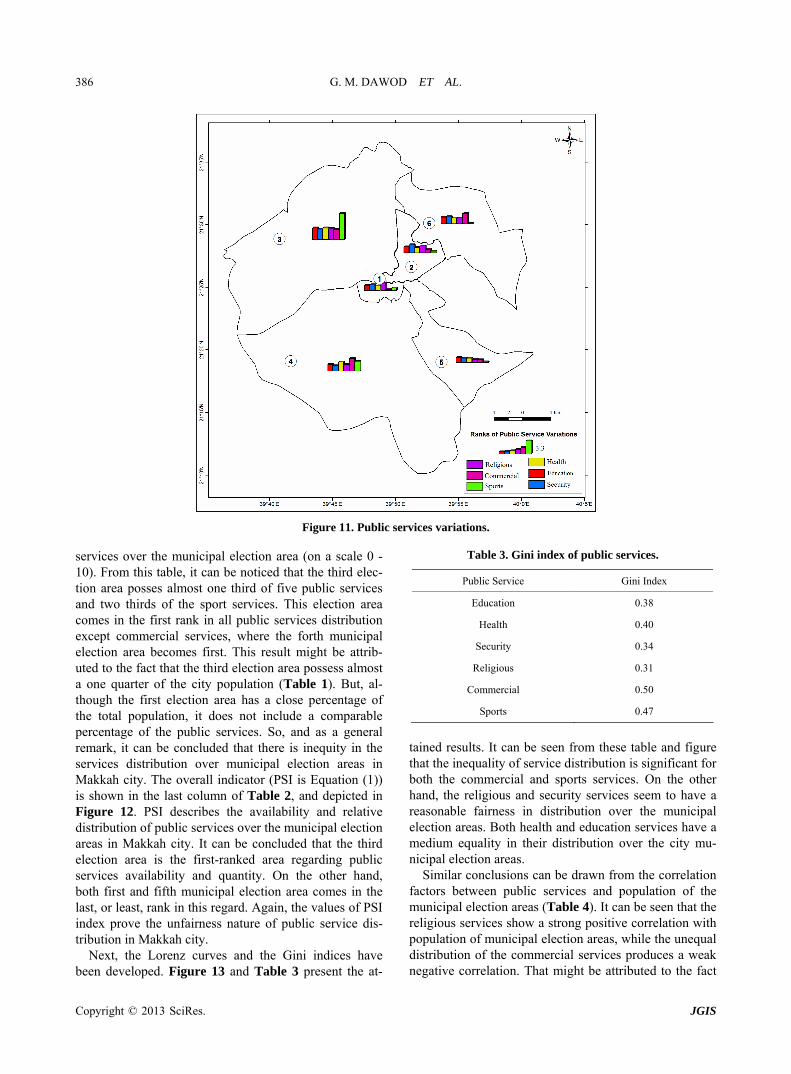
Figure 11. Public services variations. services over the municipal election area (on a scale 0 - 10). From this table, it can be noticed that the third elec-tion area posses almost one third of five public services and two thirds of the sport services. This election area comes in the first rank in all public services distribution except commercial services, where the forth municipal election area becomes first. This result might be attrib-uted to the fact that the third election area possess almost a one quarter of the city population (Table 1). But, al-though the first election area has a close percentage of the total population, it does not include a comparable percentage of the public services. So, and as a general remark, it can be concluded that there is inequity in the services distribution over municipal election areas in Makkah city. The overall indicator (PSI is Equation (1)) is shown in the last column of Table 2, and depicted in Figure 12. PSI describes the availability and relative distribution of public services over the municipal election areas in Makkah city. It can be concluded that the third election area is the first-ranked area regarding public services availability and quantity. On the other hand, both first and fifth municipal election area comes in the last, or least, rank in this regard. Again, the values of PSI index prove the unfairness nature of public service dis-tribution in Makkah city.
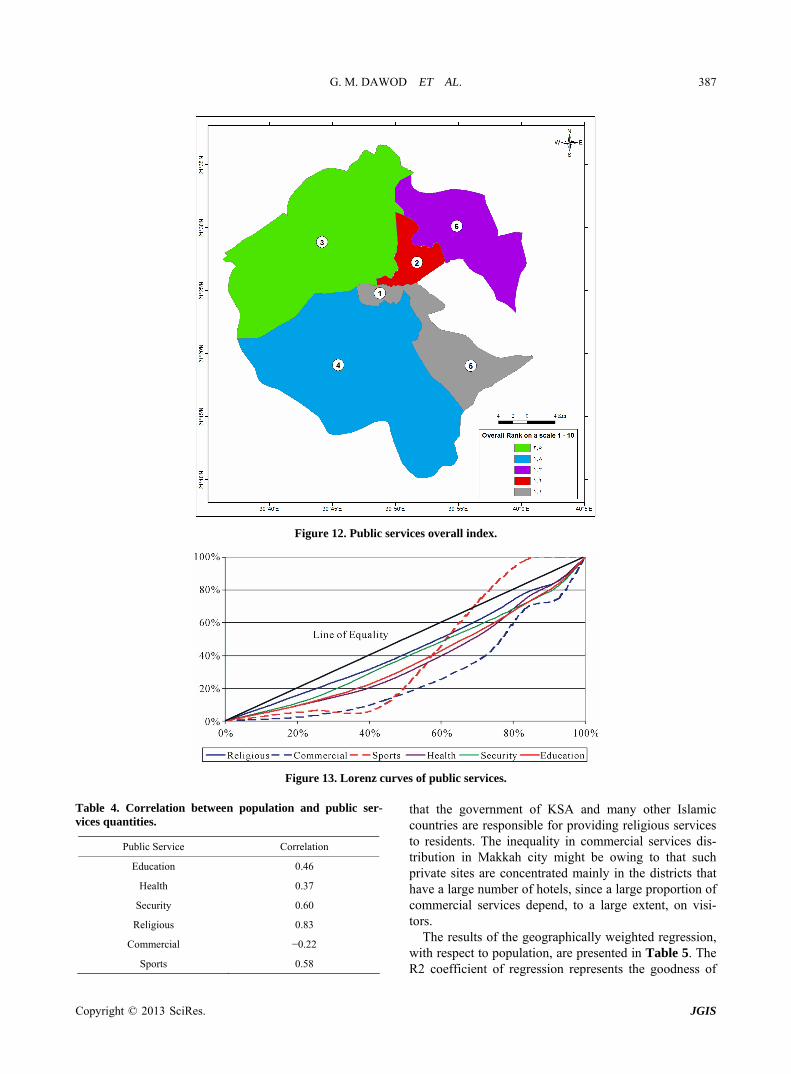
Next, the Lorenz curves and the Gini indices have been developed. Figure 13 and Table 3 present the at-
Table 3. Gini index of public services.
Public Service Gini Index
Education 0.38
Health 0.40
Security 0.34
Religious 0.31
Commercial 0.50
Sports 0.47
tained results. It can be seen from these table and figure that the inequality of service distribution is significant for both the commercial and sports services. On the other hand, the religious and security services seem to have a reasonable fairness in distribution over the municipal election areas. Both health and education services have a medium equality in their distribution over the city mu-nicipal election areas.
Similar conclusions can be drawn from the correlation factors between public services and population of the municipal election areas (Table 4). It can be seen that the religious services show a strong positive correlation with population of municipal election areas, while the unequal distribution of the commercial services produces a weak negative correlation. That might be attributed to the fact
Copyright © 2013 SciRes. JGIS
G. M. DAWOD ET AL. 387
Figure 12. Public services overall index.
Figure 13. Lorenz curves of public services. Table 4. Correlation between population and public ser-vices quantities.
Public Service Correlation
Education 0.46
Health 0.37
Security 0.60
Religious 0.83
Commercial −0.22
Sports 0.58
that the government of KSA and many other Islamic countries are responsible for providing religious services to residents. The inequality in commercial services dis-tribution in Makkah city might be owing to that such private sites are concentrated mainly in the districts that have a large number of hotels, since a large proportion of commercial services depend, to a large extent, on visi-tors.
The results of the geographically weighted regression, with respect to population, are presented in Table 5. The R2 coefficient of regression represents the goodness of
Copyright © 2013 SciRes. JGIS

G. M. DAWOD ET AL. 388
Table 5. Geographically weighted regression between popu- lation and public services quantities.
Public Service Regression Intercept
Regression Coefficient
R2 Coefficient
Education 101.83 0.000272 0.21
Health 28.36 0.000065 0.14
Security 16.32 0.000053 0.36
Religious 121.45 0.001000 0.70
Commercial 45.34 −0.000050 0.05
Sports −6.31 0.000065 0.34
the attained regression equation since it determines the percentage of the variations in the input data that can be modeled by the regression formula. Thus, it can con-cluded that the attained regression equations are of little goodness for all public services except for religious ser-vices only. Again, this is another statistical evidence that there is dissimilarity of public services distribution over the municipal election areas in Makkah city. So, such regression equations could not be appropriate for com-puting projected numbers of public services in Makkah city. In this regard, another concept has been utilized. First, the number of individuals correspond to a single public service in each election area is computed. The average of these figures, over all municipal election areas, is then obtained. Based on the average population growth rate in KSA (which is 2.9% annually), the population of Makkah city in year 2020 has been computed and was found to be 1,947,330. Next, the average public service/ capita is utilized to estimate total number of each public service type in year 2020. As a conclusion, it has been found that 135, 31, 25, 417, 59, and 74 new services are needed for education, security, health, religious, com-mercial, and sports services respectively. However, the distribution of these new public services should be on a justice basis regarding population of the municipal elec-tion areas in Makkah.
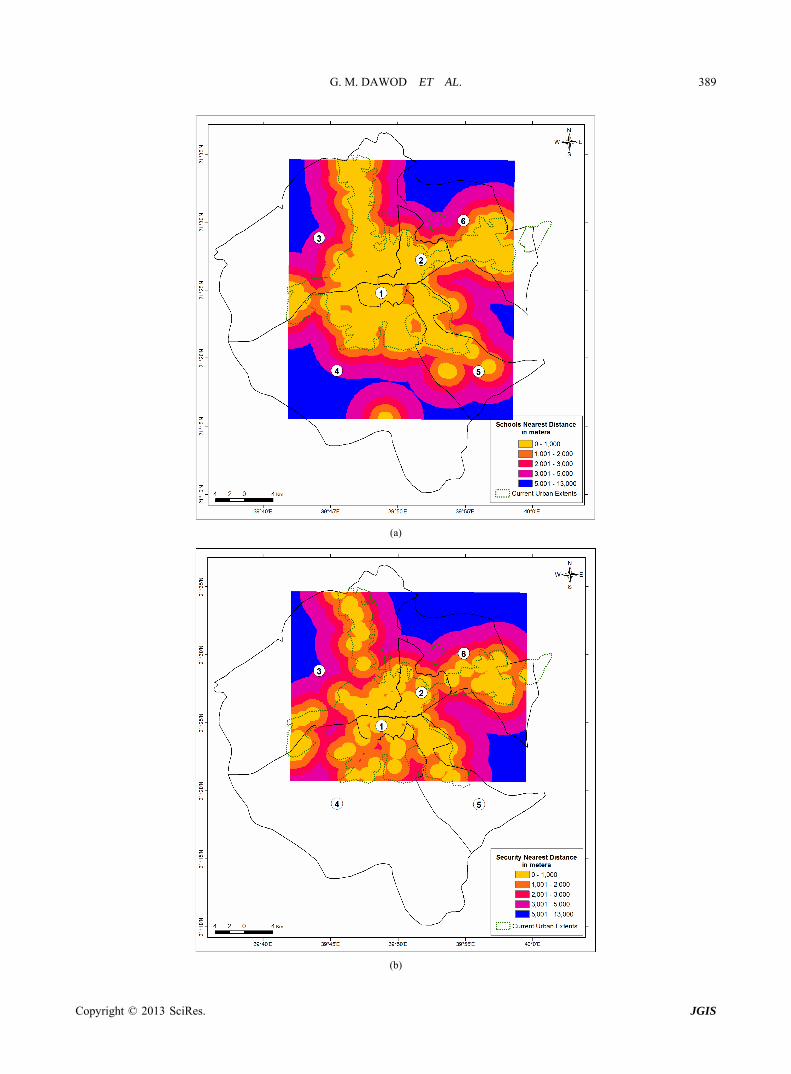
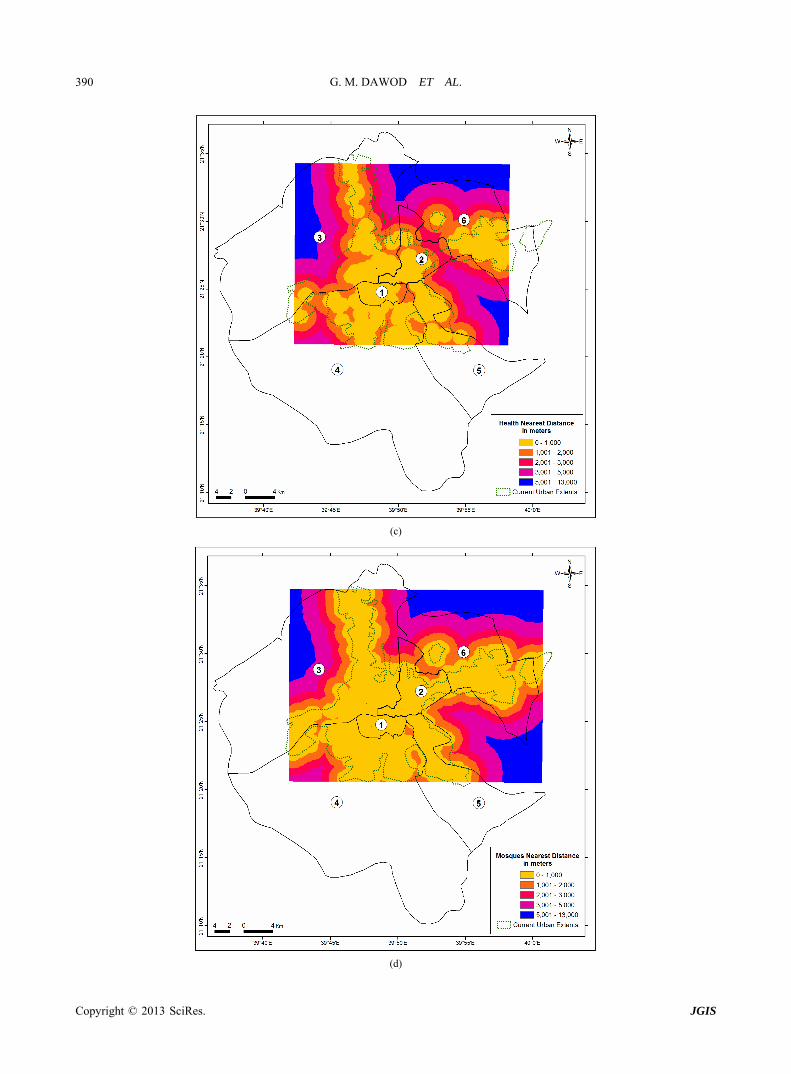
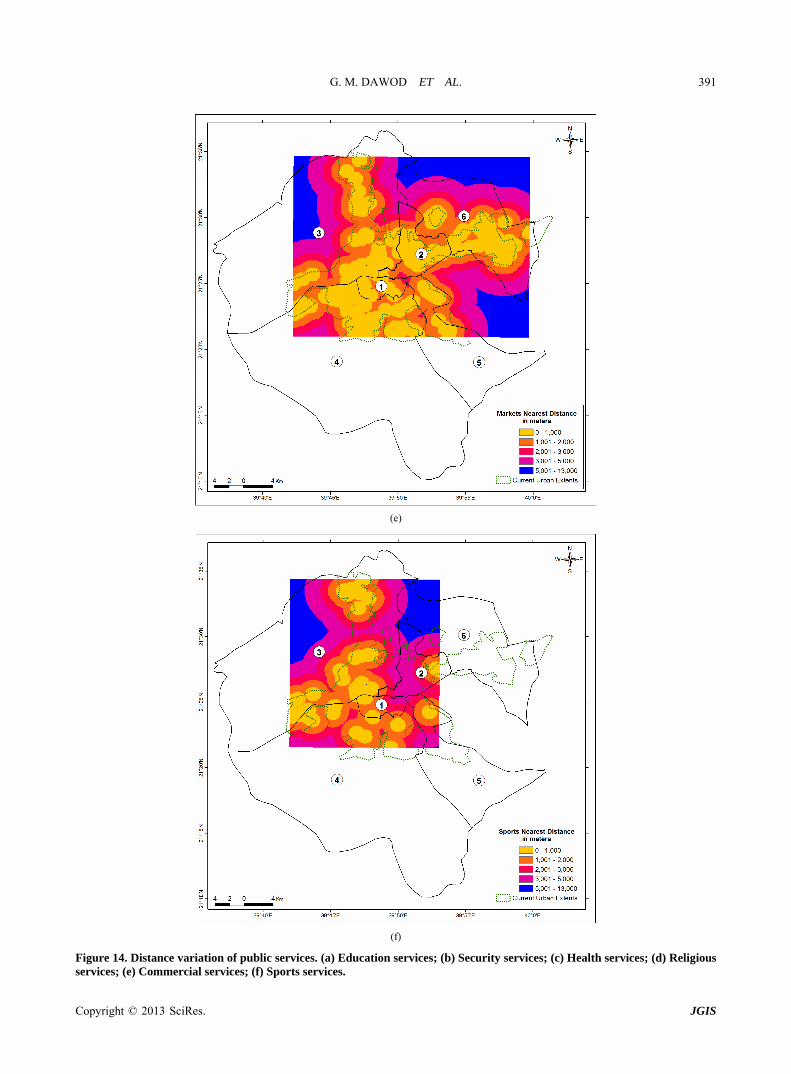
The second group of the accomplished results express the GIS-based spatial analysis of public service distribu-tion. First, the results of the Arc GIS Euclidian-distance tool are shown in Figures 14(a)-(f) for each investigated public service. Additionally, the results of the distance- band-from-neighbor tool are tabulated in Table 6.
Analyzing Table 6 reveals that the sports public ser-vices have the maximum mean distance neighbors, while the religious services show the minimum value. Inspect-ing the figures of Euclidian distance variation between neighbors conclude that the interval 0 - 1000 meters (the yellow interval) is dominant for all public services except for sports services. The inequality of the services spatial
distribution, over the municipal election areas, is obvi- ously seen in these figures.
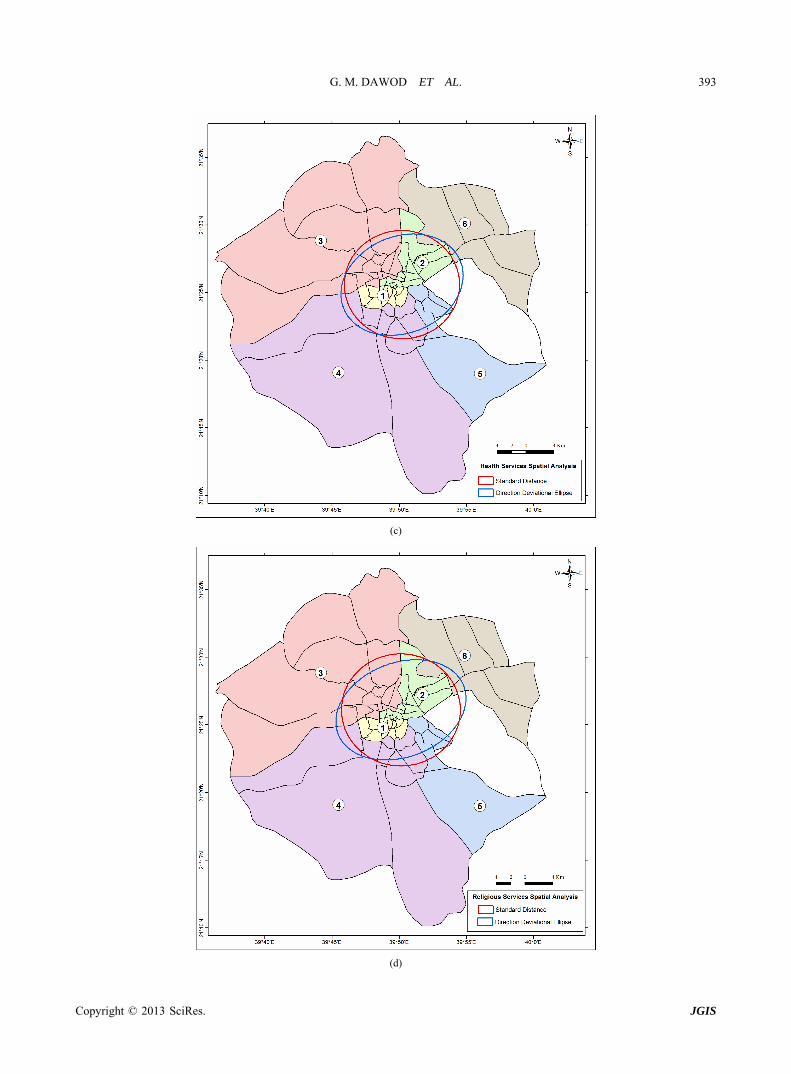
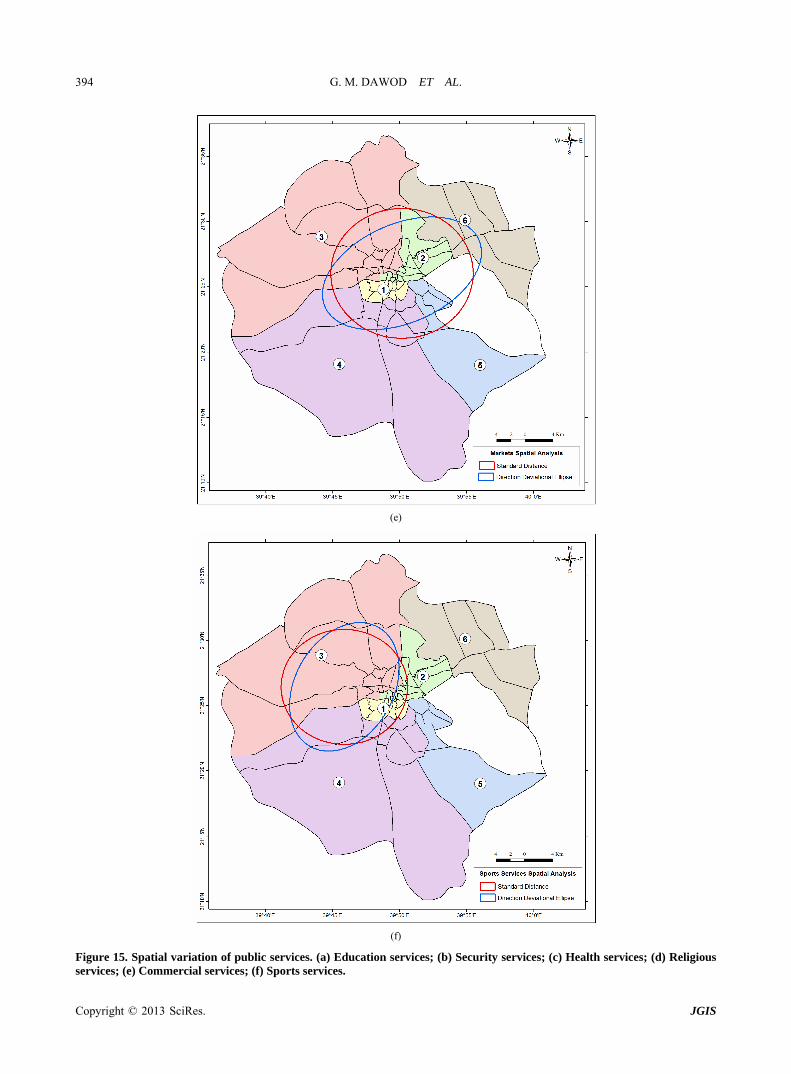
Furthermore, the results of the Arc GIS standard dis- tance, deviational distribution ellipse (both at one stan- dard-deviation level), and nearest neighbor ratio tools are presented in Table 7 and depicted in Figures 15(a)-(f) for each investigated public service. It can be noticed that the standard circles for all public service are centered on the city central area (the holy mosque area), which is quit logical since this area has the highest population and tourists density. The only exception is found in the spa-tial distribution of the sports services where the centers of both the standard circle and the deviational ellipse have been moved northwest (Figure 15(f)). The attained results of the nearest neighbor ration have been com- puted using the total area of the urbanized extents of Makkah city, which equals 291.45 square kilometers. That means that these results are realistic rather than us- ing the sum area of the six election regions. The less- than-one values of the nearest neighbor ratios indicate that the spatial pattern of distribution of all public service is the clustered pattern. That concludes the previously- achieved remark that the public services in Makkah city are not uniformly distributed in space, due to its topog- raphy.
Table 6. Distance to a neighbor for public services.
Public Service Maximum Distance to a Neighbor (m)
Average Distance to a Neighbor (m)
Education 2944 223
Health 6045 440
Security 2046 289
Religious 3901 205
Commercial 1861 496
Sports 11715 1061
Table 7. Spatial statistics for public services.
Deviational Ellipse Public Service
Standard Distance
(m) Semi Major
Axis (m)
Semi Minor
Axis (m)
Rotation Angle
Nearest Neighbor
Ratio
Education 7889 8748 6924 74.60 0.73
Health 7394 8172 6521 61.70 0.73
Security 8332 9509 6958 76.10 0.65
Religious 7638 8717 6378 65.30 0.98
Commercial 9184 11021 6874 61.90 0.87
Sports 8126 9518 6438 23.60 0.75
Copyright © 2013 SciRes. JGIS
G. M. DAWOD ET AL.
Copyright © 2013 SciRes. JGIS
389
(a)
(b)
G. M. DAWOD ET AL. 390
(c)
(d)
Copyright © 2013 SciRes. JGIS
G. M. DAWOD ET AL. 391
(e)
(f)
Figure 14. Distance variation of public services. (a) Education services; (b) Security services; (c) Health services; (d) Religious services; (e) Commercial services; (f) Sports services.
Copyright © 2013 SciRes. JGIS

G. M. DAWOD ET AL. 392
(a)
(b)
Copyright © 2013 SciRes. JGIS
G. M. DAWOD ET AL. 393
(c)
(d)
Copyright © 2013 SciRes. JGIS
G. M. DAWOD ET AL. 394
(e)
(f)
Figure 15. Spatial variation of public services. (a) Education services; (b) Security services; (c) Health services; (d) Religious services; (e) Commercial services; (f) Sports services.
Copyright © 2013 SciRes. JGIS

G. M. DAWOD ET AL.
Copyright © 2013 SciRes. JGIS
395
6. Conclusion
Improving the availability of public services to residents is a key element of the Saudi government development plans. Makkah city is inhibited by more than a million. It is also considered the most important city for all Muslims; millions of Muslims visit it annually. This paper has ap-plied GIS technology to investigate the statistical and spatial distributions of some selected public services of municipal election areas in Makkah. Several GIS spatial analysis tools, along with statistical tests, have been util- ized to precisely depict the current situation of public services variations and to project the needed public ser- vices in the year 2020. Several accomplished results emphasis the inequality nature of the current public ser- vice distribution over municipal election areas. For ex- ample, most public services show weak correlation with population distribution, and the general spatial pattern of the services distribution was found to be clustered. In particular, the sports services show unfairness in their spatial distribution over current the urbanized extents of Makkah. This study presents a methodological approach for analyzing the spatial distribution of public services in a city based on municipal election areas. Consequently, such a new GIS-based approach could stimulate re- searchers and planners in other Saudi cities. Thus, it is recommended that the accomplished results should be considered, by local decision makers, in the future city planning in order to afford more justice availability of public services.
REFERENCES [1] C. Carvalho, C. Brito, and J. Cabral, “Towards a Con-
ceptual Model for Assessing the Quality of Public Ser- vices,” International Review on Public and Nonprofit Mar- keting, Vol. 7, No. 1, 2010, pp. 69-86.
[2] R. Elzahrany, “Geographical Distribution of Health Care Services in Makkah Al-Mukarramah Province (in Ara- bic),” Research Papers in Geography, Saudi Geographi- cal Society, No. 55, 2003, 58 p.
[3] H. Dadashpoor and F. Rostami, “Measurement of Inte- grated Index of Spatial Justice in the Distribution of Ur-
ban Public Services Based on Population Distribution, Accessibility and Efficiency in Yasuj City,” Urban-Re- gional Studies and Research Journal, Vol. 3, No. 10, 2011, pp. 1-4.
[4] A. Singh and Kaish, “Exploring the Provision and Acces- sibility to Urban Basic Services in the Slums of a Me- dium Sized City of India,” Global Advanced Research Journal of Geography and Regional Planning, Vol. 2, No. 2, 2013, pp. 19-28.
[5] K. Al-Ghamdi, M. Mirza, R. Elzahrany and G. Dawod, “GIS Evaluation of Urban Growth and Flood Hazards: A Case Study of Makkah City, Saudi Arabia,” FIG Working Week, Rome, 6-10 May 2012.
[6] G. Dawod, M. Mirza and K. Al-Ghamdi, “GIS-Based Spa- tial Mapping of Flash Flood Hazards in Makkah City, Saudi Arabia,” Journal of Geographic Information Sys- tem, Vol. 3, No. 3, 2011, pp. 217-223. doi:10.4236/jgis.2011.33019
[7] R. Elzahrany, “Auto Spatial Correlation of Health Ser- vices Distribution in Jeddah City (in Arabic),” Journal of Gulf and Arabian Peninsula Studies, No. 123, 2005, pp. 193-267.
[8] S. Zhou, Y. Cheng, M. Xiao and X. Bao, “Assessing the Location of Public-and-Community Facilities for the Eld- erly in Beijing, China,” GeoJournal, Vol. 78, No. 3, 2012, pp. 539-551. doi:10.1007/s10708-012-9450-1
[9] S. Mavoa, K. Witten, T. McCreanor and D. O’Sullivan, “GIS Based Destination Accessibility via Public Transit and Walking in Auckland, New Zealand,” Journal of Transport Geography, Vol. 20, No. 1, 2012, pp. 15-22.
[10] C. Case and T. Hawthorne, “Served or Unserved? A Site Suitability Analysis of Social Services in Atlanta, Geor- gia Using Geographic Information Systems,” Applied Ge- ography, Vol. 38, 2013, pp. 96-106. doi:10.1016/j.apgeog.2012.11.012
[11] T. Neutens, M. Delafontaine, D. Scott and P. De Maeyer, “A GIS-Based Method to Identify Spatiotemporal Gaps in Public Service Delivery,” Applied Geography, Vol. 32, No. 2, 2012, pp. 253-264.
[12] M. Mirza, G. Dawod and K. Al-Ghamdi, “Accuracy and Relevance of Digital Elevation Models for Geomatics Ap- plications: A Case Study of Makkah Municipality, Saudi Arabia,” International Journal of Geomatics and Geosci- ences, Vol. 1, No. 4, 2011, pp. 803-812.