gis-based mapping of flood vulnerability and risk in … · exposure of the communities and to...
TRANSCRIPT
INTERNATIONAL JOURNAL OF GEOMATICS AND GEOSCIENCES
Volume 6, No 3, 2015
© Copyright 2010 All rights reserved Integrated Publishing services
Research article ISSN 0976 – 4380
Submitted on November 2015 published on February 2016 1653
GIS-Based Mapping of Flood Vulnerability and Risk in the Bénin Niger
River Valley Idelbert Dagbégnon Behanzin1, Michael Thiel2, Joerg Szarzynski3, Michel Boko4
1- West African Science Service Center on Climate Change and Adapted Land Use,
Department of Geography, University of Lomé, Togo
2- Department of Remote Sensing, Institute of Geography and Geology, University of
Wuerzburg, Germany
3- United Nations University - Institute for Environment and Human Security, Germany
4- Pierre Pagney Climatology Laboratory, FLASH, University of Abomey – Calavi, Bénin
ABSTRACT
In recent decades, flood disaster has been occurring frequently in West Africa. Located in the
heart of West Africa, the Niger River Basin has not been spared the flood hazard that is
threatening human security in the region. Those living in flood affected areas face the risk of
severe damage to their infrastructure, the loss of their livelihood as well as a substantial threat
of injury and death. These hazards can hamper efforts to escape poverty and set back
development gains. Despite the threat, there is very scant research documenting flood risk.
Without flood risk analysis, opportunities to reduce vulnerability could be missed and the
impact of development work may be undermined. With these concerns in mind, this study
addresses flood vulnerability and risk in the Bénin Niger River Valley including the two
municipalities Karimama and Malanville. A GIS-based mapping and theory-driven indicator
approach was applied. The assessment revealed that almost 90 % of the district is located in a
flood hazard footprint and is consequently exposed to a high flood risk. However the
municipalities are not exposed to the same degree of flood risk due to their different degrees of
vulnerability. The vulnerability indicators chosen in the framework of this study show that the
municipality of Karimama is more vulnerable than the municipality of Malanville. This
discrepancy is due to higher poverty rates and weaker pre-existing physical, social, economic
and environmental vulnerability conditions present in Karimama. The risk assessment revealed
that 70% of the districts in the area are at high flood risk. In view of potential extreme climate
events, we assert that there is an urgent need to have high resolution data in order to deepen
research about the flood risk in the Niger River basin.
Keywords: Bénin Niger River, Flood, Vulnerability, Risk, GIS-Based mapping
1. Introduction
Since the 1970s, West African communities have been experiencing the impact of hydrological
hazards on their livelihood (Oyerinde et al., 2014). Despite the general decrease in annual
rainfall in West Africa from the 1960s to the 1990s (CEDEAO-ClubSahel/OCDE/CILSS,
2008; Descroix et al., 2013; Okpara et al., 2013; Ly et al., 2013), there has been a partial rainfall
resumption in the region since the turn of the century. (New et al., 2006; Aich et al., 2014).
This increase has been observed on the Guinean Coast (AMCEN, 2011) and in the West
African Sahel (Tschakert et al., 2010; Sarr, 2011). Floods frequently affect socio-ecological
systems and the damage can include: death, destructions of farms and socioeconomic
infrastructure, disruption of socioeconomic activities, losses of properties and disease, etc.

GIS-based mapping of flood vulnerability and risk in the Bénin Niger River valley
Idelbert Dagbégnon Behanzin et al.,
International Journal of Geomatics and Geosciences
Volume 6 Issue 3, 2015
1654
According to recent climate projections, heavy precipitation is projected to increase
substantially in West Africa (IPCC, 2013). The projected increase in the frequency and
intensity of heavy precipitation may increase the probability of flood risk.
The Niger River basin, is also experiencing flood events. Goulden and Few (2011) state that
since there was a partial rainfall recovery in the late 20th century, floods associated with intense
rainfall became more common in the region from 1995 to 2010. Floods have become the most
common natural disaster in the Niger River Basin (Okpara et al., 2013), with major impacts on
human security including damage to production, communication systems as well as people’s
livelihood and health.
In the Bénin Niger River Valley, similar problems were observed. This region experienced
significant socio-economic damages and losses of life due to flood events. In 2010, about
14,911 people were affected (WB/UNDP, 2011). In 2012, eight deaths were reported, more
than 2,888 homes affected with at least 43,857 victims and 23,640 ha of cropland (rice, maize,
sorghum, pearl millet, and vegetable) were destroyed (www.foodsecuritycluster.net). In 2013,
more than 21,500 ha of crops were destroyed, with 9,200 households affected (BAD, 2014).
The inhabitant living within the area, in 2013 estimated about 234,681 (INSAE, 2013),
regularly suffer from floods effects.
Research activities have been carried out in the Niger River basin at different time scales and
spaces. But most hydrological studies have focused on streamflow and runoff processes.
Research studies about flood risk in the basin have been insufficient (Okpara et al., 2013; Aich
et al., 2014), despite the threats they pose to human security Information concerning the Benin
portion of the river valley has been particularly lacking. There is no flood risk assessment in
the Bénin Niger River. Therefore flood risk analysis in the region is still an area of
investigation. This underscores the justification of the present study.
Various studies (Ezemonye and Emeribe, 2011; Kebede, 2012; Abah, 2013; Isma’il and
Saanyol, 2013; ICIMOD and UNESCO, 2007) have shown that Geographic Information
Systeme (GIS) is a valuable tool for flood risk mapping. Alkema (2004) argues that Remote
Sensing and GIS techniques are vital for flood risk assessment studies, especially in areas
where data is scarce or outdated. The GIS could be used for flood risk analysis and mapping in
Bénin Niger River Basin which is located in a remote area, where there is less published
information and the probability to have updated and reliable data is weak. It is in this context
that this paper seeks to contribute to the existing body of knowledge by applying GIS-based
method to assess the flood vulnerability and risk profile of the Bénin portion of the Niger River
Basin.
2. Study area
Located in the most northerly part of Bénin in the Alibori department, the research area is a
region of the middle Niger River basin in the Sahelo-Sudanian zone, between the parallels 11°5'
and 12°25' latitude north and meridians 2°43’ and 3°40’ longitude east (Figure 1). It has an
average annual rainfall of between 700 and 900 mm. The area, called “Bénin Niger River
Valley”, expanding from the extreme north-west to extreme north-east, comprises the
municipalities of Karimama and Malanville with ten districts (Karimama, Birni Lafia, Monsey,
Kompa, Bogo-Bogo, Malanville, Garou, Guéné, Madécali and Toumboutou) with an area of
about 9118 km2 and a population about 234,681 (INSAE, 2013). It is bordered by the Niger
River Course in the north, the municipalities of Banikoara, Kandi and Ségbana in the south,

GIS-based mapping of flood vulnerability and risk in the Bénin Niger River valley
Idelbert Dagbégnon Behanzin et al.,
International Journal of Geomatics and Geosciences
Volume 6 Issue 3, 2015
1655
the Republics of Burkina-Faso and Niger in the west and the Federal Republic of Nigeria in
the east.
Figure 1: Benin Niger River Valley
3. Methodology
3.1 Dataset and sources
The spatial distribution of the intensity level of the flood hazard index layer for Benin at 1km,
was extracted from the first volume (2nd edition) of the World Health Organization (WHO) e-
atlas of disaster risk for the African Regions. The 30 meters SRTM Digital Elevation Model
(DEM) downloaded from USGS website has been used to express the elevation and the
orientation of the slope of the area. The administrative boundaries and road network layers are
accessible from the Humanitarian Response Info website while the landcover, the hydrography
layers and the environmental indicators have been obtained from the “Centre National de
Télédétection et de Cartographie” of Benin. Existing census data (socio-economic, physical)
(Table 3) was collected from “Institut National de la Statistique et de l’Analyse Économique”.
Field surveys were carried out in order to obtain more detailed information about the flood
exposure of the communities and to complete vulnerability indicators chosen from the census
data. Additionally, articles, theses, official government documents and reports were consulted.

GIS-based mapping of flood vulnerability and risk in the Bénin Niger River valley
Idelbert Dagbégnon Behanzin et al.,
International Journal of Geomatics and Geosciences
Volume 6 Issue 3, 2015
1656
Table 1: Available data
Content Format Sources
Spatial distribution of the
intensity level of flood
hazard for the Bénin at 1km
Resolution.
Raster file The WHO e-Atlas of disaster risk for
the African Region - Volume 1.
Exposure to natural hazards (version
2.0)
SRTM 30 m DEM. Raster file United State Geological Survey
Landcover and hydrography
layers.
Polygon shape
and raster file
Centre National de Télédétection et
de Cartographie (CENATEL, Bénin).
Road network, administrative
boundaries.
Polygon shape Humanitarian Response Info / United
Nations Office for the Coordination
of Humanitarian Affairs
Census data ( Socio-
economic indicators values)
Pre-processed,
in table format
Institut National de la Statistique et
de l’Analyse Économique (INSAE,
Bénin).
3.2 Hazard assessment
Already existing “spatial distribution of the intensity level of flood hazard for the Bénin” at
1km extracted from the WHO e-Atlas of disaster risk for the African Region was used to
generate the flood hazard distribution map. The complete description of the flood hazard
modelling of the “WHO e-atlas of disaster risk, volume 1: exposure to natural hazards, version
2.0” is beyond the scope of this study, but can be found in El Morjani (2011). However, it
should be noted that the method uses statistical specializing of the distribution of intensity of
flood hazard, which combines historical flood frequency and distribution of flood causal factors
(Land use and land cover, elevation, soil type and texture, lithology, flow accumulation
volume, distance from the flow accumulation path and precipitation) in order to predict areas
particularly vulnerable to floods. To obtain our flood hazard index distribution map, the study
area polygon shapefile was added to the Bénin flood intensity level raster format and extracted
by mask function under a spatial analyst tool in ArcGIS 10.1. The flood hazard index
distribution map obtained was reclassified into two intensity levels from 1 to 2 using a natural
breaks scheme and rescaled from 0 to 1. 0, indicates the lowest likelihood for a flood to occur
whilst the highest probability is 1 (figure 2 (a)).
3.3 Exposure Assessment
IPCC (2012) conceptualizes exposure as “the presence of human and ecosystem tangible and
intangible assets, activities and services in areas affected by the hazard”. This study follows
the same idea and defines exposure as elements at risk (people and assets) of being damaged
by a flood event. As the landcover layer contains elements at risk, the exposure assessment
involves intersecting the hazard layer on the standardized landcover layer in ArcGIS 10.1
(figure 3 (a)). However, in order to later create the risk map, each of the original landcover
determinants was reclassified into ordinal values classes from 1 to 4 according to their relative
importance in causing flood. This method was based on the best practices based on literature
review and the authors’ knowledge of the study area. Linear scale transformation method were
applied to normalize the reclassified values (table 2).

GIS-based mapping of flood vulnerability and risk in the Bénin Niger River valley
Idelbert Dagbégnon Behanzin et al.,
International Journal of Geomatics and Geosciences
Volume 6 Issue 3, 2015
1657
3.3 Vulnerability Assessment
The method used in this study, follows an indicator-based approach where vulnerability is seen
as physical, social, economic, environmental characteristics and conditions that make people
or communities susceptible to the damaging effects of flood. This form of vulnerability
assessment has been recognized internationally and is stressed in the Hyogo Framework for
Action (Birkmann, 2006). Several studies (Feteke, 2010; Müller, Reiter and Weiland, 2011;
Lundgren and Jonsson, 2012; Balica, 2012) have similarly applied indicators for flood
vulnerability assessment.
Table 2: Re-classification of landcover determinants
Original Landcover classification Re-classified Landcover Normalized
Numbers Determinants Values Values
13.00000 River 1
0.25 6.00000 Wetlands 1
1.00000 Dense forest 2
0.5 2.00000 Gallery forest 2
3.00000 Wooded savannah 3
0.75
4.00000 Arboreous savannah 3
7.00000 Plantation 3
10.00000 Mosaic of culture and fallow 3
9.00000 Bare soil 4
1 8.00000 Rocky surface 4
12.00000 Built-up areas 4
When selecting indicators (table 3), the deductive approach was applied, in which the best
possible physical, social, economic and environmental vulnerability indicators are identified
based on the existing available data and their relevance through a scientific literature review of
vulnerability theories. At that point, vulnerability indicators were normalized from 0 to 1 using
the functional relationship between variables and indicators developed by UNDP’s Human
Development Index (HDI) in 2006. This method for normalization was chosen because it does
not simply normalize variables and ignore the functional relation between variables and
indicators. When the variables have a positive functional relationship with vulnerability, the
normalization is done using the formula:
𝑉𝑖𝑗 = (𝑋𝑖𝑗 − 𝑀𝑖𝑛𝑋𝑖) / (𝑀𝑎𝑥𝑋𝑖 − 𝑀𝑖𝑛𝑋𝑖) (1)
When the variables have negative functional relationship with vulnerability, the normalization
is done using the formula:
𝑉𝑖𝑗 = (𝑀𝑎𝑥𝑋𝑖 − 𝑋𝑖𝑗) / (𝑀𝑎𝑥𝑋𝑖 − 𝑀𝑖𝑛𝑋𝑖) (2)
Where:
- Vij stands for the standardized vulnerability score with regard to vulnerability
component (i), for municipality (j);
- Xij stands for the observed value of the same component for the same municipality;
- MaxXi and MinXi stand for the maximum and minimum value of the observed range
of values of the same component, for all settlement of the index.
After normalization, the average index (AI) for each source of vulnerability is constructed by
using equal weights methods (table 4). Each index is obtained by averaging the variable within
each component of vulnerability following the formula:

GIS-based mapping of flood vulnerability and risk in the Bénin Niger River valley
Idelbert Dagbégnon Behanzin et al.,
International Journal of Geomatics and Geosciences
Volume 6 Issue 3, 2015
1658
𝐴𝐼 =1
𝑁∑ 𝑋𝑖
𝑛𝑖=1 , (3)
𝐴𝐼 being the average index of each source of vulnerability, 𝐍 = the sum of the index and 𝐗𝐢 =
the value of the index.
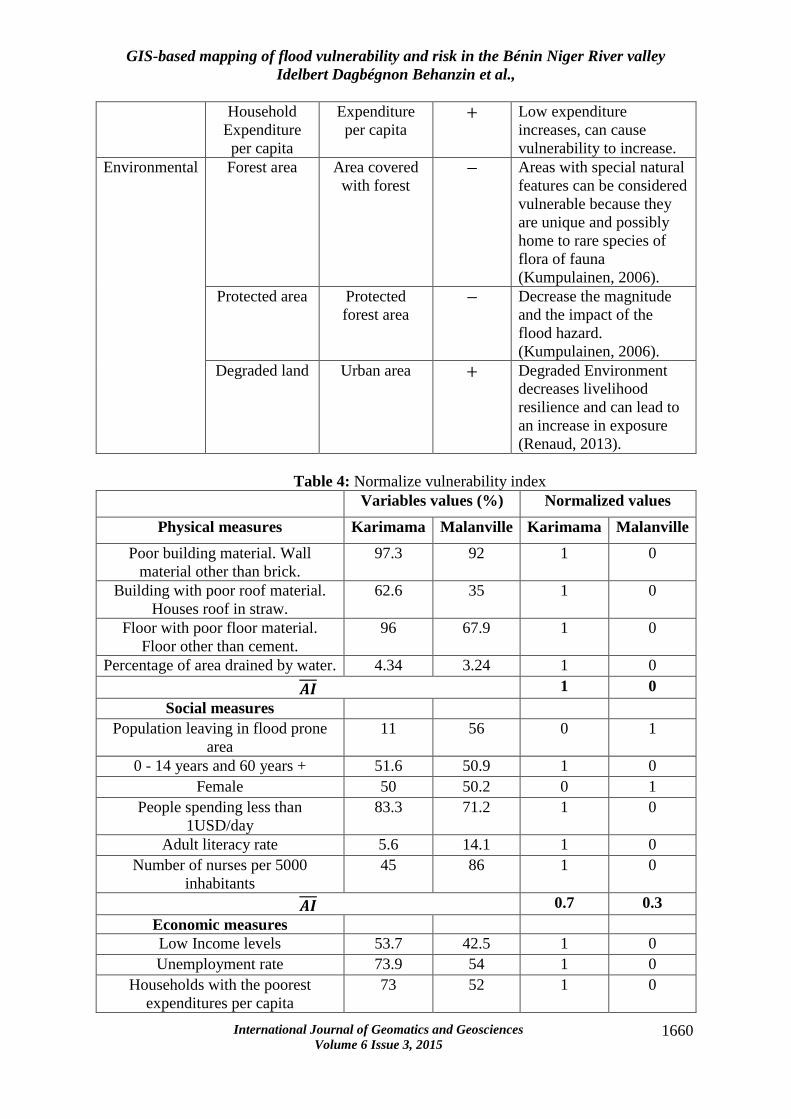
Table 3: Vulnerability indicators used and their relevance
Vulnerability
Components
Indicators Measures Relations Relevances
Physical Material of
which the
building is
made
Poor building
material.
Material of
wall other than
brick.
+ Determines the physical
fragility towards flood
events and indicates the
resistance to damage and
also the social status.
People living in poor-
quality housing, cannot
recover quickly
(Müller et al., 2011).
Material of
which the roof
is made
Building with
poor roof
material.
Houses roof in
straw
+
Material of
which the floor
is made
Floor with
poor floor
material. Floor
other than
cement.
+
Water Network
density
Percentage of
area drained by
water
+ High density of water
supply network will
increase the risk to be
flooded. Wetland areas
are more prone to
flooding (Peck et al.,
2007).
Social People density Population
density + There is a high level of
exposure to a given
hazard if population is
concentrated. The higher
the population density, the
higher the vulnerability
(Kumpulainen, 2006;
Balica, 2007).
Age group 0 – 14 years
and
60 years+
+ The young and the elderly
are more vulnerable to
natural hazards both
because of their physical
condition and their
financial dependence.
Physical fragility and
dependency of very young
and very old people
(Müller et al., 2011;
Fereke, 2010).

GIS-based mapping of flood vulnerability and risk in the Bénin Niger River valley
Idelbert Dagbégnon Behanzin et al.,
International Journal of Geomatics and Geosciences
Volume 6 Issue 3, 2015
1659
Gender Female + Women are generally
described as more
vulnerable to natural
hazards than men because
of their stronger
involvement in family
life, sector-specific jobs
and lower wages (Müller
et al., 2011; UN/ISDR,
2006; Fereke, 2010).
Poverty level People
spending less
than 1USD/day
+ Poverty affects people's
ability to protect
themselves and their
assets, as well as their
ability to live in areas
having less exposure to
risk. poor people are the
most severely affected by
all natural disasters
(UN/ISDR, 2006)
Literacy level Adult literacy
rate − Measuring people’s
ability to understand and
gain information. The
presumption is that people
with a low educational
level do not find, seek or
understand information
concerning risks as well
as others, and are
therefore vulnerable
(Müller et al.,2011;
Kumpulainen, 2006).
Average
people per
health workers
Number of
nurses per
5000
inhabitants
− Less medical
infrastructure and health
care, higher vulnerability
(IASC, 2012).
Economic Income level Income level + The lower the income, the
higher the vulnerability.
Low income people lack
financial resources to
recover resource (Hebb
and Mortsch, 2007).
Unemployment Unemployment
rate + Unemployed individuals
may not have money to
protect themselves
(Balica, 2007; Kuhlicke et
al., 2011).
GIS-based mapping of flood vulnerability and risk in the Bénin Niger River valley
Idelbert Dagbégnon Behanzin et al.,
International Journal of Geomatics and Geosciences
Volume 6 Issue 3, 2015
1660
Household
Expenditure
per capita
Expenditure
per capita + Low expenditure
increases, can cause
vulnerability to increase.
Environmental Forest area Area covered
with forest − Areas with special natural
features can be considered
vulnerable because they
are unique and possibly
home to rare species of
flora of fauna
(Kumpulainen, 2006).
Protected area Protected
forest area − Decrease the magnitude
and the impact of the
flood hazard.
(Kumpulainen, 2006).
Degraded land Urban area + Degraded Environment
decreases livelihood
resilience and can lead to
an increase in exposure
(Renaud, 2013).
Table 4: Normalize vulnerability index
Variables values (%) Normalized values
Physical measures Karimama Malanville Karimama Malanville
Poor building material. Wall
material other than brick.
97.3 92 1 0
Building with poor roof material.
Houses roof in straw.
62.6 35 1 0
Floor with poor floor material.
Floor other than cement.
96 67.9 1 0
Percentage of area drained by water. 4.34 3.24 1 0
𝑨𝑰 1 0
Social measures
Population leaving in flood prone
area
11 56 0 1
0 - 14 years and 60 years + 51.6 50.9 1 0
Female 50 50.2 0 1
People spending less than
1USD/day
83.3 71.2 1 0
Adult literacy rate 5.6 14.1 1 0
Number of nurses per 5000
inhabitants
45 86 1 0
𝑨𝑰 0.7 0.3
Economic measures
Low Income levels 53.7 42.5 1 0
Unemployment rate 73.9 54 1 0
Households with the poorest
expenditures per capita
73 52 1 0

GIS-based mapping of flood vulnerability and risk in the Bénin Niger River valley
Idelbert Dagbégnon Behanzin et al.,
International Journal of Geomatics and Geosciences
Volume 6 Issue 3, 2015
1661
𝑨𝑰 1 0
Environmental measures
Area covered with forest 90.2 73.6 0 1
Protected forest area 86.1 41.4 0 1
Urban area 0.1 0.8 0 1
𝑨𝑰 0 1 Data sources: Field surveys, INSAE (2011), INSAE (2013), WFP (2013).
(+) = Increase in vulnerability, (−) = Decrease in vulnerability
The overall vulnerability index (𝑉𝑢𝑙𝑖0) for each city is obtained by averaging the four values of
each component of vulnerability using the formula:
𝑉𝑢𝑙𝑖0 = (𝑉𝑢𝑙𝑖
𝑃ℎ𝑦+ 𝑉𝑢𝑙𝑖
𝑆𝑜𝑐 + 𝑉𝑢𝑙𝑖𝐸𝑐𝑜 + 𝑉𝑢𝑙𝑖
𝐸𝑛𝑣)/4 (4)
Where: 𝑉𝑢𝑙𝑖𝑃ℎ𝑦
+ 𝑉𝑢𝑙𝑖𝑆𝑜𝑐 + 𝑉𝑢𝑙𝑖
𝐸𝑐𝑜 + 𝑉𝑢𝑙𝑖𝐸𝑛𝑣 are respectively the average values of each
source of physical vulnerability index (𝑉𝑢𝑙𝑖𝑃ℎ𝑦
), social vulnerability index (𝑉𝑢𝑙𝑖𝑆𝑜𝑐), economic
vulnerability index (𝑉𝑢𝑙𝑖𝐸𝑐𝑜), and environmental vulnerability index (𝑉𝑢𝑙𝑖
𝐸𝑛𝑣) for the
municipality (i). Once the overall vulnerability is calculated, they were linked as attributes to
the vector polygon shape of each municipality and then converted into a raster format to
generate a vulnerability map.
3.4. Risk assessment
Because risks have different components, the variety of methods for assessing each component
of risk is reflected on the risk assessment approach. Among the different methods available,
the GIS-base mapping method is “the most recent method and it holds a lot of promises as it is
capable of combining all the known techniques and parameters” (Ologunorisa and Abawua,
2005). This paper applied the same method and the risk is seen here as function of hazard,
exposure and vulnerability. It is assessed through the formula:
𝑅𝑖𝑠𝑘 = 𝐻𝑎𝑧𝑎𝑟𝑑 × 𝐸𝑥𝑝𝑜𝑠𝑢𝑟𝑒 × 𝑉𝑢𝑙𝑛𝑒𝑟𝑎𝑏𝑖𝑙𝑖𝑡𝑦 (5)
Table 5: Overall vulnerability index
Administrative
units
Vulnerability components Vulnerability
index
Rank
Physical Social Economic Environmental
Karimama 1 0.7 1 0 0.7 1
Malanville 0 0.3 0 1 0.3 2
In this study, the free standardized layers (hazard, exposure and vulnerability) ranged from 0
to 1 were weighted equally important. Therefore, 1/3 was assigned as weight for each layer and
aggregated through the weighted linear combination method using a raster calculator under
spatial analyst tools of ArcGIS 10.1. The resulted map was reclassified into two classes from
0 to 1, indicating respectively low and high risk.
4. Results and discussion
Figure 2 (a) below shows the output of the hazard assessment. The map indicates that 90% of
the districts of Bénin Niger River Valley are located in the flood hazard pathway, except a part
of the District of Guéné.

GIS-based mapping of flood vulnerability and risk in the Bénin Niger River valley
Idelbert Dagbégnon Behanzin et al.,
International Journal of Geomatics and Geosciences
Volume 6 Issue 3, 2015
1662
Figure 2: (a) Flood hazard, (b) DEM of the Bénin Niger River Valley
A combined analysis of the Digital Elevation Model (figure 2 (b)) and the flood hazard map
reveals that the hazardous areas are the areas at low elevation alongside the Niger River as well
as the areas that border the beds streams of its tributaries Mékrou, Sota and Alibori. As
hazardous areas are low-lying areas and closer to the rivers network, it can be deduced that the
magnitude of the flood hazard of a given area is a function of both the distance to the river and
the elevation of the area in question. The output of element at exposure in the figure 3 (a) below
shows that 75% of the study area is covered by protected forest. Almost 70% of households in
the Benin Niger River Valley are highly exposed and settlement areas are highly exposed to
flood hazard except from some part of Guéné. The field surveys and the resulting analyses
reveales that the population is largely constrained to settling in the river flood plain due to the
fact that most arable land is found along the river and the remaining area is largely made up
of protected forests. It follows that an increase in settlement and development activities along
the rivers flow path will therefore result in a high exposure to flood hazard.
Table 4 illustrates the normalized vulnerability index and table 5 summarizes the overall
vulnerability index. With regards to the considered indicators, the normalized vulnerability
index indicates that the municipality of Karimama is more vulnerable physically, socially and
economically than the municipality of Malanville. However, when looking at the
environmental vulnerability index (table 4), the Malanville municipality is more vulnerable
than the commune of Karimama. This is due to the fact that Malanville has less forest cover
area. Overall the Karimama municipality is more vulnerable (Figure 3(b)) due to its poverty
and its weaker pre-existing physical, social, economic and environmental vulnerability
conditions.

GIS-based mapping of flood vulnerability and risk in the Bénin Niger River valley
Idelbert Dagbégnon Behanzin et al.,
International Journal of Geomatics and Geosciences
Volume 6 Issue 3, 2015
1663
Figure 3: (a) Flood exposure, (b) Flood vulnerability of the Bénin Niger River Valley
In the figure 6, the risk areas are those in the red colour. Even if 90% of the districts are located
in the area of hazard, they are not all at the same degree of risk due to their different degrees
of vulnerability. 70% of the districts are at high risk. District at risk are: Malanville, Karimama,
Kompa, Birni-Lafia, Bogo-Bogo, Madécali, and Toumboutou. These populations were
estimated at about 165,721 inhabitants (INSAE, 2013).
These results corroborate findings from both previous observed flood events and relevant
studies (Benin, 2010, 2012, 2013). Though, our results provide a good contribution to the
understanding of flood risk in the Benin Niger River Valley, some limitations have been
identified. Using one kilometer resolution for the spatial distribution of the intensity level of
flood hazard “may mask some micro-variations such as crucial elevation changes in the
topography that have a direct impact on the occurrence or intensity of the flood hazard” (El
Morjani et al., 2007, p.24). It should be kept in mind that vulnerability is dynamic and site-
specific. Development programs that enhances community resilience to flood hazards may
reduce their vulnerability over time. Furthermore physical, social, economic and environmental
indicators are not constant and our research is unable to capture future changes in the indicators.
Therefore, the findings of this paper run the risk of being limited in time scale. Despite these
limitations, our study is the first to deal with such an assessment in the area and provides an
adequate depiction of the overall spatial extent of flood hazard and the vulnerability profile of
municipalities in the Benin Niger River Valley. In addition to contributing to research
knowledge, the results can be used to identify areas to focus on in case of emergency and for
risk reduction programs. However, further research is needed to have more accurate and high
resolution data to improve the hazard assessment and to develop vulnerability indicators at the
district or household level.

GIS-based mapping of flood vulnerability and risk in the Bénin Niger River valley
Idelbert Dagbégnon Behanzin et al.,
International Journal of Geomatics and Geosciences
Volume 6 Issue 3, 2015
1664
Figure 6: Flood risk map of the Bénin Niger River Valley
5. Conclusion
This study, aimed at assessing flood vulnerability and risk in the Bénin Niger River Valley
came to the conclusion that since almost all of the area’s populations settled in flood prone
areas, they are likely to be exposed to flood hazard,. The hazard assessment shows that the low-
lying areas that border Niger’s bed streams and their tributaries are highly affected by the
hazardous flood events. Except for some parts of the district of “Guéné”, most of the people
living in this segment of Niger River are highly vulnerable to flood hazard. The assessment
reveals that the municipality of the Karimama is more vulnerable than the municipality of
Malanville.
Disclaimer
The designations, presentation, findings, interpretations and conclusions expressed in this
article are entirely those of the authors and should not be attributed in any manner to the World
Health Organization, or the United Nations Office for the Coordination of Humanitarian
Affairs.

GIS-based mapping of flood vulnerability and risk in the Bénin Niger River valley
Idelbert Dagbégnon Behanzin et al.,
International Journal of Geomatics and Geosciences
Volume 6 Issue 3, 2015
1665
Acknowledgment
We acknowledge the German Federal Ministry of Education and Research (BMBF) for
providing financial support for this research through the West African Science Service Center
on Climate Change and Adapted Land Use (WASCAL) program. We are grateful to Prof.
Kouami KOKOU, Director of WASCAL Climate Change and Human Security (CCHS)
program and his colleagues. We also acknowledge the United Nations University - Institute for
Environment and Human Security to support this study.
6. References
1. Abah R. C., (2013), An application of geographic information system in mapping flood
risk zones in a north central city in Nigeria, African Journal of Environmental Science
and Technology, 7(6), pp 365-371.
2. Aich V., Koné B., Hattermann F. F., and Müller E. N., (2014), Floods in the Niger basin
- analysis and attribution, Natural Hazards and Earth System Sciences Discussion, 2,
pp 5171–5212.
3. Alkema D., (2004), RS and GIS applications in flood forecasting. In: Proceedings of
the national workshop on flood disaster management: space inputs, 3-4 June 2004,
Hyderabad, India, pp 57-59.
4. AMCEN, (2011), Addressing Climate Change Challenges in Africa: A Practical
Guide Towards Sustainable Development,
http://www.unep.org/roa/amcen/docs/publications/guidebook_CLimateChange.pdf.
Accessed 05 February 2014.
5. BAD, (2014), Proposition Visant l’Octroi d’un Don de 800.000 Dollars EU au Titre
du Programme d’Aide d’Urgence en Faveur des Communes de Malanville et de
Karimama Affectées par les Inondations, BAD, Cotonou, Benin.
6. Balica S. F., (2012), Applying the Flood Vulnerability Index as a Knowledge Base for
Flood Risk Assessment. Ph.D. Thesis submitted to Delft University of Technology.
7. Balica S.F., (2007), Development and Application of Flood Vulnerability Indices for
Various Spatial Scales. M.Sc. Thesis submitted to UNESCO-IHE Institute for Water
Education.
8. Bénin, Commune de Karimama, (2010), Rapport Général sur les Inondations d’Août
2010 dans la Commune de Karimama, Karimama, Août.
9. Bénin, Commune de Karimama, (2012), Plan de Contingence de la Commune de
Karimama, Karimama, August.
10. Bénin, Commune de Malanville, (2013), Rapport sur les Inondations de 2013 dans la
Commune de Malanville, Malanville, Octobre.
GIS-based mapping of flood vulnerability and risk in the Bénin Niger River valley
Idelbert Dagbégnon Behanzin et al.,
International Journal of Geomatics and Geosciences
Volume 6 Issue 3, 2015
1666
11. Birkmann J., (2006), Measuring vulnerability to promote disaster-resilient societies:
Conceptual frameworks and definitions, In Measuring Vulnerability to Natural
Hazards: Towards Disaster Resilient Societies, ed. Birkmann. J., pp 9-54. Tokyo:
United Nations University Press.
12. Descroix L., Moussa I. B., Genthon P., Sighomnou D., Mahé G., Mamadou I., … Olivry
J-C., (2013), Impact of drought and land-use changes on surface-water quality and
quantity: The sahelian paradox, In Environmental Sciences: Current Perspectives in
Contaminant Hydrology and Water Resources Sustainability, ed M. Bradley, pp 243-
271, http://www.intechopen.com/download/get/type/pdfs/id/43185. Accessed 17 May
2014.
13. CEDEAO-ClubSahel/OCDE/CILSS, (2008), Climate and climate change, the Atlas on
Regional Integration in West Africa, Environment Series, p.13,
http://www.fao.org/nr/clim/docs/clim_080502_en.pdf . Accessed 26 May 2014.
14. Ezemonye M. N., and Emeribe C. N.V., (2011), Flood characteristic and management
adaptation in part of the Imo River system, Ethiopian Journal of Environmental Studies
and Management, 4(3), pp 56-64.
15. El Morjani Z., Ebener S., Boos J., Ghaffar E. A., and Musani A., (2007), Modelling
the spatial distribution of five natural hazards in the context of the WHO/EMRO Atlas
of Disaster Risk as a step towards the reduction of the health impact related to disasters,
International Journal of Health Geographics, 6(8), pp 1-208, doi:10.1186/1476-072X-
6-8
16. El Morjani Z. E. A., (2011), Methodology document for the WHO e-atlas of disaster
risk. Volume 1. Exposure to natural hazards, Version 2.0: Preparation of the datasets.
Taroudant poly-disciplinary faculty of the Ibn Zohr University of Agadir, Morocco.
ISBN: 978-9954-0-5397-3
17. Fekete A., (2010), Assessment of Social Vulnerability to River Floods in Germany,
Graduate Research Series, 4, Bonn: United Nations University-Institute for
Environment and Human Security Publication Series.
18. Goulden M., and Few, R., (2011), Climate Change, Water and Conflict in the Niger
River Basin. London, United Kingdom.
19. Hebb A., and Mortsch L., (2007), Project Report XI, Floods: Mapping Vulnerability in
the Upper Thames Watershed under a Changing Climate, Western Ontario, August.
20. IASC, (2012), Operational Guidance for Coordinated Assessments in Humanitarian
Crises, https://docs.unocha.org/sites/dms/Documents/ops_guidance_finalversion2012.pdf.
Accessed on 15 August 2014.

GIS-based mapping of flood vulnerability and risk in the Bénin Niger River valley
Idelbert Dagbégnon Behanzin et al.,
International Journal of Geomatics and Geosciences
Volume 6 Issue 3, 2015
1667
21. ICIMOD and UNESCO, (2007), Preparing for Flood Disaster: Mapping and Assessing
Hazard in the Ratu Watershed, Nepal, International Centre for Integrated Mountain
Development, Kathmandu.
22. INSAE, (2011), Enquête Modulaire Intégrée sur les Conditions de Vie des ménages:
Principaux indicateurs, 2nd.Ed. EMICOV, Institut National de la Statistique et de
l’Analyse Économique, Cotonou, Benin.
23. INSAE, (2013), Quatrième Recensement Général de la Population et de l’Habitation
(RGPH 4) : Résultats Provisoires, Direction des Etudes Démographiques, Institut
National de la Statistique et de l’Analyse Économique, Cotonou, Benin.
24. IPCC, (2013), Climate Change 2013: The Physical Science. IPCC 5th Report.
http://www.climatechange2013.org/images/report/WG1AR5_ALL_FINAL.pdf.
Accessed 15 August 2014.
25. Isma’il M., and Saanyol I.O., (2013), Application of Remote Sensing (RS) and
Geographic Information Systems (GIS) in flood vulnerability mapping: Case study of
River Kaduna, International Journal of Geomatics and Geosciences, 3(3), pp 618-627.
26. Kebede B., (2012), Application of GIS and Remote Sensing techniques for flood hazard
and risk assessment: The case of Dugeda Bora Woreda of Oromiya regional state,
Ethiopia. Berlin Conference on the Human Dimensions of Global Environmental
Change, 5-6 October 2012, Berlin, pp 1-17.
http://www.berlinconference.org/2012/?page_id=1060. Accessed 8 April 2014.
27. Kuhlicke C., Scolobig A., Tapsell S., Steinführer A., and De Marchi B., (2011),
Contextualizing social vulnerability: Findings from case studies across Europe, Natural
Hazards, 58(2), pp. 789-810.
28. Kumpulainen S., (2006), Vulnerability concepts in hazard and risk assessment. Natural
and technological hazards and risks affecting the spatial development of European
regions, Geological Survey of Finland, Special Paper, 42, pp 65-74.
29. Lundgren L., and Jonsson A., (2012), Assessment of social vulnerability: A literature
review of vulnerability related to climate change and natural hazards, Center for
Climate Science and Policy Research,
http://www.cspr.se/briefings/1.358869/CSPRBriefing9.pdf. Accessed 25 May 2014.
30. Ly M., Traore S.B., Alhassane A., Sarr B., (2013), Evolution of some observed climate
extremes in the West African Sahel, Weather and Climate Extremes, 1, pp 19-25.
31. Müller A., Reiter J., Weiland U., (2011), Assessment of urban vulnerability towards
floods using an indicator-based approach - A case study for Santiago de Chile, Natural
Hazards Earth System Sciences, 11, pp 2107–2123.
GIS-based mapping of flood vulnerability and risk in the Bénin Niger River valley
Idelbert Dagbégnon Behanzin et al.,
International Journal of Geomatics and Geosciences
Volume 6 Issue 3, 2015
1668
32. New M., Hewitson B., Stephenson D. B., Tsiga A., Kruger A., Manhique A.,… Lajoie
R., (2006), Evidence of trends in daily climate extremes over southern and West Africa,
111, D14, doi: 10.1029/2005JD006289.
33. Okpara J.N., Tarhule A.A., and Muthiah P., (2013), Study of climate change in Niger
River basin, West Africa: Reality not a myth, In Climate Change - Realities, Impacts
Over Ice Cap, Sea Level and Risks, ed. B.R. Singh, pp 3-38.
http://www.intechopen.com/download/pdf/41986. Accessed 15 August 2014.
34. Ologunorisa T. E., and Abawua M. J., (2005), Flood risk assessment: A review, Journal
of Applied Sciences and Environmental Management, 9(1), pp 57- 63.
35. Oyerinde, G. T., Hountondji, F. C. C., Wisser, D., Diekkrüger, B., Lawin, A. E., Odofin,
A. J., & Afouda, A., (2014), Hydro-climatic changes in the Niger basin and consistency
of local perceptions. Regional Environmental Change. http://doi.org/10.1007/s10113-
014-0716-7
36. Peck A., Karmakar S., and Simonovic P. S., (2007), Project Report 057, Physical,
Economical, Infrastructural and Social Flood Risk - Vulnerability Analyses in GIS,
Western Ontario, September.
37. Renaud F., (2013), Environmental components of vulnerability In J. Birkmann (ed.),
Measuring Vulnerability to Natural Hazards: Toward Disaster Resilient Societies, 2nd
edn. Tokyo: United Nations University Press.
38. Sarr B., (2011), Present and future climate change in the semi-arid region of West
Africa: A crucial input for practical adaptation in agriculture, Atmospheric Science
Letters, DOI: 10.1002/asl.368.
39. Tschakert P., Sagoe R., Ofori-Darko G., and Codjoe S.N., (2010), Floods in the Sahel:
An analysis of anomalies, memory, and anticipatory learning, Climatic Change, 103,
pp 471-502.
40. UNDP, (2006), Human Development Report, United Nations Development Program,
http://hdr.undp.org/hdr2006/statistics/
41. UN/ISDR, (2006), Guidelines for Reducing Flood Losses, International Strategy for
Disaster Reduction, United Nations, Geneva,
http://www.unisdr.org/we/inform/publications/558. Accessed 18 April 2014.
42. WB/UNDP, (2011), Post Disaster Needs Assessment, Cotonou, Benin.
43. WFP, (2013), Analyse Globale de la Vulnérabilité et de la Sécurité Alimentaire:
Rapport de Synthèse par Commune, World Food Programme, Cotonou, Benin.