gis application for shoreline management download images/5844e2f4e5cac.pdf · gis application for...
TRANSCRIPT

5TH MANCO 96
GIS APPLICATION FOR SHORELINE MANAGEMENT
By Ir. Cho Weng Keong
Department of Irrigation and Drainage Malaysia
The Pan Pacific Resort Pangkor Island
25- 27 Nov 1996

5th MANCO 96
GIS Applbtion for Shoreline Munqement
bY
Ir. Cho Weng Keong
Department of Irrigation and Drainage Malaysia
The Pan Pacific Resort Pat&or Island
25 - 27 Nov 1996

GIS APPLICATION FOR SHORELINE MANAGEMENT
Ir.Cho Weng Keong Senior Engineer
Coastal Engineering Division Department of Irrigation and Drainage
1 Introduction
1.1 Malaysia is situated between latitudes 1” and 7” north and longitudes 107 and 119 east. It comprises two
regions, Peninsular Malaysia and the States of Sabah and Sarawak (collectively referred to as East Malaysia)
on the northern part of the Borneo Island, which are separated by 640 km of South China Sea. The total land
area is 330,400 km’ while the shoreline totals approximately 4,809 km. More then 90% or, 4,300 km of the
shoreline is erodible alluvium. Sandy coasts are along the shoreline of east peninsula Malaysia, Sarawak and
several stretches of west peninsula Malaysia such as Penang, Port Dickson and Malacca. Coasts of clay, mud
and silt etc. are distributed along the shoreline of west peninsula Malaysia and Sabah.
1.2 The coastal zone of Malaysia has a special socii-economic significance. It supports a large percentage of the
population (about 70%) and it is also the centre of economic activities encompassing urbanisation. agriculture,
fisheries, aquaculture, oil and gas exploitation, transportation and communication, recreation, etc. In response
to the increasingly serious problem of coastal erosion in many parts of the country that threatens the livelihood
and property of the coastal communities of Malaysia, the Government of Malaysia commissioned the National
Coastal Erosion Study (NCES) in 1984. The study which was completed in 1986 revealed that of the 4,809
lun of shoreline in Malaysia, about 1,390 km (29%) were subjected to erosion of varying degrees of severity.
Based on the consideration of the rate and imminence of erosion and the economic values of the human
activities threatened> coastal erosion sites have been classified into the following three groups as follows:
4
b)
Categov 1 - Critical
Areas suffering from coastal erosion where shore-based facilities are in imminent danger
of loss or damage;
Category 2 - Significant
cl
Areas where shore-based facilities are expected to be endangered within 5 to 10 years if no
remedial action is taken; and
Category 3 -Acceptable
Erosion areas that are generally undeveloped with consequent minor economic loss if
erosion continues unabated.
1.3 In cognizance of the consequences of coastal erosion which has become an important economic and social
issue, the Government of Malaysia has since 1987 adopted a two-pronged strategy (short term and long term)
for the control of coastal erosion as recommended by the NCES. The main objective of the short term strategy

which is construction focused and reactive in nature is to protect existing facilities and properties in the
Category 1 or Critical Erosion Areas subjected to the test of economic viability. The long temr strategy, on the
other hand, is management focused and aims to obviate the need for expensive protective works in the future.
This is achieved by according due consideration to the consequences of coastal erosion in the planning and
development of projects within the coastal zone through an integrated and coordinated development strategy
and plan. The short-term plan hence requires structural solutions such as the construction of sea-walls,
revetments, breakwaters, sand nourishment etc., whilst the long-term plan aims to control coastal erosion and
its negative impact through instituting non-structural measures such as land use planning and control.
1.4 Following the completion and recommendation of the NCES, the Government acted promptly in I 987 to create
and develop suitable institutions to oversee, to coordinate and to implement the strategies and proposals under
the coastal erosion control master plan. This included the establishment of the National Coastal Erosion
Control Council (NCECC) and the Coastal Engineering Technical Centre (CETC) in DID. The National Costa1
Erosion Control Council which is under the coordination of the Prime Minister’s Department coordinates
coastal erosion control programs and formulate policy for the management and development of the coastal zone
involving the Federal and State Governments, and the private sector.
1.5 The Department of Irrigation and Drainage was given the responsibility of setting up the CETC which is
presently also known as the Coastal Engineering Division (CEO) of DID. The CED is responsible for the
following:
a>
b)
c>
4
To implement coastal erosion control works for critical erosion areas. This includes
planning, feasibility studies, detailed design, construction supervision and monitoring the
performance of completed works.
To provide technical support to the NCECC.
To provide technical advisory services to other government departments and agencies in
the processing of development applications in the coastal zone.
To maintain a coastal engmeering database to support the planning and design of coastal
engineering works in the country.
2 Background
2.1 An Asian Development Bank (ADB) Technical Assistance Project entitled “Institutional Strengthening for
Shoreline Management” was implemented at the Coastal Engineering Division (CED) over a 24-month period
from July 1994 to July 1996. It was piggy-backed to a sectoral loan (National Coastal Erosion Control Sector)
for shoreline protection by the ADB to the Government of Malaysia. The total project cost is US$443,000
which includes US.% 120,000 for the procurement of equipment (computer hardware and software). The main
2

objective of the project is to assist CED in enhancing its capability to move corn an original construction
oriented role towards a longer term goal of shoreline management to maintain sustainability. It was an initiative
to foster effective shoreline management for sustainable development in the coastal zone through a shoreline
management programme based on planning and management principles, and supported by project specific and
comprehensive coastal engineering data. It included equipping CED with state-of-the-art management and
analytical tools and the setting up of a data management system incorporating Geographical Information
System (GIS) as the framework for integrating data involved in shoreline management which are diverse,
including spatial data, time mies data, social and economic data and multimedia information.
2.2 ADB awarded the T.4 project to the consultant AGRA Earth & Environmental Ltd.,Canada in association with
Mofatt & Nichol Engineers, USA which brought in the services of four specialists ( One GIS Specialist, one
Database Management Specialist, one Coastal Engineering Specialist and one Computer Modelling
Specialist). In addition, for better coordination of the specialists’ input, a Senior Coastal Environment
Specialist from AGRA was assigned as the project team leader. CED provided counterpart staff and office
facilities for the consultants for the whole duration of the project. In summary, the scope of works includes:
. To review the existing data collection programme and database management system
(hardware, software and other related application systems) at CED and other relevant
government departments and agencies.
. To identify the data required for effective shoreline management and develop a data
collection program and database management system.
. To design and document a data model for implementation on GIS which takes account of
the data available with the data collection programme, the data needs of the numerical and
physical modelling tools at CED and present and f3xre planning and design needs;
. To review, evaluate and procure system of hardware and software for the CED database and
GIS management system;
. To train the counterpart staff in the development and operation of the database and GIS
management system;
l To prepare and conduct training courses in coastal sediment and numerical modelling.
This paper is limited to highlighting the design of the functional model of the GIS system developed and
implemented at CED and describes some of the results and achievements to date.
3 GIS Syatem Deaign in General
3.1 GIS is basicalIy a computer&d system for spatial information coIlection, processing, storage, management,
display, analysis and production. It basically consists of three components, namely hardware, software and
3

database The last component is usarally the most important and costly. GIS can be utilized to support various
stages of the modem&d shoreline management. Data involved in shoreline management are diverse, including
spatial data, time seTies data, social and economic data, and multimedia information. Examples of spatial data
are shoreline positions, topographic data, bathymetric data, location of data collection stations, etc. The social
economic and policy information is an equally important data category in coastal GIS, which is integrated with
spatial data and used to support decision making. Time series data, for example wind and wave observations,
can be integrated with spatial data through the locations of the sensors, The integration of the spatial data, time
series data, coastal engineering modelling, environmental data, and social economic data in the GIS
environment makes it possible to examine the current shoreline and coastal zone situations in terms of
environmental, social, economic and other impact. Furthermore, it is an important system for decision making
in shoreline and coastal zone management.
3.2
3.2.1 In assessing CED’s needs, a review of current hardware and software systems at CED/DID was conducted.
In addition fact finding visits to most major GIS sites in Malaysia including PLUS, UTM, MACRES, PEGIS
and DOE were made in order to provide an overview of GIS applications in Malaysia and to assess the
possibility of cooperation. Taking into consideration experiences and lessons from local GIS sites and related
projects, as well as compatibility and data transfer between agencies and the private sector, the hardware and
software configurations shown in Figures I and 2 were suggested and implemented at CED. Basically the
hardware and software configuration comprises of:
. Five Pentium Desktop Computers for GIS modelling and analysis, database management,
digitising, engineering drawings and mathematical modelhng. The computers are
networked to facilitate communication between computers and peripherals in the
corQuration as well as to provide data communication across platforms.
. Three laptop computers for field work such as data collection, display of design data,
modification of design at engineering sites etc.
. One 4 mm cartridge tape drive for backup of data as well as providing an appropriate way
for data transfer between agencies without networking.
. One A0 and one A3 size digitiser for digitising both large and small size maps.
. An inkjet plotter to produce maps of maximum A0 size and up to 256 colours and printers
for the generation of reports.
. Licensed softwares which include ARC Cad, ARC View, AutoCAD and dBASE.
3.2.2 Overall, the hardware and software configurations were designed to meet requirements of the data collection
programme, shoreline management, GIS, and numerical modelling, taking into consideration existing
computing resources and capabilities at CED.
4

3.3.1 Considering the nature of the application of this GIS, the following data were identified to be essential to be
incorporated / included in the GIS databases:
3.3.2 Shoreline history: Aerial photographs of the entire national shoreline should be taken every 5 years in order
to accumulate data for monitoring long term shoreline changes (Stanley 1985, Li 1995). The photographs
should have about 60% shoreline overlap so that the 3 -D shoreline can be extracted from the photographs by
stereo photogrammetric processing. For shoreline segments eroded severely, larger scale aerial photographs
should be taken more tiequentIy, for example every 1 - 3 years, The larger scale photographs may be used for
other purposes such as coastal zone topographic mapping, beach profiling, and erosion interpretation. For very
small sites, total stations and GPS receivers may be used to capture the shoreline periodically and compare the
shoreline changes
3.3.3 Bathymetric data: Hardcopy nautical charts of 1: 15,000 and 1:200,000 provide important bathymetric
information. Bathymetric data in digital format became available recently because of the advances in computer
technology and application of acoustic sounding surveying systems. In Malaysia, this kind of data are
maintained by Royal Malaysian Navy and some oil and gas companies. Hydrographic survey of small areas
are also conducted or contracted out by CED. Bathymetric data are crucial to structure design, numerical
modelling, and shoreline changes monitoring.
3.3.4 Topographic data: Topographic maps of 1:50,000 are maintained by Department of Survey and Mapping.
IJntil 1995, topographic maps of about 30% of Peninsula Malaysia and 5% of East Malaysia were available
in digital formats. These data cover the features on the landward side of the shoreline. DTM (Digital Terrain
Models) describe the land terrain relief which determines the shoreline shape along with the bathymetric data,
the water level and other factors,
3.3.5 Attribute data: GIS attribute data such as demography, land use, geology, soil types, environment quality etc.
should be included. These data are sometimes necessary in decision making, for example for setback planning,
protection of residential areas, limiting or avoiding environmental impacts and other purposes. A lot of coastal
attribute data can be associated with shoreline segments, including erosion categories, structure costs etc.
Once the shoreline geometry is built as routes in the network system of ArcInfo, dynamic segmentation can
be used to model the change of the attributes of shoreline. It should be noted that the change of the attributes
does not require the resegmentation of the shoreline.
3.3.6 Multimedia data: Terrestrial and aerial photographs are available for shoreline sections of different periods.
They are important for interpreting erosion status. Hardcopy photos are scanned into the system. The scanned
images are then related to the desired features and can be displayed by clicking the corresponding features
5

using a hot link. Design drawings can also be associated with features so that the features and corresponding
drawings can be examined at the same time. Sound of waves approaching structures, video clips, and results
of simulation and animation may also be included in the future.
3.3.7 Time series data: Wave data, wind data, current data, wave surface elevations (tides), river data (daily
discharge), and other time sties data describe the processes affecting the shoreline and other coastal
phenomena. A link between the time series data and the spatial data opens a new way of tied database
management scheme and an integrated coastal modelling environment. In most cases, time series data have
the following characteristics: a) the position of a sensor can be treated as a constant, and b) the observation
data which are large in size and expand rapidly along with time. Currently, the time series data included in
this system are:
. LEO (Littoral En vironment Observation) data containing wave, wind, beach slope, current,
and water level information. ‘Two tables in dBASE format are given, one for location and
general information and the other for the observations (Willis 1995, Kjerfve 1995). 18
LEO sites are distributed in the country and provide data every month to CED since 1987.
. Wave data: Waveride+ data are results of statistical analysis of wave data based on 20
minutes records sampled at 2.56Hz every 3 hours (Willis 1995). Pressure Gauge data of
two locations and water level data from two other sites are also available.
. SSMO (Surface Ship Meteorological Observations) data from National Climatic Data
Centre of USA fi-om 1949 - 1993 which cover the Malaysian waters. Marsden squares are
used as indexing fkme-s, with each square of 10” (latitude) x 10” (longitude). The SSMO
data in BASE format include both general information such as a Marsden square number,
data and time of the data acquisition, and data tields containing information about wave,
swell, wind, meteorological conditions, and ship speed and direction (Kjerfve 1995).
4 GIS Functional Model for Shoreline Management
4.1 Functions to be suo~orted bv GIS
4.1.1 In designing the GIS functional model for shoreline management, an assessment of the major functions
/activities of the Coastal Engineering Division was carried out. The functions which can be incorporated
in a GIS framework can be summarized in the following four aspects:
4.1.2 Cousfuf engineeting: Coastal erosion control works are implemented by CED in areas which have been
categorised as facing critical erosion. Such areas can be indicated in a digital shoreline condition map. A
land/bathymetric survey has to be carried out to provide topographic/bathymetric maps (e.g., 1: 1,000) for
6

4.1
4.1
.3
sm design. Tides, water level, sod storm surge data should be made available for determining structure
heights. In addition, geotechnical data such as shear strength of soil etc. are also needed. Design drawings
are generated using AutoCAD. With all these data available in digital form in the GIS database, a
ccmputerized (or partially) design procedure can be developed, which will make the design process much
more efficient and systematic. Another aspect is the overview of construction and development projects in
the whole cout@ry. An inventory system will be a good solution to this need. A database with status of all
projects completed and planned in the GIS will enhance the project management and efficiency of
administration.
River mouth dredging: CED implements river mouth dredging works to improve port access and enable
navigation of fishing boats at both high and low tides. Detailed design boundaries need to be determined by
CED on a topographic map (I:1 mile) and upon consultation with local fishing authorities. Thereafter, a
detailed batbymeuic survey of the specific area is performed and a survey map of 1:2,000 is produced. The
final design boundary of the dredging area is located based on the survey map. A postdredging survey
estimates the volume of the dredged material solely for estimatiq dredging charges. Periodical surveys may
be used to monitor trends of sedimentary movement atxl predict dredging sites. This may be combined with
numerical modelling techniques. If the topographic database is in digital form and survey data can be
supplied in digital form as well, the design procedure, volume estimation, sod long term trend analysis can
be accomplished in a GIS environment.
.4 Coastal project implementation and monitoring: Services such as cost estimation, project budget
justification, te&r calls, and budget monitoring etc. are included in the project monitoring function. These
services can be enhanced by applying GIS technology. After a design is accomplished and the contract is
awarded, CED has to monitor the progress of project implementation. This is currently done by reviewing
reports from State DID offices and contractors. If site cot&i&ions and other factors change, technical support
may be provided to solve problems. Measures may be undertaken to make the project running smoothly
and on time. In the monitoring work, important information needed is what has been done and what still
has to be carried out. Since the current monthly reports are text based and photos may be supplied in
addition, no intuitive view of the project progress is available. If the general layout plan with a scale of
1: 1500 (which is a map overlaying the s@ucture design drawing on the survey map) can be input as a digital
map, the project progress repon can be supplied in a digital form with both text arxl progress status in the
map. For example, comparison of progress and costs can be performed by comparing progress maps in
individual time periods. Overview of project status will become much more efficient. Financial statements
and progress payment may also be supported by real status maps showing work completed.
4.1.5 Nwnerical Madeiing: Numerical modelling is a technique to investigate the behaviour of shorelines and the
physical coastal environment using computer technology. It can be used for studying erosion processes,
sho&ine changes, sttudure design, and shoreline erosion prediction. Data needed for numerical modelling
7

inchiding shoreline location, bathymetric data, grain size, wave data, tidal data, and wave approach
direction. More sophisticated numerical model considers effects of wind as well. In an integrated system,
if digital data are available, data for numerical moWling can be organized in GIS and provided to modelling
system such as MIKE 21. The result of the numerical modelling can then be displayed in the GIS
environment. For example, changes of shorelines caused by different input data sets can be overlaid and
compared. The simulatd shoreline can also be displayed with other features such as land parcels, and land
use classes, so that effects of erosion can be assessed. After modelling, the newly calculated bathymetry
can also be displayed in 3-D with other data layers together.
4.2
4.2.1 Based on the review of the internal and external working environment and GIS needs, as well as suggested
hardware and software configurations, a general design of functions is presented which serves as a base for
the detailed data model design. Figure 3 depicts the function model of the GIS system. Data sets input to
the system could be meta data of time series,digitized/scatmed hard copy maps, existing digital maps, coastal
engineering drawings, and scanned aerial photographs. These data are all in certain digital formats, if the
digital format does not match the native format of GIS, in the case ArcJnfo, a data format conversion
(filtering) becomes necessary. If the data source is of an analog form, an analog to digital (A/D) conversion
such as digitizing or scanning has to be performed before the information can be used in GIS. Three major
application areas will be concerned in the development of the GIS, namely Shoreline Erosion Monitoring,
Coastal Engineering Management aad Coastal Data Inventory. They will be built based on ArcInfo system.
4.2.2 Shoreline Erosion Monitoring Sub-sysrem: Under coastal erosion monitoring, shoreline erosion conditions
at the naiional level are stored in the database. Shorelines are classitled into four categories and represented
on a map. This is implemented by using the existing results of the National Coastal Erosion Study (Stanley
1985). In this digital map, a base map with state and district boundaries is included. Shoreline with
different erosion categories are represented by different colors and/or patterns as shown in Figure 4.
Specific information can be queried by clicking a mouse at a shoreline segment of interest. This kind of
information is saved in databases and associated with spatial entities of the map, including location, length
of coast affected, area or number of lots affected, protection works, description of erosion categories, and
even a picture of a typical scene of the erosion in this area. In this sense, a map in GIS is not only a map.
lt integrates spatial and non-spatial data iu a unique system and allows flexible queries. Similar digital maps
are also generated, for example digital shoreline material distribution, critical erosion sites, and locations
of existing erosion control structures. The digital map displayed could represent various erosion related
factors. If a specific location is of interest, it can be zoomed at an appropriate scale factor. Further queries
may be performed as well.
8

4.2.3 Monitoring of shoreline erosion needs a long term commitment. Objective decisions should be made based
on erosion monitoring data acquired cumulatively during a long period of time. Therefore, efficient and
economic ways for acquiring these data are an important issue in implementing the GIS application in
erosion monitoring. Shoreline mapping is a procedure to locate the geometric position of the shoreline.
Depending on the scale of maps to be generated, various methods can be selected. For example, if a
segment of shoreline is found to be severely eroded, a large scale shoreline mapping may be performed to
record the hard evidence of the erosion status. These data can also be used to design coastal engineering
prc4e&m-. Small scale mapping covers large areas. However, details of objects are not mapped.
Usually, small scale mapping is used to provide global information covering large areas. Currently, there
are two key technologies in mapping which make survey and mapping efficient, affordable, and easier,
namely Gps (Global Positioning System) and Softcopy Photogrammetry . With these new technologies,
periodical shoreline mapping will become easier. A lot of field work can be reduced and most of the
shoreline measurement can even be performed in offices.
4.2.4 Coastui Engineetinghfanagement Sub-system: The wastal engineering subsystem will cover functions related
to current activities of CED. A successful implementation of this part will greatly improve the productivity
of CED. In this GIS environment, basic data for design such as topographic data, bathymetric data, locations
of time series data etc. are managed and geo-referenced in a unique system, without influence of scale,
projection, and information generalization. For example, a digital topographic/ hydrographic map can be
overlaid with a cadastral map and an erosion condition map to find lots/parcels that will be affected by coastal
erosion. Design of a coastal structure may be accomplished on the screen in an interactive mode. l&vermouth
dredging may be planned more efficiently using GIS as powerful tools because this system provides a unique
environment for interactively defining the dredging boundaries, monitoring dredging progress, and
representing post-dredging survey results. In this part of the system, a lot of CED tasks such as structure
design, coastal project monitoring, river mouth dredging, coastal zone development management, numerical
modeling, and shoreline identification and mapping, are involved. These activities need specifti coastal
engineering and modeling software packages that are usually not provided by a commercial GIS &ware
system. This will require the integration of these functions fo special application software to the GIS
environment. Figure 5 shows a sample output of a coastal erosion control project monitoring system.
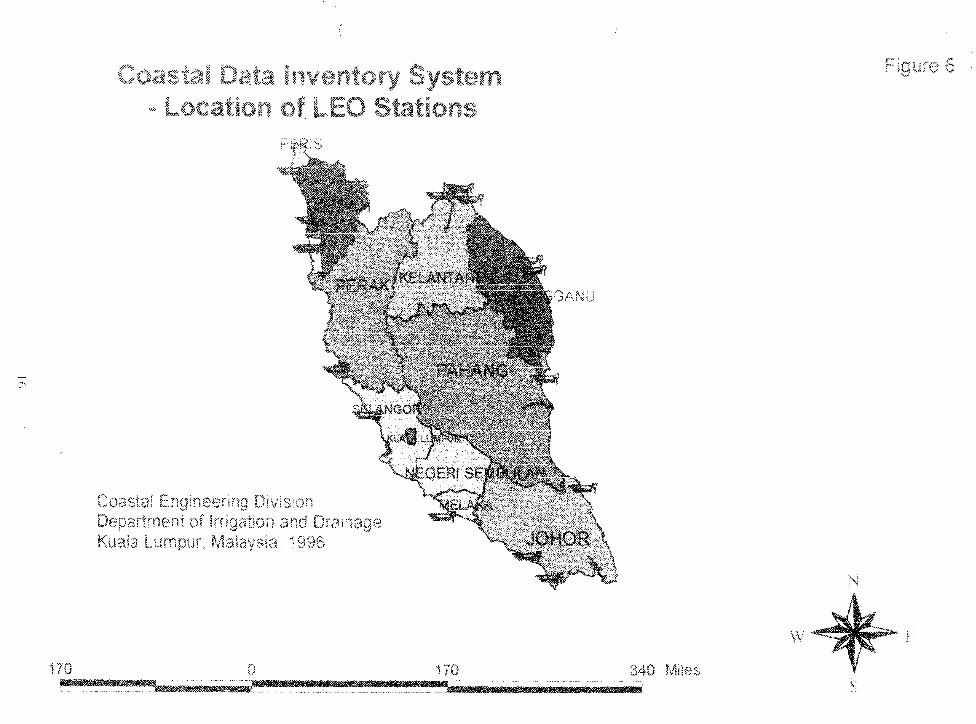
4..2.5 Coastal Data Inventory Sub-system: The third part of the GIS system is coastal data inventory. The GIS is
also a central coastal data inventory unit at the same time. If digital data are available at CED, they ~111 be
directily stired in the database. For digital data that are very large and not of spatial nature such as time series
data, a meta data file may be stored instead of the actual data set its& The meta data supplies information
such as data collector, reference system, datum, date of collection, format for retrieving, storage site,
availability, contact person etc. With this meta data information, users would be able to have an overview of
data collected and to know how to request. This is also beneficial to data collection planning. Other data
which can be reg&ered as meta data are hardcopy maps and photos, as well as digital data at other government
9

4.3
agencies and the private sector. Query of the database should be graphic and interactive and the user can query
either by location or by data types, A sample base map displaying meta data about LEO stations and flight
paths of aerial photographs is as shown in Figure 6.
The system will output results in various forms. Graphic display on the computer screen is the best way to
check the results and perform operations for further improvements. This is especially important when data
sets involved are multi-layer oriented, and complicated spatial operations are applied, Digital maps will be
generated in ArcInfo format. They will be output to a plotter if necessary. In many cases, users/clients would
prefer databases instead of maps. However, this requires that the user has a compatible system which will be
able to read the data.
5 Implementation
5.1 The Technical Assistance Project was implemented through close collaboration between the Specialists and
CED. In introducing GIS technology and data management systems to CED, the Project focused on the
concept of ‘appropriate technology’ which could be integrated into CED’s programmes seamlessly taking into
consideration the following factors;
. That computer and dats management technology already resided at CED and the staff were
knowledgeable in the use of such resident technology;
. Plans to introduce new technology should make full use of existing skills and technology;
. New work should be integrated into existing workloads seamlessly;
. Future work generated by new technology should build on existing capability and make use
of existing datasets and;
. Further development of GIS and data management technology at CED should be self-
directed.
5.2 In summary, at the end of the TA in July 1996, a state of the art computer system with relevant hardware and
sottware was installed in CED, models for spatial and non-spatial data were developed and installed, and
training of CED’s staff was successfuly conducted. Considering the extremely detailed and vast volume of data
and limited time available for the project, the GIS functional model developed was implemented and tested
at both the national and local levels for the Shoreline Erosion Monitoring Subsystem, Coastal Engineering
Management Subsystem and Coasti Data Inventory Subsystem with real spatial and time series data for a pilot
project in Penang. Provisions are currently being made to collect and enter all relevant data to extend the
coverage of the GIS system to the whole country.
10

6 Conclusions
The GIS framework for shoreline management and the coastal engineering database for time series, spatial and
meta data are extremely useful tools in a variety of coastal engineering applications and for the generation of
reports This will enhance CEDs capability in its current coastal erosion control programme and assist CED
in moving towards a longer term goal of shoreline management for sustainable development in the coastal
zone. However, to make the GIS database a truly useful coastal engineering tool on a routine basis will require
substantial training of existing staff, acquisition of new staff in GIS related field; an on-going investment in
updating the database by appending new data; the continual operation and maintenance of the GIS database
and associated files; the development of appropriate application programmes and upgrading or expansion of
hardware and software to keep abreast of current technology
REFERENCES
Stanley 1985. Final Report of National Coastal Erosion St&. Stanley Consultants, Vol. I and II.
Li, R 1994, 1995,1996. ADB TA 1604 -Mal, Institutional Strengtheningfor Shoreline Management First, Second
and Final report of GIS Specialist, AGIU. Earth & Environment Limited, Calgary, Alberta, Canada.
Li, R and W.K. Cho 1996. Geographical Information Systems for Shoreline A4anagement- A Malaysian Experience
Ramcharan, E. and CA. Ooi 1996. Institutional Strengtheningfor Shoreline Management -Approaches, Strategies
and Results of a Technical Assistance Prqject.
11

i’“‘- Pa*sSvPh, , -..-..-,
i:\ &-;CL $3 c1
Powerware Prestige
3000 LIE
and Powemore
Battery c&net
,
HP SureStore
Tape 2000 HP %mlet 3dAlF -
HP Su~estore
lJptid 2oxt
NEC Versa V/%X PM SlpPb
I .“I -..
.._.,...._.___.I.,..” . . . . . . . . . I * . - . . . . . . . . . , . . , . ” . , , . . . . . , . . . ” . . ._. . . . . . . . . “.“.“._.. . . . . .
~ _, , . . . . . . . . , . . , . . .~. . . . . . “.” . . . . . .._.I.._
3
3 Con Linkldder
FMS I! 24 Port
. . . . . . . - . . . . _ . . . . . . . . . I . . . . . . _
. . . . . . . . . . . . . . . . . . . . . . . . . . . . . ” . . .
Hp JetDirect
.
NEC versa vmc
i HP DeskJet 5&X
Printer
Figure 1 : Hardware Configuration
Pnw swtl ‘r ..-.,.-..- ..-,.-.. -“-“r ..-.. -“-..r ..-.. -.. _,._.,_.__.,_.._.._..-.. - ..-..-..-.. - ..-.. -..-..’
..c-.
! POWS 5up,k , -..-.._
pj
&=+A p,
- ! ..“.......-.......-.-...“._...._.”............. J
Perfect orlicc 3.0 LXA”. 5.0 PowerPoint 7.0
Figure 2 : Software Configuration
12

Photography / Maps
Aerial Photography
m I A/D Filtering Filtering AID
Digitizing Scanning
I
. I I I
I I
Geographical Information System (GIS)
Shoreline Erosion
Monitoring
- Digital Maps of shoreline erosion conditions
. Digital shoreline material distribution
- Critical erosion sites - Shoreline change detection
Coastal Engineering
Management
- Structure Design - Coastal zone management - Coastal project monitoring - Rivermouth and dredging - Numerical modelling - Location ofexisting erosion
control structures
Coastal Data Inventory
- Data input - Base map display - Query by location - Query by data types - Query of existing data - Editing
I
I OUtDllt I I 1 <
I Reports I Digital Maps Graphic Display Databases
Figure 3: GIS Functional Model
13

Figure 4
Legend
Kg Panta, Acheh 1
Kg Panta Acheh 2
Ta Ratu
T g Kechli
Kg Bakar Kapor
m Kampungslcities Erosion Status 1985
A/ No data
./v Critical /V Significant /,Q” Acceptable
/v Stable / Accreting District (Population) I-1 0 - 141086 p] 141087 - 282172
282173 - 423259 m 423260 - 564345 m 564346 - 705432
ig Teluk Trmimyak
Sebe
N
%-
14

Figure 5
Coastal Erosion Control Project Management
r---- - ----. --‘-I--.-----’ _ -----I
41 82 Kilometers
N
W
+k
E
S