gipaw: applications to organic materials - tcm groupjry20/gipaw/org_app.pdfgipaw: applications to...
TRANSCRIPT

GIPAW: Applications to Organic Materials
Jonathan [email protected]
Materials Modelling Laboratory, Oxford Materials

GIPAW: Zurich 2009 Jonathan R. Yates
Oxygen-17 NMR
2
Ray Dupree (Warwick)
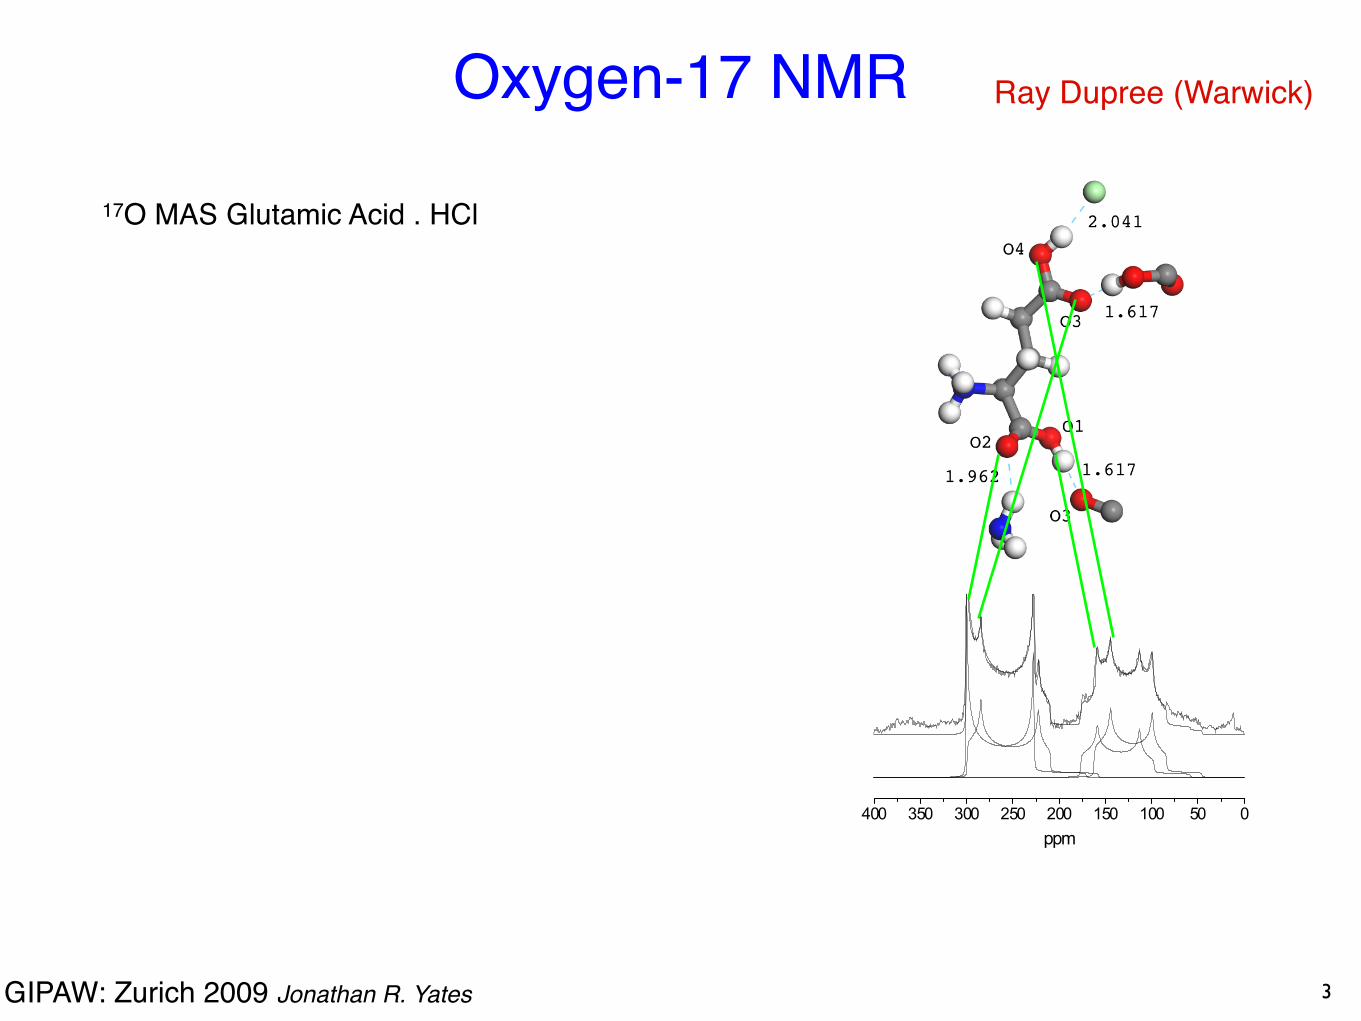
17O MAS Glutamic Acid . HCl
GIPAW: Zurich 2009 Jonathan R. Yates
Oxygen-17 NMR
3
Ray Dupree (Warwick)
17O MAS Glutamic Acid . HCl

GIPAW: Zurich 2009 Jonathan R. Yates
Oxygen-17 NMR
SiteCalculationCalculationCalculation ExperimentExperimentExperiment
Site δiso(ppm) CQ(MHz) ηQ δiso(pm) CQ(MHz) ηQ
O1 177.6 7.72 0.22 172.5 7.45 0.25
O2 316.9 8.61 0.12 322 8.16 0.0
O3 311.0 8.90 0.23 315 8.31 0.17
O4 198.0 8.13 0.21 187 7.49 0.25
3
Ray Dupree (Warwick)
17O MAS Glutamic Acid . HCl
GIPAW: Zurich 2009 Jonathan R. Yates
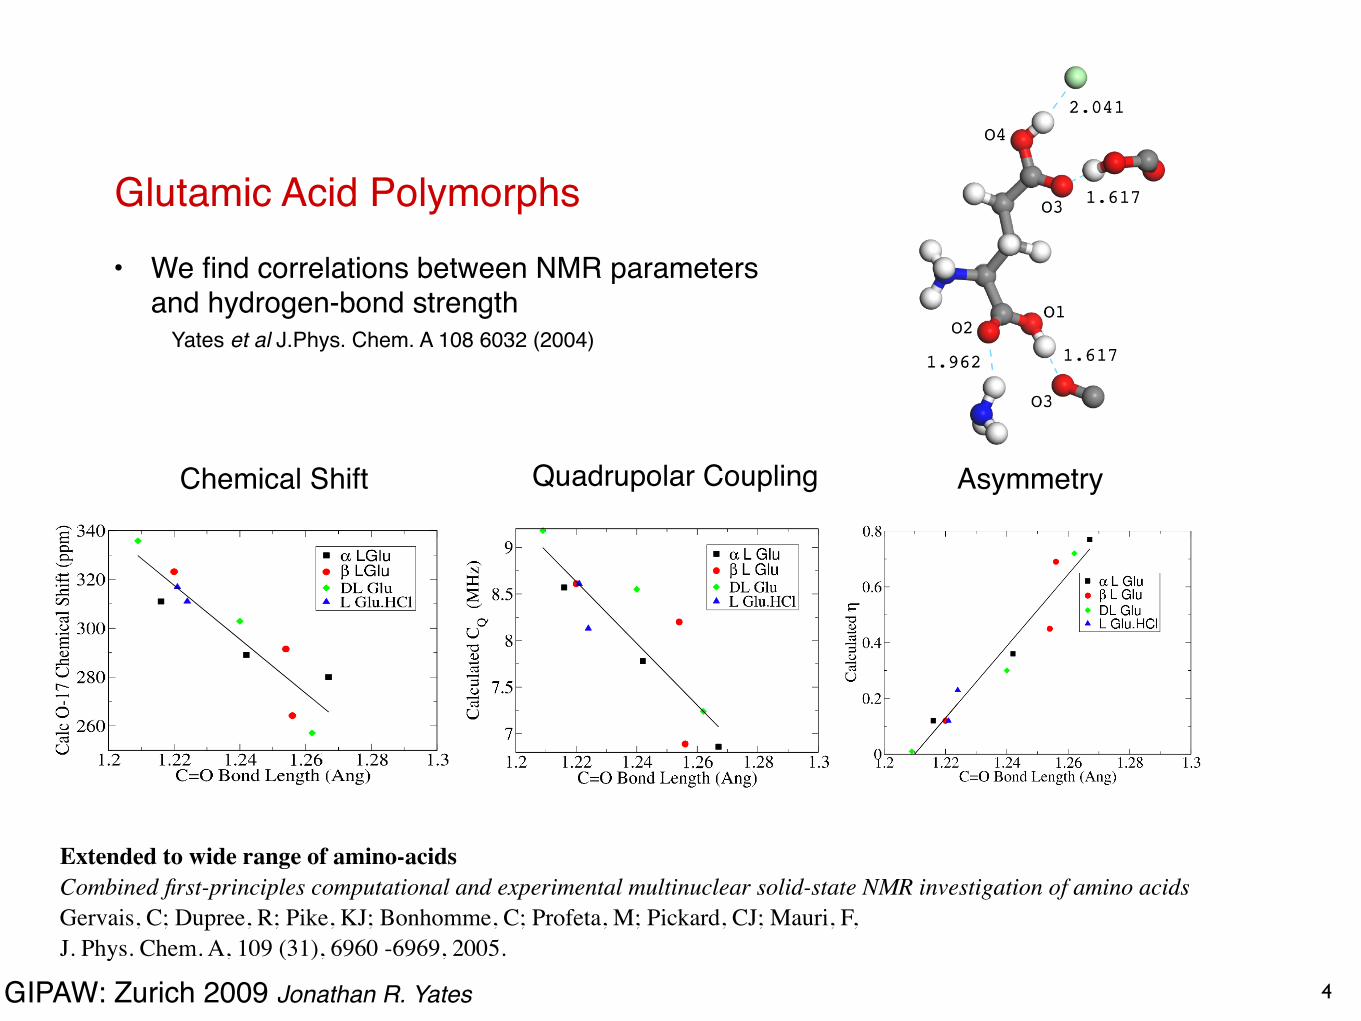
Glutamic Acid Polymorphs• We find correlations between NMR parameters
and hydrogen-bond strength Yates et al J.Phys. Chem. A 108 6032 (2004)
Chemical Shift Quadrupolar Coupling Asymmetry
4
Extended to wide range of amino-acidsCombined first-principles computational and experimental multinuclear solid-state NMR investigation of amino acidsGervais, C; Dupree, R; Pike, KJ; Bonhomme, C; Profeta, M; Pickard, CJ; Mauri, F,J. Phys. Chem. A, 109 (31), 6960 -6969, 2005.
GIPAW: Zurich 2009 Jonathan R. Yates
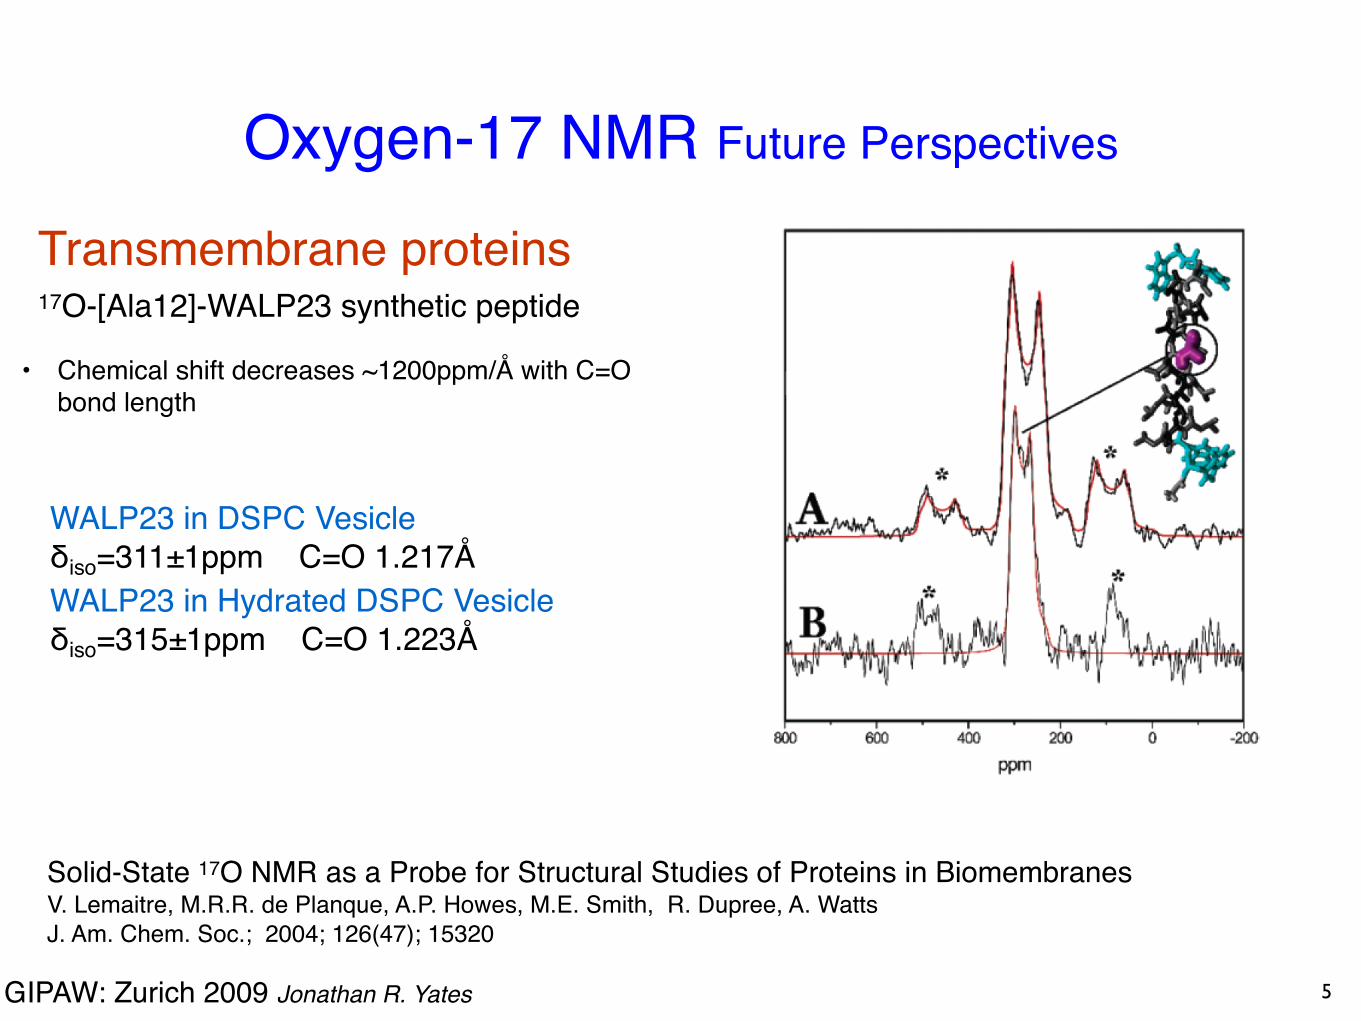
Oxygen-17 NMR Future Perspectives
Solid-State 17O NMR as a Probe for Structural Studies of Proteins in BiomembranesV. Lemaitre, M.R.R. de Planque, A.P. Howes, M.E. Smith, R. Dupree, A. Watts J. Am. Chem. Soc.; 2004; 126(47); 15320
Transmembrane proteins 17O-[Ala12]-WALP23 synthetic peptide
WALP23 in DSPC Vesicleδiso=311±1ppm C=O 1.217ÅWALP23 in Hydrated DSPC Vesicleδiso=315±1ppm C=O 1.223Å
5
• Chemical shift decreases ~1200ppm/Å with C=O bond length

GIPAW: Zurich 2009 Jonathan R. Yates
13C axis
1H axis
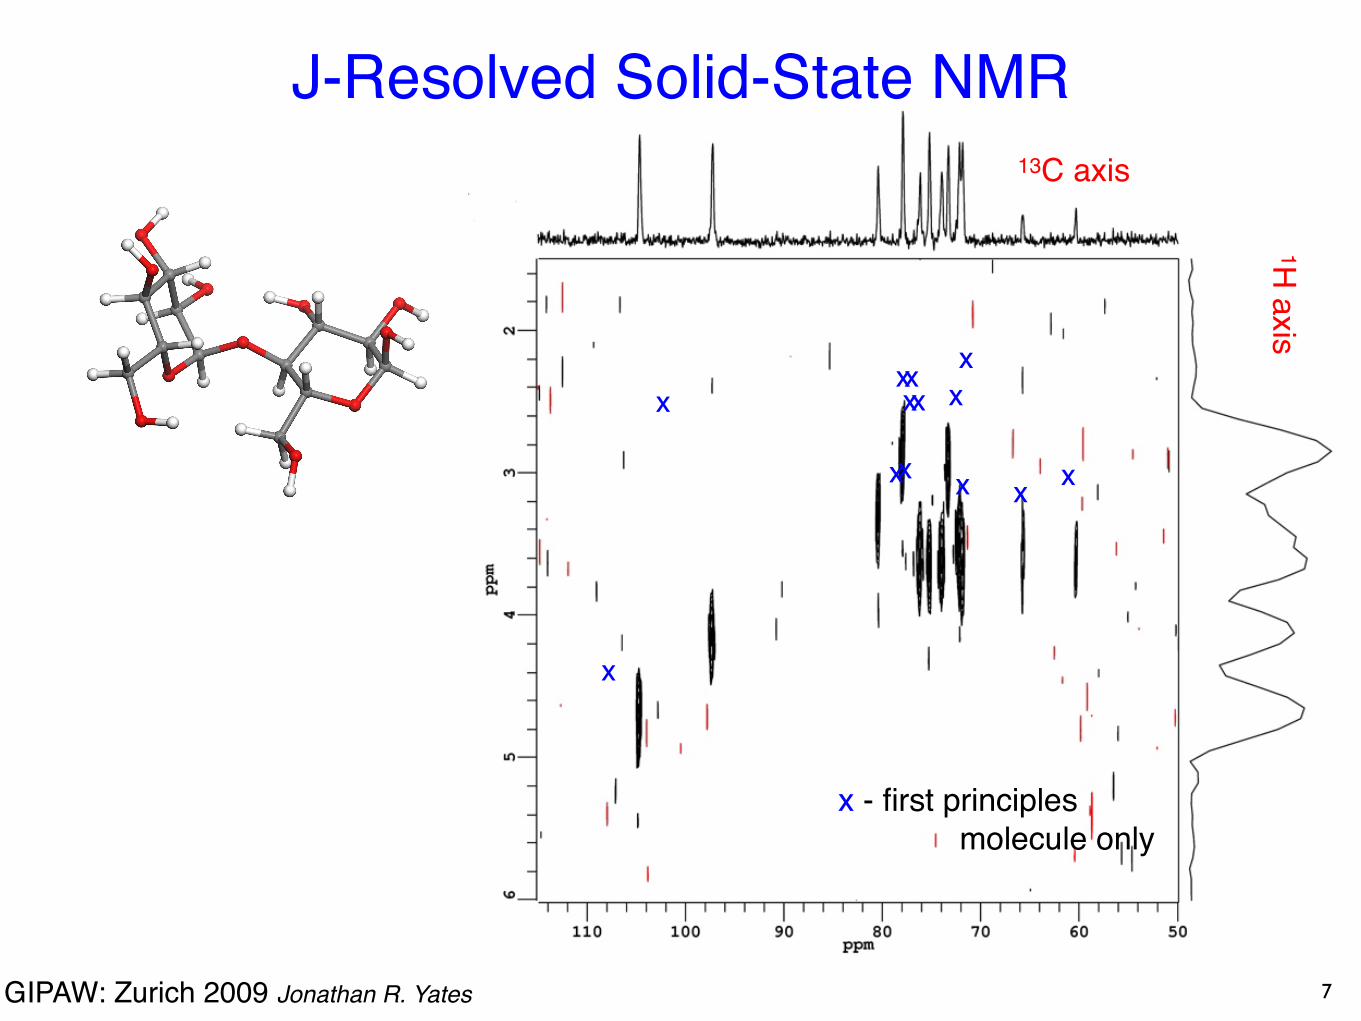
Maltosesugar used in brewing
Cross-peaks when J-coupling between spins: -C-H “bonds”
J-Resolved Solid-State NMR
6
Steven Brown (Warwick)
MAS-J-HMQC
GIPAW: Zurich 2009 Jonathan R. Yates
xx
x
x
x
xx
x x
xxxx
x - first principlesmolecule only
13C axis
1H axisJ-Resolved Solid-State NMR
7

GIPAW: Zurich 2009 Jonathan R. Yates
x - first principlesfull crystalJ. Am. Chem. Soc. 127 10216 (2005)
J. Am. Chem. Soc. 130 945 (2008)
Molecule to solid variation due to intermolecular interactions (weak hydrogen bonds)
13C axis
1H axisJ-Resolved Solid-State NMR
8
GIPAW: Zurich 2009 Jonathan R. Yates
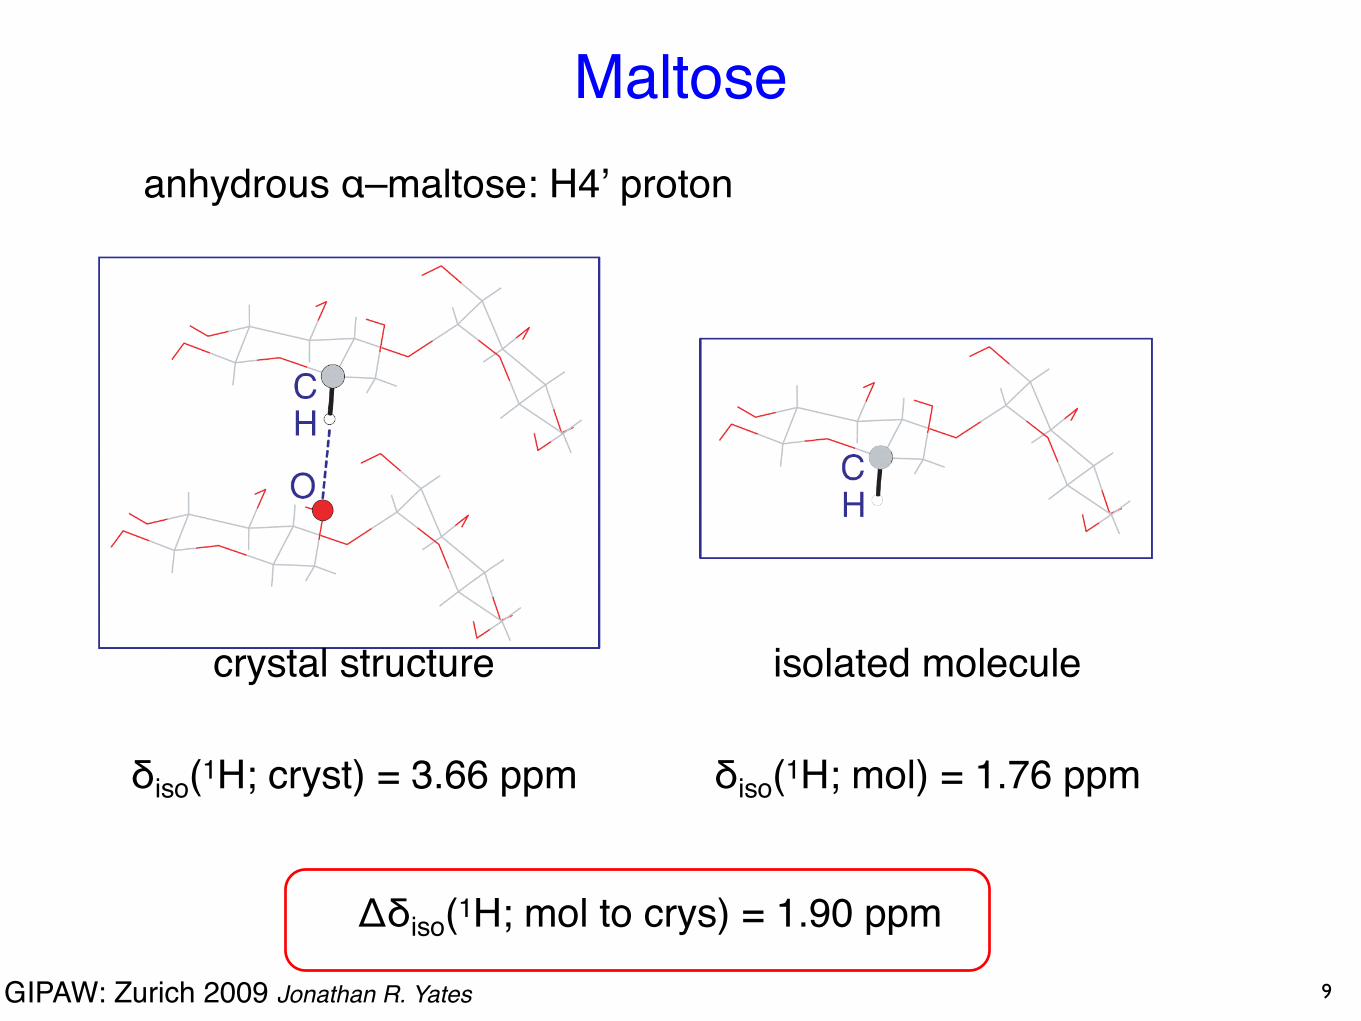
anhydrous α–maltose: H4ʼ proton
crystal structure
δiso(1H; cryst) = 3.66 ppm
isolated molecule
δiso(1H; mol) = 1.76 ppm
Δδiso(1H; mol to crys) = 1.90 ppm
Maltose
9

GIPAW: Zurich 2009 Jonathan R. Yates
Intermolecular “Weak” Hydrogen bonds
Correlation between a large calculated Δδiso(1H; mol to crys) anda short H...O intermolecular distance (<2.7)
and a CHO bond angle greater than 130 degrees
Yates et-al J. Am. Chem. Soc. 127 10216 (2005)10

GIPAW: Zurich 2009 Jonathan R. Yates
Uracil
Figure 1. The crystal structure adopted by uracil. (a) Planar arrangement (b)Conventional N H· · ·O and weak C H· · ·O hydrogen bonding within a plane. Colorcoding: C black, O red, N blue, H grey. The XHY angle, the H· · ·X distance (in red)and the XY distance (in brackets) are indicated.
9
Isolate H-bonding from ring currents
Doner Δδ(Mol-Xal)
N-H 5.1
N-H 5.4
C-H 2.0
C-H 2.2
11J. Am. Chem. Soc. 130 945 (2008)

GIPAW: Zurich 2009 Jonathan R. Yates
NMR CrystallographyRegulatory requirement to identify polymorphic
forms of new pharmaceuticals328 R. K. Harris et al.
(a)
(b)
Figure 3. 50-MHz 13C CP/MAS spectra of (a) white and (b) yellow forms of MNA.
Table 2. Carbon-13 chemical shifts for of MNA, given in ppm
Form C1b,c C2c C3 C4c C5 C6 C7 C8b,c C9
Solutiona 132.2 136.2 125.2 133.1 136.4 121.9 20.4 168.4 25.4White 128.5 144.9 125.1 136.4 132.9 124.0 20.1 173.4 23.8
126.3 – – – – – – 171.7 –Yellow 132.8 135.4 126.0 136.7 138.2 123.2 20.9 171.4 25.8
130.8 133.9 124.0 135.4 136.2 122.7 20.5 169.6 25.8?d – – – – – – 168.1 –
a In CDCl3. For data in other solvents, see Ref. 31.b Resonance split by residual dipolar coupling to 14N.c Quaternary carbon as revealed by a dipolar dephasing experiment.d Signals for the second C1 not located, but presumed to be to high frequency by ca 1 ppm.
and solution states are likely also to arise principally fromdihedral angle changes. Furthermore, there are significantdifferences in shifts between the two polymorphs for carbonsC4 and C7. These are perhaps a reflection of the variationsin crystal packing between the two polymorphs. Significantsplittings are observed for carbons C2, C3, C4, C5 and C8 inthe spectrum of the yellow form, attributable to the presenceof two molecules in the asymmetric unit. There is alsosuch a crystallographic splitting for C1; while this cannotbe definitively confirmed from the 50-MHz spectrum, apreliminary high-field spectrum reveals it. Smaller splittingsare seen for C6 and C7.
Figure 4 shows the variations in 13C NMR shielding forisolated MNA molecules, computed using the Gaussianprogram,33 as a function of !. There is clearly an effectfrom molecular conformation on the nuclear shielding. Adramatic influence on the shieldings of carbons C2, C4 andC6 is observed with changes in !. When the amide group iscoplanar with the benzene ring, transfer of the amide lonepair to the circulating "-electrons is made easier and theelectron densities at the carbon nuclei of the benzene ringare increased, thereby inducing a diamagnetic shielding of
these nuclei. While a shielding effect was observed for C1,C3 and C5, the reverse effect was seen for C2, C4 and C6,as rotation about C1–N1 leads to a coplanar conformation.Barfield and Fagerness34 have also observed an analogouseffect in a series of aminopyrimidines and aminobenzenes.When the amide plane is perpendicular to the benzene ring,delocalisation of the carbonyl electrons and the amide lonepair is minimised, thereby causing a deshielding of the C8carbon. A discontinuity is observed in Fig. 4 near a ! value of85°. This is likely to be attributable to changes in the planarityof the amide group and hence in electron localisation in thisregion.
A close inspection of the plots shown in Fig. 4 revealsthat at some points along the x-axis, a slice taken parallelto the y-axis is likely to generate a stick spectrum of theexperimental 13C CP/MAS spectrum. The shaded regionswithin the plots cover such slices, and it is in relation to theseshaded regions that the experimental spectrum is reproducedreasonably well. It is therefore possible, from a plot of 13CNMR shielding vs ! when compared with the experimentalspectrum, that a range of ! values may be determined for asample under investigation, without prior knowledge of its
Copyright ! 2006 John Wiley & Sons, Ltd. Magn. Reson. Chem. 2006; 44: 325–333
4-Methyl-2-nitroacetanilide (MNA)
“yellow” MNA
“white” MNA
12
S178 R. K. Harris et al.
for individual resonances. The ˛ form of testosterone (seebelow), for instance, has 22 of the 38 resonances (total forthe two independent molecules) with differences of less than2 ppm between computed and experimental chemical shifts,and all but two of the remaining shifts are fitted to between2.0 and 4.5 ppm. However, the two computed values for C5differ by 11.9 and 10.6 ppm from the experimental results.Similar problems have been seen to occur with some otherconjugated systems. There is no obvious reason for suchdiscrepancies and further work is obviously necessary totry to pinpoint their origin. As a result of such problems,attention is often directed away from individual results andtowards shift differences between corresponding carbonsof molecules which differ as little as possible, as discussedbelow (see below).
(II)
!2
3
1
4
6
5
8
O1
NH1
"
CH3
9
N+
2O#
3
O2
CH37
There are many instances where useful chemical orspectroscopic information can be obtained from the com-putations:
Figure 1. Experimental versus calculated (NMR-CASTEP)isotropic 13C chemical shifts for the white and yellow forms ofII24 The straight line represents perfect agreement betweencalculation and experiment.
Assignment of NMR signalsWhilst there are many experimental ways of assigningNMR spectra, ambiguous or doubtful cases can arise,especially for solids, where the range of experimentscan be lower than that for solutions (and resolution iscertainly poorer). In fact, solid-state assignments are oftenmade by analogy with those for corresponding solutions.However, this is dangerous because it ignores the effectsof crystal packing and of differences in geometry orconformation – identifying which may be the object of theexercise! Computing can help, as in the case of Form I offinasteride (III).25 There is disagreement in the literatureregarding the assignments of 13C signals at 164.3 and169.3 ppm. Wenslow et al.26 assign the former to C3 and thelatter to C20, but Morzycki et al.27 reversed this assignment,using arguments based on expectations of hydrogen-bondingchanges between solution and solid states. Both carbonsare quaternary, so simple dipolar dephasing experimentscannot distinguish between them. We have carried outNMR-CASTEP computations on finasteride Form I. Thecomputed shift for C3 is 161.7 ppm and that for C20 is 166.6when hydrogen positions alone are optimised. The sign ofthe difference strongly supports the original assignmentsof Wenslow et al.,26 and the magnitude is in excellentagreement with experiment. This assignment has nowbeen confirmed by INADEQUATE experiments,28 whichestablish atomic connectivities. However, these experimentstook six days of a high-field spectrometer. Computers aremore readily available than state-of-the-art solid-state NMRspectrometers; thus, in principle, precious spectrometer timecan be saved through the use of computing!
(III)
10
5
1
N
2
3
8
7
9
6
13
14
1211
17
16
15
20 N
H
O
18
H3C
H3C
H3C
CH3
CH3
19
H
HO
2223
24
25
H
B
C D
A
Multi-nuclear aspectsNMR-CASTEP computations give simultaneous results forany NMR-active nuclide in the relevant molecule. Severalpublications present data for nuclides other than 13C15,20,29 – 32
(although the present article largely focuses on applicationsto organic molecular solids for which only a handfulof elements are normally relevant). As an example ofcomputation on a different nuclide, we mention here recentwork which used NMR-CASTEP calculations to fully assignthe 19F spectrum of octafluoronaphthalene (IV) to the
Copyright ! 2007 John Wiley & Sons, Ltd. Magn. Reson. Chem. 2007; 45: S174–S186DOI: 10.1002/mrc
Magn. Reson. Chem. 44 325-333 (2006)

GIPAW: Zurich 2009 Jonathan R. Yates
Two molecules in Asymmetric Unit
13
Chemical shift computations on a crystallographic basis S181
Table 3. Computed and experimental 13C crystallographic splittings for ˛ testosteronea 21
Splitting/ppm Splitting/ppmCarbon Carbonnumber Computed Experimental number Computed Experimental
1 !0.10 !1.01 11 !1.23 C0.972 1.74 C0.79 12 !0.50 !1.633 !0.33 "1.50b 13 !0.19 C0.10c
4 1.69 "0.50b 14 !0.00 !0.725 !0.16 !1.45 15 0.50 "0.10b
6 1.22 C0.26 16 0.17 C0.33c
7 0.50 C0.15c 17 !3.40 !2.348 1.59 C0.48 18 0.14 !0.549 !0.13 !1.12 19 0.73 C0.64
10 1.11 C0.46
a Signs given as U – V.b Signs not accessed experimentally.c The splitting sign is not certain on the simple basis of the experimental data, although suggested.Of course, changing the sign of these entries would affect other pairs, including C17 (see Ref. 24).
Figure 4. Aliphatic region of the 13C spectrum for the ˛ form of testosterone (VII), showing the assignment of the doublet lines to thetwo independent molecules, as demonstrated by an INADEQUATE experiment combined with computation of the chemical shifts.Blue numbers correspond to molecule V, whereas red numbers refer to molecule U (see Fig. 3). Reproduced with permission fromRef. 37.
example, Refs 3, and 38–41. NMR-CASTEP computationsautomatically produce the individual tensor componentsand thus the anisotropy and asymmetry of shielding, whichare in essence differences in shielding values for the samenucleus. This is the third case where comparison of chemicalshifts for the same chemical entity (indeed, for anisotropies,the identical molecule in different orientations with respectto the applied magnetic field) is involved, so that it providesa good test of the efficacy of the computations. Severaluncertainties in the NMR (referencing) and the molecularsituation (e.g. only one geometry) are minimised, resulting inan expectation of increased accuracy from that point of viewand throwing the burden of accuracy on the validity of thecomputations. Some CASTEP-NMR results for anisotropieshave been reported for ˛ testosterone,21 phenylphosphonicacid30 and for several aminoacids.31
In Table 5, we report the computed shielding parametersfor the antibiotic ampicillin (VIII) and compare them withthe experimental results of Antzutkin et al.42 The details ofthe computation are identical to those reported in Ref. 20.The agreement between the computed and experimentalparameters is generally good, both for the isotropic shiftsand for the anisotropies and asymmetries. The greatestdifferences between computed and experimental isotropic
shifts occur at either end of the shift range as both the methyland carbonyl resonances are underestimated by 10 ppm.For the anisotropy (Fig. 5), some deviation is found for thearomatic sites, and there is also a major puzzle for C3, forwhich the computation seems to give the wrong sign eventhough the asymmetry is not near 1. It is instructive toview the computed results as a plot of anisotropy versusisotropic shift as in Fig. 6. In such a plot, the systematicnature of the errors in the computed results is evident. FromFig. 6, we can assign the two methyl sites, C9 and C10 tothe peaks at 30.2 and 28.9 ppm respectively, in agreementwith the assignment in Ref. 42, which reversed that ofRef. 43. Distinctions between the resonances of the aromaticring sites are less clear because the differences are small.Clearly, using two independent parameters provides a wayto compensate for the errors in the computations, leading tomore reliable assignments; instead of utilising chemical shiftanisotropy information, related approaches have been usingquadrupolar parameters31,44 or a two-dimensional MAS-J-HMQC spectrum correlating 13C and 1H chemical shifts.29
Effects of crystal packingIt is of considerable interest to determine to what extentobserved differences between chemical shifts for isolated
Copyright ! 2007 John Wiley & Sons, Ltd. Magn. Reson. Chem. 2007; 45: S174–S186DOI: 10.1002/mrc
S180 R. K. Harris et al.
(VI)
7
6 9
1N1
14
10
11
1312
5
4
23
15
OH2N2
!
8
specific atomic positions in the crystal structure34 – the low-frequency component relates to C1.
The crystallographic asymmetric unitCases of particular interest arise when there is more thanone independent molecule of the same chemical speciesin the crystallographic unit cell. Connectivity experiments,such as INADEQUATE, can link resonances for the sameindependent molecule, but only computing can then assignthe independent molecules to their correct crystallographicsite. Since the computation involves differences betweenclosely similar molecules (i.e. the same chemical species),many of the uncertainties are minimised. At the same time,the shift differences are quite small, so that such casesprovide a good test of the power of NMR-CASTEP. Thissituation has been demonstrated21 for the ˛ (anhydrous)form of testosterone (VII), which has two moleculesin the asymmetric unit, designated U and V (Fig. 3).Since the molecules in question are chemically identical,though crystallographically different, comparison betweenthe computational results should be more accurate thanwhen comparing those between different compounds.
(VII)
A B
C D1
2
3
45
6
7
89
10
11
12
13
14 15
16
17
19CH3
18CH3
O
OH
Table 3 shows21 the results (following optimisation ofproton positions) for the crystallographic splittings, withthe signs for the computed shifts given as U – V. Theconnectivities between atoms were established, as faras possible, by INADEQUATE experiments, thus linkingsignals for the two independent molecules separately. Therelative signs of the experimental splittings agree with thosefrom computation for each of the four carbon atoms wherethe experimental splitting is more than 1 ppm and its relative
Figure 3. The two independent molecules in the ˛ form oftestosterone35.
sign is known, provided one of the two possible assignmentsof experimental resonances to U and V molecules is made(as in the Table). The correct sign is also found fornearly all the remaining carbon signals of known relativeexperimental sign. Whilst the magnitudes of the splittingsare not well reproduced, one can be moderately confidentthat the assignments to U and V molecules are correct,though the result for C11 remains anomalous. At least theprinciple is established that signals may be linked to specificcrystallographic sites (Fig. 4) for cases with crystallographicsplittings by combining two-dimensional NMR correlationexperiments with computation. A similar approach wasused36 for vitamin-D3, which also had two molecules inthe asymmetric unit. In that case, apparently disorderedregions of the crystal structure were refined using a similarcomputer program to CASTEP, though chemical shifts werecomputed on a molecular basis.
Polymorphic formsPolymorphs form a particularly important class of systems,especially for pharmaceutical industry. They can normally becharacterised by their NMR spectra since both geometry andpacking differences affect chemical shifts. These small differ-ences are ideal for testing the power of the computationalmethods. Since the molecules are the same chemically, com-putations of the shift differences between analogous nucleishould be relatively accurate, since some of the causes oferror get partially cancelled, as has already been empha-sised. This has indeed proved to be the case21 for the ˛ andˇ forms of testosterone (though, strictly speaking, these arenot polymorphs, the ˇ form being a monohydrate). Table 4shows the experimental and computed 13C shift differencesbetween the ˛ and ˇ forms. The relative signs of the exper-imental differences agree with those from computation in10 out of the 13 cases where the experimental magnitudeis greater than 0.5 ppm. This is an impressive result, giventhat it is based on relatively old diffraction-derived crystalstructures, requiring geometry optimisation for the protons.
Shielding tensor componentsAnother useful test of the accuracy of the computationalmethods lies in consideration of the full shielding tensor,as has been extensively investigated by the group ofD.M. Grant using molecule-based programmes – see, for
Copyright ! 2007 John Wiley & Sons, Ltd. Magn. Reson. Chem. 2007; 45: S174–S186DOI: 10.1002/mrc
known3,30 that reported uncertainties in atomic positions fromdi!raction measurements can propagate to significant com-puted chemical shift variations. The crystal structure is ratherold and therefore it is quite likely that the resolution is not asaccurate as this level of calculation would require. The forceson the constrained atoms after the partial geometry optimisa-tion was performed were still moderately large (B1.2 eV A!1),which indicates that further optimisation of this structurewould yield significant changes from that obtained experimen-tally. Additional calculations proved that this was indeed thecase. However, the merit of this type of approach is unclear
given that the simulation (which calculates what the structurewould be at 0 K without zero-point vibrations) and experi-mental determination are performed under very di!erentcircumstances. It is also feasible that errors in the computedshifts might be attributable to a limitation of the densityfunctional in adequately describing electron correlation inthe region of this particular carbon. It would be interestingto investigate this possibility further, although the size of thesystem would make this an expensive calculation for higherlevels of theory. It may be noted that the C5 shift does notappear to be so anomalous if the slope of the correlation is notconstrained to be unity.Computations have also been carried out for the b form (see
the electronic supplementary information (ESI)), and Fig. 5 isa plot of the combined data for the two forms. The computedshielding constants were converted to chemical shifts by theprocedure mentioned in the experimental section.Note that the 2-D experiment also enabled us to correlate
most, though not all, the signals for a given independentmolecule of the a form (see Table 1 and Fig. 2 and 3) butthat we cannot from the NMR experiment alone determinewhich molecule is which. The experimental crystallographicsplittings are given in Table 2, with the relative signs where
Fig. 4 Expansions of the INADEQUATE spectrum, revealing spe-
cific correlations for the crowded region of the 1-D spectrum.
Fig. 2 The 176 MHz 13C spectrum for the a form of testosterone: (a)
High-frequency region; (b) low-frequency region.
Fig. 3 Low-frequency region of the INADEQUATE spectrum of the
a form of testosterone, obtained using the 11.7 T spectrometer. The
1-D traces are from the 176 MHz spectrum. The assignments of the
two independent molecules are given in di!erent colours.
140 | Phys. Chem. Chem. Phys., 2006, 8, 137–143 This journal is "c the Owner Societies 2006
INADEQUATE spectrum
Robin K. Harris, Sian A. Joyce, Chris J. Pickard, Sylvian Cadars and Lyndon EmsleyPhys. Chem. Chem. Phys., 2006, 8, 137
Testosterone
GIPAW: Zurich 2009 Jonathan R. Yates 14
phenomenological, but no attempt has been made to quantifythis error yet.
Molecular modelling was performed with the Xplor-NIHmolecular modelling package,25 as described previously.10
We used a standard molecular modelling force field includingcovalent terms (bond, angles, planarity) and van der Waalsterms (both intra- and inter-molecular) to ensure a reasonablegeometry.
The experimental NMR restraints were included by thedefinition of a PSD force field defined as
EPSD = aPSD ! wPSD2 (2)
where aPSD = 104.5 kJ mol"1 is the weight of this potential.This weight ensures that the agreement with the proton spin-di!usion experimental data will be the dominant term in theenergy expansion during the molecular modelling optimiza-tion (about 15 times the energy due to the other potentialsafter optimization).
To determine the uncertainty on the values of w2, noise with astandard deviation equal to 1% of the volume of the most intensepeak (methyl peak) was repeatedly added to the experimentalvolumes in the build-up curves, and the calculated build-upcurves were refitted. The resulting probability distribution forw2 has a standard deviation of 0.55, that yields a 66% chance ofgetting the correct value in an interval of w2 # s.
2e DFT Calculations
Geometry optimizations and chemical shift calculations werecarried out using the DFT program CASTEP.26 CASTEP usesa planewave basis set to describe the wavefunctions (it thus hasan implicit translational symmetry) and is very well adapted tothe description of solid crystalline systems. The GIPAWmethod,27 used with ultrasoft pseudo-potentials,28 providesan e"cient method to calculate chemical shifts in crystallinesolids.29
The geometry optimizations were carried out using the PBEfunctional,30 a cut-o! energy of 610 eV, ultrasoft pseudo-potentials generated on the fly and a 2 ! 2 ! 2Monkhorst–Pack k-point grid.31 These parameters wereoptimized for convergence of the quantity of interest.
Chemical shieldings scalc were calculated using the sameparameters as those used for the geometry optimization. Theywere then converted to chemical shifts dcalc using eqn (3):
dcalc = sref " scalc (3)
The reference shielding sref was determined by fitting thechemical shieldings calculated for the reference structure tothe experimental chemical shifts, keeping the slope fixed to"1.This value of sref was used to convert all the calculatedshieldings to the calculated chemical shifts. The chemicalshieldings calculated for the methyl protons were averagedover the three protons to obtain a calculated shielding for eachmethyl group.
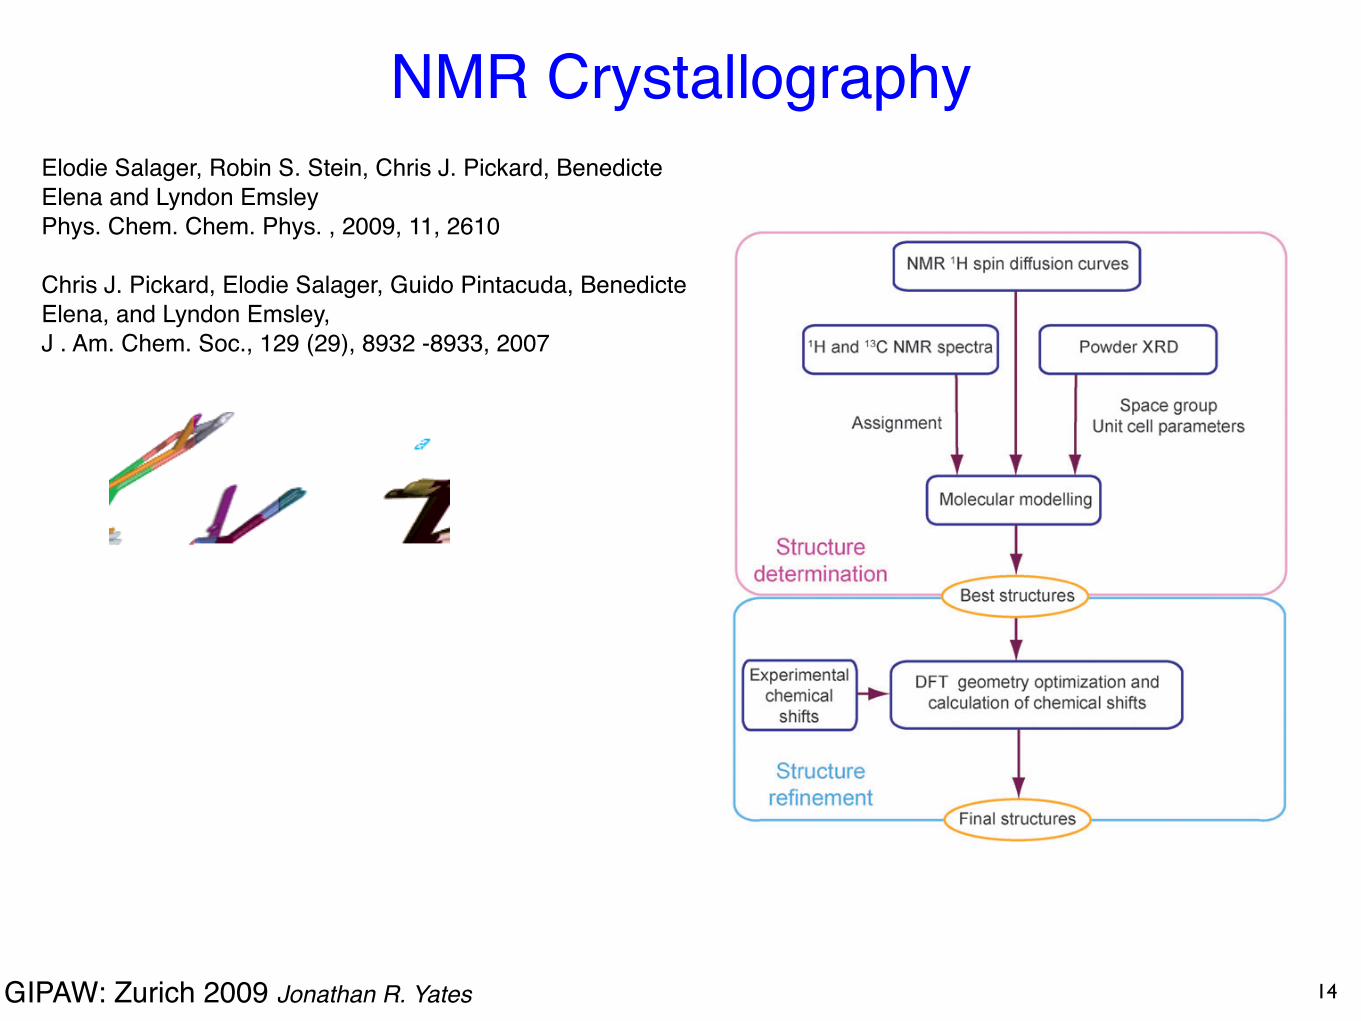
3. Protocol for powder NMR crystallography
Scheme 1 outlines the protocol for powder NMR crystallo-graphy used here. The first part of the protocol consists of the
combination of the spin-di!usion restraints with molecularmodelling to determine the crystalline structure.9,10
In the second part, the resulting structures are refined usinga DFT geometry optimization. Comparison between experi-mentally measured and calculated chemical shifts validates thefinal structures.11
In the following sections we give the details of how each stepis implemented, using thymol as an illustrative example.
4. NMR data analysis
The first step in the structure determination protocol is obtainingNMR data which will be used for restraining the molecularmodelling structure determination and for the DFT refinementsteps. The NMR data are used to assign spectra, provide PSDbuild-up curves and measure 1H and 13C chemical shifts.
4a Assignment of the spectra and measurement of 1H and 13Cchemical shifts
Four experiments are used to assign the 1H and 13C resonances,as illustrated for thymol in Fig. 1. Site labels are shown inFig. 1a. A 1D 13C CPMAS spectrum yields 13C chemical shifts.These are assigned with the help of a 2D 13C refocusedINADEQUATE32 experiment, which yields the 13C assignmentby giving connectivities between directly attached carbons. Inthe case of thymol this yields an unambiguous 13C assignment(if we assume that the C(1) carbon resonates at a lower fieldthan the C(5) carbon), except for the C(8) and C(9) methylgroups which can be permuted. The 2D 1H–13C refocusedINEPT22 experiment is then used to correlate the resonancesof the directly attached protons, thus providing the assignmentfor all the corresponding proton resonances except for thehydroxyl proton. The 2D 1H–1H double-quantum CRAMPS23
experiment confirms the assignment, and identifies the hydroxyl
Scheme 1 Flow chart for NMR crystallography.
2612 | Phys. Chem. Chem. Phys., 2009, 11, 2610–2621 This journal is $c the Owner Societies 2009
Elodie Salager, Robin S. Stein, Chris J. Pickard, Benedicte Elena and Lyndon EmsleyPhys. Chem. Chem. Phys. , 2009, 11, 2610
Chris J. Pickard, Elodie Salager, Guido Pintacuda, Benedicte Elena, and Lyndon Emsley, J . Am. Chem. Soc., 129 (29), 8932 -8933, 2007
NMR CrystallographyResolving Structures from Powders by NMR Crystallography Using CombinedProton Spin Diffusion and Plane Wave DFT Calculations
Chris J. Pickard,‡ Elodie Salager,† Guido Pintacuda,† Benedicte Elena,† and Lyndon Emsley*,†
Laboratoire de Chimie (UMR 5182 CNRS/ENS), Ecole Normale Superieure de Lyon, 69364 Lyon, France, andScottish UniVersities Physics Alliance, School of Physics & Astronomy, UniVersity of St. Andrews,
St. Andrews KY16 9SS, Scotland
Received March 15, 2007; E-mail: [email protected]
Structural characterization of crystalline powders represents akey challenge to modern chemistry since such samples are becomingboth increasingly important and widespread, notably in the areasof new materials and in the pharmaceutical industry. The develop-ment of experimental methods to study their three-dimensionalatomic structure is thus an area of great current interest. Significantrecent progress has been made in the application of diffractionmethods,1 and spectacular advances have been made in solid-stateNMR methods for powdered solids,2 isotopically enriched biologicalsystems,3 inorganic networks,4 and organic molecular compounds.5,6
Nevertheless de novo crystal structure determination from powdersat natural isotopic abundance remains a key unsolved objective forNMR spectroscopy. Toward this end, we recently reported7 thedetermination of the three-dimensional structure of a powderedorganic compound, obtained by an approach that combines mo-lecular modeling (MM) with experimental proton spin diffusion(PSD) data obtained from high-resolution solid-state1H NMR. Theapproach was demonstrated on powdered (microcrystalline) !-L-aspartyl-L-alanine (1), and we determined the crystal structure towithin an average root mean square atom-to-atom distance of 0.72Å of the known coordinates. However, although this was a big stepforward, the resulting structure shown in Figure 1a clearly containedfairly large systematic deviations from the reference structure. Forthis method to become widespread, its accuracy must be improved.Here, we report the combination of measured solid-state NMR
chemical shifts and first principles calculations to resolve the crystalstructure of 1 to within 0.13 Å of the known structure. The validityof this process is confirmed by comparing the DFT calculatedchemical shifts with the experimentally measured shifts, where weobserve a substantial improvement in the agreement between thecalculations and experiments before and after structure optimization.PSD data for 1 were obtained from 2D correlation experiments
obtained using advanced homonuclear dipolar decoupling schemes,8
as described in detail elsewhere.9 The PSD constrained structurewas then obtained from a combined MM/NMR-PSD approach7
using the Xplor-NIH MM package10 including experimentalconstraints obtained from comparison with back calculated PSDbuild up curves, as recently shown elsewhere.7 This procedureresulted in the group of 16 structures shown in Figure 1a havingthe best overall agreement with the experimental constraints. Thisgroup of structures has a standard deviation of 0.14 Å, and itdeviates from the reference X-ray structure11,12 (which we assumeto be correct here) by an average root mean square atom-to-atomdistance for all atoms of 0.72 Å.It can immediately be appreciated that this MM/PSD-NMR
structure contains significant systematic deviations, notably in thepositions of the polar carboxyl groups. These deviations are not
surprising since (i) these groups are not protonated and so are notstrongly constrained by the PSD-NMR data, and (ii) systematicdeviations are in any case expected since the phenomenologicaldescription of the PSD process is not perfect. To improve thestructures, we need at this point a more accurate relation betweenthe trial structures and the experimental observables. In thefollowing, we show that this can be provided by DFT calculationof chemical shifts.Here we use geometry optimization by the CASTEP program,13
a DFT-based code (but other programs providing the samefunctionality could be used). The crucial difference for theapplication here between this code and other quantum chemicaltechniques is that the charge density and wave functions aredescribed using a plane wave basis set and so the translationalsymmetry of the system is implicit. In contrast to cluster methods,this method allows for a fully solid-state treatment of the systemunder investigation. This approach has recently been applied withsome considerable success to the calculation of NMR parametersfrom known crystal structures in a variety of systems, where themethod is found to provide remarkably accurate predictions of solid-state NMR chemical shifts.6 On the other hand, so far, DFTapproaches have never been used to determine structures. Indeed,DFT methods are currently not capable of determining complexstructures de novo, from random starting points, since the parameterspace is very large, and calculation times are currently prohibitive.For example, we note that, in addition to the position and orientationin the unit cell, 1 has eight torsion angles that are freely rotatable,so the DFT optimization is not trivial. However, if the starting pointfor a suitable DFT optimization is taken as the end point of the
† Ecole Normale Superieure de Lyon.‡ University of St. Andrews.
Figure 1. Comparison between the structure of 1 determined by X-raydiffraction (orange) and (a) the 16 structures obtained from the MM/PSD-NMR refinement, and (b) the 16 structures refined using the plane waveDFT/NMR chemical shift approach described here. The figure shows oneof the four equivalent molecules in the unit cell.
Published on Web 06/28/2007
8932 9 J. AM. CHEM. SOC. 2007, 129, 8932-8933 10.1021/ja071829h CCC: $37.00 © 2007 American Chemical Society
Dow
nlo
aded
by O
XF
OR
D U
NIV
LIB
R S
VC
S o
n S
epte
mber
20, 2009 |
htt
p:/
/pubs.
acs.
org
P
ubli
cati
on D
ate
(Web
): J
une
28, 2007 |
doi:
10.1
021/j
a071829h

GIPAW: Zurich 2009 Jonathan R. Yates
DNA bases
FULL PAPER G. Gottarelli, P. Mariani et al.
! WILEY-VCH Verlag GmbH, 69451 Weinheim, Germany, 2002 0947-6539/02/0809-2144 $ 20.00+.50/0 Chem. Eur. J. 2002, 8, No. 92144
NMR spectrum that slowly transforms into a differentspectrum corresponding to the ribbon stable in CHCl3solution (ribbon II); the transition from ribbon I to ribbon IIis faster in the presence of moisture in the solvent.[12] These
ribbons seem particularly interesting as their ordered molec-ular layers, which are obtained on solid surfaces by evapo-ration of the LC phase in CHCl3, display rectifying[15] andphotoconductive properties.[16]
In a preliminary communication[17] we have described a newlyomesophase formed by derivative 1 in hexadecane; morerecently, Kato and co-workers have reported thermotropic[18]
and lyotropic[19] phases formed by folic acid derivatives due tosimilar hydrogen-bond patterns. In this paper, we report thestructure of ribbon I, obtained from single-crystal X-raydiffraction of deoxyguanosine derivative 3, and a study ofthe gel-like liquid crystals formed in different solvents byderivatives 1 and 2 and by the two other guanosines 4 and 5,which belong to the ribo series and contain the acetonidegroup. We believe that the variations of the gel-like structureswith the chemical constitution of the gelators and with thesolvent yield a good understanding of the self-assemblyprocess leading to the gel-like phases,[20] and that the presenceof the two different ribbons in the different lyomesophases isremarkable.
Results and Discussion
X-ray single-crystal study : Compound 3 crystallises in thechiral group P1, with two independent molecules in theasymmetric unit. The two molecules differ in the conforma-tion of the lateral chains attached to the guanosine skeleton,as can be seen in Figure 2.
The two types of molecules interact in the solid state bymeans of hydrogen bonding between the guanine residues(Figure 3). The NH group of the six-membered ring interactsexclusively with the N atom of the five-membered ring(N(H) ±N 2.827(2) and 2.909(2) ä). The two H atoms on theNH2 groups interact with the oxygen atom on the six-
Abstract in Italian: I derivati lipofili della guanosina allo statocristallino e in soluzione sono autoassociati in aggregati anastro. La struttura dei nastri e¡ stata caratterizzata mediantediffrazione dei raggi X da cristallo singolo e, in soluzione,mediante NMR e ESI-MS. Allo stato solido e in soluzionecloroformica sono presenti due diversi nastri con un diversoschema di legami a idrogeno. Le fasi di tipo gel ottenute inesadecano, toluene e cloroformio sono state studiate con lamicroscopia ottica e la diffrazione dei raggi X a basso angolo:il tipo di fase osservata e¡ in relazione con la strutturamolecolare dei composti e dipende fortemente dal solventepresente. Vengono discusse le strutture delle fasi tenendo inconsiderazione la presenza dei due diversi nastri.
Figure 1. Hydrogen-bond pattern of the two ribbonlike assemblies of guanosine derivatives.
self-assembles into ribbonsmolecular electronics (FET)
a
b
a
b2hJN7b,N1a
2hJN7a,N1b
2hJN7b,N1a = 6.2±0.4 Hz (expt)6.5 Hz (calc)
2hJN7a,N1b = 7.4±0.4 Hz (expt)7.7 Hz (calc) 2hJO6a,N2b = 5.7 Hz
1JO6a,C1a = 22.0 Hz
Predictions
Guanosine
J. Am. Chem. Soc. (2008) doi:10.1021/ja800419m
15
Steven Brown (Warwick)

Alpine-NMR 2009 Jonathan R. Yates
17O - 15N J-couplings
J. Am. Chem. Soc. 131 1820 (2009)
Observing 15N spin-echo
2hJNO Expt CalcN1-O4: 6.7± 0.4 Hz 6.1 HzN3-O4: 4.8± 0.5 Hz 4.6 Hz
2JNN
N1-N3: 2.7± 0.1 Hz 2.7 Hz
Observing 17O spin-echo
2JON
O4-N1/3: 5.1± 0.5 Hz 5.4 Hz
Steven Brown (Warwick)
!"#$%&'!()*+,-./0!123)00!%4555'!4673)/8.!9).70
4*./!8:!;,&!!$1(<!=>=&!=?"@&!"@@A
*3;2-,
17O !/2 !/2
1H SPINAL-64 SPINAL-64
"1
"2
"–x
15N
1
23
4
2.30 Å2.30 Å
2.28 Å
2.84 Å 2.83 Å4
4
N15 N15
H
H
H
17O
H
17O
"#!%&' B!C5=!D!@5E!4F
"#!%=&'G !B!E5=!4F
"#!%>&'G !B!G5E!4F
2;,2*,;:87
without 15N pulse
with 15N pulse
0.0
0.2
0.4
0.6
0.8
1.0
0 20 40 60 80 100 120
-0.4
0.0
0.4
0.8
S( )
SQ( ) =
SHET( ) / SHOM( )
/ms
8H+83-I8.:;, J!= !""!-.!K-:L"B
O4
O4
O2
N1N3O4
GIPAW: Zurich 2009 Jonathan R. Yates
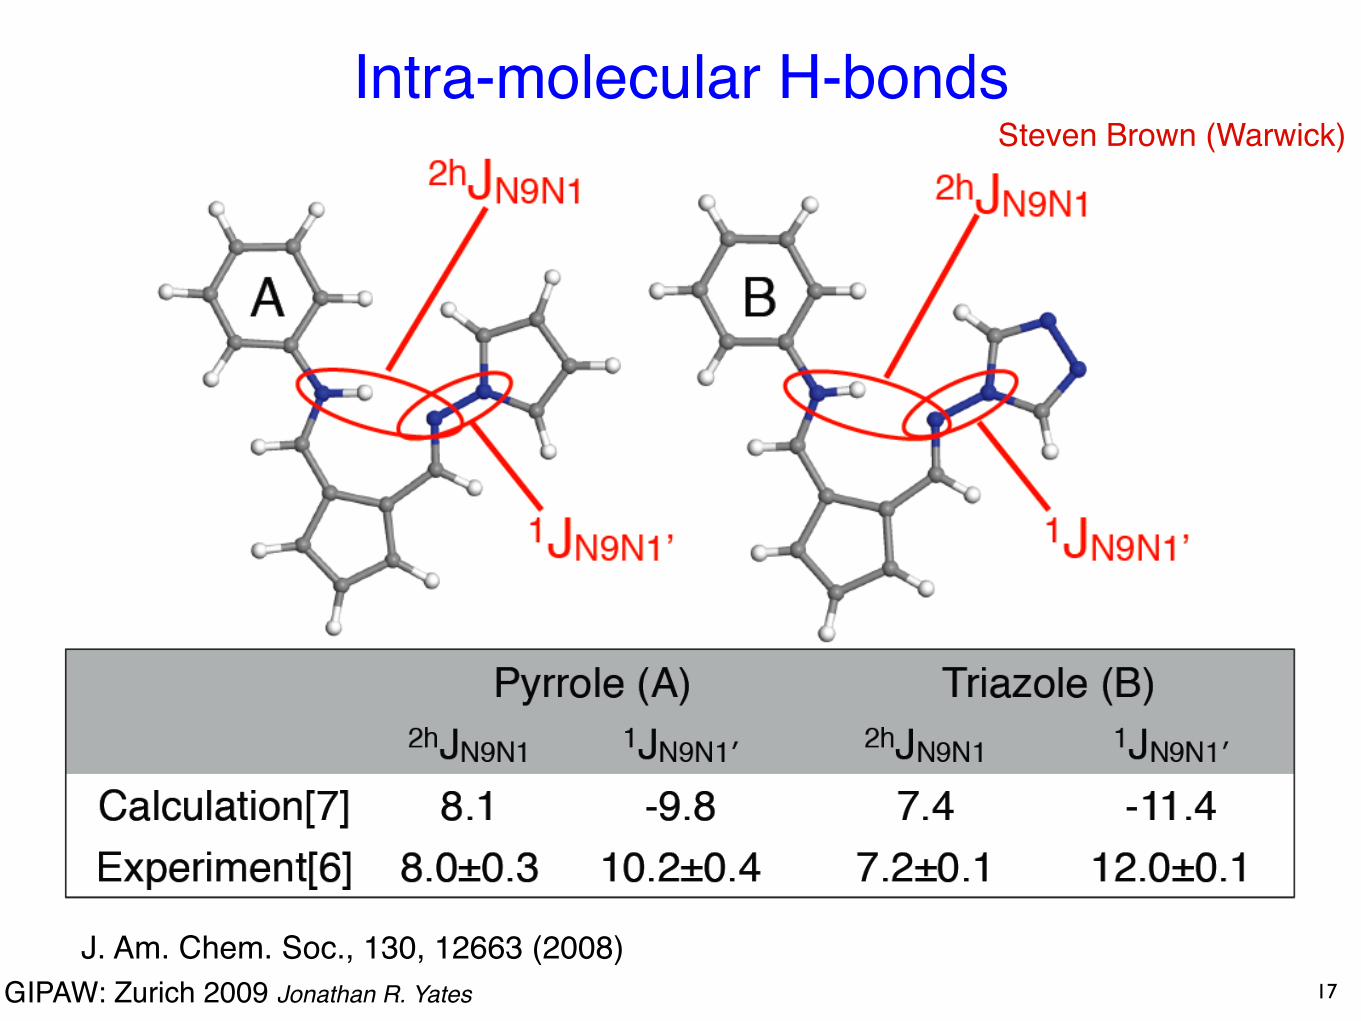
Intra-molecular H-bonds
17
Steven Brown (Warwick)
J. Am. Chem. Soc., 130, 12663 (2008)
GIPAW: Zurich 2009 Jonathan R. Yates
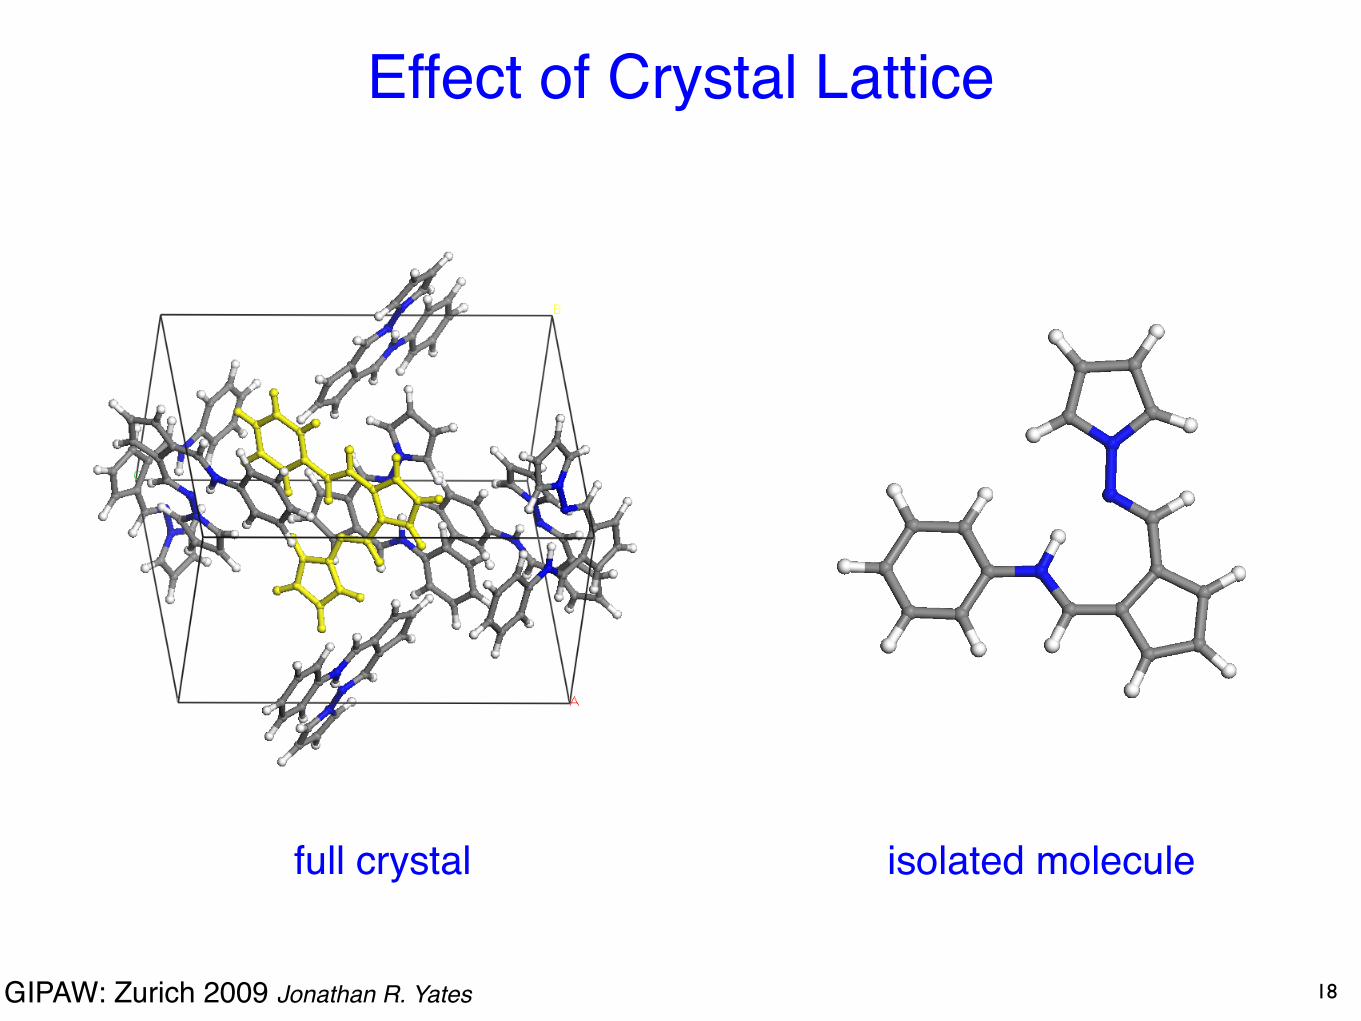
Effect of Crystal Lattice
full crystal isolated molecule
18

GIPAW: Zurich 2009 Jonathan R. Yates
Intra-molecular H-bonds
19
GIPAW: Zurich 2009 Jonathan R. Yates
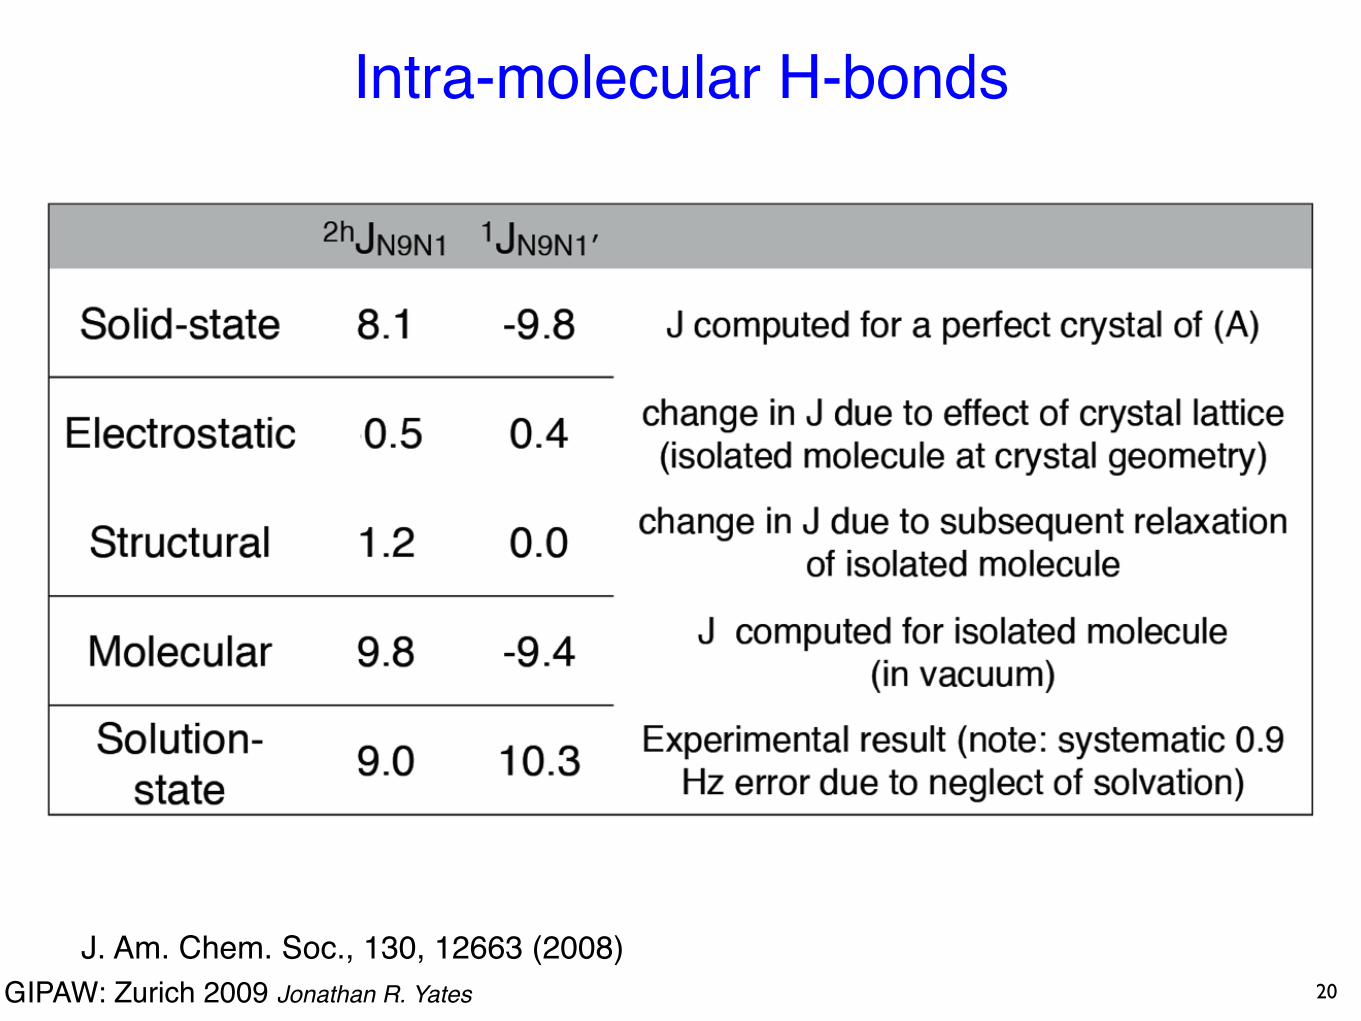
Intra-molecular H-bonds
20
J. Am. Chem. Soc., 130, 12663 (2008)