gilles grenier, university of ottawa serge nadeau
TRANSCRIPT

English as the Lingua Franca and the Economic Value of Other
Languages: the Case of the Language of Work in the Montreal Labour
Market
Gilles Grenier, University of Ottawa
Serge Nadeau, University of Ottawa
Revised, October 2013
Paper presented at CESifoVenice Summer Institute Workshop – “THE ECONOMICS OF LANGUAGE POLICY”, July 26-27, 2013. We thank our discussant Walter Krämer and participants at the Workshop. We also thank Irena Kemives for her competent research assistance. This paper was presented earlier at the Canadian Economics Association and at the Economics Department of the University of Ottawa.
Gilles Grenier, Department of Economics, University of Ottawa, Ottawa, Ontario, Canada, K1N 6N5; email: [email protected]
Serge Nadeau, Department of Economics, University of Ottawa, Ottawa, Ontario, Canada, K1N 6N5; email: [email protected]

English as the Lingua Franca and the Economic Value of Other Languages: the Case of the Language of Work in the Montreal Labour Market
Abstract
An important feature of Canada is that it has two official languages, English and French, and that one of them, English, is also the international lingua franca. This situation may have particular policy implications. Within Canada, the Montreal metropolitan area presents an interesting case in point: it has a majority of native French speakers, an important minority of native English speakers, and many immigrants from various linguistic backgrounds who try to make their way into the labour market. Using confidential micro-data from the 2006 Canadian Census, this paper investigates the determinants and the economic values of the use of different languages at work in Montreal. Workers are divided into three groups: French, English and Other mother tongues, and indices are defined for the use of French, English, and Other languages at work. It is found that the use of English at work by non-English native speakers is positively related to the education level of the workers, while there is no such relationship for the use of French by native English speakers. The returns to using at work a language that is different from one’s mother tongue are analyzed with OLS and IV regressions. For the English mother tongue group, using French at work has little or no reward, while using English at work pays a lot for the French mother tongue group. For the Other mother tongues group, there is a high payoff to using an official language at work, especially English. This situation is not due to the inferior economic status of the native French speakers; it is due to the fact that English is the international lingua franca. The policy implications of the above results are discussed.
Key words: language of work, mother tongue, immigrants, Montreal, Canada, earnings.

English as the Lingua Franca and the Economic Value of Other
Languages: the Case of the Language of Work in the Montreal Labour
Market
Because of economic globalization, English has increasingly become predominant
around the world as the international language of communication, or the lingua franca.
While this has some advantages for a better understanding among the people of the
world, it can also be perceived as a threat to other languages, and some are resisting that
trend. The Montreal metropolitan area within the Canadian province of Quebec presents
an interesting case in point. It has a majority of French speakers, an important minority of
English speakers, and many immigrants from various backgrounds whose integration into
the labour market involve making language choices. Despite the fact that the economic
status of the French speaking majority has improved, and while efforts have been made to
integrate immigrants into the French speaking majority, English is still extensively used
in public activities and concerns are regularly expressed about the future viability of the
French language.
The relative economic positions of the various ethnic and language communities in
Quebec have been studied for a long time. In the 1960’s, the Royal Commission on
Bilingualism and Biculturalism found that the average incomes of the French Canadians
in Quebec were among the lowest of all the ethnic groups, only the Italians and the
Aboriginals having lower incomes (Boulet and Raynauld, 1977). That provoked a lot of

2
concern and resentment within the Quebec population and it was one of the factors that
led to the founding of the Parti Québécois by René Lévesque in 1968. Further studies
(Boulet, 1980; Vaillancourt, 1980) confirmed the low economic status of Quebec
Francophones in the early 1970’s. However, studies that looked at the decades between
the 1980’s and the 2000’s usually found a significant improvement in the economic
condition of Quebec Francophones during that time period (see, for example, Boulet and
Lavallée, 1983; Bloom and Grenier 1992; Shapiro and Stelcner, 1997; Albouy 2008;
Nadeau, 2010; and more recently, Vaillancourt et al., 2013).
While the research on the economic position of Quebec Francophones generally
presents an optimistic picture, some demographers reach gloomier conclusions by
observing that the proportion of people speaking French has been decreasing in Montreal,
mainly because too few immigrants assimilate to the French speaking community
(Castonguay, 1997, 1998; Termote, 2001). It would appear, thus, that on the price side of
the market, the value of the Francophone labour force has been increasing, but that on the
quantity side, the number of French speakers has remained stagnant as the power of
attraction of the English language is still very strong.
In the past, the different economic standings of Canada’s two major languages were
mainly explained in the context of the unequal relative powers that resulted from the
Conquest and the fact that Canada was a British colony. Nowadays, they are more
associated with the status of English as the lingua franca. Francophones are doing well
economically, but they need to use English at work to do so. The government of Quebec
has had some success at having immigrants learn French by integrating their children to
the French school system, but the temptation is still strong for them to switch to English.

3
This paper uses Canadian census data to look at the determinants and at the returns to
using different languages at work in the Montreal metropolitan area. More precisely, we
look at the factors that explain the use of a second language at work for individuals
whose mother tongue is French, English or a non-official language. We further
investigate the impact on earnings of using a second language at work.
This research is made possible by the inclusion of new questions on the languages
used at work in the Canadian census since 2001. Those questions have not been used very
much in the literature, but it is worth mentioning two previous studies. Christofides and
Swidinsky (2010) consider the effect on earnings of the use of English at work by
Canadian born Francophones in Quebec, and of the use of French at work by Canadian
born Anglophones in the rest of Canada. They find that the former effect is significant but
that the latter is not. Our study expands on that work, but it has important differences.
First, instead of comparing two distinct labour markets, we focus on one multilingual
market, the Montreal metropolitan area. Second, native born and immigrant workers with
a mother tongue other than French or English are included. Third, the determinants and
the effects on earnings of language of work are analyzed together. The other study that
uses the language of work questions is Li and Dong (2007), who consider the use of a
non-official language at work by Chinese immigrants in Canada as an indicator of
participation in an enclave economy. The authors find that working in the enclave
economy has strong negative impact on earnings. Our study also expands on that by
considering other non-official languages (in addition to Chinese).
The paper proceeds as follows. In the next section, a basic conceptual framework is
proposed on how language of work is determined in a labour market where workers have

4
different mother tongues. The following section introduces the data and the empirical
models. Results for the determinants of the language of work are then presented. The two
sections that follow report the results of earnings regressions that have the language of
work among the explanatory variables; those include ordinary least squares and
instrumental variables regressions, the latter in order to take into account of the fact that
the use of a second language at work may be endogenous. The last section concludes the
paper.
Conceptual framework: the determinants of the language of work in a
multilingual society
As a starting point, it is worth introducing some basic ideas on the role of language in
economic activity. There is a small body of literature that was pioneered by works by
Breton (1978) and Vaillancourt (1980) among others. Surveys of the various issues are
provided in Grin (2003), Grin, Sfreddo and Vaillancourt (2010) and Zhang and Grenier
(2013).
The choice of which language to use in a particular economic activity can be analyzed
as the outcome of rational decisions made by economic agents. Two major characteristics
of a language that affect choices must be considered. First, the use of a common language
makes communication possible among people. The larger the number of individuals who
use a language, the more useful that language is as a tool of communication. This can be
referred to as the network externality of a language. In a given working environment,
individuals will be more efficient at their task if they can communicate in a language that

5
is known to everybody. But if language was only a communication instrument, there
would be no advantage in the long run to keep more than one. All the less important
languages in the world would disappear to the benefit of the strongest one. Therefore, a
second characteristic of a language is that it is part of cultural identity. Individuals are
attached to a language, most of the time their mother tongue, and prefer using it if they
can, even if it may be less efficient from a pure communication point of view. Many of
the goods produced by an economy have a cultural content. Because of that, among other
things, the goal of language policies is often to preserve language diversity.
In a society where several languages are used, such as in the Montreal labour market,
the languages that individuals use at work depend on the interaction between supply and
demand.
On the supply side, we consider the behaviour of workers. Most individuals have one
language that they learn in childhood and in which they are usually the most fluent, their
mother tongue. If that language is also the one used in the labour market, no choice needs
to be made. But if the labour market uses a language that is different from the person’s
mother tongue, then there may be an economic incentive to learn that other language.
This can be seen as an investment in human capital (Breton, 1978), similar to an
investment in general education or in a particular trade. Economic resources must be used
in order to learn a second language that will allow a person to earn a higher wage.
Whether or not the investment is worthwhile depends on the present values of the net
benefits. The amount of resources needed to learn another language depends on the
context. Exposure to a language will make it easier to learn, with or without the need of

6
formal lessons. It will also be easier to learn a new language if someone is young or more
educated (Chiswick and Miller, 1994).
On the demand side, we consider the behaviour of employers (Vaillancourt, 1980).
Individuals usually have to work in teams, which means that they have to communicate
among each other. For the employer, the mother tongue composition of the workforce is
an important factor to determine the most efficient internal language of communication
within a given group of workers. Technology may also affect the choice of the internal
language of communication, especially for skilled workers who need to use sophisticated
equipment. Furthermore, the owners’ and management’s mother tongue may determine
the language used at work. The managers may prefer hiring workers of their own mother
tongue, even if other workers are available. There is also communication with the
external world. For those who work with the public, the language of the customers who
buy the product is an important determinant. In addition, for goods and services that are
traded internationally, it is crucial to use a language that is known to both suppliers and
buyers. A lingua franca, such as English, is often used for those international
transactions.
The interaction of those supply and demand factors determines the composition of the
languages used at work and their relative values. In the empirical analysis that follows,
which is a reduced form of the above interaction, explanatory variables can be related to
those factors. Mother tongue plays a crucial role and is used to separate the data. Given
the relationship between language and earnings, the characteristics of workers that
typically affect earnings (age, education, etc.) also affect language choices. As well,

7
characteristics of jobs, such as industry, occupation, and geographical location, are
expected to be important determinants of the language of work.
Data and empirical strategy
The data source for this research is the 2006 Canadian Census micro-data master file
which contains a random sample of 20 percent of the population. For people living in the
Montreal metropolitan area, we take men and women1 who worked full time and full year
(48 weeks or more) in 2005 in the age interval 18 to 64. The dependent variable is weekly
earnings.2 Both native born Canadians and immigrants are included. The analysis is done
separately for three mother tongue groups: English, French, and Other.3
A main question and a sub-question are asked in the census concerning the languages
used at work, with the following wordings:
1) “In this job, what language did this person use most often?”4, with the choice of
answers: • English, • French, • other (specify);
1 Men and women are combined in the analysis that follows, with an indicator variable for gender. All regressions were done separately for men and women. Since they tell the same story for both genders, we decided to report only the results that combine the genders. 2 Some restrictions were applied to eliminate very small and very large values of earnings. Observations with annual wages less than $1000 and more than $1,000,000 were removed. 3 The census allows multiple responses for the mother tongue question, such as English and French, English and a non-official language, or French and a non-official language. Those account for less than 2 percent of the answers and are reported as separate categories in the data file. To keep the number of groups to three, the multiple answers are assigned to the mother tongue groups based on the lowest status language reported in the multiple answer, with the order from highest to lowest being English (the lingua franca), French, and non-official language. For example, a person who reports the mother tongue as being English and French is included in the French group. A person who reported French and another mother tongue is included in the Other mother tongues group. This is done the same way as in Grenier and Nadeau (2011). 4 The question does not distinguish between spoken and written language, but the guide to the questionnaire further specifies: “For persons whose job requires mostly dealing with customers, clients or peers, report

8
2) “Did this person use any other languages on a regular basis in this job?”5, with
the choice of answers: • No, • Yes, English, • Yes, French, • Yes, other
(specify).
In those questions, ties are allowed, meaning that a person can answer that two languages
are used equally.
Using all the information from those two questions including the ties, the
following indices are defined for the use of a second language at work by the three
mother tongue groups:
− Fwork: intensity of use of French at work (defined for workers in the English
mother tongue group);
− Engwork: intensity of use of English at work (the inverse of the previous index
and defined for workers in the French mother tongue group and for workers in the
Other mother tongues group6);
− Offwork: intensity of use of an official language at work (English or French), as
opposed to a non-official language (defined for workers in the Other mother
tongues group).
the language used most often. For persons whose job requires mostly writing, report the language written most often. [. . .] Do not report a language used only during coffee, lunch or other rest breaks.” 5 The guide to the questionnaire specifies: “Report any other languages that this person may use on a regular basis in performing a job or a major task, though not as often as the main language reported in part (a).” 6 Since Engwork and Fwork are defined such that Engwork = 1 – Fwork, only one of them is used for the Other mother tongues group.

9
These indices are set to take values between zero and one, so that they can be
interpreted approximately as indicators of the relative amount of time a second language
is used at work. More precisely, the variable Fwork, defined for English mother tongue
workers, takes the value zero if English is used most often and no other language is used
on a regular basis; it takes the value 0.25 if English is used most often and French is used
on a regular basis; it takes the value 0.5 if both English and French are used most often
(when there is a tie between the two); it takes the value 0.75 if French is used most often
and English is used on a regular basis; and it takes the value one if French is used most
often and no other language is used on a regular basis. The variable Engwork, defined
for French and Other mother tongue workers, is specified in exactly the same way, but in
reverse. Note that for people of in the Other mother tongues group, two dimensions of
the use of a second language at work are considered: one for the use of an official
language (English or French) as opposed to a non-official language (Offwork); and, if an
official language is used at work (that is, if Offwork is not equal to zero, in the majority
of the cases) whether that official language is English instead of French (Engwork).
Although those variables are discrete in nature, they are initially treated as continuous.7 In
alternative specifications to be discussed later, polytomous or dichotomous versions will
also be considered.
Using those indices, a two equation system is specified and estimated separately
for the three mother tongue groups: one equation that determines the use of a second
7 Our indices for languages used at work are similar to the ordinal measure used by Bleakley and Chin (2004) for English proficiency with U.S. census data (their measure takes the values of 0, 1, 2 or 3 based respectively on whether a person speaks English not at all, not well, well, or very well). .
10
language at work, and the other one that estimates the effect of using a second language
at work on earnings:
WSL = X1 β1 + X2 β2 + ε1 (1)
ln y = X1 γ1 + γ2 WSL + ε2 (2)
where WSL (Working in a second language) is one of the indices defined above, ln y is
the log of weekly earnings during the previous year8, X1 is a vector of exogenous
variables that affect both working in a second language and earnings, X2 is a vector of
exogenous variables that affect working in a second language but not earnings (to be used
as identifying instruments)9, the β’s and γ’s are regression coefficients, and ε1 and ε2 are
possibly correlated error terms.
The variables in X1 are the usual ones in an earnings equation. The basic specification
includes Age, Age squared, Gender, Marital status, Schooling, Immigrant status, Years
since migration, Years since migration squared, and Visible minority.10 An augmented
specification adds industry and occupation indicators to this list of variables. Since the
selection into working in a second language operates partly through the industry and the
8 Note that the reference period for the earnings is the year prior to the census (the year 2005), while the reference period for the language of work is the job held during the the week prior to the Census day (May 16, 2006). The two may not coincide exactly, but the problem is minimized by taking only the full time and fullyear workers. 9 As discussed below in the section on instrumental variables results, the error term of the earnings equation may include unobserved ability which could be related to the choice of the language of work. 10 Unlike most previous Canadian studies on the relationship between language and earnings, variables for the knowledge of the official languages, i.e., whether someone is bilingual or not in the other official language, are not included in the model. The rationale is that it is “using” a language at work that matters on the job, not just knowing it. It is assumed that those who use a language at work know that language. A few people may know a second language while never using it, but this should not have any impact on their earnings.
11
occupation in which one works, the effects of using a second language at work are
expected to be lower when the latter are included in the regression. In X2 we have
variables that affect working in a second language, but not earnings. For the estimation of
equation (2), these are instruments that are correlated with the endogenous regressor
WSL, but that are assumed to be unrelated to the error term of that equation. Those
variables (to be further discussed later) are: Place of birth in Canada outside Quebec (an
indicator variable), Previous residence outside Quebec one or five years earlier (an
indicator variable), Home language (whether the language most often spoken at home is
English, French or a non-official language), Location of work within the Montreal
metropolitan area (whether a person works in the centre, the South, the West, the North
or other parts of the Montreal metropolitan area), and Detailed mother tongues (a set of
31 indicator variables, defined for the Other mother tongues group only). We will start by
estimating the two equations independently with OLS, ignoring endogeneity. A
discussion of the instruments will then be provided.
Determinants of the language of work
We first provide some background on the language at work situation in Montreal.
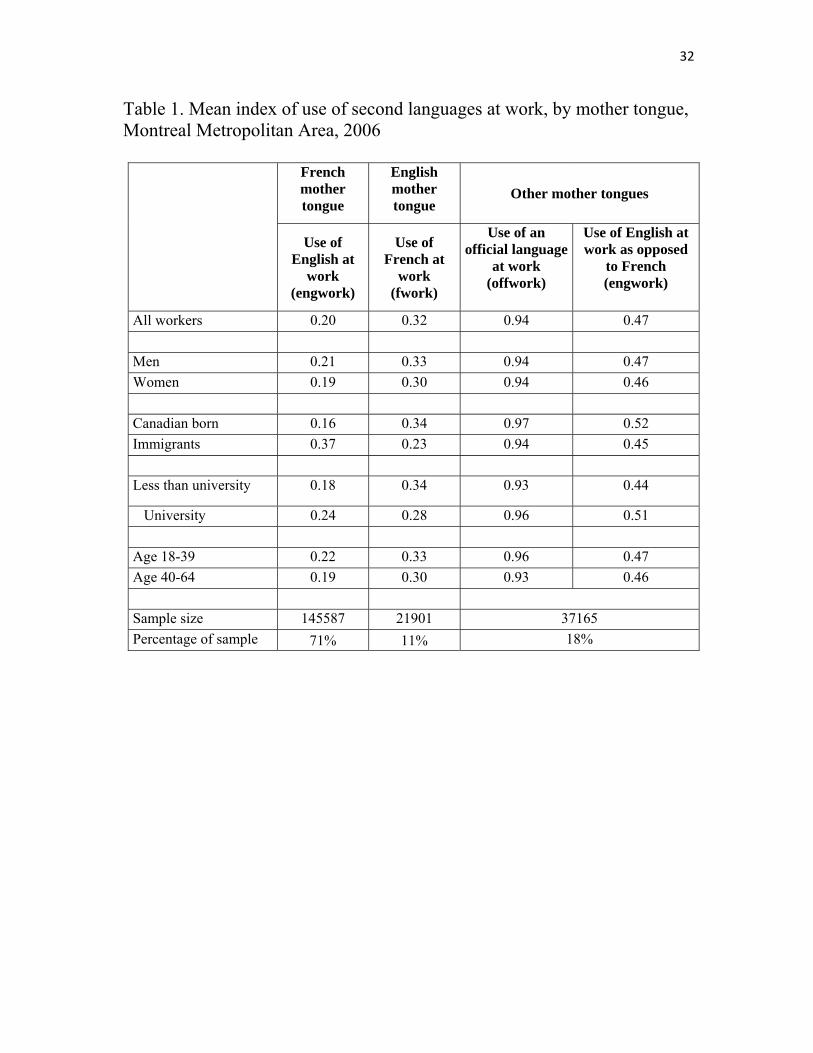
Table 1 presents the mean values of the indices of the use of a second language at work
for the French, English and Other mother tongues groups respectively, in relation to
various characteristics. For the French mother tongue group, the average value for all
workers of the index of use of English as a second language at work is 0.20, suggesting
that they work in English on average about 20% of the time. This is compared to a mean
value of the index of 0.32 for the use of French at work by workers in the English mother

12
tongue group, and to 0.47 for the use of English at work by the Other mother tongues
group. Comparing the official and the non-official languages, we also note that the
intensity of use of an official language at work by the Other mother tongues group is very
high, taking the average index value of 0.94 for all workers.
While individuals in the English mother tongue group use on average more French at
work than individuals in the French mother tongue group use English, it should be kept
in mind that the English mother tongue group accounts for only 11 percent of the
population, compared to 71 percent for the French mother tongue group and 18 percent
for the Other mother tongues group (see the last row of Table 1). Weighing the mean
indices by the proportion of the population, we obtain that English is used at work about
30 percent of the time in Montreal, French is used 69 percent of the time, and other
languages are used one percent of the time.11 Because of its role as a lingua franca, the
relative attractiveness of English as a language of work is much stronger than its share as
a mother tongue would predict.
(Table 1 about here)
Looking at the characteristics shown in Table 1, we observe that among the French
mother tongue group, men use English at work slightly more than women, immigrants
more than the Canadian-born, the more educated more than the less educated, and the
young more than the old. For the use of French at work by members of the English
mother tongue group, we note that men and the older age group use more French than
11 From the numbers in Table 1, the relative importance of English can be calculated as: 0.71× 0.20 + 0.11× (1- 0.32) + 0.18 × 0.94 × 0.47 = 0.296; the relative importance of French as: 0.71× (1 – 0.20) + 0.11 × 0.32 + 0.18 × 0.94 × ( 1 – 0.47) = 0.693; and the relative importance of other languages as : 0.18 × (1 - 0.94) = 0.011.

13
women and the younger age group, which is similar to the intensity of use of English at
work by the French mother tongue group. However, we get opposite results with respect
to immigration status and schooling: the Canadian-born use more French at work than the
immigrants, and the less educated more than the more educated. For the Other mother
tongues group regarding the use of English, we find the same relationships as for the
French mother tongue group, with the interesting exception that immigrants use less
English at work than the Canadian born. That may be a result of Quebec’s immigration
policy that favors immigrants who can speak French. Looking at the column for the use
of an official language, we note that the Canadian born, the more educated and the
younger ones tend to use more an official language at work.
The specific mother tongues matter a lot in determining which of the two official
languages is used by members of the Other mother tongues group. Table 2 presents, in
descending order, the mean index of use of English at work (as opposed to French) for
detailed mother tongue groups. For historical and cultural reasons, there are clearly some
groups that are leaning towards English, such as Filipino, South Asian languages,
Hebrew, Mandarin, Cantonese, Japanese and Korean. At the other extreme, the languages
leaning towards French include Creoles, Khmer, Spanish, Portuguese, Vietnamese and
Arabic. The role of English as the lingua franca is important. The mother tongues that are
related to a higher use of French at work are typically associated with countries that have
some historical and cultural ties with the French language. This is also the case for some
mother tongues that are related to the use of English, such as South Indian languages and
Filipino, but for others, such as Mandarin and Northern European languages, it is mainly

14
because of the role of English as the lingua franca. Typically, those immigrants know
more English than French when they arrive and presumably prefer working in English.
(Table 2 about here)
Results for selected variables in regressions where the dependent variables are the
indices of the use of a second language at work are presented in Table 3, the complete
regressions being in Appendix tables A.1 and A.2. This corresponds to equation (1)
defined earlier.12 Those regressions are in fact the first stage of the instrumental variable
earnings regressions to be presented below. Some of the results corroborate those of the
descriptive statistics. For the French and Other mother tongues groups, women tend to
use less English at work than men, but for the English mother tongue group, there is no
statistically significant difference between genders when it comes to the use of French at
work.
(Table 3 about here)
French speaking immigrants increase their use of English at work as they spend time
in Canada. However, it is the opposite for immigrants in the Other mother tongues group.
In their use of an official language at work, they seem to use first English and then, over
time, gradually move to French. Many immigrants do not know French when they arrive
and must often rely on English to land a first job. But as time goes by, perhaps with the
help of some publicly available French lessons, they progressively use more French at
work. The situation regarding immigrants is completely different for the English mother
tongue group. They significantly use less French than the Canadian born, and time spent
12 Tables A.1 and A.2 include the two specifications without and with industry and occupation. Table 3 presents only the results of the specification with industry and occupation.
15
in Canada does not change anything. This is perhaps an indication that many English
speaking immigrants do not become integrated into the Quebec Francophone culture to
the extent that their native born counterparts do. Concerning the use of official languages
by immigrants in the Other mother tongues group, the results show that immigrants use
less at arrival and continue to do so for a while, but start increasing their use of official
languages afterward (after about 10 years). This reflects the presence of linguistic
enclaves where immigrants tend to be predominant.
The effect of education is very strong for individuals in the French mother tongue
group: the higher the education, the more likely they are to use English at work. This
confirms the results of the descriptive statistics shown above. However, for individuals in
the English mother tongue group, with the exception of the No certificate category,
schooling has no significant effect on the use of French at of work. This differs a bit from
the descriptive statistics of Table 1, where a negative relationship was found.13 Those
results suggest that Anglophones do not learn French for the same reasons that
Francophones learn English. For Francophones, because of its role as a lingua franca,
English becomes increasingly necessary as one does a job that requires more education.
For the Anglophones, while French may be an asset, it does not appear to be essential in
many jobs that require a lot of schooling.
For the Other mother tongues group, the effect of education is similar to the one for
the French mother tongue group, at least for the highest levels of schooling. Once they
decide to use an official language, they are more likely to use English than French if they
13 However, in the regression that does not control for industry and education (see Table A1), the negative relationship still appears.

16
are more educated. As expected, education also strongly affects the use of an official
language at work as opposed to a non-official language.
Finally, Table 3 shows that people with fewer ties to the Quebec Francophone culture,
as indicated by birth or previous residence outside Quebec, are more likely to work in
English. This is true for all mother tongue groups.
Those results show that the different mother tongue groups do not respond to the
same incentives in their choices of languages of work. In the next section, we will see if
the effects of language of work on earnings also diverge.
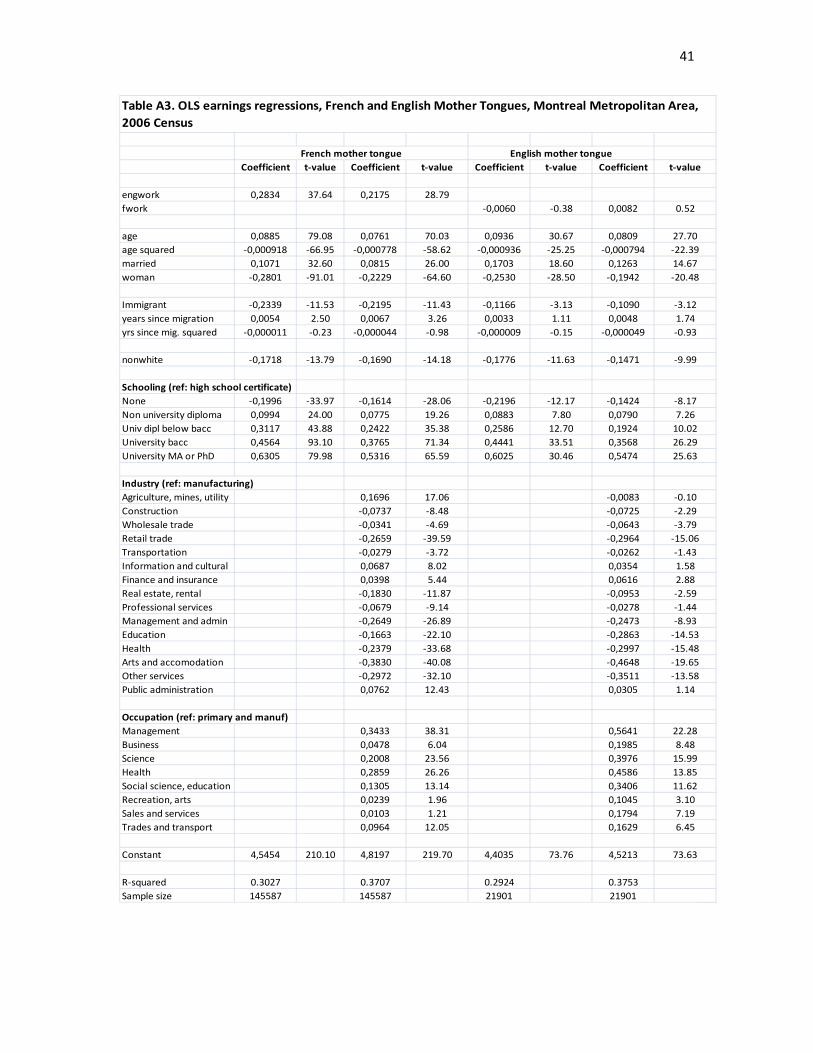
Effect of language of work on earnings: ordinary least squares (OLS) results
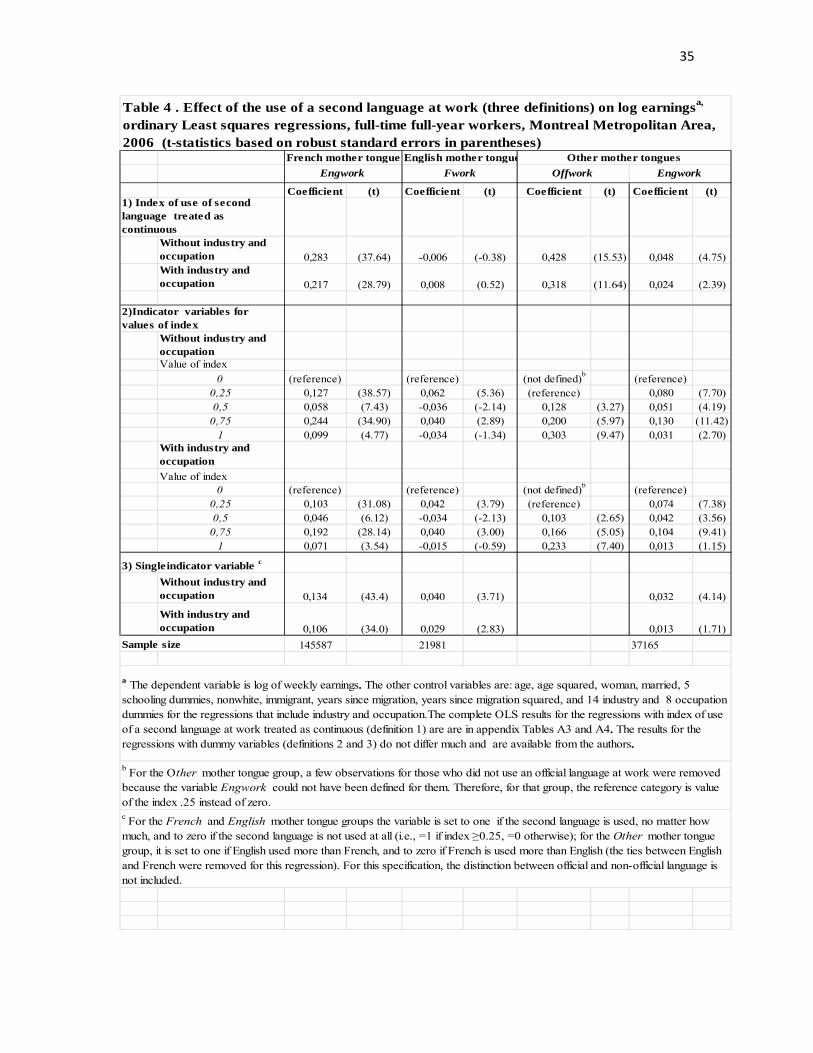
Table 4 provides OLS estimates of the net impacts of working in a second language
on earnings for the three mother tongue groups, as per the regression defined in equation
(2) above. The first part of the table presents the results with the continuous indices
defined earlier. Since it could be argued that the values of those indices were assigned
somewhat arbitrarily, two alternative specifications for the use of a second language of
work are included. In the second part of the table, the various categories of the indices (0,
0.25, 0.50, 0.75, and 1) are defined as a group of indicator variables, allowing for a non-
linear impact. In the third part, the use of a second language at work is condensed into a
single indicator variable, taking the value one if a second language is used, no matter how

17
much, and the value zero if none is used. In each case, two specifications of the earnings
equation are provided, one without and one with industry and occupation indicators.14
(Table 4 about here)
Let us consider first the regressions with the index treated as continuous. They show
three interesting results. First, for the English mother tongue group, the coefficient of
Fwork is small and not significant, which means that it does not pay to use French at
work. Second, for the French mother tongue group, there is a large payoff to using
English at work. The earnings advantage for a change in Engwork from 0 to 1 is
estimated at 32 percent or 24 percent, depending on the regression specification.15 This is
quite large and reflects the importance of knowing English as the lingua franca to be
successful in the labour market. Third, for the Other mother tongues group, there is a
huge earnings advantage to using an official language at work: 52 percent or 37 percent
depending on the regression specification. In addition, when an official language is used
at work by members of this group, there is a modest payoff, between 2 percent and 5
percent, to using English instead of French.
The second part of Table 4 uses indicator variables for each level of the index. The
results are both interesting and puzzling. For all the groups, using a little bit of the second
language at work (i.e., moving from 0 to 0.25) improves earnings significantly. This is
true even for the English mother tongue group for which the effect of the index treated as
continuous was not significant. However, increasing further the use of the second
14 The complete regression results for the first part of the table are in Tables A3 and A4. The results for the control variables for other two parts do not differ much from those of the first part. They are available from the authors. 15 Since the regression coefficients are large, we use the transformation (r = e β – 1) to calculate the rates of change.

18
language (i.e., moving from 0.25 to 0.5) has the inverse effect. For the English mother
tongue group, the coefficient even becomes significantly negative. If the level increases
further (from 0.5 to 0.75), the direction of the effect changes again. For the French
mother tongue group, the results suggest that the highest gains are reached when English
is used 75% of the time. For the English mother tongue group, the effect is lower, so that
the highest gains are attained when French is used 25% of the time. Finally, if workers
use only the second language (the value of the index is equal to one), the effect on
earnings becomes lower and is again negative for the English mother tongue group.
Those results are interesting in that they show that it pays to use a second language at
work, but that one’s mother tongue is also useful. But they are also puzzling in the sense
that they may indicate a particular pattern in the way people responded to the
questionnaire. Keeping in mind that the index was derived from combining the answers
to a main question and a sub-question in the census, the values 0, 0.5 or 1 are obtained for
those who did not answer the sub-question (no other language is used on a regular basis),
and the values 0.25 or 0.75 are obtained for those who answered the sub-question. It may
be that those who took the time to answer the sub-question value more their language
skills than those who did not. We did some analysis (available from the authors) of the
propensity to answer the sub-question and we found that it is not random. For example,
the more educated people were more likely to answer the sub-question than the less
educated. This suggests the possibility of some measurement error in the index.
To account for the latter problem, the third part of Table 4 defines a cruder index,
which is a single indicator variable. For the French and English mother tongue groups,
the index takes the value zero if only the mother tongue is used at work, and the value

19
one if the second language is used, no matter how much. For the Other mother tongues
group, it is defined in a different way: it is equal to one if English is used more than
French, and equal to zero otherwise.16 For the French mother tongue group, the results
again show important positive rewards for using English at work. For the English mother
tongue groups, there is a now a significant effect on earnings to using some French at
work, but it is small compared to the effect of the use of English by the French mother
tongue group. For the Other mother tongues group, there is still a small positive gain to
using English instead of French.
In spite of the difficulties in the measurement of the use of a second language at work,
the results tell a consistent story. There is a high payoff to using English at work for
members of the French mother tongue group. There is a little payoff to using French at
work for members of the English mother tongue group. For the Other mother tongues
group, there is a very high payoff to using an official language at work, and it is better if
that official language is English instead of French.
Effect of language of work on earnings: Instrumental variables (IV) results
We now consider explicitly the causal effect on earnings of using a second
language at work. The kind of bias that we can expect from ignoring the endogeneity of
WSL in equation (2) is similar to the well-studied ability bias in the education literature
16 In order to define the index in that way, some observations (about 15% of the sample) had to be removed when the answer was that French and English were used equally. Also, since individuals who use only a non-official language at work had to be removed (because Engwork could not be defined for them), and since the large majority in that group (about 87%) use only an official language, we could not define a dummy variable for Offwork in a way that was similar to Fwork and Engwork. Therefore, such a variable is not included in that regression.

20
(see, for example, Angrist and Krueger, 1991; Card, 1995; Lemieux and Card, 2001).
There is also a parallel literature on the effect of language proficiency on earnings (see
Chiswick and Miller, 1995; Dustmann and van Soest. 2002; Bleakley and Chin, 2004;
Gao and Smyth, 2011). If ability and WSL are positively related, i.e., if the more able
individuals are more likely to learn and to work in a second language, then we would
expect the coefficient γ2 in an OLS regression to overestimate the true effect of working
in a second language.
Finding good instruments is crucial for the validity of the analysis.17 We adopt a
strategy in which we first identify a number of observed variables which we think could
be good instruments. Regressions are run with those variables that we call the full set of
instruments. After evaluating the results, regressions are then run again on a limited set of
instruments that we discuss later. Therefore, two groups of results are presented. There is
a trade-off between those two extremes. More instruments guarantee a higher correlation
with language used at work, increasing the precision of the estimator, but the danger is
that they may not all be exogenous with respect to earnings. Using fewer instruments will
produce a consistent estimator if we are sure that they are exogenous, but the estimate
will be less precise if the instruments are weak.
The full set of candidates as instruments includes the variables that were used in the
previous regressions on the determinants of the language of work. The first two
instruments, Place of birth in Canada outside Quebec and Place of residence outside
17 In the literature on the effect of language proficiency on wages, various instruments have been used, such as number of children at home (Chiswick and Miller, 1995; Gao and Smyth, 2011), regional language concentration (Chiswick and Miller, 1995) and having migrated young from a non-English-speaking country (Bleakley and Chin, 2004). Our study looks at the language actually used at work, not proficiency, so the variables that are candidates as instruments must be chosen accordingly.
21
Quebec one or five years prior to the census, are indicators of relatively low previous
exposure to the French language, making someone less likely to work in French, but
presumably not affecting earnings directly. The language used at work is also likely to be
related to the one used at home, with the latter not influencing earnings directly. Given
that the various neighborhoods of the Montreal metropolitan areas have different
linguistic compositions (The Centre and the West tend to be more English, and the other
parts more French), the language of work is affected by the location of the job. Finally,
among the non-official languages, some are culturally closer to English and some are
closer to French, which will affect the language of work.
Table 5 presents IV regression results for two of the three definitions of the use of a
second language at work: the continuous index and the single indicator variable. The
definition with multiple indicator variables does not lend itself well to instrumental
variable estimation and it is not used for this part of the analysis. The top part presents
the regression coefficients for the net impact on earnings of working in a second
language, while the rest of the table presents some statistics.
(Table 5 about here)
Let us consider the columns with the full set of instruments.18 The IV results are not
all in agreement with the ability bias story previously discussed, in that some IV
coefficients are larger than the OLS ones. Note that this is similar to what has been
usually found in the education literature on the ability bias and in the related literature on
18 The complete regression results for the full set of instruments and for the index treated as a continuous variable are in Tables A5 and A6. The complete results for the other specifications are available from the authors.

22
the effects of language skills mentioned earlier.19 For the French mother tongue group,
the estimated reward for using English at work increases substantially in both
specifications when compared to the OLS results. For the English mother tongue group
there is now a penalty for both definitions of French use at work, but the coefficient is
statistically significant in only one of the four specifications. Since the OLS results with
the index treated as continuous were not significant either, both results suggest that for
Anglophones there are no gains in using a second language at work. For the Other mother
tongues, the IV results show an increased payoff for working in an official language, but
the payoff for using English instead of French is smaller than in the OLS case (in fact, it
is no longer significant), as the ability bias theory would predict.
To examine the validity of the IV results, the bottom part of Table 5 reports some
statistics.20 The First stage regression partial R-squared measures the strength of the
relationship between the endogenous variable (that is, WSL) and its instruments. For the
full set of instruments, those partial R-squared indicate that the instruments are correlated
with the language of work. The presumed absence of correlation between the instruments
and the error term of the earnings regression is based on economic arguments and cannot
be determined solely from statistical considerations, but an Overidentification test can be
performed. For the instruments to be good, the null hypothesis must be accepted. The
19 One explanation of that result is that the attenuation bias due to observation errors seems to be larger than the ability bias. 20 See Nichols (2007) and Wooldridge (2013) for a discussion of the tests that can be performed in instrumental variable regressions.

23
results show that it is not the case, which suggests potential problems with the
instruments.21
After experimenting with various subsets of instruments, it turns out that only two of
them, Place of birth in Canada outside Quebec and Residence in Canada outside Quebec
one or five years prior to the census, pass the Overidentification test for the French and
English mother tongue groups. However, even with this subset of instruments, the Other
mother tongues group still does not pass the overidentification test.22 Further, with only
those two instruments, the first stage regression partial R-squared are very low, in the
order of 1% or less, which suggests that the instruments are weak.
The results of the above tests are reflected in the regression coefficients. For the
English and French mother tongue groups, the findings are similar to the previous ones,
but the coefficients are much less precise. For the Other mother tongues group, the
coefficients are much larger than the OLS ones, but that is probably due to the weakness
of the instruments.
Overall, our results are in agreement with those of other researchers who found
stronger effects of language ability on earnings in IV than in OLS regressions.
Comparing the OLS and IV results of this study, the story does not change much, as we
21 There may be possible drawbacks with some of our instruments. For example, home language is assumed to be exogenous with respect to language of work, but in reality both variables may be jointly determined (for example, for the individuals who meet their spouse at work, the home language can be determined after the language of work). Similarly, the detailed mother tongues may also reflect other attributes that affect earnings, such as ethnicity and quality of education in the countries of origin of immigrants. The results of our Overidentification test could also indicate that the model is misspecified and that the variables used as instruments should in fact be in the earnings regression. That was done in some regressions. The results for the language of work variables were similar to those in the regressions that did not include them. 22 For the other mother tongues group, the Overidentification test cannot be done when both Offwork and Engwork are included, because there are no overidentifying restrictions.

24
still find that working in a second language has little or no payoff for Anglophones, while
it provides important rewards for the French and the Other mother tongues group.
Conclusion and Policy implications
Using micro-data from the 2006 Canadian Census, we looked at the factors that
determine the use of a second language at work in the Montreal metropolitan area for
three mother tongue groups: French, English and Other. We also analyzed for the same
groups the impact on earnings of using a second language at work with both OLS and IV
regressions.
The status of English as the international lingua franca plays an important role in the
determination of the use of a second language at work. In particular, schooling is
positively related to the use of English at work, but not to the use of French, suggesting
that English matters a lot in jobs that require a high amount of skills. There are important
differences in the effect of using a second language on earnings. For members of the
English mother tongue group, there are few earnings advantages to using French at work,
and the payoff is higher if only little French is used. In contrast, for the French and the
Other mother tongues groups, there are important economic benefits to using a second
language at work. Those results are to some extent similar to the traditional ones that
used language skills instead of language of work. In a comparison of the last few decades,
Vaillancourt et al. (2013, Tables 7 and 8) find that there is a high payoff for
Francophones to be bilingual, while this payoff is generally lower or inexistent for
bilingual Anglophones.
25
Put together, our findings suggest that Anglophones do not learn French mainly for
reasons related to improving their wages, but that financial incentives are crucial in the
decision to learn English and use it at work by Francophones and members of the Other
mother tongues group. Because it is the lingua franca, English is very often necessary to
be successful in the labour market, while French is only an asset, perhaps even a minor
one. This situation is not due to the inferior economic status of the native French
speakers. On the contrary, Francophones in Quebec have made substantial progress in
controlling their economy (Vaillancourt and Vaillancourt, 2005).
Our analysis must be placed in the context of the language situation in Quebec and
particularly in the Montreal metropolitan area. A major element of Quebec language
policy is that schooling in French at the primary and secondary levels is compulsory
except for those who are Canadians of English origin (more precisely, parents who
received their education in English in Canada can send their children to English schools).
This policy has worked well in having the children of immigrants integrate to the French
speaking majority. After heated debates that took place at various points of time in the
past, there is now (at the time of writing this paper) a kind of “linguistic peace” in
Quebec. However, that peace is fragile and can be disturbed by various trends that occur
slowly, such as the language choices of immigrants who, in spite of the language laws,
tend to prefer English in higher proportions than the weight of the Anglophone
population would predict. For example, after completing their secondary studies in
French, many of them choose English as the language of postsecondary education, for
which there is no obligation to study in French.

26
The policy dilemma is to keep a good balance between the protection of French in
Quebec and the advantages of using English in a globalized economy. Many countries in
the world also face the same problem. English is worth a lot as the lingua franca, but it
should be kept in mind that the value of a language is not only pecuniary. A language is
also the expression of the culture of a group of people. This has value and people may be
willing to bear some costs to protect their language.
27
References
Albouy, David. 2008. “The Wage Gap between Anglophones and Francophones: A
Canadian Perspective, 1970-2000” Canadian Journal of Economics 41 (4): 1211-
38.
Angrist, J.D. and A.B. Krueger. 1991. “Does Compulsory School Attendance Affect
Schooling and Earnings?” Quarterly Journal of Economics 106: 979-1014.
Bleakley, Hoyt, and Aimee Chin. 2004. “Language Skills and Earnings: Evidence from
Childhood Immigrants?” The Review of Economics and Statistics 86 (2): 481-96.
Bloom, David E. and Gilles Grenier. 1992. “Earnings of the French Minority in Canada
and the Spanish Minority in the United States.” In Immigration, Language and
Ethnicity: Canada and the United States, edited by B.R. Chiswick. Washington,
D.C.: The AEI Press. Chapter 9: 373-409.
Boulet, Jac-André. 1980. Language and Earning in Montreal, Ottawa: The Economic
Council of Canada (135 pages).
Boulet, Jac-André and Laval Lavallée. 1983. L’évolution des disparités linguistiques de
revenus de travail au Canada de 1970 à 1980. Ottawa: The Economic Council of
Canada (71 pages).
Boulet, Jac-André and André Raynauld. 1977. L’analyse des disparités de revenu suivant
l’origine ethnique et la langue sur le marché montréalais en 1961. Ottawa: The
Economic Council of Canada, Discussion Paper No. 83 (270 pages).

28
Breton, Albert. 1978. Bilingualism: An Economic Approach. Montreal: C.D. Howe
Research Institute (14 pages).
Card, David. 1995. “Using Geographic Variation in College Proximity to Estimate the
Return to Schooling.” In Aspects of Labour Market Behaviour in Honour of John
Vanderkamp, eds. L. Christofides, E.K. Grant and R. Swidinsky, Toronto:
University of Toronto Press. Chapter 7: 201-22.
Castonguay, Charles. 1997. “Tendances de l’assimilation linguistique dans l’ouest de
l’île de Montréal et l’ouest de l’Outaouais.” Cahiers québécois de démobraphie
45 : 65-82.
Castonguay, Charles. 1998. “Tendances et incidences de l’assimilation linguistique au
Canada : entre les faits et l’optimisme futurologique à l’égard du français.”
Études canadiennes 26 (2) : 307-22.
Chiswick, Barry R. and Paul Miller. 1994. “Language Choice Among Immigrants in a
Multi-lingual Destination.” Journal of Population Economics 7 (2): 117-31.
Chiswick, Barry R. and Paul Miller. 1995. “The Endogeneity between Language and
Earnings: International Analyses.” Journal of Labor Economics 13 (2): 246-88.
Christofides, Louis N. and Robert Swidinsky. 2010. “The Economic Returns to the
Knowledge and Use of a Second Language.” Canadian Public Policy 36 (2): 137-
58.

29
Dustmann, Christian, and Arthur van Soest. 2002. “Language and the Earnings of
Immigrants.” Industrial and Labor Relations Review 55(3): 473-92.
Gao, Wenshu and Russell Smyth. 2011. “Economic Returns to speaking ‘Standard
Mandarin’ Among Migrants in China’s Urban Labour Market” Economics of
Education Review 36: 342-52.
Grenier, Gilles and Serge Nadeau. 2011. “Immigrant Access to Work in Montreal and in
Toronto” Canadian Journal of Regional Science 34(1): 19-33.
Grin, François. 2003. “Language Planning and Economics.” Current Issues in Language
Planning 4 (1): 1-66.
Grin, François, Claudio Sfreddo and François Vaillancourt. 2010. The Economics of the
Multilingual Workplace. New York: Routledge (242 pages).
Lemieux, Thomas and David Card. 2001. “Education, Earnings, and the ‘Canadian G.I.
Bill’” Canadian Journal of Economics 34: 314-44.
Li, Peter and Chunhong Dong. 2007. “Earnings of Chinese Immigrants in the Enclave
and Mainstream Economy” Canadian Review of Sociology 44(1): 65-99.
Nadeau, Serge. 2010. “Another Look at the Francophone Wage Gap in Canada: Public
and Private Sectors, Quebec and Outside Quebec” Canadian Public Policy /
Analyse de politiques 36 (2): 159-80.

30
Nichols, Austin. 2007. “Causal Inference with Observational Data” The Stata Journal
7(4): 507-41.
Shapiro, D. M. and M. Stelcner. 1997. “Language and Earnings in Quebec: Trends over
Twenty Years. 1970-1990”, Canadian Public Policy / Analyse de politiques 23
(2):115-40.
Termote, Marc. 1999. Perspectives démolinguistiques du Québec et de la région de
Montréal à l’aube du XXIe siècle. Implications pour le français langue d’usage
public. Québec : Conseil de la langue française (195 pages).
Vaillancourt, François. 1980. Differences in Earnings by Language Groups in Quebec,
1970: An economic Analysis. Québec: International Center for Research on
Bilingualism (232 pages).
Vaillancourt, François, Julien Tousignant, Joëlle Chatel-DeRepentigny and Simon Coutu-
Mantha. 2013. “Revenus de travail et rendements des attributs linguistiques au
Québec en 2005 et depuis 1970”. Canadian Public Policy / Analyse de politiques
39 (supplement):s25-40.
Vaillancourt, François, and Luc Vaillancourt. 2005. La propriété des employeurs au
Québec en 2003 selon le groupe d’appartenance linguistique. Conseil supérieur
de la langue française (65 pages).
Wooldridge, Jeffrey M. 2013. Introductory Econometrics, 5th edition. Mason, OH,
South-Western Cengage Learning.

31
Zhang, Weiguo, and Gilles Grenier. 2013. “How Can Language Be Linked to
Economics? A survey of Two Strands of Research”. Language Problems and
Language Planning 37 (forthcoming)
32
Table 1. Mean index of use of second languages at work, by mother tongue, Montreal Metropolitan Area, 2006
French mother tongue
English mother tongue
Other mother tongues
Use of English at
work (engwork)
Use of French at
work (fwork)
Use of an official language
at work (offwork)
Use of English at work as opposed
to French (engwork)
All workers 0.20 0.32 0.94 0.47
Men 0.21 0.33 0.94 0.47
Women 0.19 0.30 0.94 0.46
Canadian born 0.16 0.34 0.97 0.52
Immigrants 0.37 0.23 0.94 0.45
Less than university 0.18 0.34 0.93 0.44
University 0.24 0.28 0.96 0.51
Age 18-39 0.22 0.33 0.96 0.47
Age 40-64 0.19 0.30 0.93 0.46
Sample size 145587 21901 37165
Percentage of sample 71% 11% 18%

33
Mother tongue
Use of English at work as opposed to
French (engwork)
Mother tongue
Use of English at work as opposed to
French (engwork)
Filipino 0.84 Other African 0.54
South Asian 0.82 Armenian 0.51Hebrew 0,72 Turkish 0.51Mandarin 0.71 Italian 0.50Other Asian 0.69 Romanian 0.39Other North European 0.67 Vietnamese 0.35Cantonese 0.66 Arabic 0.35Japanese/Korean 0.65 Portugese 0.34Greek 0.62 Other languages 0.33
Hungarian 0.59 Spanish 0.31Ukrainian 0.59 Other Middle Eastern Afro
Asiatic0.30
German 0.57 Niger-Congo 0.28Russian 0.57 Khmer 0.27Iranian 0.56 Tai 0.24Other East European 0.55 Creole 0.17
Polish 0.54
Table 2. Mean index of use of English at work, Other mother tongues, sorted from highest to lowest, Montreal Metropolitan Area, 2006

34
Coefficient (t) Coefficient (t) Coefficient (t) Coefficient (t)
woman -0,0108 (-7.90) -0,0063 (-1.48) -0,0015 (-0.87) -0,0145 (-3.84)
Immigrant -0,0129 (-1.62) -0,1016 (-7.03) -0,0252 (-6.69) 0,0164 (1.80)years since migration 0,0037 (4.36) 0,0011 (0.94) -0,0003 (-1.22) -0,0015 (-2.37)years since migration squared -0,000049 (-2.66) 0,000013 (0.60) 0,000017 (3.06) 0,000041 (3.18)
Schooling (ref: high school certificate)
None -0,0490 (-24.11) -0,0363 (-4.14) -0,0197 (-5.71) -0,0351 (-5.14)Non university diploma 0,0068 (4.20) 0,0084 (1.55) 0,0042 (1.91) -0,0126 (-2.53)Univ diploma below bac 0,0260 (9.40) -0,0094 (-1.07) 0,0051 (1.57) 0,0050 (0.68)University bachelors 0,0332 (15.77) -0,0003 (-0.05) 0,0111 (4.74) 0,0147 (2.60)University MA or PhD 0,0571 (18.01) 0,0097 (1.16) 0,0120 (3.87) 0,0415 (5.32)
Born in Can outside Quebec 0,0485 (12.31) -0,0395 (-7.02) -0,0044 (-0.78) 0,0549 (3.40)Previous resid outside Quebec 0,0862 (13.66) -0,0638 (-7.29) -0,0094 (-3.03) 0,0337 (4.52)
R-squared 0,1839 0.1906 0.0754 0.3316Sample size 145587 21901 37165 37165
Table 3. Regressions on the use of a second language at work, effect of selected
variablesa, full-time full-year workers, Montreal Metropolitan Area, 2006 (t-statistics based on robust standard errors in parentheses)
aOther control variables: age, age squared, married, nonwhite, 14 industry dummies, 8 occupation dummies, 2
home language dummies, 4 places of work within Montreal dummies, 30 mother tongue dummies (for the other mother tongues group). The complete results are in Appendix Tables A1 and A2.
(Official language at work)
(English at work)French mother
tongue (English at work)
English mother tongue (French at
work)
Other mother tongues
35
Coefficient (t) Coefficient (t) Coefficient (t) Coefficient (t)
Without industry and occupation 0,283 (37.64) -0,006 (-0.38) 0,428 (15.53) 0,048 (4.75)With industry and occupation 0,217 (28.79) 0,008 (0.52) 0,318 (11.64) 0,024 (2.39)
Without industry and occupationValue of index
0 (reference) (reference) (not defined)b
(reference)0,25 0,127 (38.57) 0,062 (5.36) (reference) 0,080 (7.70)0,5 0,058 (7.43) -0,036 (-2.14) 0,128 (3.27) 0,051 (4.19)
0,75 0,244 (34.90) 0,040 (2.89) 0,200 (5.97) 0,130 (11.42)1 0,099 (4.77) -0,034 (-1.34) 0,303 (9.47) 0,031 (2.70)
With industry and occupation
Value of index0 (reference) (reference) (not defined)
b(reference)
0,25 0,103 (31.08) 0,042 (3.79) (reference) 0,074 (7.38)0,5 0,046 (6.12) -0,034 (-2.13) 0,103 (2.65) 0,042 (3.56)
0,75 0,192 (28.14) 0,040 (3.00) 0,166 (5.05) 0,104 (9.41)1 0,071 (3.54) -0,015 (-0.59) 0,233 (7.40) 0,013 (1.15)
Without industry and occupation 0,134 (43.4) 0,040 (3.71) 0,032 (4.14)
With industry and occupation 0,106 (34.0) 0,029 (2.83) 0,013 (1.71)
Sample size 145587 21981 37165
a The dependent variable is log of weekly earnings. The other control variables are: age, age squared, woman, married, 5 schooling dummies, nonwhite, immigrant, years since migration, years since migration squared, and 14 industry and 8 occupation dummies for the regressions that include industry and occupation.The complete OLS results for the regressions with index of use of a second language at work treated as continuous (definition 1) are are in appendix Tables A3 and A4. The results for the regressions with dummy variables (definitions 2 and 3) do not differ much and are available from the authors.
b For the Other mother tongue group, a few observations for those who did not use an official language at work were removed because the variable Engwork could not have been defined for them. Therefore, for that group, the reference category is value of the index .25 instead of zero.
3) Singleindicator variable c
c For the French and English mother tongue groups the variable is set to one if the second language is used, no matter how much, and to zero if the second language is not used at all (i.e., =1 if index ≥0.25, =0 otherwise); for the Other mother tongue group, it is set to one if English used more than French, and to zero if French is used more than English (the ties between English and French were removed for this regression). For this specification, the distinction between official and non-official language is not included.
Table 4 . Effect of the use of a second language at work (three definitions) on log earningsa,
ordinary Least squares regressions, full-time full-year workers, Montreal Metropolitan Area, 2006 (t-statistics based on robust standard errors in parentheses)
1) Index of use of second language treated as continuous
English mother tongueFrench mother tongue
2)Indicator variables for values of index
Other mother tongues
Engwork Fwork Offwork Engwork

36
Offwork Engwork Offwork Engwork
Full set of instruments
Limited set of
instruments
Full set of instruments
Limited set of
instruments
0,553 0,375 -0,110 0,0796 1,399 -0,009 9,268 0,544(22.52) (4.49) (-2.60) (0.38) (9.77) (-0.45) (3.09) (0.75)0,448 0,288 -0,063 0,078 0,939 -0,021 8,302 0,673
(17.13) (3.22) (-1.54) (0.39) (6.81) (-1.14) (2.88) (0.97)
0,379 0,214 -0,091 0,035 Not included -0,024 Not included -0,260(26.85) (4.67) (-1.79) (0.37) (-1.73) (-0.84)0,339 0,178 -0,056 0,035 Not included -0,029 Not included -0,112
(21.29) (3.40) (-1.16) (0.36) (-2.05) (-0.39)
INSTRUMENT VALIDITY
Without industry and occupation
First stage regression partial R-squared
0,093 0,0093 0,130 0,0075 0,041 0,284 0,0003 0,0005
Test of overidentification: score chi2, with force weight (p-value) 0,000 0,390 0,000 0,748
With industry and occupation
First stage regression partial R-squared
0,082 0,0079 0,126 0,0076 0,040 0,277 0,0003 0,0005
Test of overidentification: score chi2, with force weight (p-value) 0,000 0,356 0,000 0,658
Without industry and occupationFirst stage regression partial R-squared
0,052 0,0057 0,044 0,015 Not included 0,292 Not included 0,0009
Test of overidentification: score chi2, with force weight (p-value) 0,000 0,697 0,000 0,782
With industry and occupation
First stage regression partial R-squared
0,041 0,0043 0,042 0,014 Not included 0,283 Not included 0,0008
Test of overidentification: score chi2, with force weight (p-value) 0,000 0,632 0,000 0,623
c See footnote c of Table 4.
2) Single indicator variablec
2) Singleindicator variablec
No overid restriction
No overid restriction
b The full set of instruments includes the following variables: born in Canada outside Quebec (dummy variable) , residence outside Quebec 1 or 5 years earlier (dummy variable) , home language (English, French, non-official ), location of work in Montreal (South, West, North, Other) , and detailed mother tongues (for the other mother tongues group, 31 languages as shown in Table A2). The limited set of instruments includes: born in Canada outside Quebec (dummy variable), and residence outside Quebec 1 or 5 years earlier (dummy variable). First stage regressions for for the full set of instruments and the index treated as a continous variable are in Tables A1 and A2 (these are also the results used for Table 3). The other complete regression results are available from the authors.
0,000
0,000
0,000
0,000
0,000
0,000
1) Index of use of second language treated as continuous
a See Note a of Table 4 for the list of the control variables included in the regressions. The complete regressions for the full set of instrumental variables and for the index treated as a continuous variable are in appendix Tables A5 and A6 . The other complete regressions are available from the authors.
Table 5 . Effect of the use of a second language at work on log earningsa, instrumental variables regressions with
full and limited sets of instruments b, full-time full-year workers, Montreal Metropolitan Area, 2006 (t-statistics based on robust standard errors in parentheses)
French mother tongue English mother tongue Other mother tongues
Engwork Fwork
Full set of instruments
REGRESSION COEFFICIENTS
1) Index of use of second language treated as continuous
Without industry and occupation
With industry and occupation
Without industry and occupation
With industry and occupation
Limited set of instruments

37
APPENDIX TABLES

38
Coefficient t‐value Coefficient t‐value Coefficient t‐value Coefficient t‐value
age 0,0006 1.50 ‐0,0003 ‐0.69 0,0004 0.28 0,0006 0.42
age squared ‐0,000021 ‐4.31 ‐0,000008 ‐1.63 ‐0,000026 ‐1.61 ‐0,000024 ‐1.48
married ‐0,0036 ‐2.76 ‐0,0063 ‐5.05 ‐0,0071 ‐1.67 ‐0,0064 ‐1.51
woman ‐0,0143 ‐11.85 ‐0,0108 ‐7.90 ‐0,0197 ‐4.96 ‐0,0063 ‐1.48
Immigrant ‐0,0006 ‐0.08 ‐0,0129 ‐1.62 ‐0,1067 ‐7.46 ‐0,1016 ‐7.03
years since migration 0,0034 3.82 0,0037 4.36 0,0014 1.25 0,0011 0.94
years since mig. squared ‐0,000048 ‐2.48 ‐0,000049 ‐2.66 0,000008 0.37 0,000013 0.60
nonwhite 0,0291 5.73 0,0305 6.14 ‐0,0441 ‐6.45 ‐0,0487 ‐7.16
Schooling (ref: high school certificate)
None ‐0,0620 ‐30.69 ‐0,0490 ‐24.11 ‐0,0256 ‐2.94 ‐0,0363 ‐4.14
Non university diploma ‐0,0036 ‐2.20 0,0068 4.20 0,0056 1.03 0,0084 1.55
Univ dipl below bacc 0,0270 9.66 0,0260 9.40 ‐0,0225 ‐2.56 ‐0,0094 ‐1.07
University bacc 0,0213 10.89 0,0332 15.77 ‐0,0299 ‐5.34 ‐0,0003 ‐0.05
University MA or PhD 0,0384 12.32 0,0571 18.01 ‐0,0410 ‐5.15 0,0097 1.16
Industry (ref: manufacturing)
Agriculture, mines, utility ‐0,1156 ‐31.66 0,0683 1.95
Construction ‐0,0745 ‐25.71 0,0621 3.89
Wholesale trade 0,0186 6.00 ‐0,0012 ‐0.16
Retail trade ‐0,0428 ‐16.52 0,0668 7.49
Transportation 0,0229 6.61 0,0023 0.26
Information and cultural ‐0,0069 ‐1.83 0,0077 0.74
Finance and insurance ‐0,0278 ‐8.31 0,0256 2.66
Real estate, rental ‐0,0195 ‐3.47 0,0351 2.41
Professional services ‐0,0079 ‐2.54 ‐0,0083 ‐1.02
Management and admin ‐0,0281 ‐7.20 ‐0,0024 ‐0.20
Education ‐0,1351 ‐42.14 ‐0,0941 ‐10.50
Health ‐0,1044 ‐35.09 0,0079 0.81
Arts and accomodation ‐0,0435 ‐12.69 0,0610 5.57
Other services ‐0,0691 ‐21.35 ‐0,0154 ‐1.35
Public administration ‐0,0850 ‐32.18 0,1598 10.38
Occupation (ref: primary and manuf)
Management 0,1299 41.04 ‐0,0341 ‐2.77
Business 0,1012 34.42 ‐0,0414 ‐3.43
Science 0,1078 31.54 ‐0,0592 ‐4.54
Health 0,1251 30.40 ‐0,0066 ‐0.41
Social science, education 0,0768 20.85 ‐0,0501 ‐3.54
Recreation, arts 0,0620 13.58 ‐0,0646 ‐4.17
Sales and services 0,1031 34.09 ‐0,0238 ‐1.89
Trades and transport 0,0289 10.19 0,0247 1.78
Born in Can outside Que 0,0550 13.50 0,0485 12.31 ‐0,0430 ‐7.51 ‐0,0395 ‐7.02
Previous res outside Que 0,0979 15.14 0,0862 13.66 ‐0,0612 ‐6.91 ‐0,0638 ‐7.29
Home language (ref: English)
French ‐0,2915 ‐54.52 ‐0,2726 ‐50.72 0,2886 40.87 0,2771 39.20
Non official ‐0,2327 ‐17.01 ‐0,2116 ‐15.56 0,0760 4.13 0,0748 4.13
Location of work In Mtl (ref: Centre)
South ‐0,0461 ‐29.43 ‐0,0419 ‐27.36 0,0789 8.96 0,0822 9.45
West 0,1276 35.11 0,1101 30.67 ‐0,0446 ‐8.95 ‐0,0452 ‐9.00
North ‐0,0659 ‐46.00 ‐0,0579 ‐41.28 0,1076 11.11 0,1053 11.15
Other ‐0,0483 ‐14.32 ‐0,0375 ‐11.34 ‐0,0021 ‐0.12 ‐0,0124 ‐0.70
Constant 0,4830 50.17 0,4224 43.60 0,3706 13.46 0,3658 12.37
R‐squared 0,1213 0,1839 0.1606 0,1906
Sample size 145587 145587 21901 21901
French Mother tongue (Use of English at work) English Mother tongue (Use of French at work)
Table A1. OLS Regressions for Second Language at Work, French and English Mother Tongues,
Montreal Metropolitan Area, 2006 Census

39
Coefficient t‐value Coefficient t‐value Coefficient t‐value Coefficient t‐value
age 0,0012 2.05 0,0010 1.68 0,0035 2.69 0,0027 2.08
age squared ‐0,000022 ‐3.12 ‐0,000019 ‐2.62 ‐0,000051 ‐3.23 ‐0,000039 ‐2.49
married 0,0007 0.42 0,0006 0.35 ‐0,0097 ‐2.45 ‐0,0098 ‐2.53
woman ‐0,0021 ‐1.43 ‐0,0015 ‐0.87 ‐0,0154 ‐4.44 ‐0,0145 ‐3.84
Immigrant ‐0,0275 ‐7.32 ‐0,0252 ‐6.69 0,0164 1.80 0,0164 1.80
years since migration ‐0,0003 ‐1.24 ‐0,0003 ‐1.22 ‐0,0018 ‐2.78 ‐0,0015 ‐2.37
yrs since mig. Squared 0,000019 3.37 0,000017 3.06 0,000048 3.66 0,000041 3.18
nonwhite ‐0,0031 ‐1.06 ‐0,0025 ‐0.86 ‐0,0177 ‐2.63 ‐0,0126 ‐1.89
Schooling (ref: high school certificate)
None ‐0,0225 ‐6.48 ‐0,0197 ‐5.71 ‐0,0421 ‐6.22 ‐0,0351 ‐5.14
Non university diploma 0,0076 3.46 0,0042 1.91 ‐0,0129 ‐2.58 ‐0,0126 ‐2.53
Univ dipl below bacc 0,0100 3.12 0,0051 1.57 0,0105 1.43 0,0050 0.68
University bacc 0,0187 8.33 0,0111 4.74 0,0286 5.28 0,0147 2.60
University MA or PhD 0,0216 7.41 0,0120 3.87 0,0604 8.19 0,0415 5.32
Industry (ref: manufacturing)
Agriculture, mines, utility 0,0175 2.96 ‐0,1045 ‐4.60
Construction ‐0,0035 ‐0.76 ‐0,0829 ‐7.14
Wholesale trade ‐0,0045 ‐1.41 0,0357 4.91
Retail trade ‐0,0009 ‐0.26 ‐0,0511 ‐7.08
Transportation 0,0009 0.26 0,0357 4.11
Information and cultural 0,0074 2.18 ‐0,0051 ‐0.49
Finance and insurance 0,0008 0.25 ‐0,0361 ‐4.30
Real estate, rental 0,0071 1.25 ‐0,0272 ‐1.88
Professional services 0,0032 1.19 0,0244 3.29
Management and admin 0,0038 0.96 ‐0,0283 ‐3.07
Education 0,0095 2.24 0,0441 4.05
Health 0,0056 1.49 ‐0,0633 ‐6.94
Arts and accomodation ‐0,0244 ‐5.72 ‐0,0499 ‐6.10
Other services ‐0,0282 ‐5.74 0,0016 0.17
Public administration 0,0034 0.91 ‐0,1416 ‐13.55
Occupation (ref: primary and manuf)
Management 0,0037 0.98 0,0488 5.87
Business 0,0153 4.53 0,0634 8.02
Science 0,0279 8.35 0,0603 6.96
Health ‐0,0005 ‐0.10 0,0339 2.85
Social science, education ‐0,0003 ‐0.07 0,0075 0.67
Recreation, arts 0,0107 1.73 0,0492 3.28
Sales and services 0,0016 0.42 0,0303 3.76
Trades and transport 0,0161 4.37 0,0007 0.08
Born in Can outside Que ‐0,0073 ‐1.27 ‐0,0044 ‐0.78 0,0573 3.44 0,0549 3.40
Previous res outside Que ‐0,0101 ‐3.26 ‐0,0094 ‐3.03 0,0320 4.24 0,0337 4.52
Home language (ref: English)
French ‐0,0071 ‐3.70 ‐0,0064 ‐3.30 ‐0,2401 ‐45.47 ‐0,2297 ‐43.88
Non official ‐0,0304 ‐15.38 ‐0,0300 ‐15.19 ‐0,1289 ‐26.67 ‐0,1211 ‐25.27
Location of work In Mtl (ref: Centre)
South 0,0086 2.70 0,0097 3.04 ‐0,0881 ‐11.51 ‐0,0880 ‐11.56
West 0,0170 7.81 0,0158 7.17 0,0760 13.10 0,0651 11.15
North 0,0114 4.69 0,0134 5.47 ‐0,0917 ‐14.84 ‐0,0847 ‐13.73
Other 0,0056 0.82 0,0056 0.84 ‐0,0214 ‐1.33 ‐0,0091 ‐0.56
Official language at work English at work
Table A2. OLS Regressions for Second Language at Work, Other Mother Tongues, Montreal
Metropolitan Area, 2006 Census

40
Mother tongue (ref: Italian)
German 0.0169 3.61 0.0168 3.58 0.0850 5.40 0.0804 5.27
Other North Europe 0.0225 3.79 0.0216 3.63 0.1790 9.88 0.1614 9.17
Portuguese 0.0219 6.14 0.0220 6.16 ‐0.0752 ‐9.26 ‐0.0724 ‐8.98
Spanish 0.0058 1.48 0.0049 1.25 ‐0.0908 ‐10.11 ‐0.0919 ‐10.36
Romanian 0.0547 13.57 0.0506 12.54 ‐0.0642 ‐5.59 ‐0.0705 ‐6.16
Greek ‐0.0126 ‐3.44 ‐0.0073 ‐1.98 0.1318 16.84 0.1343 17.30
Armenian 0.0246 4.53 0.0243 4.48 0.0594 5.00 0.0530 4.45
Russian 0.0364 6.65 0.0327 6.00 0.0986 6.18 0.0945 6.06
Hungarian 0.0277 3.53 0.0262 3.37 0.0843 3.98 0.0841 4.03
Polish 0.0146 2.70 0.0130 2.41 0.0647 4.92 0.0633 4.89
Ukrainian ‐0.0014 ‐0.13 ‐0.0026 ‐0.25 0.0706 3.12 0.0652 2.91
Other East Europe 0.0402 9.52 0.0376 8.91 0.0720 5.01 0.0676 4.76
Iranian 0.0471 6.39 0.0468 6.30 0.1270 6.50 0.1284 6.57
South Asian 0.0490 11.00 0.0504 11.26 0.3647 32.74 0.3610 32.55
Tai 0.0534 6.65 0.0517 6.35 ‐0.1256 ‐6.65 ‐0.1266 ‐6.74
Cantonese ‐0.0389 ‐3.06 ‐0.0390 ‐3.16 0.2229 10.08 0.2106 9.70
Other Asia ‐0.0168 ‐2.58 ‐0.0164 ‐2.56 0.2435 19.50 0.2362 19.21
vietnamese 0.0347 6.02 0.0339 6.00 ‐0.0482 ‐3.48 ‐0.0505 ‐3.71
Khmer 0.0431 4.72 0.0432 4.75 ‐0.0821 ‐4.11 ‐0.0815 ‐4.02
Filipino 0.0436 8.46 0.0467 9.00 0.3630 28.03 0.3653 28.32
Arabic 0.0326 8.59 0.0321 8.46 ‐0.0510 ‐5.55 ‐0.0541 ‐5.97
Hebrew 0.0124 1.05 0.0125 1.06 0.2073 9.79 0.1996 9.66
Other Middle East 0.0586 12.71 0.0564 11.87 ‐0.1128 ‐6.64 ‐0.1075 ‐6.36
Turk 0.0580 6.92 0.0605 7.05 0.0857 2.93 0.0829 2.79
Niger Congo 0.0668 16.44 0.0640 15.42 ‐0.1039 ‐5.04 ‐0.1015 ‐4.89
Other African 0.0626 12.15 0.0625 12.02 0.1094 3.96 0.1138 4.15
Creole 0.0588 14.53 0.0582 14.30 ‐0.1688 ‐16.78 ‐0.1643 ‐16.38
Japanese‐Korean 0.0038 0.26 0.0089 0.62 0.2011 6.79 0.1998 6.75
Mandarin 0.0161 1.58 0.0133 1.29 0.2455 8.63 0.2327 8.53
Other languages ‐0.0123 ‐0.69 ‐0.0152 ‐0.84 ‐0.0932 ‐2.71 ‐0.0904 ‐2.66
Constant 0.9550 82.46 0.9516 79.19 0.5211 19.36 0.5101 18.48
R‐squared 0.0647 0.0754 0.3144 0.3316
Sample size 37165 37165 37165 37165
41
Coefficient t‐value Coefficient t‐value Coefficient t‐value Coefficient t‐value
engwork 0,2834 37.64 0,2175 28.79
fwork ‐0,0060 ‐0.38 0,0082 0.52
age 0,0885 79.08 0,0761 70.03 0,0936 30.67 0,0809 27.70
age squared ‐0,000918 ‐66.95 ‐0,000778 ‐58.62 ‐0,000936 ‐25.25 ‐0,000794 ‐22.39
married 0,1071 32.60 0,0815 26.00 0,1703 18.60 0,1263 14.67
woman ‐0,2801 ‐91.01 ‐0,2229 ‐64.60 ‐0,2530 ‐28.50 ‐0,1942 ‐20.48
Immigrant ‐0,2339 ‐11.53 ‐0,2195 ‐11.43 ‐0,1166 ‐3.13 ‐0,1090 ‐3.12
years since migration 0,0054 2.50 0,0067 3.26 0,0033 1.11 0,0048 1.74
yrs since mig. squared ‐0,000011 ‐0.23 ‐0,000044 ‐0.98 ‐0,000009 ‐0.15 ‐0,000049 ‐0.93
nonwhite ‐0,1718 ‐13.79 ‐0,1690 ‐14.18 ‐0,1776 ‐11.63 ‐0,1471 ‐9.99
Schooling (ref: high school certificate)
None ‐0,1996 ‐33.97 ‐0,1614 ‐28.06 ‐0,2196 ‐12.17 ‐0,1424 ‐8.17
Non university diploma 0,0994 24.00 0,0775 19.26 0,0883 7.80 0,0790 7.26
Univ dipl below bacc 0,3117 43.88 0,2422 35.38 0,2586 12.70 0,1924 10.02
University bacc 0,4564 93.10 0,3765 71.34 0,4441 33.51 0,3568 26.29
University MA or PhD 0,6305 79.98 0,5316 65.59 0,6025 30.46 0,5474 25.63
Industry (ref: manufacturing)
Agriculture, mines, utility 0,1696 17.06 ‐0,0083 ‐0.10
Construction ‐0,0737 ‐8.48 ‐0,0725 ‐2.29
Wholesale trade ‐0,0341 ‐4.69 ‐0,0643 ‐3.79
Retail trade ‐0,2659 ‐39.59 ‐0,2964 ‐15.06
Transportation ‐0,0279 ‐3.72 ‐0,0262 ‐1.43
Information and cultural 0,0687 8.02 0,0354 1.58
Finance and insurance 0,0398 5.44 0,0616 2.88
Real estate, rental ‐0,1830 ‐11.87 ‐0,0953 ‐2.59
Professional services ‐0,0679 ‐9.14 ‐0,0278 ‐1.44
Management and admin ‐0,2649 ‐26.89 ‐0,2473 ‐8.93
Education ‐0,1663 ‐22.10 ‐0,2863 ‐14.53
Health ‐0,2379 ‐33.68 ‐0,2997 ‐15.48
Arts and accomodation ‐0,3830 ‐40.08 ‐0,4648 ‐19.65
Other services ‐0,2972 ‐32.10 ‐0,3511 ‐13.58
Public administration 0,0762 12.43 0,0305 1.14
Occupation (ref: primary and manuf)
Management 0,3433 38.31 0,5641 22.28
Business 0,0478 6.04 0,1985 8.48
Science 0,2008 23.56 0,3976 15.99
Health 0,2859 26.26 0,4586 13.85
Social science, education 0,1305 13.14 0,3406 11.62
Recreation, arts 0,0239 1.96 0,1045 3.10
Sales and services 0,0103 1.21 0,1794 7.19
Trades and transport 0,0964 12.05 0,1629 6.45
Constant 4,5454 210.10 4,8197 219.70 4,4035 73.76 4,5213 73.63
R‐squared 0.3027 0.3707 0.2924 0.3753
Sample size 145587 145587 21901 21901
French mother tongue English mother tongue
Table A3. OLS earnings regressions, French and English Mother Tongues, Montreal Metropolitan Area,
2006 Census
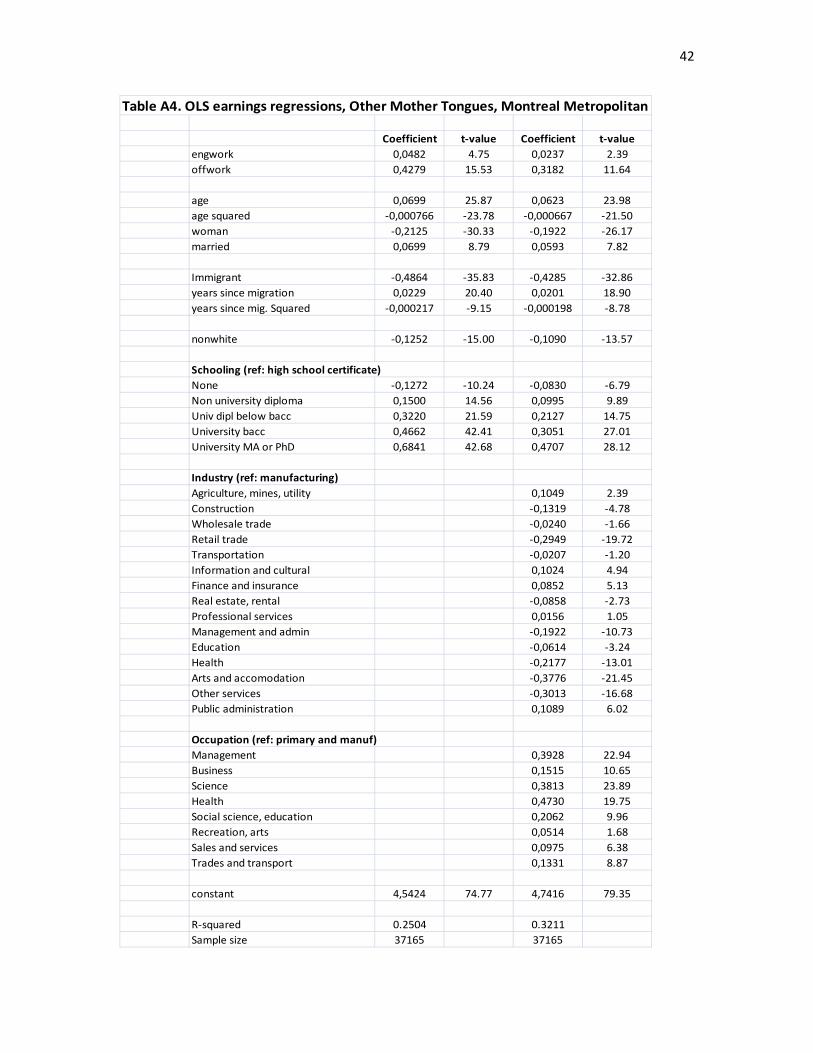
42
Coefficient t‐value Coefficient t‐value
engwork 0,0482 4.75 0,0237 2.39
offwork 0,4279 15.53 0,3182 11.64
age 0,0699 25.87 0,0623 23.98
age squared ‐0,000766 ‐23.78 ‐0,000667 ‐21.50
woman ‐0,2125 ‐30.33 ‐0,1922 ‐26.17
married 0,0699 8.79 0,0593 7.82
Immigrant ‐0,4864 ‐35.83 ‐0,4285 ‐32.86
years since migration 0,0229 20.40 0,0201 18.90
years since mig. Squared ‐0,000217 ‐9.15 ‐0,000198 ‐8.78
nonwhite ‐0,1252 ‐15.00 ‐0,1090 ‐13.57
Schooling (ref: high school certificate)
None ‐0,1272 ‐10.24 ‐0,0830 ‐6.79
Non university diploma 0,1500 14.56 0,0995 9.89
Univ dipl below bacc 0,3220 21.59 0,2127 14.75
University bacc 0,4662 42.41 0,3051 27.01
University MA or PhD 0,6841 42.68 0,4707 28.12
Industry (ref: manufacturing)
Agriculture, mines, utility 0,1049 2.39
Construction ‐0,1319 ‐4.78
Wholesale trade ‐0,0240 ‐1.66
Retail trade ‐0,2949 ‐19.72
Transportation ‐0,0207 ‐1.20
Information and cultural 0,1024 4.94
Finance and insurance 0,0852 5.13
Real estate, rental ‐0,0858 ‐2.73
Professional services 0,0156 1.05
Management and admin ‐0,1922 ‐10.73
Education ‐0,0614 ‐3.24
Health ‐0,2177 ‐13.01
Arts and accomodation ‐0,3776 ‐21.45
Other services ‐0,3013 ‐16.68
Public administration 0,1089 6.02
Occupation (ref: primary and manuf)
Management 0,3928 22.94
Business 0,1515 10.65
Science 0,3813 23.89
Health 0,4730 19.75
Social science, education 0,2062 9.96
Recreation, arts 0,0514 1.68
Sales and services 0,0975 6.38
Trades and transport 0,1331 8.87
constant 4,5424 74.77 4,7416 79.35
R‐squared 0.2504 0.3211
Sample size 37165 37165
Table A4. OLS earnings regressions, Other Mother Tongues, Montreal Metropolitan

43
Coefficient t‐value Coefficient t‐value Coefficient t‐value Coefficient t‐value
engwork 0,5526 22.52 0,4482 17.13
fwork ‐0,1103 ‐2.60 ‐0,0629 ‐1.54
age 0,0882 78.20 0,0761 69.77 ‐0,1267 ‐3.38 0,0811 27.74
age squared ‐0,000911 ‐65.87 ‐0,000775 ‐58.22 0,0034 1.14 ‐0,000798 ‐22.47
married 0,1085 32.76 0,0833 26.37 0,0000 ‐0.12 0,1269 14.70
woman ‐0,2751 ‐87.90 ‐0,2199 ‐63.12 ‐0,1841 ‐11.83 ‐0,1948 ‐20.53
Immigrant ‐0,2453 ‐11.99 ‐0,2248 ‐11.61 0,0938 30.67 ‐0,1157 ‐3.29
years since migration 0,0054 2.46 0,0065 3.13 ‐0,0009 ‐25.33 0,0049 1.76
years since mig. Squared ‐0,000020 ‐0.43 ‐0,000049 ‐1.09 0,1711 18.61 ‐0,000048 ‐0.90
nonwhite ‐0,1844 ‐14.65 ‐0,1796 ‐14.94 ‐0,2555 ‐28.59 ‐0,1518 ‐10.11
Schooling (ref: high school certificate)
None ‐0,1808 ‐29.38 ‐0,1489 ‐25.07 ‐0,2195 ‐12.11 ‐0,1434 ‐8.21
Non university diploma 0,1005 24.11 0,0759 18.76 0,0894 7.88 0,0799 7.33
Univ dipl below bacc 0,3033 42.22 0,2354 34.03 0,2561 12.55 0,1917 9.98
University bacc 0,4490 90.52 0,3673 68.11 0,4395 33.02 0,3559 26.24
University MA or PhD 0,6172 77.08 0,5155 61.92 0,5955 29.89 0,5466 25.62
Industry (ref: manufacturing)
Agriculture, mines, utility 0,1984 19.02 ‐0,0011 ‐0.01
Construction ‐0,0550 ‐6.14 ‐0,0675 ‐2.13
Wholesale trade ‐0,0400 ‐5.48 ‐0,0651 ‐3.83
Retail trade ‐0,2535 ‐36.88 ‐0,2914 ‐14.72
Transportation ‐0,0372 ‐4.86 ‐0,0278 ‐1.52
Information and cultural 0,0681 7.94 0,0356 1.58
Finance and insurance 0,0458 6.21 0,0634 2.97
Real estate, rental ‐0,1794 ‐11.64 ‐0,0933 ‐2.53
Professional services ‐0,0664 ‐8.93 ‐0,0289 ‐1.50
Management and admin ‐0,2593 ‐26.26 ‐0,2482 ‐8.95
Education ‐0,1325 ‐15.61 ‐0,2934 ‐14.64
Health ‐0,2116 ‐27.54 ‐0,2995 ‐15.47
Arts and accomodation ‐0,3716 ‐38.43 ‐0,4607 ‐19.41
Other services ‐0,2798 ‐29.53 ‐0,3525 ‐13.63
Public administration 0,0975 14.79 0,0433 1.57
Occupation (ref: primary and manuf)
Management 0,3115 32.48 0,5608 22.08
Business 0,0223 2.66 0,1951 8.28
Science 0,1731 19.16 0,3924 15.66
Health 0,2549 22.26 0,4574 13.78
Social science, education 0,1122 11.04 0,3363 11.44
Recreation, arts 0,0080 0.64 0,0987 2.92
Sales and services ‐0,0153 ‐1.72 0,1773 7.08
Trades and transport 0,0895 11.12 0,1651 6.49
Constant 4,4972 203.03 4,7876 214.75 4,4399 71.83 4,5463 71.92
R‐squared 0.2942 0.3650 0.2907 0.3745
Sample size 145587 145587 21901 21901
Table A5. IV earnings regressions with full set of instrumentsa, French and English Mother
Tongues, Montreal Metropolitan Area, 2006 Census
French mother tongue English mother tongue
aFirst stage regressions for engwork and fwork are in Table A1. The instruments are: born in Canada outside Quebec (dummy variable),
residence outside Quebec 1 or 5 years earlier (dummy variable), home language (English, French, non‐official), and location of work in
Montreal (South, West, North, Other)

44
Coefficient t‐value Coefficient t‐value
engwork ‐0,0087 ‐0.45 ‐0,0214 ‐1.14
offwork 1,3998 9.77 0,9396 6.81
age 0,0689 24.83 0,0619 23.52
age squared ‐0,000747 ‐22.45 ‐0,000657 ‐20.86
married 0,0692 8.53 0,0589 7.69
woman ‐0,2102 ‐29.32 ‐0,1903 ‐25.64
Immigrant ‐0,4675 ‐33.15 ‐0,4173 ‐31.12
years since migration 0,0224 19.48 0,0198 18.31
years since mig. squared ‐0,000214 ‐8.80 ‐0,000194 ‐8.49
nonwhite ‐0,1260 ‐14.75 ‐0,1097 ‐13.52
Schooling (ref: high school certificate)
None ‐0,1043 ‐7.57 ‐0,0708 ‐5.40
Non university diploma 0,1365 12.91 0,0935 9.20
Univ dipl below bacc 0,3073 20.06 0,2072 14.22
University bacc 0,4469 38.64 0,2984 25.98
University MA or PhD 0,6656 40.30 0,4667 27.64
Industry (ref: manufacturing)
Agriculture, mines, utility 0,0861 1.93
Construction ‐0,1316 ‐4.71
Wholesale trade ‐0,0169 ‐1.15
Retail trade ‐0,2953 ‐19.53
Transportation ‐0,0198 ‐1.14
Information and cultural 0,0972 4.67
Finance and insurance 0,0844 5.04
Real estate, rental ‐0,0919 ‐2.89
Professional services 0,0169 1.13
Management and admin ‐0,1950 ‐10.76
Education ‐0,0650 ‐3.42
Health ‐0,2248 ‐13.26
Arts and accomodation ‐0,3604 ‐19.68
Other services ‐0,2819 ‐14.99
Public administration 0,0960 5.18
Occupation (ref: primary and manuf)
Management 0,3920 22.78
Business 0,1444 9.93
Science 0,3668 22.17
Health 0,4684 19.38
Social science, education 0,2028 9.73
Recreation, arts 0,0484 1.56
Sales and services 0,0983 6.38
Trades and transport 0,1227 8.00
Constant 3,6437 24.41 4,1689 28.96
R‐squared 0.2168 0.3073
Sample size 37165 37165
Table A6. IV earnings regressions with full set of instruments, Other Mother
Tongues, Montreal Metropolitan Area, 2006 Census
First stage regressions for engwork and offwork are in Table A2. The instruments are: born in Canada
outside Quebec (dummy variable), residence outside Quebec 1 or 5 years earlier (dummy variable),
home language (English, French, non‐official), location of work in Montreal (South, West, North,
Other), and detailed mother tongues (31 languages as shown in Table A2).