gic calculations using pss e - w3.usa.siemens.com ·...
TRANSCRIPT

GIC Calculations Using PSS®E
Live Demonstration February 16, 2017
usa.siemens.com/digitalgrid
Unrestricted © Siemens Industry, Inc. 2017
Page 2
Unrestricted © Siemens Industry, Inc. 2017
02.16.2017 EM DG PTI
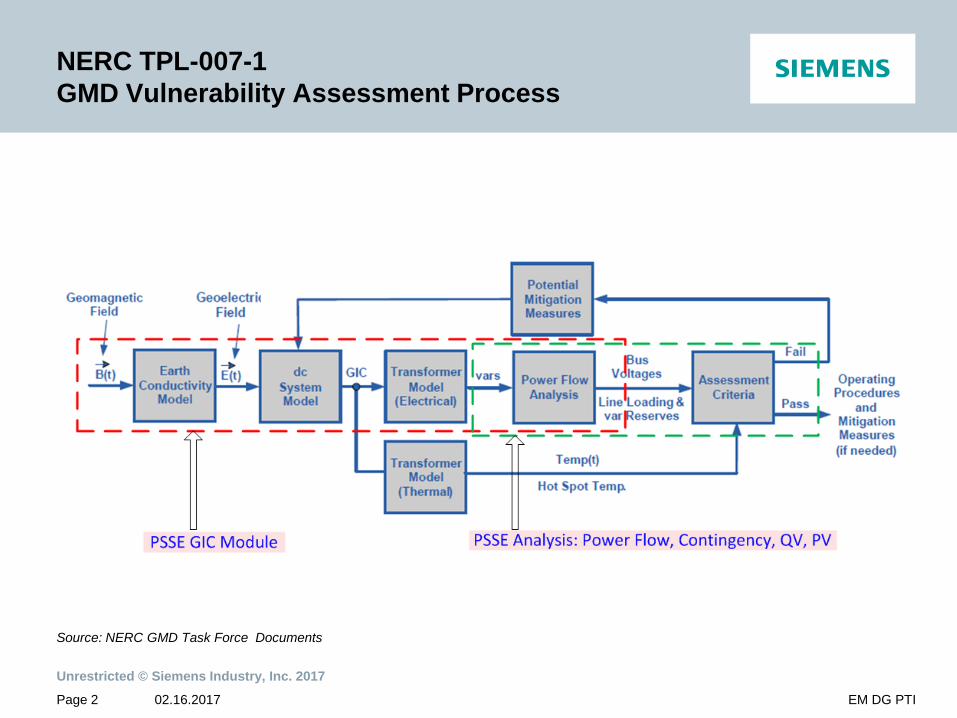
NERC TPL-007-1 GMD Vulnerability Assessment Process
Source: NERC GMD Task Force Documents

Page 3
Unrestricted © Siemens Industry, Inc. 2017
02.16.2017 EM DG PTI
How to run GIC analysis in PSS®E?

Page 4
Unrestricted © Siemens Industry, Inc. 2017
02.16.2017 EM DG PTI
PSS®E GIC analysis GUI

Page 5
Unrestricted © Siemens Industry, Inc. 2017
02.16.2017 EM DG PTI
Development of DC system model
Power flow network data reduced to just resistance network with these modifications: • Transmission lines modeled as resistor in series with induced voltage • Line reactors / charging ignored • Grounded two- and three-winding transformers modeled with their winding
resistance to ground • Grounded auto-transformers are modeled with their common and series
winding resistance • Grounded Bus shunts are modeled • Equivalent station grounding
resistance is modeled • Transformer GIC blocking devices
are modeled
Page 6
Unrestricted © Siemens Industry, Inc. 2017
02.16.2017 EM DG PTI
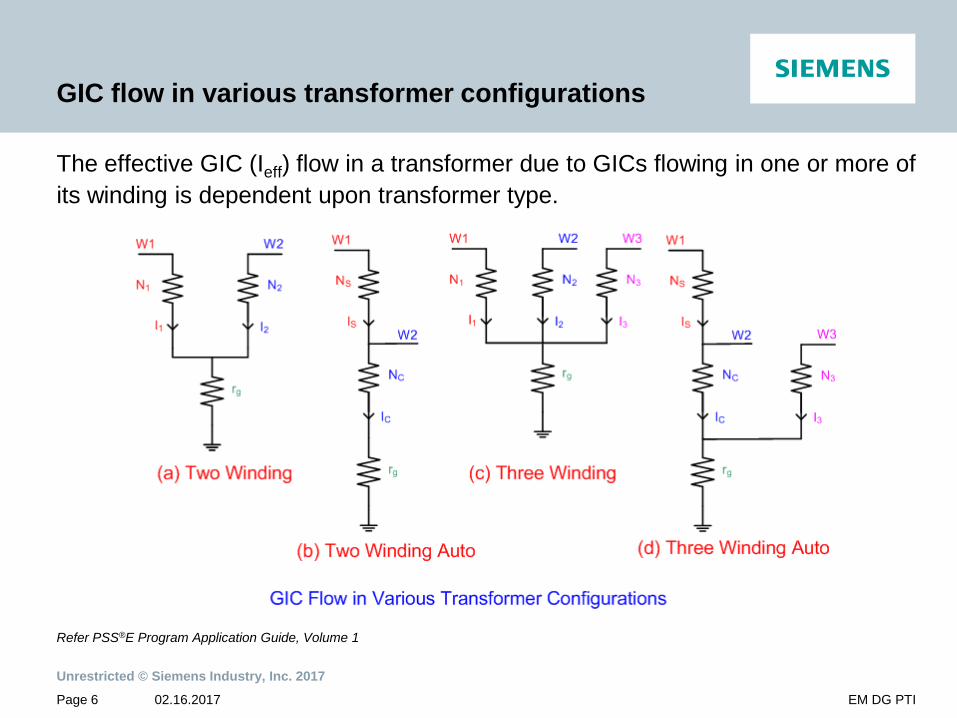
GIC flow in various transformer configurations
The effective GIC (Ieff) flow in a transformer due to GICs flowing in one or more of its winding is dependent upon transformer type.
Refer PSS®E Program Application Guide, Volume 1
Page 7
Unrestricted © Siemens Industry, Inc. 2017
02.16.2017 EM DG PTI
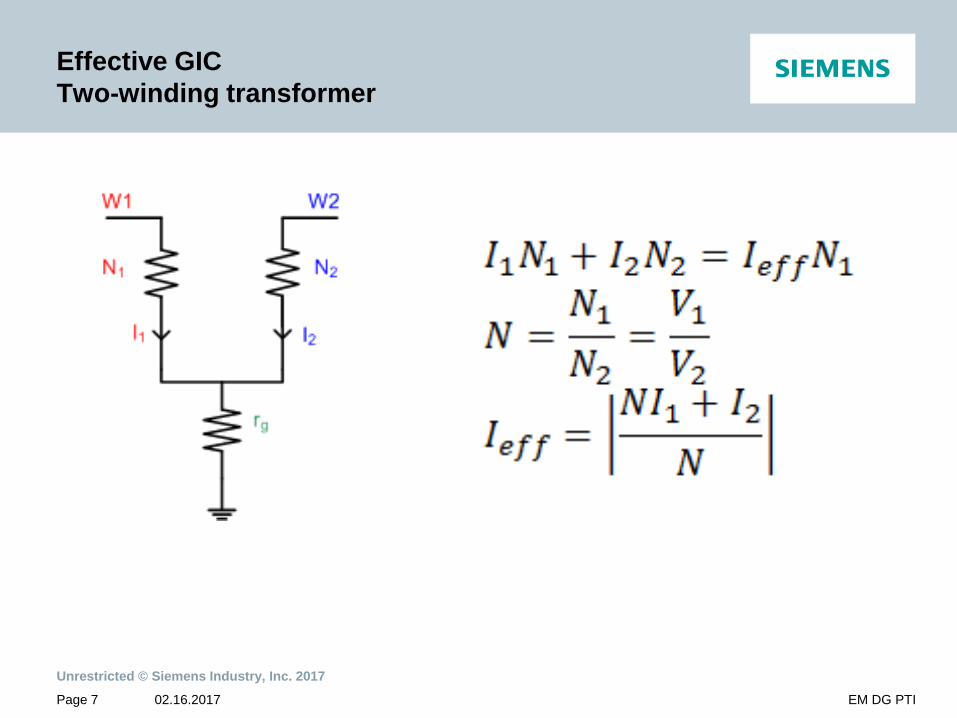
Effective GIC Two-winding transformer

Page 8
Unrestricted © Siemens Industry, Inc. 2017
02.16.2017 EM DG PTI
Effective GIC Two-winding auto transformer
Page 9
Unrestricted © Siemens Industry, Inc. 2017
02.16.2017 EM DG PTI
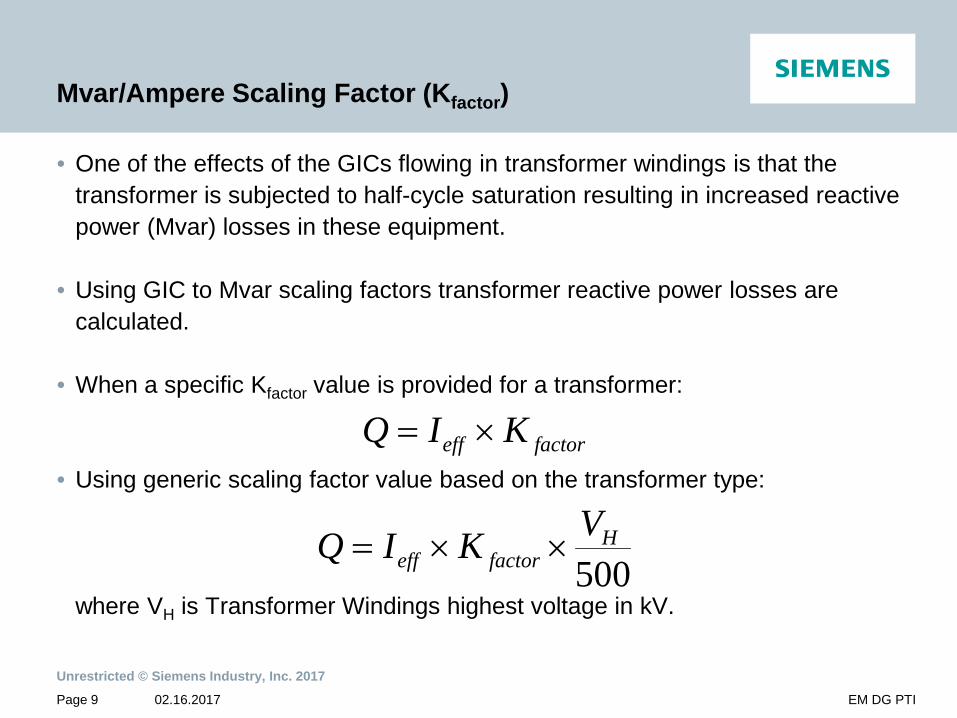
Mvar/Ampere Scaling Factor (Kfactor)
• One of the effects of the GICs flowing in transformer windings is that the transformer is subjected to half-cycle saturation resulting in increased reactive power (Mvar) losses in these equipment.
• Using GIC to Mvar scaling factors transformer reactive power losses are calculated.
• When a specific Kfactor value is provided for a transformer:
• Using generic scaling factor value based on the transformer type: where VH is Transformer Windings highest voltage in kV.
factoreff KIQ ×=
500H
factoreffVKIQ ××=

Page 10
Unrestricted © Siemens Industry, Inc. 2017
02.16.2017 EM DG PTI
Generic Scaling Factors
(a) Kfactor determined based on transformer cores
Core Design Cores Kfactor
Three-phase, shell form -1 0.33 Single-phase (three separate cores) 1 1.18 Three-phase, 3-legged, core form 3 0.29 Three-phase, 5-legged, core form 5 0.66 Three-phase, 7-legged, core form 7 0.66 (b) Kfactor determined based on base kV of transformer windings
Windings Highest Voltage Kfactor Unknown core, <= 200 kV 0.6 Unknown core, > 200 kV and <= 400 kV 0.6 Unknown core, > 400 kV 1.1
Source: X. Dong, Y. Liu, J. G. Kappenman, “Comparative Analysis of Exciting Current Harmonics and Reactive Power Consumption from GIC Saturated Transformers”, Proceedings IEEE, 2001, pages 318-322
Page 11
Unrestricted © Siemens Industry, Inc. 2017
02.16.2017 EM DG PTI
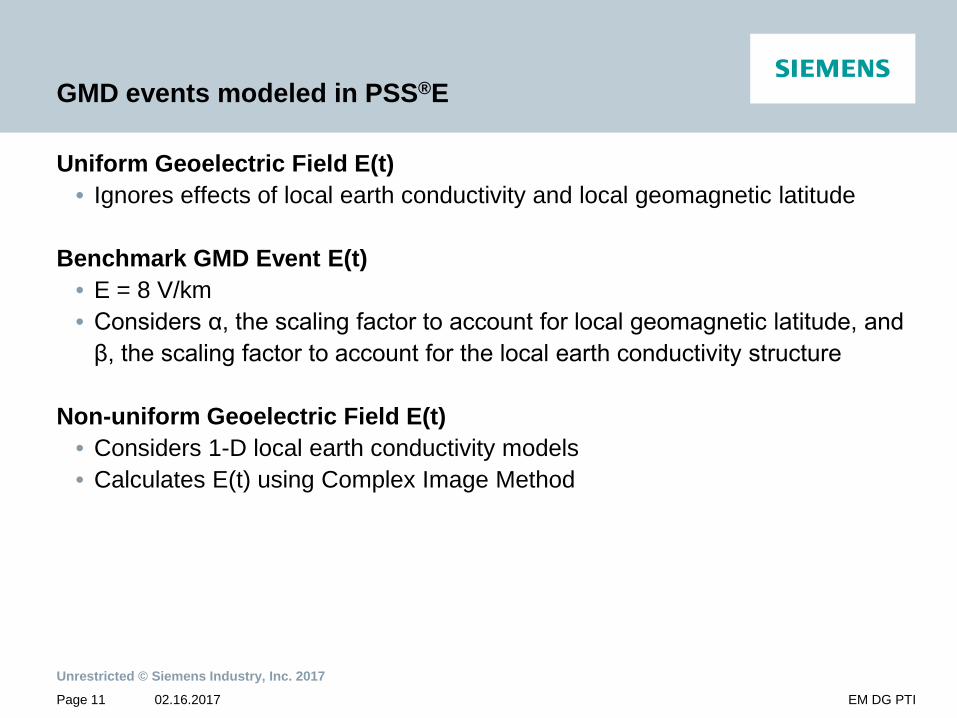
GMD events modeled in PSS®E
Uniform Geoelectric Field E(t) • Ignores effects of local earth conductivity and local geomagnetic latitude
Benchmark GMD Event E(t)
• E = 8 V/km • Considers α, the scaling factor to account for local geomagnetic latitude, and
β, the scaling factor to account for the local earth conductivity structure Non-uniform Geoelectric Field E(t)
• Considers 1-D local earth conductivity models • Calculates E(t) using Complex Image Method
GIC Data File usa.siemens.com/digitalgrid
Unrestricted © Siemens Industry, Inc. 2017

Page 13
Unrestricted © Siemens Industry, Inc. 2017
02.16.2017 EM DG PTI
GIC Data File
• The data required to run GIC analysis which does not exist in PSS®E power flow case is provided using this file.
• The accuracy of GIC calculations will depend on the data provided in this file.
• GIC data file • Text file • Default extension: .gic

Page 14
Unrestricted © Siemens Industry, Inc. 2017
02.16.2017 EM DG PTI
GIC Data File Identification and substation data

Page 15
Unrestricted © Siemens Industry, Inc. 2017
02.16.2017 EM DG PTI
GIC Data File Transformer data
Page 16
Unrestricted © Siemens Industry, Inc. 2017
02.16.2017 EM DG PTI
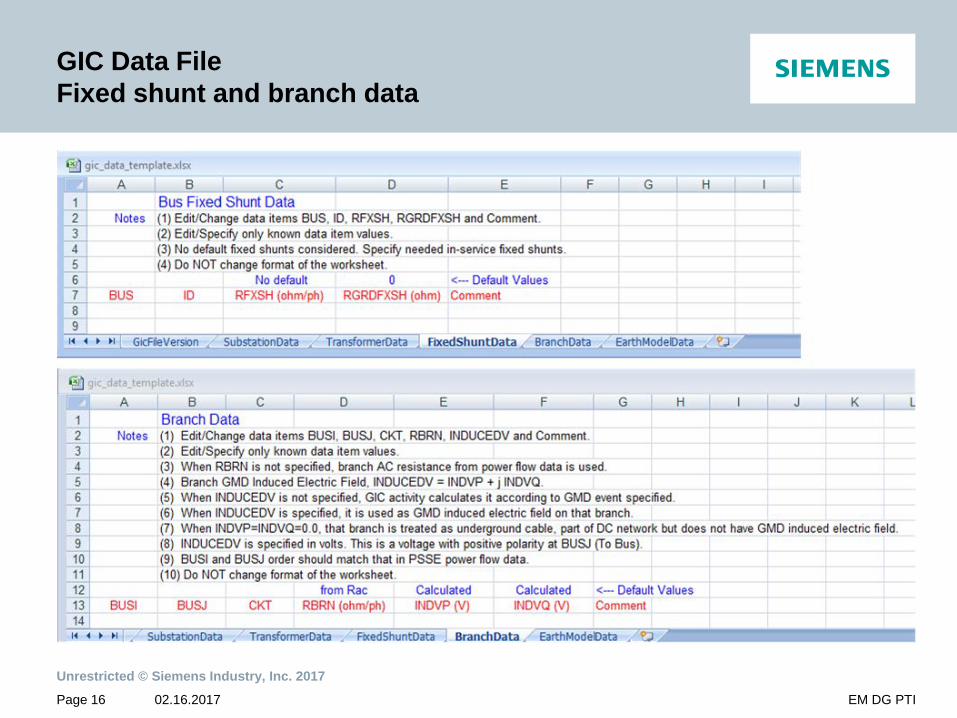
GIC Data File Fixed shunt and branch data

Page 17
Unrestricted © Siemens Industry, Inc. 2017
02.16.2017 EM DG PTI
GIC Data File User Earth model data

Page 18
Unrestricted © Siemens Industry, Inc. 2017
02.16.2017 EM DG PTI
GIC Data File – Branch Data Notes
• GMD induced electric field can be specified in branch data record in terms of INDVP and INDVQ.
• PSS®E determines branch GMD induced efield as below. 1. When INDVP and INDVQ are specified in GIC data file, the total branch GMD
induced electric field is then determined as:
Induced Efield = INDVP + j INDVQ volts 2. When INDVP and INDVQ are not specified (blank) in GIC data file, branch induced
efields are calculated as per selected GMD event and branch geographical location.
3. When INDVP=0 and INDVQ=0 are specified in GIC data file, the branch is treated as underground cable. It is part of dc network, GICs can flow in this branch, but does not have induced efields.
For uniform and benchmark GMD events, Induced efield is real value, but for non-uniform field modeling this will be complex value.
Induced electric field will have positive polarity at branch “To Bus” (J bus).

Page 19
Unrestricted © Siemens Industry, Inc. 2017
02.16.2017 EM DG PTI
GIC Data File User Earth model notes
• TPL-007-1 defined Earth Conductivity Models for US and Canada are modeled as standard earth models (just use its name in GIC data file).
• If any other Earth Model is required, use this data record to define such an earth model.
• A total of up to 50 user earth models are allowed. • Each earth model may have up to 25 layers. • Use as many records needed to specify the data. • The thickness of the last layer is infinity.
• This is specified as any value less than 0.0 (= -999.0 for example). • The thickness value less than 0.0 is also used as end of earth model data.

Page 20
Unrestricted © Siemens Industry, Inc. 2017
02.16.2017 EM DG PTI
GIC Data File Example Create from Python™ Script
(A) Generate GIC data Microsoft® Excel template import psse34 import psspy, gicdata psspy.psseinit() savfile="nerc_gic_app_guide_exam_v33.sav" excelfile="template_2.xlsx" excelfile=gicdata.template_excel(savfile,excelfile, showexcel=True)
(B) Edit template as required (C) Create GIC data file from template import psse34 import gicdata excelfile="template_2.xlsx" gicfile="template_2.gic" gicdata.excel2gicfile(excelfile, gicfile)

GIC Analysis usa.siemens.com/digitalgrid
Unrestricted © Siemens Industry, Inc. 2017

Page 22
Unrestricted © Siemens Industry, Inc. 2017
02.16.2017 EM DG PTI
PSS®E GIC Calculations
PSS®E GIC Module
GICs,
Transformer Q Losses
PSS®E Power Flow Network
PSS®E GIC Data
PSS®E Power Flow Network with GIC
Losses
GMD Storm Scenario
AC Power flow studies Contingency analysis PV/QV analysis Dynamic analysis

Page 23
Unrestricted © Siemens Industry, Inc. 2017
02.16.2017 EM DG PTI
Run GIC Analysis from PSS®E GUI
Page 24
Unrestricted © Siemens Industry, Inc. 2017
02.16.2017 EM DG PTI
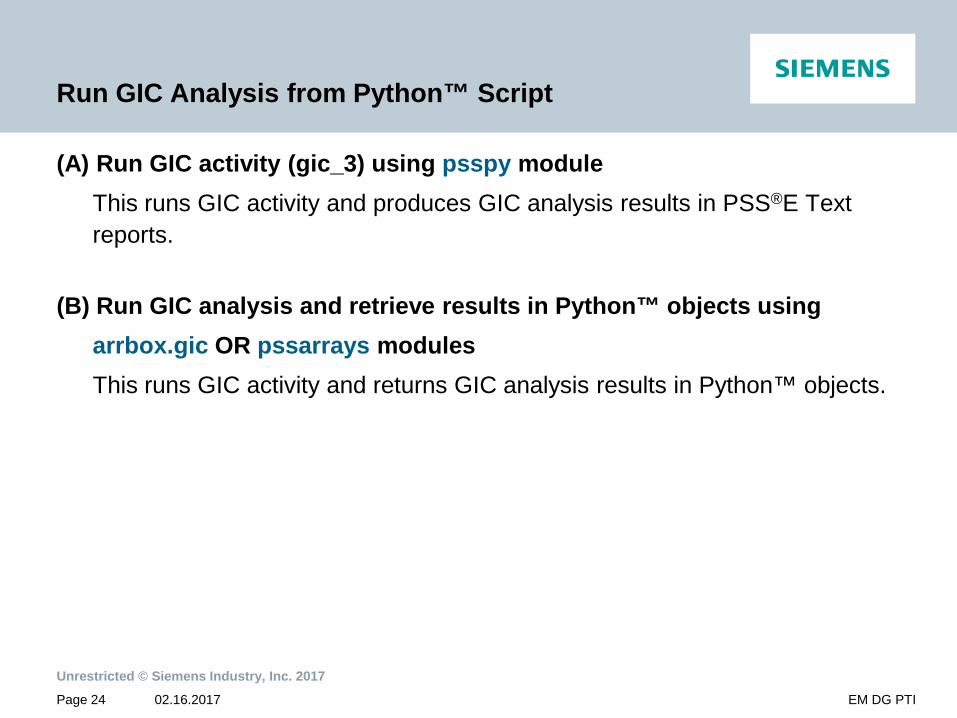
Run GIC Analysis from Python™ Script
(A) Run GIC activity (gic_3) using psspy module This runs GIC activity and produces GIC analysis results in PSS®E Text
reports.
(B) Run GIC analysis and retrieve results in Python™ objects using arrbox.gic OR pssarrays modules This runs GIC activity and returns GIC analysis results in Python™ objects.

Page 25
Unrestricted © Siemens Industry, Inc. 2017
02.16.2017 EM DG PTI
arrbox.gic.GIC OR pssarrays.GIC objects
This provides pythonic interface to GIC activity and also retrieves results into Python™ objects. import arrbox.gic gicobj = arrbox.gic.GIC(savfile, gicfile, efield_mag, efield_deg, tielevels=0, study_year=0, thermal_ana_optn=0, substation_r=0.1, branch_xbyr=30.0, transformer_xbyr=30.0, efield_mag_local=0.0, efield_deg_local=0.0, efield_type='uniform', efield_unit='v/km', addfile_optn='rdch', gic2mvar_optn='kfactors', earth_model_name='', scan_storm_event='', power_flow_optn='', ejet_million_amps=0.0, ejet_halfwidth_km=0.0, ejet_period_min=0.0, ejet_height_km=0.0, ejet_center_deg=0.0, addfile='', purgfile='', rnwkfile='', pygicfile='nooutput', basekv=[], areas=[], buses=[], owners=[], zones=[], basekv_local=[], areas_local=[], buses_local=[], owners_local=[], zones_local=[], pf_itmxn=_i, pf_toln=_f, pf_tap=_i, pf_area=_i, pf_phshft=_i, pf_dctap=_i, pf_swsh=_i, pf_flat=_i, pf_varlmt=_i, pf_nondiv=_i) OR import pssarrays gicobj = pssarrays.GIC(savfile, ...)

Page 26
Unrestricted © Siemens Industry, Inc. 2017
02.16.2017 EM DG PTI
Example IEEE GIC Test Case Network
R. Horton, et.al., “A Test Case for the Calculation of Geomagnetically Induced Currents”, IEEE Transactions on Power Delivery, Vol. 27, No. 4, October 2012, pages 2368-2373
Page 27
Unrestricted © Siemens Industry, Inc. 2017
02.16.2017 EM DG PTI
IEEE GIC Test Case Calculations with Activity GIC
Refer files in folder ..\PTI\PSSExx\EXAMPLE ieee_gic_test_case.sav ieee_gic_test_case.gic ieee_gic_test_case.sld
Page 28
Unrestricted © Siemens Industry, Inc. 2017
02.16.2017 EM DG PTI
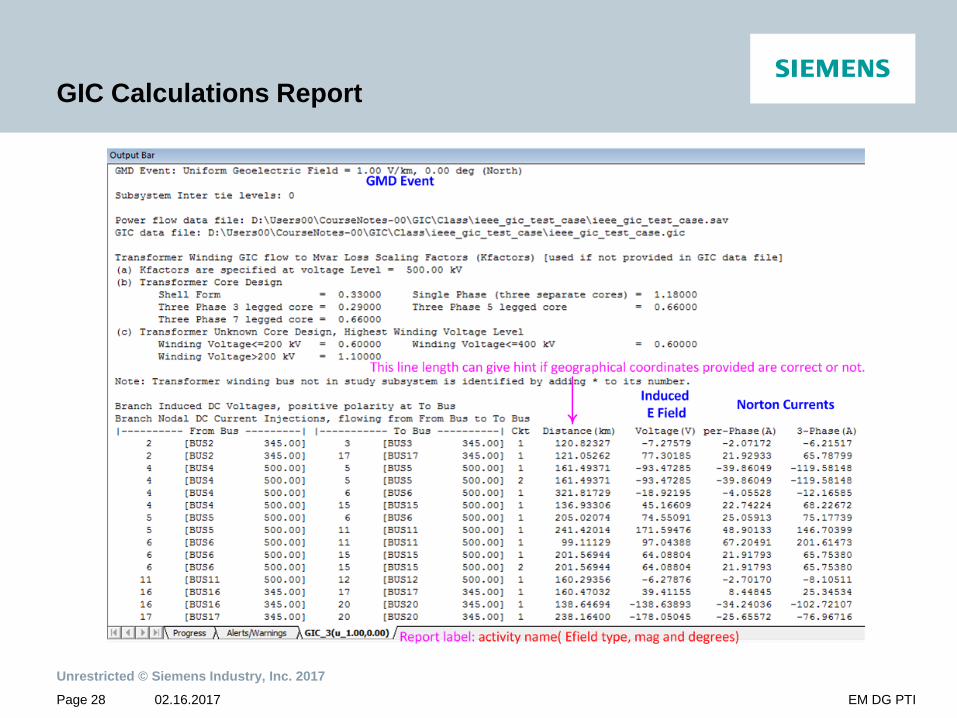
GIC Calculations Report

Page 29
Unrestricted © Siemens Industry, Inc. 2017
02.16.2017 EM DG PTI
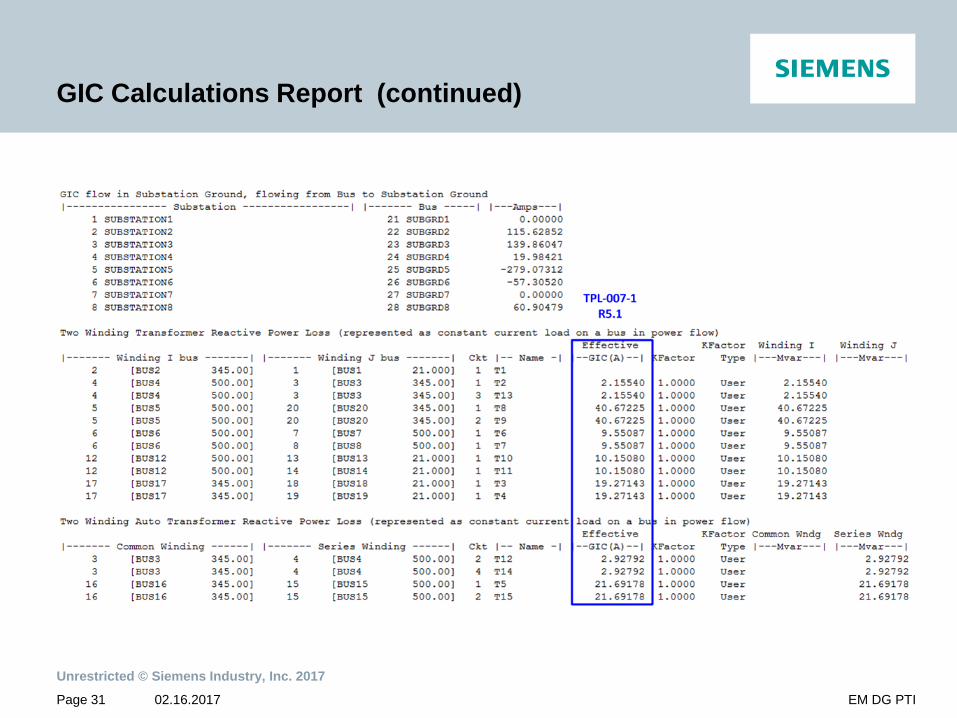
GIC Calculations Report (continued)

Page 30
Unrestricted © Siemens Industry, Inc. 2017
02.16.2017 EM DG PTI
GIC Calculations Report (continued)
Page 31
Unrestricted © Siemens Industry, Inc. 2017
02.16.2017 EM DG PTI
GIC Calculations Report (continued)

Page 32
Unrestricted © Siemens Industry, Inc. 2017
02.16.2017 EM DG PTI
GIC Calculations Report (continued)

Page 33
Unrestricted © Siemens Industry, Inc. 2017
02.16.2017 EM DG PTI
GIC Results on Network Maps
• Python Module arrbox.gicmaps.GICMAPS OR pssarrays.GICMAPS
• Use “arrbox.gicmaps” python module to display GIC calculation results on
network map.
• ‘pygicfile’ file produced by activity GIC or arrbox.gic.GIC used as input to ‘GICMAPS’.
• Need open source python modules: numpy, matplotlib, basemap
• Get details as >>> import arrbox.gicmaps >>> help(arrbox.gicmaps)

Page 34
Unrestricted © Siemens Industry, Inc. 2017
02.16.2017 EM DG PTI
GIC Results on Network Maps (continued)

Page 35
Unrestricted © Siemens Industry, Inc. 2017
02.16.2017 EM DG PTI
GIC Results on Network Maps (continued)

Page 36
Unrestricted © Siemens Industry, Inc. 2017
02.16.2017 EM DG PTI
GIC Results on Network Maps (continued)
Page 37
Unrestricted © Siemens Industry, Inc. 2017
02.16.2017 EM DG PTI
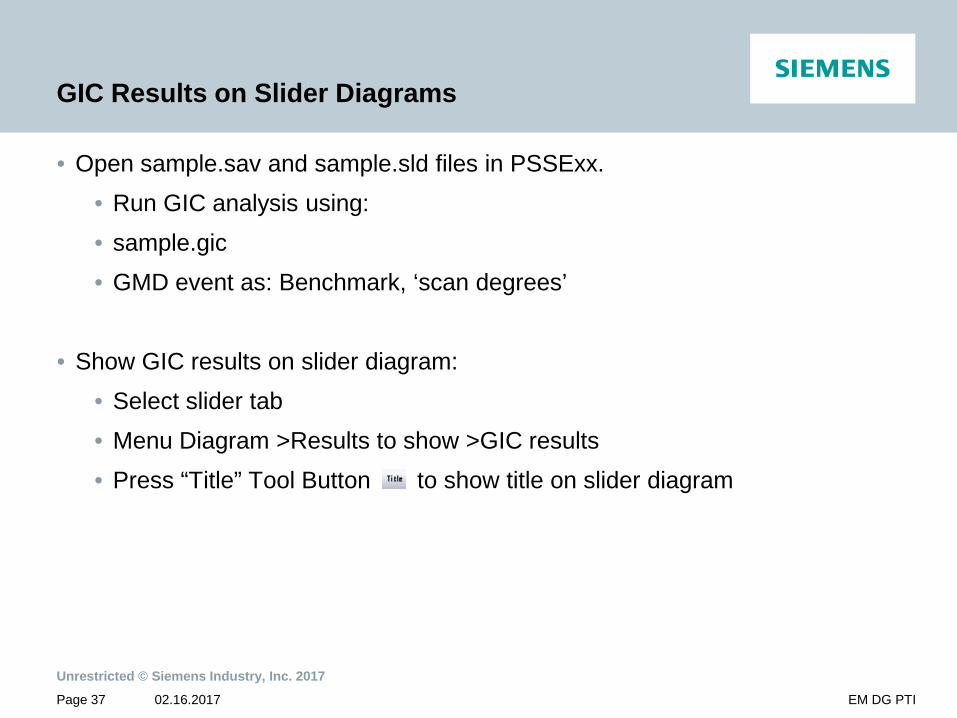
GIC Results on Slider Diagrams
• Open sample.sav and sample.sld files in PSSExx. • Run GIC analysis using: • sample.gic • GMD event as: Benchmark, ‘scan degrees’
• Show GIC results on slider diagram:
• Select slider tab • Menu Diagram >Results to show >GIC results • Press “Title” Tool Button to show title on slider diagram

Page 38
Unrestricted © Siemens Industry, Inc. 2017
02.16.2017 EM DG PTI
GIC Results on Slider Diagrams (continued)

Page 39
Unrestricted © Siemens Industry, Inc. 2017
02.16.2017 EM DG PTI
scan_d_m option scan results

Conclusion usa.siemens.com/digitalgrid
Unrestricted © Siemens Industry, Inc. 2017
Page 41
Unrestricted © Siemens Industry, Inc. 2017
02.16.2017 EM DG PTI
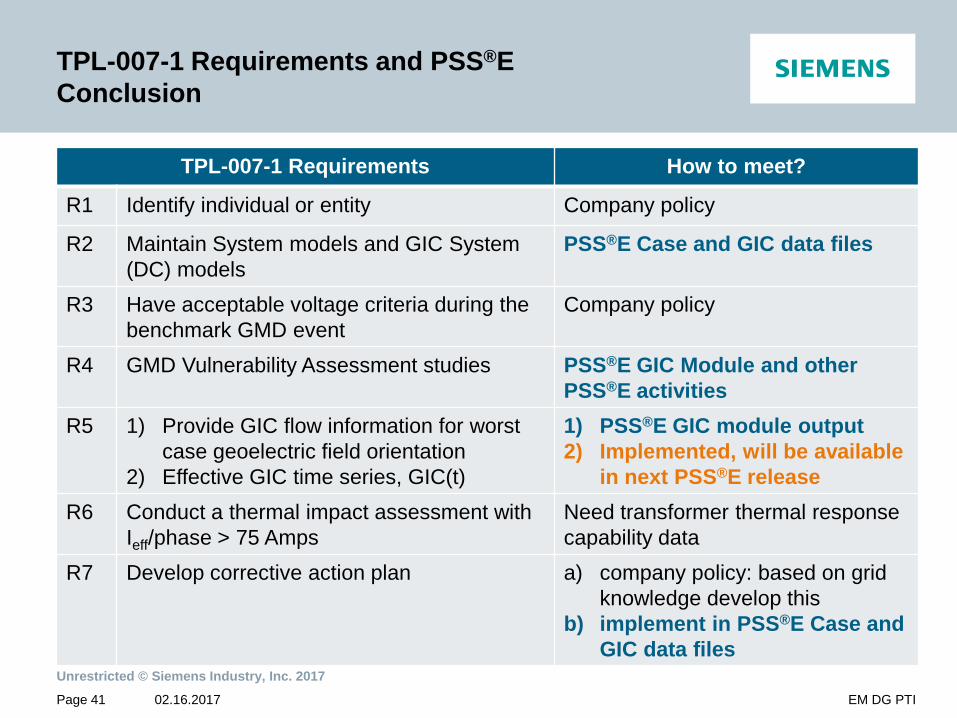
TPL-007-1 Requirements and PSS®E Conclusion
TPL-007-1 Requirements How to meet?
R1 Identify individual or entity Company policy
R2 Maintain System models and GIC System (DC) models
PSS®E Case and GIC data files
R3 Have acceptable voltage criteria during the benchmark GMD event
Company policy
R4 GMD Vulnerability Assessment studies PSS®E GIC Module and other PSS®E activities
R5 1) Provide GIC flow information for worst case geoelectric field orientation
2) Effective GIC time series, GIC(t)
1) PSS®E GIC module output 2) Implemented, will be available
in next PSS®E release R6 Conduct a thermal impact assessment with
Ieff/phase > 75 Amps Need transformer thermal response capability data
R7 Develop corrective action plan a) company policy: based on grid knowledge develop this
b) implement in PSS®E Case and GIC data files
Page 42
Unrestricted © Siemens Industry, Inc. 2017
02.16.2017 EM DG PTI
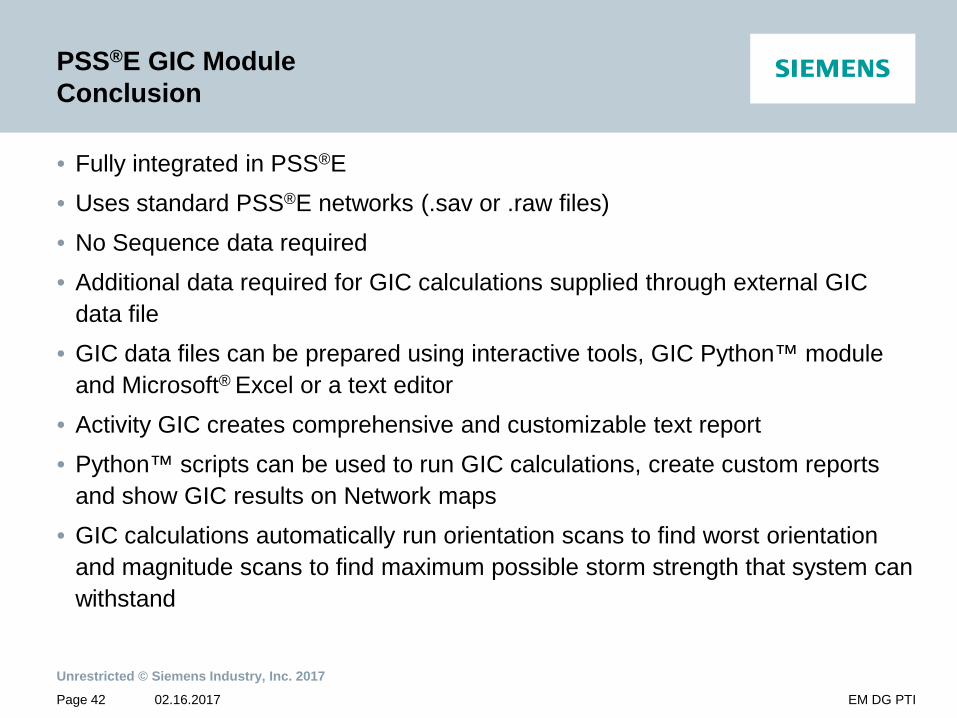
PSS®E GIC Module Conclusion
• Fully integrated in PSS®E • Uses standard PSS®E networks (.sav or .raw files) • No Sequence data required • Additional data required for GIC calculations supplied through external GIC
data file • GIC data files can be prepared using interactive tools, GIC Python™ module
and Microsoft® Excel or a text editor • Activity GIC creates comprehensive and customizable text report • Python™ scripts can be used to run GIC calculations, create custom reports
and show GIC results on Network maps • GIC calculations automatically run orientation scans to find worst orientation
and magnitude scans to find maximum possible storm strength that system can withstand

Page 43
Unrestricted © Siemens Industry, Inc. 2017
02.16.2017 EM DG PTI
Contact
Krishnat Patil Senior Staff Software Engineer Siemens PTI
Phone: +1 518 395 5081
E-mail: [email protected]
Jyothirmai Chittyreddy Staff Consultant Siemens PTI
Phone: +1 972 621 5699
E-mail: [email protected]
usa.siemens.com/digitalgrid