giardia sis
DESCRIPTION
Giardia lambliaTRANSCRIPT

1
Chapter 1.
Evaluation of a Monoclonal-based Enzyme Immunoassay (EIA)for the Detection of Giardia lamblia in Human Stool

2
ABSTRACT
Giardiasis is the most frequently identified parasitic infection in the U.S.. The disease is
caused by a protozoan parasite known as Giardia lamblia. Symptoms consist of diarrhea,
flatulence, weight loss and, in severe cases, malabsorption. In this study, an enzyme
immunoassay (EIA) for the detection of Giardia lamblia in human stool was developed and its
performance characteristics were determined. This EIA, given the name “GIARDIA TEST”,
utilizes an immobilized monoclonal antibody that reacts with an unidentified cyst wall antigen.
Evaluations were performed in-house at TechLab and off-site at three clinical laboratories using
a total of 805 formalinized stool specimens. In the clinical evaluations, we compared this EIA
test to the Alexon Prospect T Giardia TEST, another commercial monoclonal-based EIA. Both
tests were compared to routine ova and parasite examination (O&P) using 535 stool specimens.
Overall correlation to O&P was 95.9% for the Alexon test and 98.5% for the GIARDIA TEST.
There were 8 discrepant results for the GIARDIA TEST and 22 for the Alexon test. All
discrepant results were resolved by microscopic examination using immunofluorescence (IFA).
In a separate in-house study, I compared the GIARDIA TEST to the Remel test. Overall
correlations to O&P were 94.4% for the Remel test and 96% for the GIARDIA TEST. The lower
limit of detection for the GIARDIA TEST was determined using Giardia cysts prepared in vivo.
My findings show that the GIARDIA TEST is a suitable aid for the diagnosis of giardiasis
because it is sensitive, highly specific and correlates well with O&P.

3
INTRODUCTION
Giardia lamblia is a protozoan parasite that causes a diarrheal disease in humans. The
clinical significance was not fully appreciated in the United States until the early 1970’s when a
large number of travelers returned from the Soviet Union with giardiasis (23). This disease now
is the most commonly diagnosed parasitic infection in the U.S. (8). High risk groups include
young children, immunocompromised patients and persons who have not had previous exposure
to the organism. Symptoms include diarrhea, abdominal cramps, bloating, flatulence, fatigue
and weight loss caused by malabsorption.
The life cycle of Giardia consists of growth of trophozoites, encystment and excystment
(Fig.1). Infection results from the consumption of as few as 10 cysts in contaminated water or
feces (16). The cysts are resistant to the acidic barrier of the stomach and pass directly into the
duodenum where each cyst matures into two trophozoites. The trophozoites infect and colonize
the duodenum and jejunum by attaching to enterocytes of the brush border where they multiply
by binary division. The attachment to the mucosal wall occurs by way of an “adhesive disc”
which is found only on the trophozoite. The trophozoites subsequently detach as they begin to
encyst and pass into the large intestine where they develop into mature four-nucleated cysts with
a protective cyst wall. The highly infective cysts are excreted in the feces (8).

4
Figure 1. Giardia Life Cycle
Giardiasis is the most common waterborne illness in the United States. In a study
reported in 1983, this parasite caused 68% of outbreaks of waterborne illness in which the
infectious agent was identified (5). Outbreaks occur when public water supplies become
contaminated by runoff water containing feces from infected animals. The first suspected
outbreak of waterborne giardiasis in the United States occurred in Aspen, Colorado during the
winter of 1965-66. Sewage-contaminated well water was the source of the organism. The first
direct evidence that Giardia was a cause of waterborne illness came in 1975 in Rome, New
York when the Centers of Disease Control identified Giardia cysts in the city water supply.
Animals were identified as a source of infection after an outbreak during the spring of 1976 in
Camas, Washington involving a filtered water supply. Upon investigation, Giardia cysts were
identified in the feces of beaver living near the city water supply intakes (5).

5
Giardia trophozoites and cysts are very different in appearance. Trophozoites are tear-
drop in shape and 10 to 20 µm in size (Fig. 2). Each trophozoite has eight flagella, a pair of
nuclei, a pair of axonemes, a pair of median bodies and one adhesive disc. The flagella provide
motility and are believed to cause negative pressure that allows the binding of the adhesive disc
to the epithelial cells of the small intestine. The two nuclei contain equal amounts of DNA,
together holding a diploid genome of around 12 MB (13). The function of the median bodies is
not fully understood but it is hypothesized that they may store prepolymerized material for the
construction of the adhesive disc. The paired flagella axonemes are visible in the trophozoites
and are used to anchor the flagella. The ventral adhesive disc is used for attachment to epithelial
cells of the small intestine (7). It is not clear whether this attachment is to secure nourishment or
whether it simply provides a means of avoiding removal by the host.
Figure 2. Giardia trophozoites (Electron microscope photograph, R. Thompson, Murdoch
University, Murdoch, Australia).
The mature cysts are highly infectious and differ in appearance and composition from
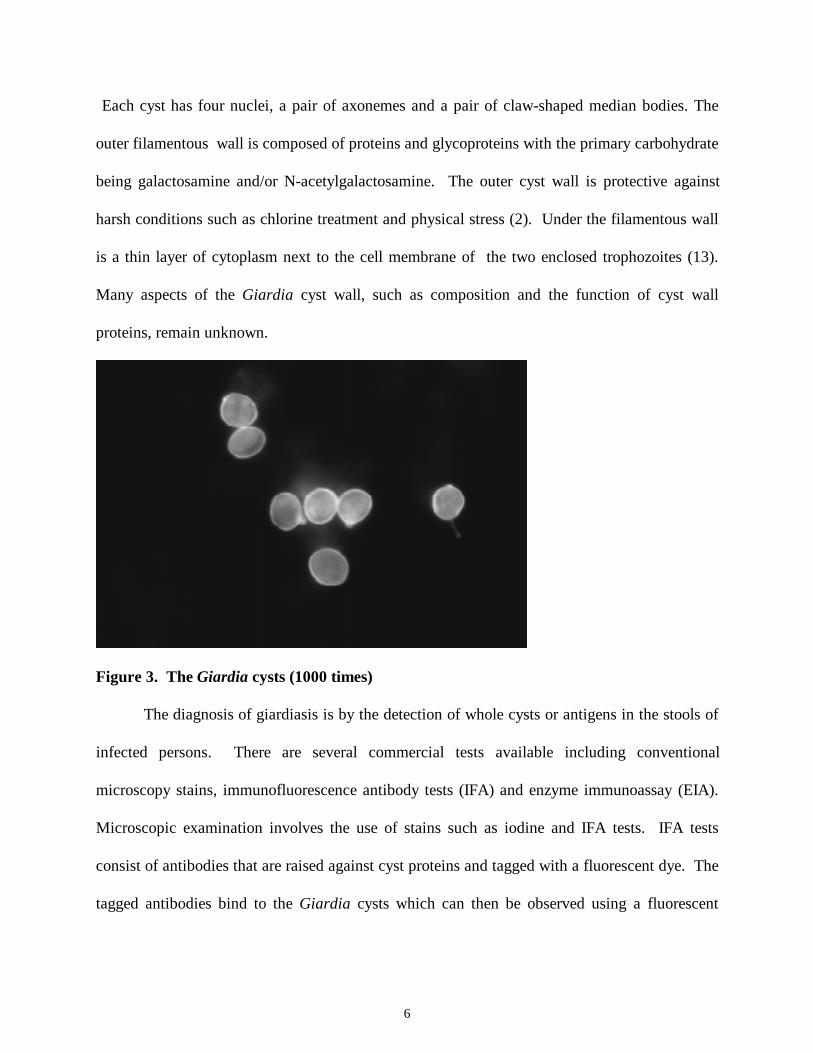
the trophozoites. Giardia cysts are oval to round in shape and 10 to 15 µm in size (Fig. 3).
6
Each cyst has four nuclei, a pair of axonemes and a pair of claw-shaped median bodies. The
outer filamentous wall is composed of proteins and glycoproteins with the primary carbohydrate
being galactosamine and/or N-acetylgalactosamine. The outer cyst wall is protective against
harsh conditions such as chlorine treatment and physical stress (2). Under the filamentous wall
is a thin layer of cytoplasm next to the cell membrane of the two enclosed trophozoites (13).
Many aspects of the Giardia cyst wall, such as composition and the function of cyst wall
proteins, remain unknown.
Figure 3. The Giardia cysts (1000 times)
The diagnosis of giardiasis is by the detection of whole cysts or antigens in the stools of
infected persons. There are several commercial tests available including conventional
microscopy stains, immunofluorescence antibody tests (IFA) and enzyme immunoassay (EIA).
Microscopic examination involves the use of stains such as iodine and IFA tests. IFA tests
consist of antibodies that are raised against cyst proteins and tagged with a fluorescent dye. The
tagged antibodies bind to the Giardia cysts which can then be observed using a fluorescent

7
microscope. IFA tests are rapid and more sensitive than conventional microscopy (3, 6).
Several IFA tests are commercially available (Table 1).
Table 1. Commercially available tests for the detection of Giardia
Method Principle of test Advantages Limitations Source of reagentsStains: Iodine Low cost Not very sensitive Para Pak Trichrome Efficiency varies Wheatley's
among different Trichrome StainOva/Parasite laboratories (Meridian
Direct wet mount Rapid Diagnostics, Inc.)Low cost Difficult to read Iodine SolutionCan determine Low sensitivity Lugol's Concentrate motility Requires fresh stools (EMDS)
Low cost MeriFluor (MeridianUtilizes fuorescein- Rapid Requires fluorescence Diagnostics, Inc.)
Immuno- tagged Simple microscope Giardia-IF TEST andfluorescence monoclonal Sensitive Crypto/Giardia-IF TEST
antibodies Specific (TechLab, Inc.)
Uses Sample can Not as specific as ProspecT (Alexon) monoclonal and be batched Immunofluorescence Giardia EIA (REMEL) polyclonal Sensitive
EIA antibodies Detects More expensive than LMD Giardia EIA against Giardia antigens when staining and Immuno- (LMD Laboratories) antigens organism is no fluorescence Giardia TEST
longer present (TechLab, Inc.)
Flow-through Rapidmembrane Same as EIA Simple Low sensitivity ProspecT (Alexon)
Another diagnostic method is the detection of Giardia specific antigens by EIA (11, 15,
18, 20, 21). These tests consist of antibodies (monoclonal or polyclonal) immobilized on plastic
assay wells which capture the antigens. The bound antigens are then detected with antibodies in
solution that have been conjugated to an enzyme such as horseradish peroxidase. The Giardia
antigens present in the stool specimen are “sandwiched” by the capture and conjugated
antibodies. The last step is the addition of an enzyme substrate that produces a colored product
when antigens are present. The color reactions may be read visually and/or by a
spectrophotometer. EIAs are specific for Giardia antigens and have been shown to be more

8
sensitive than conventional microscopy (1, 19). Some Giardia antigens detected by
commercial EIA tests have not been identified, causing confusion about which antigens are
detected by the various tests (1, 20, 22).
In the following study, I evaluated a new monoclonal-based EIA which I developed for
the detection of Giardia lamblia in human stool. The assay was evaluated through a multicenter
study comparing performance characteristics to routine O&P and two Giardia-specific EIA
tests.

9
MATERIALS AND METHODS
Study sites and stool specimens. Four separate studies were performed in the
evaluation: (i) Study 1, performed at Sacred Heart Medical Center in Spokane, WA; (ii) Study
2, performed at Dekalb Medical Center, Atlanta, GA with additional samples being supplied
from SmithKline Laboratory, Atlanta, GA; (iii) Study 3, performed at Virus Reference
Laboratory (VRL), Antonio, TX. (iv) Study 4, performed at TechLab with stool specimens
supplied by an outside reference laboratory (Parasite Diagnostics, Snellville, GA). All
specimens included in this study were preserved in formalin and submitted for routine ova and
parasite examination.
EIA tests. The GIARDIA TEST (TechLab, Blacksburg, VA) was performed as follows.
A total of 0.1 mL of formalized stool was placed into micro-titer type wells that had been coated
with an IgM mouse monoclonal antibody (Ct7 MAb) against a Giardia cyst antigen. Wells were
incubated 10 or 60 minutes at room temperature and then washed 4 times with the kit wash
solution. One drop of rabbit polyclonal antibody raised against Giardia cysts was added to each
well and incubated for 20 minutes at room temperature. The wash step was repeated and one
drop of goat anti-rabbit polyclonal antibody conjugated to horse-radish peroxidase was added.
Wells were incubated for 5 minutes at room temperature and washed as described above. One
drop of each substrate was added to each well and wells were incubated for 5 minutes at room
temperature. One drop of stop solution was added to each well and the plate was read visually
and at 450 nm or 450 nm plus 620 nm as a reference.
The following EIA tests were performed and results were interpreted as indicated by the
manufacturer’s directions: (1) RIM Giardia Antigen Detection Microwell ELISA (Remel,

10
Lenexa, KS), (2) Alexon Prospect T Giardia Microplate Assay (Alexon, Inc., Sunnyvale,
Calif.).
Immunofluorescent antibody test (IFA). The GIARDIA IF TEST and the Merifluor
IF test (Meridian Diagnostics, Inc., Cincinnati, Ohio) were performed as described by the
manufacturer.
Preparation of Giardia cysts. G. lamblia WB ATCC 30957 trophozoites were
axenically cultured in Keister’s modified TYI-33 medium at pH 7.1 and incubated at 37°C (8).
After a confluent monolayer was formed, trophozoites were chilled on ice for 20 minutes,
pelleted by centrifugation at 800 x g and suspended in TYI-33 medium containing 10 mg bovine
bile / mL (Sigma; St. Louis, MS) at pH 7.8 to trigger encystment (10, 12). After 5 days, the
culture was harvested by centrifugation at 800 x g. The pellet was suspended in deionized water
and incubated overnight at room temperature to lyse trophozoites and pre-cysts (12, 14). Cysts
were pelleted by centrifugation as previously described and washed several times with sterile
water. Purified cysts were counted using trypan blue and stored in phosphate buffered saline
(PBS pH 7.5) containing 0.01% sodium azide as a preservative.
Ova and parasite examination of stools positive for other intestinal parasites.
Formalinized stools were submitted to Parasite Diagnostics Laboratory (Lilburn, GA) for ova
and parasite analysis, concentrated using the formalin-ethyl acetate method and stained for
microscopic examination (17, 24). Briefly, 5 mL of formalinized stool was strained through wet
gauze and diluted to 10 mL with deionized water. The suspension was centrifuged at 500 x g for
2 minutes and the supernatant was discarded. The pellet was mixed with 9 mL of PBS
containing 10% formalin. This suspension was mixed with 4 mL of ethyl-acetate and
centrifuged for 2 minutes at 500 x g. The concentrated pellet was mixed with 50 µL of PBS

11
and 50 µL of Dobel’s iodine solution for a wet mount preparation for microscopic examination
except for Cryptosporidium-positive stools which were confirmed by acid-fast staining using the
Kinyoun solution.
Determination of lower limits of detection for the GIARDIA TEST. To evaluate the
sensitivity of the GIARDIA TEST, dose response curves were generated using purified Giardia
cysts. Cysts were serially diluted in phosphate buffered saline, pH 7.4, and tested, in duplicate,
in the EIA using optimal amounts of reagents. Dilutions containing low numbers of cysts were
included to determine the lower limit of detection. An absorbance value ≥ 0.150 at 450 nm was
used as the cutoff value between a positive and negative result. The absorbance values versus
number of cysts per well were plotted on a graph.

12
RESULTS
Performance characteristics. The clinical performance was determined in 3 clinical
laboratories using stool specimens preserved in 10% formalin. Giardia-positive stools were
determined using routine O&P. GIARDIA TEST results were compared to results from the
Alexon Prospect T Giardia TEST. All EIA results that did not match O&P (discrepants) were
evaluated by IFA. Of the total 535 specimens analyzed, 96 were positive for Giardia by O&P.
Of these, 93 were positive by the GIARDIA TEST and 96 were positive by the Alexon Test. A
summary of sensitivities (Sens; how well the assay detects a positive result), specificities (Spec;
how well the assay differentiates between a positive and negative result), predictive positive
value (PPV; confidence in the positive result) and negative values (PPV; confidence in a
negative result) and the overall correlation with O&P are shown in Table 2. Table 3 and 4 show
the results from each clinical study.
The GIARDIA TEST had 8 discrepant results as compared to O&P. IFA analysis
revealed 3 false-negatives, 3 false-positives and 2 true positives. The Alexon test had 22 false-
positive results. Of these, 13 were negative following repeat testing. All three clinical sites
noted that the Alexon false-positive results were from test wells that surrounded test wells
containing strong positive-specimens. The remaining 9 were repeated and remained positives.
The assay performance of the GIARDIA TEST was compared to the Remel test by an in-
house study at TechLab (Blacksburg, VA). Of 270 specimens, 120 were positive for Giardia
by O&P using the conventional iodine staining procedure. Of these, 108 were positive by the
GIARDIA TEST and 110 were positive by the Remel test. Of the 12 discrepant stools, 10 that
were negative in the GIARDIA TEST and O&P positive were also negative by the Remel test.

13
All 10 of these stools were negative by IFA. The remaining 2 false-negatives had < 1 cyst per
high field. There were 150 specimens were negative by O&P. All of these also were negative by
the GIARDIA TEST and 146 were negative by the Remel test. The 4 stools that were positive in
the Remel test and negative by O&P were also negative by the GIARDIA TEST. Sensitivities
and specificities for both EIA tests as compared with O&P are shown in Table 5.
The GIARDIA TEST had a minimum detection limit of about 10 to 15 cysts per well
(Fig. 4). Positive wells were yellow and had absorbance values of ≥ 0.150. The wells with
lower dilutions of Giardia cysts were clear and had absorbance values ≤ 0.100 and a average
standard deviation of ≤ 0.100 absorbance. The GIARDIA TEST did not show reactions with
multiple stool specimens positive for a variety of intestinal parasites and enteric pathogens
(Table 6).
To test reliability of the GIARDIA TEST, the inter-assay performance was evaluated.
This statistical analysis shows reproducibility of test results over time. Results are expressed as
the average percent difference of each absorbance value from the mean absorbance value. This
analysis is referred to as the percent coefficient of variation (% CV). To examine inter-assay
performance, eight positive and eight negative fecal specimens were assayed three times over a
three day period (Table 7). The % CV of positive specimens ranged from 3.6 to 16.5, with an
average of 11.2. The % CV of negative specimens ranged from 3.2 to 10.8, with an average of
6.9. Results are within the same range as other commercial EIA tests (Remel) which have % CV
values below 20 %.
Assay reproducibility of the GIARDIA TEST was evaluated by the determination of
intra-assay variation. The intra-assay coefficient of variation was determined by analyzing two
positive and two negative specimens. Each specimen was assayed in quadruplicate over a three-

14
day period (Table 8). The positive specimens had an average % CV of 5.3 with a range of 2.4
to 12.3. The negative specimens had an average % CV of 10.9 with a range of 7.2 to 15.1. As
with the intra-assay results, these percent values are within the same range as other commercial
EIA tests (≤ 20 % CV).

15
TABLE 2. A summary of three independent clinical studies comparing the GIARDIA TEST
and Alexon Test to ova and parasite examination (O&P). Both EIA tests were performed as
instructed by the manufacturer. O&P was done using in-house methods implemented at each
study site.
GIARDIATEST
positive negative Alexon Test positive negative
positive 93 5 positive 96 22negative 3 434 negative 0 417
Sensitivity 95.8% Sensitivity 100%Specificity 98.9% Specificity 94.9%
PPV 96% PPV 81.4%PNV 99.3% PNV 100.0%Corr. 98.5% Corr. 95.9%
Number 535 Number 535

16
TABLE 3. A summary of each clinical study comparing the GIARDIA TEST with O&P.
Discrepant results were resolved using immunofluorescence.
GIARDIA Study 1 Study 2 Study 3TEST Sacred Heart Med. Dekalb Med. Ctr. Virus Reference Lab.
Ctr., Spokane, WA Decatur, GA San Antonio, TXTest Total stools = 114 Total stools = 221 Total stools = 200Results Total pos. = 31 Total pos. = 46 Total pos. = 16
Total neg. = 79 Total neg. = 175 Total neg. = 180Total discrep. = 4 Total discrep. = 0 Total discrep. = 4
Sens 91.4% 100% 100%
Spec 100% 100% 97.8%
PPV 100% 100% 80%
PNV 96.3% 100% 100%
Corr 97.4% 100% 98%

17
TABLE 4. A summary of each clinical study comparing the Alexon test with O&P. Discrepant
results were resolved using immunofluorescence.
Alexon Study 1 Study 2 Study 3Test Sacred Heart Med. Dekalb Med. Ctr. Virus Reference Lab.
Ctr., Spokane, WA Decatur, GA San Antonio, TXTest Total stools = 114 Total stools = 221 Total stools = 200Results Total pos. = 34 Total pos. = 46 Total pos. = 16
Total neg. = 75 Total neg. = 165 Total neg. = 177Total discrep. = 5 Total discrep. = 10 Total discrep. = 7
Sens 100% 100% 100%
Spec 94.9% 94.3% 96.2%
PPV 89.7% 82.1% 69.5%
PNV 100% 100% 100%
Corr 96.5% 95.5% 96.5%
18
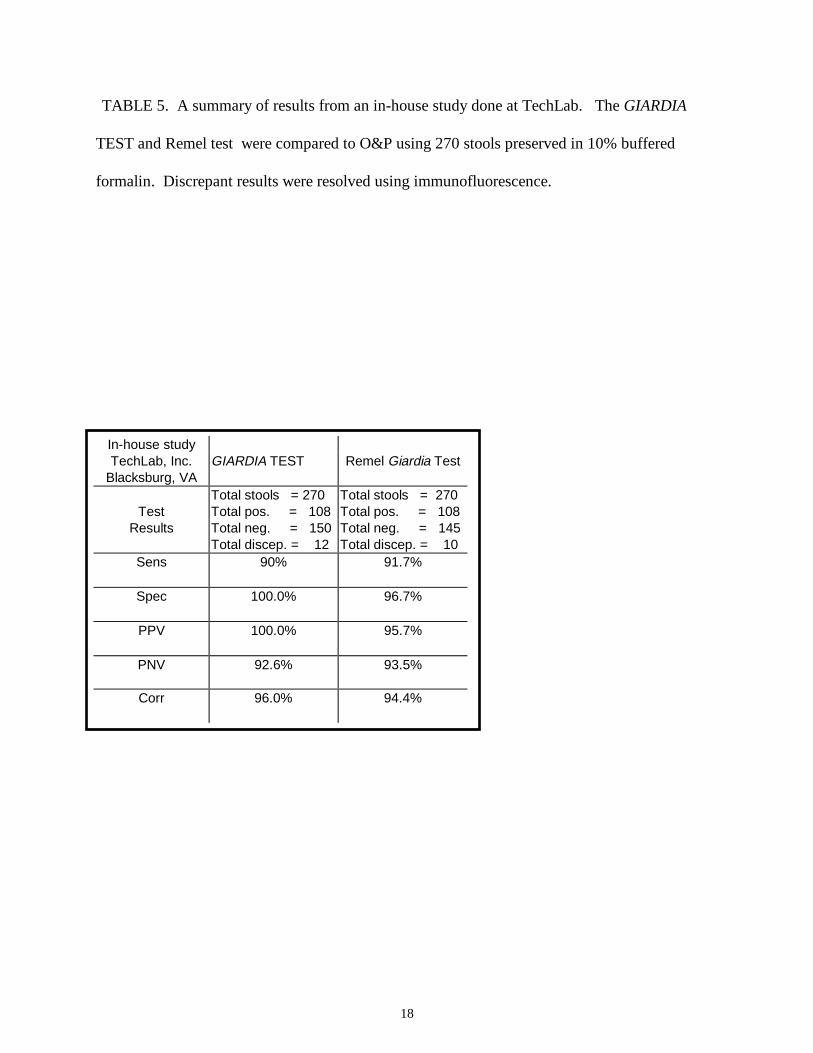
TABLE 5. A summary of results from an in-house study done at TechLab. The GIARDIA
TEST and Remel test were compared to O&P using 270 stools preserved in 10% buffered
formalin. Discrepant results were resolved using immunofluorescence.
In-house studyTechLab, Inc. GIARDIA TEST Remel Giardia Test
Blacksburg, VATotal stools = 270 Total stools = 270
Test Total pos. = 108 Total pos. = 108Results Total neg. = 150 Total neg. = 145
Total discep. = 12 Total discep. = 10Sens 90% 91.7%
Spec 100.0% 96.7%
PPV 100.0% 95.7%
PNV 92.6% 93.5%
Corr 96.0% 94.4%

19
TABLE 6. Microorganisms that do not react in the GIARDIA TEST. The specificity was
determined by analyzing stool specimens that were positive for a variety of intestinal parasites
and enteric pathogens as determined by conventional microscopy and EIA. The numbers in
parenthesis indicate the number of specimens tested. All absorbance values were ≤ 0.100.
Blastocystis hominis (2) Clonorchis (1)Cryptosporidium (8) Cyclospora (1)Dientamoeba fragilis (3) Diphyllobothrium latum (2)Endolimax nana (13) Entamoeba coli (8)Entamoeba hartmanni (3) Enterobius (1)Hookworm (1) Hymenolepis nana (3)Iodamoeba butchlii (2) Microsporidium (1)Rotavirus (15) Strongyloides stercoralis (2)Taenia species (2)

20
Dose Response with Giardia cysts
0
0.25
0.5
0.75
1
1.25
1.5
1.75
0.15 1.5 15 150 1500
# Cysts per w ell
Abs
orba
nce
at 4
50 n
m
Series1
Series2
FIGURE 4. Dose response curves were generated using the GIARDIA TEST and purified
cultured Giardia cysts. Cyst were serially diluted and 0.1 mL was added to each test well.
Absorbance values ≥ 0.150 were considered positive results as determined by correlation of
positive results to disease. The assay was repeated using test kits from 2 separate lots (series 1
& series 2).

21
TABLE 7. Inter-assay testing using the GIARDIA TEST. To examine inter-assay
performance, eight positive and eight negative fecal specimens were assayed a total of three
times over a three day period. The percent coefficient of variation (% CV) is defined as the
average percent difference of each absorbance value from the mean absorbance value.
StandardSample Day 1 Day 2 Day 3 Average deviation % CV
Positive # 1 1.099 1.108 1.036 1.081 0.039 3.63Positive # 2 1.330 1.104 1.396 1.277 0.153 11.99Positive # 3 1.377 1.110 1.533 1.340 0.214 15.96Positive # 4 1.771 1.515 1.595 1.627 0.131 8.05Positive # 5 1.443 1.337 1.567 1.449 0.115 7.95Positive # 6 1.250 0.931 0.973 1.051 0.173 16.48Positive # 7 1.295 0.995 1.106 1.132 0.152 13.40Positive # 8 1.522 1.234 1.568 1.441 0.181 12.56
Negative # 1 0.079 0.064 0.069 0.071 0.008 10.81Negative # 2 0.070 0.061 0.06 0.064 0.006 8.65Negative # 3 0.053 0.061 0.050 0.055 0.006 10.42Negative # 4 0.050 0.048 0.047 0.048 0.002 3.16Negative # 5 0.056 0.052 0.054 0.054 0.002 3.86Negative # 6 0.049 0.052 0.047 0.049 0.003 5.10Negative # 7 0.052 0.057 0.045 0.051 0.006 11.76Negative # 8 0.059 0.063 0.048 0.057 0.008 13.63

22
TABLE 8. Intra-assay testing using the GIARDIA TEST. The intra-assay coefficient of
variation was determined by analyzing two positive and two negative specimens. Each
specimen was assayed in quadruplicate over a three-day period.
StandardSpecimen Day result 1 result 2 result 3 result 4 Average deviation % CV
Sample 1 2.185 2.089 2.114 2.194 2.145 0.051 2.39# 1 2 1.874 1.934 1.592 1.802 1.801 0.149 8.28(positive) 3 1.622 1.735 1.711 1.72 1.697 0.051 3.00
Sample 1 1.592 1.562 1.492 1.552 1.550 0.042 2.70# 2 2 1.557 1.565 1.465 1.574 1.540 0.051 3.28(positive) 3 1.461 1.456 1.146 1.219 1.321 0.162 12.28
Sample 1 0.057 0.057 0.048 0.048 0.053 0.005 9.897# 3 2 0.076 0.062 0.058 0.057 0.063 0.009 13.87(negative) 3 0.065 0.058 0.055 0.049 0.057 0.007 11.72
Sample 1 0.057 0.052 0.058 0.062 0.057 0.004 7.18# 4 2 0.078 0.078 0.059 0.061 0.069 0.01 15.12(negative) 3 0.063 0.068 0.061 0.073 0.066 0.005 8.12

23
DISCUSSION
In this study, the GIARDIA TEST had a high correlation (98.5 %) to conventional
microscopy which was similar to results of the Remel test and Alexon test. The GIARDIA TEST
and the Alexon test had the highest specificity and predictive negative values. This is not
surprising since both of these EIA tests are monoclonal-based whereas the Remel test uses
polyclonal antibodies. All three EIA tests had sensitivity values of 90 to 91 %. The Alexon test
consistently showed more false-positive results for O&P negative stool samples. Other studies
of the Alexon test have noted similar results, but reported the specimens as positive, explaining
that the detected antigen in the Alexon test is a secreted antigen and may be present when cysts
are not seen. In this study, the majority of these specimens were negative by the Alexon test
following repeat testing. This indicates nonspecific reactions rather than true positive results. In
addition, these false-positives surrounded test wells containing strong positive-samples, further
suggesting that they were false-positives resulting from wash-over.
All of the EIAs have quick and easy to use formats but the GIARDIA TEST and the
Remel test can be completed with in 40 minutes whereas the Alexon test requires 2 hours. EIAs
are easier and faster than microscopy and stool specimens can be batched and tested rapidly.
The GIARDIA TEST has an added feature of a 10 to 60 minute variable incubation time for the
specimen in the well. This range for the initial incubation allows for easier batching of large
numbers of samples which is an advantage for large reference labs trying to save time and
money. Testing of large number of stool specimens by conventional microscopy is tedious and
can lead to unreliable results (6).

24
The GIARDIA TEST showed a high sensitivity for detecting cultured encysting Giardia.
The lower limits of detection of approximately 15 cysts per well (150 cysts per mL) and high
EIA sensitivity for a secreted antigen, shows the potential for detecting Giardia antigen in stool
specimens where cysts can not be seen by microscopy. Relying entirely on conventional
microscopy could lead to confusion between other illnesses such as Crohn’s disease and
ulcerative colitis and patients that don’t shed intact organisms (4).
This data supports other research that has shown EIA tests are a sensitive and specific
alternative method for diagnosing giardiasis (11, 15, 18). Recent evaluations suggest the
implementation of both microscopy and EIAs for optimizing the diagnosis of giardiasis (9). A
practical approach analyzing stools for Giardia may be the screening of stools by EIA in
addition to or prior to a O&P microscopic exam. The use of both testing methods appears
logical after considering that giardiasis is the most common parasitic infection diagnosed in the
U.S. and that the sensitivity of EIAs are much greater than microscopy-sensitivity.
In conclusion, my results show that the GIARDIA TEST is a highly specific and
sensitive EIA test that correlates well with O&P for the diagnosis of Giardia lamblia. In
addition, the test is rapid and offers a unique variable specimen incubation time for the analysis
of large numbers of samples.

25
REFERENCES
1. Addis, D. G., Mathews, H. M., Stewart, J. M., Wahquist, S. P., Williams, R. M., Finton,R. J., Spencer, H. C. and D. D. Juranek. 1991. Evaluation of a commercially availableenzyme-linked immunosorbant assay for Giardia lamblia antigen in stool. J. Clin.Microbiol. 29:1137-1142.
2. Aley, S. B., and Frances D. Gillin. 1995. Specialized surface adaptations of Giardia lamblia. Infect Agents and Disease. 4:161-166.
3. Alles, A. J., Waldron, M. A., Sierra, L.S., and A. R. Mattia. 1995. Prospective comparison of direct immunofluorescence and conventional staining methods for the detection of Giardia lamblia and Cryptosoridium spp. in human fecal specimens. J. Clin. Microbiol. 33:1632-1634.
4. Allison, M. C., E. L. Green, D. N. Bhattacharya, A. Smith, and R. E. Pounder. 1988. A microscopic and immunodiagnostic search for giardiasis in patients withgastrointestinal disorders. Scan. J. Gastroenterol. 23:209-212.
5. Craun, G. F. 1979. Waterborne outbreaks of giardiasis. In Jakubowski, W., J. Hoff (ED)., Waterborne transmission of giardiasis. U.S. Environmental Protection Agency, Washington, D.C., pp. 127-149.
6. Dixon, B. R., Monique, P., Martineau, C, and Jocelyn Fournier. 1997. A comparison of conventional microscopy and flow cytometry in the detection of Giardia lamblia in beaver fecal samples. J. Immunol. Methods. 202:27-33.
7. Feely, D. E., S. Erlandsen, and D. Chase. 1984. Structure of trophozoite and cyst. In S. Erlandsen and Ernest Meyer (ed), Giardia and Giardiasis. Plenum Press, New York and London.
8. Garcia, L. S., and D. Bruckner. 1993. Intestinal protozoa: Flagellates and ciliates. In L. Garcia and D. Bruckner (ed.), Diagnostic Medical Parasitology. American Society for Microbiology, Washington, D.C.
9. Garcia, L. S. and Robin Shimizu. 1997. Evaluation of nine immunoassay kits (Enzyme immunoassay and direct fluorescence) for detection of Giardia lamblia and Cryptosporidium in human fecal specimens. J. Clin. Microbiol. 35:1526-1529.
10. Gillin, F.D., Reiner, D.S., Gault, M.J., Douglas, H., Das, S., Wunderlich, A., and J.F. Sauch. 1987. Encystation and expression of cyst antigens by Giardia lamblia in vitro. Science. 235: 1040-1043.

26
11. Janoff, E. N., J. C. Croft, L. K. Pickering, T. Novotny, M. J. Blaser, C. V. Knisley, andL. B. Reller. 1989. Diagnosis of Giardia lamblia infections by detection of parasiteantigens. J. Clin. Microbiol. 27:431-435.
12. Keister, D.B. 1983. Axenic culture of Giardia lamblia in TYI-33 Medium supplemented with bile. Trans. R. Soc. Trop. Med. Hyg. 77:487-488.
13. Kulda, J., and E. Nohynkova. 1995. Giardia in Humans and Animals. In J. Kreier(ed.), Parasitic Protozoa. Academic Press, San Diego, CA.
14. Meng, T., M. Hetsko, and F. Gillin. 1996. Inhibition of Giardia lamblia excystation by antibodies against cyst walls and by wheat germ agglutinin. Infect. Immun. 64:2151-2157.
15. Nash, T.E., D. A. Herrington, and M. M. Levine. 1987. Usefulness of an enzyme-linkedimmunosorbant assay for detection of Giardia antigen in faeces. J. Clin. Microbiol. 27:1169-1171.
16. Rendtroff, R. C. 1954. The experimentation transmission of human intestinal protozoa parasites. II. Giardia lamblia Cysts Giben in Capsules. Am. J. Hyg. 59:209-220.
17. Ritchie, L.S. 1948. An ether sedimentation technique for routine stool examination. Bull. U.S. Army Med. Dept. 81326.
18. Rosoff, J. D., C. Sanders, S. Sonnad, P. De lay, W. Hadley, F. Vincenzi, D. Yajko, andP. O’Hanley. 1989. Stool diagnosis of giardiasis using a commercially available enzymeimmunoassay to detect Giardia-specific antigen 65 (GSA65). J. Clin. Microbiol.27:1997-2002.
19. Scheffler, E.H. and L.L. Van Etta. 1994. Evaluation of rapid commercial enzyme immunoassay for detection of Giardia lamblia in formalin-preserved stool specimens. J. Clin. Microbiol. 32:1807-1808.
20. Stibbs, H. 1989. Monoclonal antibody-based immunoassay for Giardia lamblia in human Stool. J. Clin. Microbiol. 27:2582-2588.
21 Stibbs, H. H., Samadpour, M. and Manning, J.F.. 1988. Enzyme immunoasssay for the detection of Giardia cyst antigens in formalin-fixed and unfixed human stool. J. Clin. Microbiol. 26:1665-1669.
22 Stibbs, H. H., Samadpour, M. and Ongerth, J.E.. 1990. Identification of Giardialamlia-specific antigens in infected human and gerbil feces by western immunoblotting.J. Clin. Microbiol. 28:2340-2346
23. Wolfe, M. 1992. Giardiasis. Clin. Microbiol. Rev. 5:93-100.

27
24. Young, K.H., S.L. Bullock, D.M. Melvin, and C.L. Spruill. 1979. Ethyl acetate as a substitute for diethyl ether in the formalin-ether sedimentation technique. J. Clin. Microbiol. 10:852-853.
28
Chapter 2.
Identification of Giardia lamblia Cyst Wall Protein 1 Detectedby the Ct7 Monoclonal Antibody Used in the GIARDIA TEST.

29
ABSTRACT
Giardiasis can be diagnosed by the microscopic detection of cysts using
immunofluorescence, differential staining methods and by immunological detection of antigens
in stool. The purpose of this study was to identify and characterize the cyst antigen that reacts
with a monoclonal antibody (Ct7 MAb) which is used for the detection of Giardia in feces and
water. The antigen that reacts with this MAb (Ct7 Ag) was affinity purified from supernatant
fluids of encystment cultures using immobilized MAb. Two proteins of 22 and 26 kDa were
eluted from this column. Both proteins reacted intensely with the Ct7 MAb by Western blot
analysis. Two minor protein bands of 32 and 39 kDa also were present which did not react with
the Ct7 MAb. The N-terminal amino acid sequences of the 22 and 26 kDa bands were identical
to cyst wall protein 1 (CWP1) whereas the 32 and 39 kDa bands had sequences identical to cyst
wall protein 2 (CWP2). In encysting cultures, the 26 kDa CWP1 was detected at 18 hours,
followed by the appearance of the 22 kDa form at 42 hours. Both proteins were stable
throughout a 30-day period in encysting cultures. The two forms of CWP1 were resistant to
heating at 100°C, proteolysis by trypsin, chymotrypsin or Pronase and stable in human stool
specimens from persons with giardiasis. In addition, both forms were resistant to N- and O-
glycanases and oxidation by sodium periodate. Purified recombinant CWP1 had a molecular
weight of 26 kDa, a perfect match to the native protein which also suggests that this protein is
not glycosylated. In culture filtrate, CWP1 appears to form a predominant homodimer and a less
abundant heterodimer with CWP2.

30
INTRODUCTION
Giardiasis is the most commonly diagnosed parasitic infection of humans in the U.S. (5).
The protozoan parasite, Giardia lamblia, causes this diarrheal disease. In the 1970’s, the
clinical significance was recognized when a large number of travelers returned from the Soviet
Union with giardiasis (30). Infection results from the consumption of cysts in contaminated
water or feces, with a minimum infectious dose of approximately 10 cysts (23). Symptoms
include diarrhea, abdominal cramps, bloating, flatulence, fatigue, and weight loss caused by
malabsorption.
Monoclonal antibodies raised against cyst walls have been used to characterize and
evaluate the function of cyst wall antigens (2, 17, 27, 29). Several Giardia antigens have been
characterized and identified. GSA 65 is a cyst glycoprotein that is present both in trophozoites
and cysts and has been isolated from the stools of infected persons (26). GSA 65 is resistant to
proteolysis and heat, and is sensitive to oxidation, indicating that the antigenic site is a
carbohydrate. GSA 65 reportedly is detected by a commercial MAb-based immunoassay
(Alexon; Sunnyvale, CA) as a marker of giardiasis (25, 26).
Cyst wall protein 1 (CWP1) and cyst wall protein 2 (CWP2) are cyst wall proteins that
were identified using monoclonal antibodies. The deduced amino acid sequence of both
proteins has been determined from sequencing cDNA prepared from total mRNA of encysting
trophozoites, and shown to contain leucine rich repeats (19, 15). The molecular weights of
CWP1 and CWP2 were estimated to be 26 kDa and 39 kDa, respectively using the gene
sequences. These novel proteins form a stable CWP1/CWP2 65 kDa heterodimer as determined

31
by immunoprecipitation of purified encystment secretatory vesicles. CWP1 and CWP2 are not
produced by growing trophozoites (15).
Other Giardia antigens identified using monoclonal antibodies include group 1 and
group 2 antigens. Group 1 antigens were detected by MAb GCSA-1 and 8C5 early in
encystment at 4 hours and range in size from 26 to 46 kDa (29, 2). The antigenic epitopes for
these antigens appear to be protein and not carbohydrate since they are resistant to oxidation
with periodate and the binding of MAbs was reduced following digestion with Pronase. Group
2 antigens have molecular weights of 66, 85, 120 and 140 kDa and appear later in encystment
at 24 hours. The group 1 antigens are distinct from group 2 antigens since they bind wheat germ
agglutinin, which is specific for N-acetylglucosamine or sialic acid (17). Both groups of
antigens were shown to be different from the previously described GSA 65 as determined by
their absence in trophozoites and sensitivities to proteases (2, 22, 29).
In this study, I describe the isolation, by use of immuno-affinity chromatography, of the
cyst wall antigen that reacts with Ct7 MAb. This IgM MAb is the basis of several commercial
diagnostic assays for giardiasis including immunofluorescence and enzyme immunoassay (10,
21). Until now, the marker antigen(s) detected by this MAb has been unknown.

32
MATERIALS AND METHODS
Preparation of Giardia cysts. G. lamblia WB ATCC 30957 trophozoites were
axenically cultured in Keister’s modified TYI-33 medium at pH 7.1 and incubated at 37°C as
previously described (9). After a confluent monolayer was formed (3 days), trophozoites were
chilled on ice for 20 minutes, pelleted by centrifugation at 800 x g and suspended in TYI-33
medium containing 10 mg/mL of bovine bile (Sigma Chemical Co., St. Louis, MO.) at pH 7.8 to
trigger encystment (12, 9). After 5 days, the cysts were harvested by centrifugation at 800 x g.
Cysts were suspended in deionized water and incubated overnight at room temperature to lyse
residual trophozoites (12). Cysts were pelleted by centrifugation as described above and washed
three times with sterile deionized water. Purified cysts were counted using trypan blue exclusion
and stored in phosphate buffered saline (PBS, pH 7.5) containing 0.01 % sodium azide as a
preservative.
Purification of the Ct7 monoclonal antibody (MAb). Mouse ascites fluid containing a
hybidoma generated using Giardia cysts and BALB C mice (CeLLabs Inc., Sydney, Australia)
was filtered through a 0.2 micron serum acrodisc (Gelman Sciences, Ann Arbor, MI.) to remove
cells. The filtrate was dialyzed against a 2% boric acid solution in water, pH 6.0, for 48 hours
(7). The precipitated Ct7 MAb was pelleted by centrifugation at 8000 x g. The pellet was
dissolved in PBS, pH 7.5 and dialyzed for 72 hours against PBS to remove residual boric acid.
The protein concentration was determined by the Coomassie Plus Protein assay (Pierce
Chemical, Rockford, IL) using bovine IgG as the standard protein (1).
Preparation of polyclonal antisera. Female New Zealand rabbits (5-lb) were injected
with purified Giardia cysts suspended in sterile saline. Each rabbit received initial

33
subcutaneous injections (0.5mL/injection) of 107 purified Giardia cysts diluted 1:2 with
Freund’s Complete Adjuvant. Booster injections were administered every 7 days using 107 cysts
diluted 1:2 with Freund’s Incomplete Adjuvant. Pre-bleed sera were collected 3 days prior to the
first injection. Test bleed sera were obtained at two week intervals beginning at week 3. IgG
polyclonal antibodies against Giardia cysts were purified from antisera by chromatography on
ImmunoPure Immobilized Protein A (Pierce Chemical). Purified IgG antibody was stored in
PBS containing 25% glycerol and 0.02% sodium azide.
Immunofluorescent antibody test (IFA). Immunofluorescence was performed using
the GIARDIA IF TEST (TechLab, Inc., Blacksburg, VA) as recommended by the manufacturer.
The IFA stain consisted of fluorescein isothiocynate-conjugated Ct7 MAb. The negative and
positive controls consisted of human feces diluted (1:25) with PBS containing 10% formalin.
The positive control was spiked with purified Giardia cysts at a final concentration of 105
cysts/mL. Cysts were observed by use of a fluorescence microscope. Ten to 15 fields were
examined with each specimen.
Enzyme immunoassay (EIA) analysis. The GIARDIA TEST (TechLab, Inc.) was
performed as recommended by the manufacturer. Briefly, 0.1 mL of sample was placed into
wells containing immobilized MAb against a Giardia cyst wall antigen. Wells were incubated
for 10 minutes at room temperature and washed 4 times with the wash solution. One drop (0.05
mL) of rabbit polyclonal antibody raised against Giardia cysts was added to each well and
incubated for 20 minutes at room temperature. The wash step was repeated and one drop of
anti-rabbit polyclonal antibody conjugated to horse-radish peroxidase was added. Wells were
incubated for 5 minutes at room temperature and washed as described above. One drop
(0.05mL) of each substrate was added to each well and wells were incubated for 5 minutes at

34
room temperature. One drop (0.05 mL) of stop solution was added to each well and the plate
was read visually and at 450 nm using a EIA reader (EIA 400 AT; Whittaker, Walkersville.
MA.). All reagents were used as standardized solutions in the GIARDIA TEST.
Purification of the Ct7 MAb Antigen. (i) Preparation of the immunoaffinity
column. A total of 4 ml (50% solution) of AFFI-GEL 15 (Bio-Rad Laboratories, Melville, NY.)
specific for primary amine groups was incubated for 3 hours at 4°C with 6.25 mg of Ct7 MAb
purified as described above. The remaining N-hydroxysuccimide active sites were blocked by
the addition of 0.1 mL of 1 M Tris buffer, pH 6.8, to the gel for 1 hour at room temperature.
The 2 mL gel bed was washed with 50 ml of sterile PBS to remove unbound Ct7 MAb. Total
protein estimations of the starting coating solution and of the excess antibody were used to
determine the binding efficiency of the AFFI-GEL 15. The coated gel matrix contained 2.75 mg
of Ct7 MAb per ml of gel resulting in a 87.2 % binding efficiency.
(ii) Purification of the Ct7 MAb antigen. Culture filtrate (268 mL) from 2 x 10⁸
encysting Giardia was passed through the 2 mL bed of the immunoaffinity column. The culture
filtrate was separated into 6-45 mL volumes and passed separately though the column at 22°C
for a total of 3 passes to optimize absorption by the Ct7 Ag. The column was then washed with
40 mL of sterile PBS and the antigen was eluted using 100 mM glycine buffer, pH 2.5,
containing 10% ethylene glycol. A total of 12-1 mL fractions was collected into 1 mL tubes
containing 0.1 mL of 10 X PBS, pH 7.5, to neutralize the pH. All fractions were serially diluted
and screened for the Ct7 antigen by EIA. The antigen containing fractions (a total volume of 32
mL) were pooled and concentrated to 1.7 mL at 4°C by centrifugation in a Centri-plus
concentrator (Amicon, Beverly, MA) with a membrane molecular weight cut-off of 10,000 kDa.

35
Electrophoretic techniques. The molecular weight was determined by sodium
deodecyl sulfate-polyacrylamide gel electrophoresis (SDS-PAGE), essentially as described by
Laemmli (12). Protein staining of the gels was done using Coomassie Brilliant Blue R-250 and
SYPRO Orange Protein Stain (Bio-Rad Laboratories) as instructed by the manufacturer.
Western blot analysis. Western blot analysis was performed by the method of Towbin
(28). Briefly, the electrophoretic transfer was done using a 38 mM Tris-HCL buffer transfer
buffer containing 2.9% w/v glycine and 40% methanol at a constant voltage of 100 volts for 2
hours. Nitrocellulose membranes were rinsed with 25 mM Tris-buffered saline containing 0.15
M sodium chloride, pH 7.5 (TBS) three times. Membranes were blocked for 30 minutes using
0.5% casein dissolved in TBS, pH 7.5. The primary detecting antibody consisted of one of the
following antibodies: purified Ct7 MAb, ascites fluid containing 7D2 MAb (Laboratory of
Parasitic Diseases, NIAID, Bethesda, Maryland) or polyclonal antibody raised against Giardia
cysts as described above. Blocked membranes were incubated with primary antibody diluted in
TBS (15 µg/ml Ct7 MAb, 1:500 7D2 ascites fluid, 2.5 ug/ml rabbit antisera) overnight at 22°C.
Membranes were then washed 3 times with TBS and incubated for 1 hour with anti-mouse
whole IgG-HRP or anti-rabbit antibody whole IgG-HRP conjugate (Sigma Chemical Co.) diluted
1:500 and 1:1000 in TBS, respectively. Membranes were washed with deionized water and
soaked in a tetramethylbenzidine-sodium peroxide substrate solution (TMB- Membrane
Peroxidase substrate reagent; KPL; Gaithersburg, MD). Once bands were visible, the color
development was stopped using several washes of deionized water. Nonreducing SDS-PAGE
was done as described above using sample buffer that did not contain 2-β-mercaptoethanol.
N-terminal sequencing. The N-terminal peptide sequence of the purified antigen was
determined on an Applied Biosystems Procise Sequencer (Perkins-Elmer Corp., Norwalk, CT) at

36
the University of Virginia (Charlottesville, VA). Samples were prepared by using 1 µg of
immunoaffinity purified Ct7 Ag separated by SDS-PAGE as described above. Proteins bands
were transferred to PVDF membrane as described above. The membrane was stained using
Coomassie Brilliant Blue R-250 and destained as described above. Visible bands were excised
and stored separately at -20°C. Prior to sequencing, membranes were rinsed with a methanol-
chloroform solution to remove bound Coomassie R-250 stain. A total of 10 amino acids were
identified per protein using 10 consecutive Edman degradation cycles. Sequence homologies
with known sequences were determined by the FASTA PROGRAM (19).
Assessment of the stability of Ct7 Ag. (i) Determination of heat stability.
Immunoaffinity purified Ct7 Ag was diluted in PBS to a final concentration of 210 ng/mL and
boiled for 5 minutes. Boiled antigen was serially diluted 1:10 and each dilution was tested by
EIA. Results were compared with a standard curve generated from untreated Ct7 antigen.
Boiled Ct7 antigen was further analyzed by Western blot using the Ct7 MAb.
(ii) Stability to proteases. Sensitivity to proteolysis was determined by incubating
purified Ct7 antigen (30 µL) at 210 ng/mL with a trypsin / chymotrypsin stock solution (30 µL)
of 200 µg/mL in 0.1 M Tris-HCL buffer, pH 8.0 at 200 as described by Rossoff (26) and
Pronase dissolved at 2 mg/mL in 0.1 M Tris-HCL, pH 7.5 containing 0.01 M EDTA and 0.5%
SDS. All incubations were done at 37°C. Following incubations, proteases were inactivated by
boiling the mixture for 5 minutes. The mixtures were then analyzed for residual
immunoreactivity and changes in molecular weight using the Ct7 MAb by EIA and Western
blotting, respectively as described above. Negative Controls consisted of untreated Ct7 Ag
diluted in the appropriate reaction buffer. Positive controls included azo-casein and enzymatic
37
activity was assessed using the method of Charney and Tomarelli (27). Briefly, the
trypsin/chymotrypsin (50 µL) or Pronase was combined with azo-casein (80 µL, Sigma
Chemical Co.) dissolved in 0.1 M Tris-HCL buffer, pH 8.0 at 25 mg/mL. The solution was
incubated as described above and undigested azo-casein was precipitated with 5%
trichloroacetic acid solution (600 µL). The precipitated protein was pelleted by centrifugation at
10,000 x g. The supernatant fluid (200 µL) was mixed with a 0.5 M NaOH solution (50µL) and
absorbance values were determined using a EIA reader (Whittaker).
(iii) Determination of stability to glycanases. Purified Ct7 antigen (1.3 µg) was
denatured using 0.1 % SDS solution in water and boiling at 100°C for 3 minutes. The excess
of SDS was bound using a 10% Nonidet P 40 solution in water (10 µL). Two samples of
denatured antigen (640 ng) were combined separately with two glycanase solutions. N-linked
glycanase treatments consisted of 1.2 U of Peptide-N-Glycosidase F (Oxford Glycosciences
Inc., Wakefield, MA) dissolved in 20 mM sodium phosphate buffer, pH 7.5 containing 50 mM
EDTA. O-linked glycanase treatments included 6 mU of Endo-α-N-acetylgalactosamidase
(Oxford Glycosciences Inc.), dissolved in 100 mM sodium citrate phosphate buffer, pH 6
containing 100 µg/ml bovine serum albumin (BSA). All treatments were done at 37°C for 24
hours. Cleavage of glycans were determined by a decrease in molecular weight as compared to
untreated antigen controls using SDS-PAGE and Western blot analysis. Bovine fetuin was used
as a positive control for N-glycanase and O-glycanase reactions. Glycans were visualized using
the Glyco-Track Test kit, a carbohydrate biotinylation assay (Oxford Glycociences Inc.).
Briefly, PVDF membranes were rinsed three times with PBS, pH 7.5, and soaked for 30 minutes
with 100 mM sodium acetate buffer, pH 5.5, containing 0.2% EDTA and 10 mM sodium

38
periodate. Aldehyde groups generated by oxidation were labeled with biotin-hydrazine at room
temperature and developed using the streptavidin-alkaline phosphatase conjugate system.
Glycoproteins appeared as dark bands against a white background.
(iv) Stability to oxidation. The effect of oxidation was determined by using SDS-
PAGE and Western blotting. Immunoaffinity purified Ct7 Ag (630 ng) was separated by SDS-
PAGE under reducing and nonreducing conditions as described above. The antigen was
transferred to a 0.2 micron nitrocellulose membrane at a constant voltage of 100 volts for 2 h.
The membrane was rinsed three times using PBS, pH 7.4. Immobilized antigen was soaked in
the dark for 4 h in 100 mM sodium acetate buffer, pH 5.5, containing 0.2% EDTA and 10 mM
sodium periodate. The nitrocellulose membrane were rinsed three times with TBS and blocked
with TBS containing 0.5% casein for 30 min. and rinsed. The residual immunoreactivity and
molecular weight were assessed by Western blot analysis as described above.
Detection of the Ct7 Ag in stool specimens. Formalinized Giardia-positive and
Giardia-negative stool specimens as determined by microscopy, were kindly supplied by
Parasite Diagnostics (Lilburn, GA.). Formalinized stools submitted for ova and parasite analysis
were concentrated by using the formalin-ethyl acetate method (24, 31). Briefly, 5 ml of
formalinized stool was strained through wet gauze and diluted to 10 ml with deionized water.
The suspension was centrifuged at 500 x g for 2 minutes and the supernatant was discarded.
The pellet was mixed with 9 ml of PBS containing 10% formalin. This suspension was
subsequently mixed with 4 ml of ethyl-acetate and centrifuged for 2 minutes at 500 x g. The
pellet was suspended in PBS (50 µl) and Dobel’s iodine solution (50 µl) of for a wet mount
preparation. Samples were considered Giardia-positive if cysts or trophozoites were observed.
All microscopic Giardia-positive stools were screened by EIA. All stools with absorbance

39
readings of ≥ 0.15 were considered positive. Supernatant fluids from each stool specimen were
subsequently tested by SDS-PAGE under reducing conditions followed by Western analysis as
describe above. The molecular weight of visible bands were compared to a purified Ct7 Ag
control.
Expression of recombinant CWP1 (rCWP1). The CWP1 gene was obtained
previously by Mowatt from a cDNA expression library using total RNA extracted from two cell
types: cysts purified from feces of infected gerbils and cultured encysting trophozoites (19).
The clone including the CWP1 gene was obtained for this study. This clone included the CWP1
gene, starting with nucleotide 46 of the published sequence, that was placed into the BamH1 site
of a GST gene fusion vector containing a thrombin protease recognition site and a tac promoter
(pGEX-4T-1, Pharmacia Biotech, Piscataway, NJ). The host E. coli BL21 strain was
maintained on Terrific Broth (TB; Sigma) agar plates supplemented with ampicillin. E. coli
cultures were started in TB liquid media containing 100 µg/mL of ampicillin. Cultures were
grown at 37°C with shaking (200 rpm) for 6h. The expression of the GST fusion protein was
induced during mid log phase using isopropyl β-D-thiogalactoside (IPTG) at a final
concentration of 200 µM.
Purification of rCWP1. E. coli cultures containing recombinant protein (as determined
by EIA) were chilled to 4°C and lysed by sonication. The E. coli lysate was centrifuged for 10
minutes at 10,000 x g and the supernatant was removed. The cell pellet and supernatant were
analyzed by EIA for the presence of rCWP1. The cell supernatant containing the GST-CWP1
fusion protein was passed through a Glutathione Sepharose 4B-column (0.5ml; Pharmacia
Biotech) twice and the gel matrix was washed with 20 ml of sterile PBS, pH 7.5. The washed
Glutathione Sepharose 4B was suspended in PBS, pH 7.5 containing 25 U of bovine thrombin

40
(Pharmacia Biotech) and incubated overnight at room temperature with gentle shaking.
Partially purified rCWP1 was eluted from the column and analyzed by EIA and Western
blotting.

41
RESULTS
Immunoaffinity purification of the Ct7 MAb Ag. The amounts of Ct7 antigen in
culture filtrates and cell pellets of encysting Giardia were determined by EIA. Culture filtrates
contained much higher levels of soluble Ct7 Ag than the cell pellet preparations as seen in Table
1. A summary of the antigen purification is shown in Table 2. Recoveries from various steps of
the purification scheme are shown in Table 3. Analysis of the antigen eluted from the
immunoaffinity column by SDS-PAGE revealed two proteins of 22 and 26 kDa (Fig. 1). We
could not detect any other bands by staining with Coomassie Blue-staining but a more sensitive,
fluorescent protein stain, showed the presence of two additional minor bands of 32 and 39 kDa
(gel not shown).
Western blot analysis. The Ct7 MAb reacted intensely with the 22 and 26 kDa bands
from Giardia cysts, encystment culture filtrate and the eluate from the immunoaffinity column
(Fig. 2). An additional minor band of 20 kDa was observed in the cyst lysate. The MAb did not
react with nonencysting trophozoites. Western blot analysis of nonreducing SDS-PAGE gels
using purified Ct7 Ag showed bands of 50 and 65 kDa. The 7D2 MAb, which binds to CWP2,
reacted with the minor bands of 32 and 39 kDa under reducing conditions and both MAb’s
reacted with the 65 kDa complex formed under nonreducing conditions (Fig. 3).
N-terminal sequencing. The N-terminal amino acid sequences of the 22 and 26 kDa
proteins were identical with the N-terminus of cyst wall protein 1 (CWP1) whereas the N-
terminal sequences of the 32 and 39 kDa proteins were identical to the N-terminus of cyst wall
protein 2 (CWP2). The N-terminal sequences of native CWP1 and CWP2 began with L15 and
A16 of the sequenced genes respectively (Fig. 4). This analysis identified and confirmed

42
signaling peptides of 14 and 15 aa for both CWP1 and CWP2 respectively. The Ct7 MAb
reacted with the purified recombinant CWP1. Both native and recombinant CWP1 showed an
identical molecular weight of 26 kDa.
Assessment of CWP1 stability. CWP1 was stable and immunoreactive by EIA and
Western blot analysis following boiling for 10 minutes and treatments using trypsin,
chymotrypsin and Pronase.
In addition, oxidation using sodium periodate also had no effect on the immunoreactivity and
molecular weight of CWP1. Further analysis for carbohydrate using N-linked and O-linked
specific enzymes showed no change in molecular weight and immunoreactivity as determined
by Western blot analysis (membrane not shown).
Assessing multiple forms of CWP1. The EIA, Western blot analysis and
immunofluorescence were used to evaluate the expression of CWP1 at timed intervals prior to,
during and after the encystment process. The EIA analysis showed an initial positive result at 6
hours with an absorbance reading of 0.175. The absorbance values increased to 2.2 by 50 hours
into the encystment process. Western blot analysis using the Ct7 MAb showed the 26 kDa
CWP1 band appearing at 18 h and the 22 kDa CWP1 band clearly visible at 42 h (Fig. 5a).
Both bands were stable throughout a 30-day period in encystment media (blot not shown).
Immunofluorescence of encysting trophozoites using the fluorescein labeled Ct7 MAb
conjugate showed the appearance of the CWP1 along the trophozoite cell membrane after 48 h
into the encystment process as seen in Fig. 5b. After 72 h of encystment, the mature cysts
showed bright fluorescence of the cyst wall and cyst tail (Fig. 5c). Nonencysting trophozoites
showed no fluorescence following IFA staining.

43
Detection of Ct7 antigen in stool specimens. Nine each of microscopy Giardia-
positive and Giardia-negative stools were evaluated by Western blot analysis using the Ct7
MAb. The CWP1 antigen was seen as a smeared band of about 26 kDa in 6 of the 9 Giardia-
positive stools tested. Two Giardia-positive stools that were analyzed by Western botting are
shown in Fig. 6. In addition, 3 stools had both the 26 and 50 kDa bands following concentration
of stool supernatant. There were no bands observed in Giardia-negative stools (data not shown).

44
TABLE 1. Assessment of the starting material for the immunoaffinity purification of the Ct7
Ag from culture filtrate of Giardia lamblia. The starting culture filtrate was prepared by
growing Giardia lamblia WB ATCC 30957 in TYI-33 medium by the method of Keister (12)
for 5 days at 37°C followed by encystment (7,19). Cysts and residual trophozoites were
removed by centrifugation and the supernatant fluid was filtered through a 0.20 µm membrane.
Filtrates and pellets were serially diluted and tested by EIA to determine units of activity.
Total EIA Specific Total Total TotalNumber Activity Volume Protein Units of Activity
Culture Material Analysis of Cells (U/mg protein) (ml) (mg) (U)Giardia cyst pellet 2 x 10⁸ 1.3 x 10³ 1.5 92 1.2 x 10⁵
Culture filtrate 0 3.2 x 10⁴ 600 1494 4.8 x 10⁷
Total Culture Material 2 x 10⁸ 1.6 x 10⁵ 602 1588 4.8 x 10⁷
Protein concentration was determined by the method of Bradford (1) using BSA as the standard.
One unit (U) is defined as a single increment of a serial doubling dilution required to give anA450 value between 0.200 and 0.400 as determined by EIA.

45
TABLE 2. Immunoaffinity purification of Ct Ag from culture filtrate of Giardia lamblia. Ct7
MAb was purified from mouse ascites fluid and colvalently coupled to AFFI-GEL 15. Culture
filtrate from 5-day Giardia encystment cultures in TYI-33 medium was applied to the
immobilized Ct7 MAb-AFFI-GEL 15 and unbound material was washed through the column.
The captured protein was eluted with 0.1 M glycine buffer, pH 2.5, containing 0.15 M NaCl and
10% ethylene glycol. The information in the table represents a single Ct7 Ag purification.
TotalVolume Protein
TotalProtein
EIA SpecificActivity Total Recovery Fold
(ml) (mg/ml) (mg) (Units/mg) (Units) (%) PurificationCultureFiltrate 268 2.5 667 3.2 x 10⁴ 2.1 x 10⁷
Eluted Ct7Antigen 1.7 0.02 0.036 7.6 x 10⁷ 2.7 x 10⁶ 13 2375
Protein concentration was determined by the method of Bradford (1) using BSA as the standard.
One unit (U) is defined as a single increment of a serial doubling dilution required to give anA450 value between 0.200 and 0.400 as determined by EIA.
46
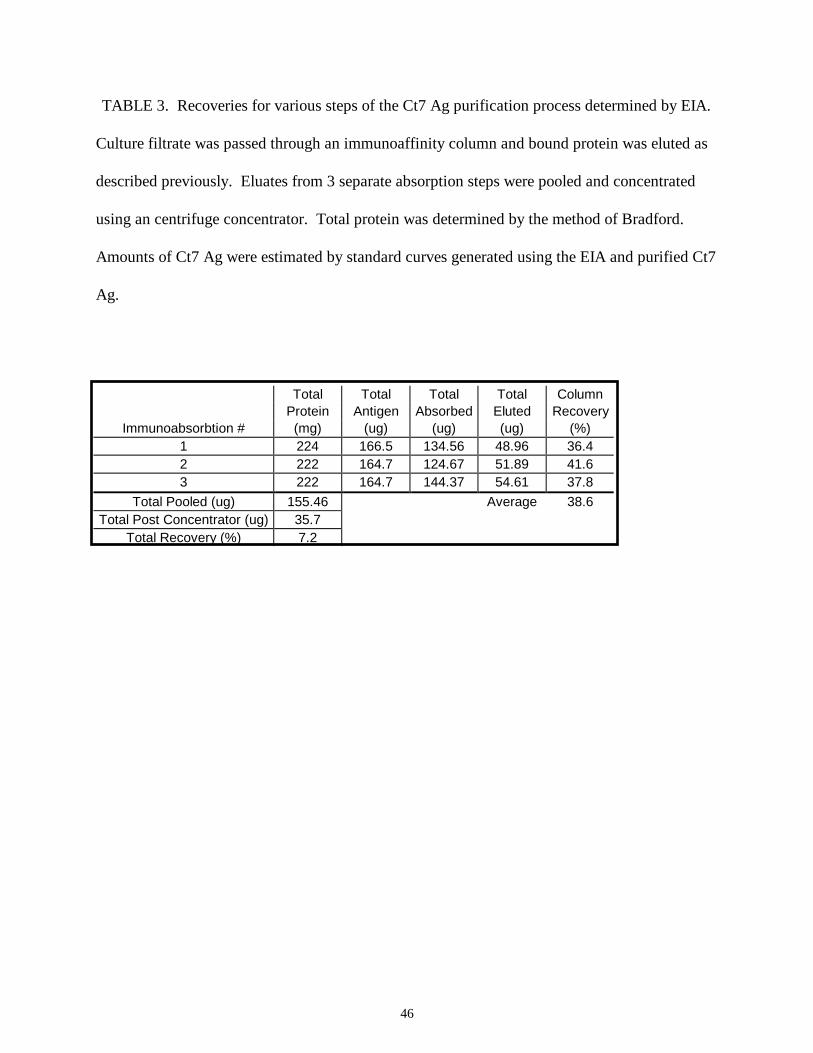
TABLE 3. Recoveries for various steps of the Ct7 Ag purification process determined by EIA.
Culture filtrate was passed through an immunoaffinity column and bound protein was eluted as
described previously. Eluates from 3 separate absorption steps were pooled and concentrated
using an centrifuge concentrator. Total protein was determined by the method of Bradford.
Amounts of Ct7 Ag were estimated by standard curves generated using the EIA and purified Ct7
Ag.
Total Total Total Total ColumnProtein Antigen Absorbed Eluted Recovery
Immunoabsorbtion # (mg) (ug) (ug) (ug) (%)1 224 166.5 134.56 48.96 36.42 222 164.7 124.67 51.89 41.63 222 164.7 144.37 54.61 37.8
Total Pooled (ug) 155.46 Average 38.6Total Post Concentrator (ug) 35.7
Total Recovery (%) 7.2

47
1 2 3
MW (kDa)
13784
44.3
32.8
18.7
7.2
FIG. 1. Reducing SDS-PAGE analysis of the Ct7 Ag purified by immunoaffinity
chromatography using immobilized Ct7 MAb. SDS-PAGE was performed in a 4% stacking-
15% resolving gel at 30 mA and 4°C. Proteins were stained using Coomassie. Lane 1:
Molecular weight markers. Lane 2: Purified Ct7 Ag (1 ug). Lane 2: Starting Culture filtrate (5
ug).

48
1 2 3 4
MW (kDa)
98
6450
36
30
16
7
FIG. 2. Western blot analysis of Giardia cyst lysate, culture filtrate and immunoaffinity purified
Ct7 Ag. Reducing SDS-PAGE and Western blot analysis were done as previously described.
Lanes 1: Molecular weight markers. Lane 2: Giardia cyst lysate. Lane 3: Giardia encystment
culture filtrate. Lane 4: Immunoaffinity purified Ct7 Ag.

49
1 2 3
MW (kDa)
13784
44.332.8
18.7
7.2
FIG. 3. Western blot analysis of immunoaffinity purified Ct7 Ag using the Ct7 and 7D2 MAbs.
Western blots were performed following SDS-PAGE using a 4% stacking-12% resolving gel at
100V for 2 hours at 4°C. Lanes 1: Molecular weights markers. Lane 2: Bands of about 32 and
39 kDa detected by the 7D2 MAb under reduced conditions. Lanes 3: 65 kDa complex detected
by the 7D2 MAb (specific for CWP2) under nonreducing conditions.

50
LTCPATQREV
CWP1 gene MMLALLALAGSALALTCPATQREVLVEIYDATDGANWKTN ↑ ↑ ↑ ↑ 10 20 30 40
ACPATEEEAL
CWP2 gene MIAALVLGLLGLARAACPATEEEALTNLYDALDANWSNNW ↑ ↑ ↑ ↑
10 20 30 40
FIG. 4. The 10 N-terminal amino acids of the immunoaffinity purified Ct7 Ag were identified
using the Edman degradation cycle as detected by a Applied Biosystems Procise Sequencer.
Sequence homologies with known sequences were determined by the FASTA PROGRAM (19).
(A) Sequence homologies showed a 100% match for the first 10 N-terminal amino acids of the
22 and 26 kDa bands with CWP1, beginning with L15 of the CWP1 gene. (B) The first 10 amino
acid sequences for bands 32 and 39 kDa were identical with CWP2, starting with A16 of the
CWP2 gene. Signaling peptides for native CWP1 and CWP2 of 14aa and 15 aa, respectively,
were observed.

51
2 18 24 42 48 66 72 90 96h
MW (kDa)
13784
44.332.8
18.77.2
FIG. 5a. Western blot analysis of the Ct7 MAb antigen in culture filtrate during the Giardia
encystment process. Reducing SDS-PAGE and the Western blot were done as previously
described. The 26 kDa band appears at 18 hour of encystment and the 22 kDa band is visible at
42 h. Nonreducing SDS-PAGE followed by Western blot analysis showed only a 50 kDa band
appearing at 18 hour. No other bands were observed.

52
FIG. 5b. Immunofluorescent antibody staining of an encysting trophozoite by IFA using
fluorescein labeled Ct7 MAb. Forty-eight hours into the encystment process, the outer portion
of the cyst wall showed the appearance of CWP1.
53
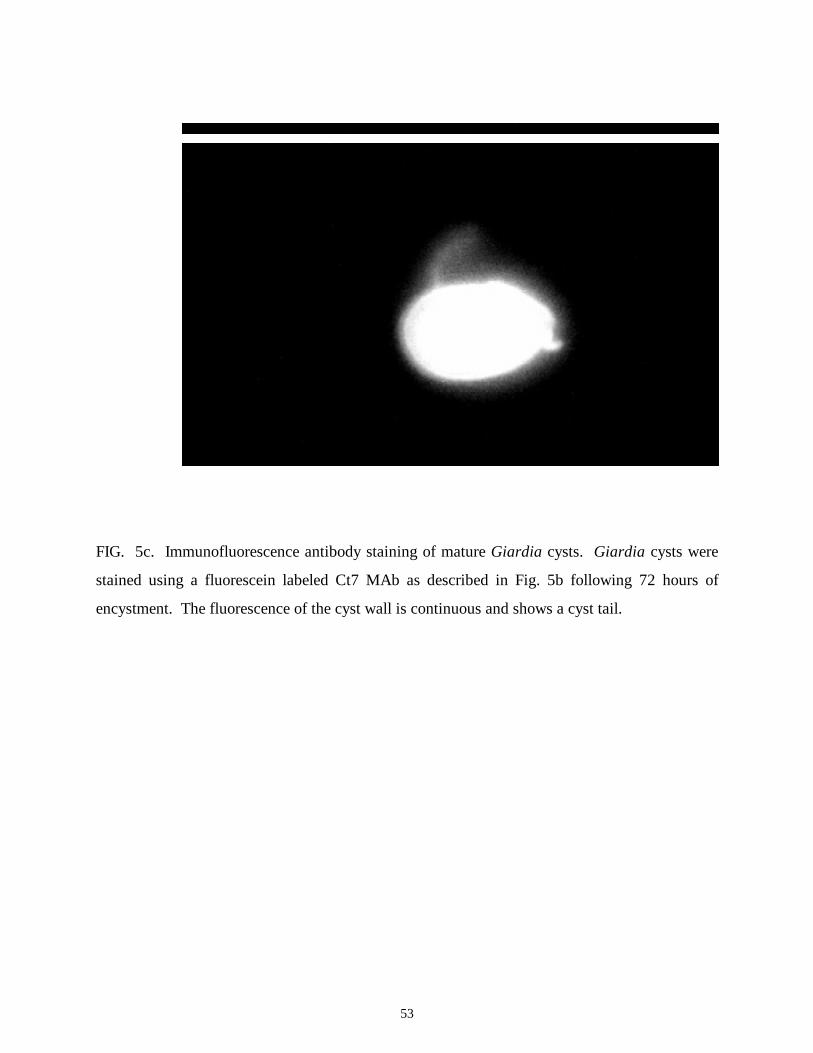
FIG. 5c. Immunofluorescence antibody staining of mature Giardia cysts. Giardia cysts were
stained using a fluorescein labeled Ct7 MAb as described in Fig. 5b following 72 hours of
encystment. The fluorescence of the cyst wall is continuous and shows a cyst tail.

54
1 2 3
MW (kDa)
13784
44.3
32.8
18.7
7.2
FIG. 6. Western blot analysis of the Ct7 Ag in human feces. SDS-PAGE and Western blot
analysis using the Ct7 MAb were done as previously described. Giardia-positive specimens
were determined by microscopy using iodine staining and the GIARDIA TEST. Lane 1.
Molecular weight markers. Lanes 2 and 3: A smeared band of about 26 kDa is present in
Giardia-positive stool specimens.

55
DISCUSSION
The encystment process of Giardia lamblia remains one of the least understood phases
of its life cycle, but during the past decade, researchers have begun to answer some of the
questions about the Giardia cyst. A study using electron microscopic examination of purified
cysts revealed a network of different sized filaments beginning at multiple points on the outer
membrane of encysting trophozoites (4). These cyst filaments appeared to elongate and proceed
to fully encase the trophozoite. Other studies have provided information concerning the
composition of the cyst wall. Both gas chromatographic and mass spectrometric analysis of the
cyst wall showed the presence of both protein and carbohydrate (16, 11). Galactosamine was
the primary amino sugar. Although some progress has been made, actually very little is known
about the composition of the cyst wall, the mechanism of construction and the function of
known cyst wall proteins.
In this study, I identified the cyst antigen that reacts with the Ct7 MAb as Cyst Wall
Protein 1 (CWP1). I also describe the first immunoaffinity purification of cyst wall proteins
from culture supernatants of encysting Giardia. This approach enabled us to isolate secreted
cyst antigens without solublizing the cyst wall with detergents; this simplified the purification
process and reduced the likelihood of denaturing the antigens. Although the majority of the cyst
wall proteins are in the cyst itself, there are sufficient amounts in the culture filtrate to allow
purification.
Assessment of the immunoaffinity purified material revealed small amounts of a co-
purifying protein. I identified this protein as Cyst Wall Protein 2 (CWP2). CWP2 did not react
with the Ct7 MAb by Western blot analysis. Previous observations by Lujan indicated that

56
CWP1 and CWP2 form heterodimers prior to their incorporation into the cyst wall (15). Even
though the majority of the purified protein was CWP1, the presence of low levels of CWP2
supports this idea. In addition, I observed a CWP1 homodimer of 50 kDa that was present in the
affinity-purified preparations and some Giardia-positive stools. Since these complexes are
dissociated only in SDS-PAGE gels containing β-mercaptoethanol, it is likely that the homo-
and heterodimers may be bound by disulfide bonds.
Recent studies have shown the reaction of MAb’s with antigens of different molecular
weights (23, 27, 29). It was not clear in these studies whether these represent multiple forms of
the same antigen or if they are complexed with other components of the cyst wall. In this study,
two forms of CWP1 and CWP2 were observed in the immunopurified material. These different
molecular weight sizes of the cyst wall proteins appeared in both the culture filtrate and purified
cysts. The sequenced gene of CWP1 predicts a protein of 26 kDa and this was the only size
produced in transformed E. coli containing this gene. This suggests to us that the 22 and 26
kDa forms of CWP1 seen in culture supernatants may be the result of proteolytic cleaving by a
Giardia protease of the C-terminal end of the protein. This same mechanism was proposed by
Lujan for CWP2 (15). In addition, I observed a third CWP1 form of 20 kDa present only in
purified cysts. This smaller form may represent further proteolytic processing of CWP1
following the insertion into the cyst wall. Another possibility for the 22 kDa CWP1 form is a
second gene product of a smaller molecular weight. Regardless of how the multiple forms are
produced, CWP1 and CWP2 appear to represent building blocks for the protein portion of
previously described cyst wall filaments.
I compared the N-terminal sequences of native CWP1 and CWP2 and identified
signaling peptides. These peptides were the sizes previously predicted by Mowatt and Lujan

57
from the CWP1 and CWP2 gene sequences (15). Currently, there is a controversy in the
literature on whether or not Giardia have a typical endoplasmic reticulum and golgi (14).
Presence of the signaling peptides for these secreted cyst wall proteins provides additional
evidence for these organelles.
I found that native CWP1 migrated in SDS-PAGE gels identically to the recombinant
form and the molecular weight of native CWP1 was not changed by reaction with N- and O-
glycanases. Thus, there are no attached glycans. This was also indicated by the resistance of
CWP1 to oxidation by sodium periodate. In addition, CWP1 was not degraded by treatment
with trypsin, chymotrypsin or Pronase. We also observed the 26 kDa form in human feces
which is evidence that CWP1 is resistant to the digestive and bacterial enzymes of the
gastrointestinal tract. The stability of CWP1 in feces is one reason why CWP1 is a useful
diagnostic marker for giardiasis.
In conclusion, I identified the cyst antigen that reacts with the Ct7 MAb as CWP1 and
describe a method for the immunoaffinity purification of this soluble protein from culture
supernatants of encysting Giardia. This highly stable protein is released into the culture
supernatant initially as a 26 kDa protein followed by the conversion into or expression of a
second 22 kDa form. CWP1 appears to form a predominant homodimer and a less abundant
heterodimer with CWP2. In addition, I suggest that CWP1 is not a glycoprotein based on the
matching molecular weight of native and recombinant CWP1 and the resistance of the native
form to glycanases.

58
REFERENCES
1. Bradford, M. M. 1976. A rapid and sensitive method for the quantitation of microgramquantities of protein utilizing the principle of protein-dye binding. Anal.Biochem.,72:248-254.
2. Campbell, J. D., G. M. Faubert. 1994. Recognition of Giardia lamblia Cyst-Specific antigens by monoclonal antibodies. Parasite Immunol. 16:211-219.
3. Charney, J. and R. M. Tomarelli. 1947. J. Biol. Chem. 171:501-505.
4. Erlandsen, S. L., P. T. Macechko, H. Van Keulen, E. L. Jarroll. 1996. Formation ofthe Giardia cyst wall: Studies on extracellular assembly using immunogold labeling andhigh resolution field emission SEM. J. Euk. Microbiol. 43:416-429.
5. Feely, D. E., S. Erlandsen, D. Chase. 1984. Structure of the trophozoite and cyst. In S. Erlandsen and Ernest Meyer (ed), Giardia and Giardiasis. Plenum Press, New York and London.
6. Garcia, L. S., D. Bruckner. 1993 Intestinal Protozoa: Flagellates and Ciliates. In L. Garcia and Bruckner(ed.), Diagnostic Medical Parasitology. American Society for Microbiology, Washington, D.C.
7. Garvey J. S., Cremer, N. E. and D. H. Sussdof. 1977. In W. A. Benjamin (ed), Methodsin immunology; 3 rd edn. Reading MA.
8. Gillin, F. D., D. S. Reiner. 1996. Cell biology of the Primitive eukaryote Giardia lamblia. Annu. Rev. Microbiol. 50:679-705.
9. Gillin, F. D., D. S. Reiner, M. J. Gault, H. Douglas, Das S A. Wunderlich, J. F.Sauch. 1987. Encystation and expression of cyst antigens by Giardia lamblia in vitro. Science. 235:1040-1043.
10. Hopkins, R. M., P. Deplazes, B. Meloni, J. Reynoldson, R. Thompson. 1993. A Fieldand Laboratory evaluation of a commercial ELISA for the detection of Giardiacoproantigens in humans and dogs. Trans. Med. Hyg. 87:39-41.
11. Jarroll, E.L., P. Manning, D. G. Lindmark, J.R. Coggins, S. L. Erlandsen. 1989. Giardia cysts wall-specific carbohydrate: evidence for the presence of galactosamine. Mol. Biochem. Parasit. 32:121-132.
12. Keister, D. B. 1983. Axenic culture of Giardia lamblia in TYI-33 medium supplemented with bile. Trans. R. Soc. Trop. Med. Hyg. 77:487-488.

59
13. Laemmli, U. K. 1970. Cleavage of structural proteins during the assembly of the headof bacteriophage T4. Nature. (London). 227:680-685.
14. Lujan, H. D., A. Marotta, M. R. Mowatt, N. Sciaky, J. Lippincott-Schartz, T.E. Nash.1995. Developmental induction of golgi structure and function in the primitiveeukaryote Giardia lamblia. J. Biol. Chem. 270:4612-4618.
15. Lujan, H.D., M. R. Mowatt, J.T. Conrad, B. Bowers, T.E. Nash. 1995. Identificationof a novel Giardia lamblia cyst wall protein with Leucine-rich repeats. J. Biol. Chem.270:29307-29313.
16. Manning, P., S. L. Erlandsen, E. L. Jarroll. 1992. Carbohydrate and amino acid analysis of Giardia muris cysts. J. Protozoology. 39:290-296.
17. Meng, T., M. Hetsko, F. Gillin. 1996. Inhibition of Giardia lamblia excystation by antibodies against cyst walls and by wheat germ agglutin. Infect. Immun. 64:2151-2157.
18. Moss, D.M., H. Mathews, G. Visvesvara, J. Dickerson, E. Walker. 1991.Purification and characterization of Giardia lamblia antigens in the feces ofMongolian gerbils. J. Clin. Microbiol. 29:21-26.
19. Mowatt, M.R., H. D. Lujan, D. B. Cotten, B. Bower, J. Yee, T.E. Nash, H. H.Stibbs. 1995. Developmentally regulated expression of a Giardia lamblia cyst wallprotein gene. Molecular Microbiology. 15:9555-963.
20. Pearson, W.R., D. J. Lipman. 1988. Improved tools for biological sequence comparison. Proc. Natl. Acad. Sci. USA. 85:2444-2448.
21. Perez, M.J., R. Aretio, E. Martin. 1994. Giardia tests: An evaluation of a commercial immunofluorescence assay. Abstract. In R. Thompson, J. Reynoldson, and A. Lymbery (eds), Giardia From Molecules to Disease. CAB International, Wallingford,,UK.
22. Reiner, D.S., H. Douglas, F. Gillin. 1989. Identification and localization of cyst-specific antigens of Giardia lamblia. Infection and Immunity. 57:963-968.
23. Rendtroff, R.C., 1954. The Experimental Transmission of human intestinal protozoan parasites. II. Giardia lamblia Cysts given in Capsules. Am. J. Hyg. 59:209-220.
24. Ritchie, L.S., 1948. An ether sedimentation technique for routine stool examination. Bull. U.S. Army Med. Dept. 81326.

60
25. Rosoff, J., C. Sanders, S. Sonnad, P. De lay, W. Hadley, F. Vincenzi, D. Yajko, P. O’Hanley. 1989. Stool diagnosis of giardiasis using a commercially Available Enzyme Immunoassay to detect Giardia-Specific antigen 65 (GSA65). J. Clin. Microbiol. 27:1997-2002.
26. Rosoff, J. H. H. Stibbs. 1986. Physical and chemical characterizations of a Giardia lamblia-specific antigen useful in the coprodiagnosis of giardiasis. J. Clin. Microbiol. 24:1079-1083.
27. Stibbs, H.H. 1989. Monoclonal antibody-Based enzyme immunoassay for Giardia lamblia antigen in human stool. J. Clin. Microbiol. 27:2582-2588.
28. Towbin, H., T. Staehlin, J. Gordon. 1979. Electrophoretic transfer of proteins from polyacrylamide gels to nitrocellulose sheets: Procedure and some applications. Proc. Natl. Acad. Sci. USA 76:607-610.
29. Ward, H.D., A. V. Kane, E. Ortega-Barria, G. T. Keusch, M. E. Pereira. 1990. Identification of developmentally-regulated Giardia lamblia cyst antigens using GCSA-1,a cyst-specific monoclonal antibody. Mol. Microbiol. 4:2095- 2102.
30. Wolfe, M. 1992. Giardiasis. Clin. Microbiol. Rev. 5:93-100.
31. Young, K.H., S. L. Bullock, D. M. Melvin, C.L. Spruill. 1979. Ethyl acetate as a substitute for diethyl ether in the formalin-ether sedimentation technique. J. Clin. Microbiol. 10:852-853.

61
JAMES H. BOONE
2131 Childress RdChristiansburg, Virginia 24073
Home: (703) 382-8336 Work: (703) 231-3943 E-mail - [email protected]
OBJECTIVE: Research and Development.
EDUCATION: May, 1990: B.S. Biochemistry; Minor: Chemistry; May, 1998: M.S., Virginia Polytechnic Institute & State
University, Department of Biology.
RELATEDEXPERIENCE: Familiar with study design and preparation of final reports.
Extensive experience with many aspects of commercial immunoassays(enzyme immunoassays, immunofluorescent antibody tests and latexagglutination assays) - research and development, investigational plan designand management, site inspections, trouble shooting, product production,sales and technical assistance.
Familiar with culturing of bacteria - clinical specimens, bioburden testing, large scale production and protein purification.
Familiar with writing and presenting scientific data (final reports for contractresearch, FDA submissions for new products, seminars, poster presentations and training workshops for national scientific meetings).
Experience with common laboratory safety procedures - development of a safety program and implementation of procedures, familiar with OSHA regulations.
EXPERIENCE: 10/91 - Present; Research Scientist, TechLab Inc., VPI Corporate ResearchCenter, Blacksburg, Virginia.
9/89 - 10/91; Research Technician, VPI Veterinary Microbiology ResearchCenter, Blacksburg, Virginia.
SCIENTIFICPUBLICATIONS: Available upon request