giant plagioclase growth during storage of basaltic magma
TRANSCRIPT

ORIGINAL PAPER
Giant plagioclase growth during storage of basaltic magmain Emeishan Large Igneous Province, SW China
Li-Lu Cheng • Zong-Feng Yang • Ling Zeng •
Yu Wang • Zhao-Hua Luo
Received: 3 September 2013 / Accepted: 10 January 2014 / Published online: 1 February 2014
� Springer-Verlag Berlin Heidelberg 2014
Abstract Giant plagioclase basalts (GPBs) reflect the
storage of flood basalt magma in subvolcanic magma
chambers at crustal depths. In this study of the Late
Permian Emeishan large igneous province in southwest
China, we focus on understanding the plumbing system and
ascent of large-volume basaltic magma. We report a
quantitative textural analysis and bulk-rock geochemical
composition of clustered touching crystals (CT-type) and
single isolated crystal (SI-type) GPB samples from 5- to
240-m-thick flows in the Daqiao section. Both types of
GPBs are evolved (\6 MgO wt%), but have high Ti/Y
ratios ([500) and high total FeO content (11.5–15.2 wt%).
The mineral chemistry of the two types of plagioclase
displays a small range of anorthite content (\5 mol%),
which is consistent with their unzoned characteristics. The
two types of GPBs have S-type crystal size distributions
but have quite different slopes, intercepts, and character-
istic lengths. The characteristic lengths of the five flows are
1.54, 2.99, 1.70, 3.22, and 1.86 mm, respectively. For
plagioclase growth rates of 10-11 to 10-10 mm/s, steady-
state magma chamber models with simple continuous
crystal growth suggest that CT-type plagioclase megacrysts
have the residence time of about 500–6,000 years, whereas
the residence time for SI-type plagioclase is significantly
longer, about 1,000–10,000 years. By combining field
geology, quantitative textural data with geochemistry, we
suggest that CT- and SI-type crystals grew and were
coarsened in the outer part and inner part of a magma
chamber, respectively. Magma evolution during storage is
controlled by crystallization, crystal growth, and magma
mixing, and pulsating eruptions occur in response to the
continuous supply of hot magma.
Keywords Emeishan large igneous province �Giant plagioclase basalts � Crystal size distributions �Magma residence time
Introduction
The Emeishan flood basalts are located on the western
margin of the Yangtze craton in southwestern China and
have been recognized as a large igneous province (LIP)
(Chung and Jahn 1995; Xu et al. 2001). Most previous
studies have focused on the primitive high-Mg magmas
and picrites, which have been used to constrain the magma
source (Kamenetsky et al. 2012; Li et al. 2012; Zhang et al.
2006; Zhang et al. 2008). However, low-Mg basalts are key
for understanding complex magmatic processes in the
Emeishan LIP, such as magma storage, differentiation, and
crustal contamination. ‘‘Giant plagioclase basalts’’ (GPBs;
Cox 1980; Hooper et al. 1988; Sen 2001) are characterized
by plagioclase megacrysts (up to 50 mm long) and gener-
ally have low Mg contents but high total Fe and Ti contents
and occur widely in the Emeishan LIP (Xiao et al. 2004;
Xu et al. 2001). GPBs can also be found in other conti-
nental LIPs, such as the Deccan Traps (Beane et al. 1986;
Chandrasekharam et al. 1999; Hooper et al. 1988; Sen
2001) and the Siberian Traps (Lightfoot et al. 1993). GPBs
Communicated by T. L. Grove.
Electronic supplementary material The online version of thisarticle (doi:10.1007/s00410-014-0971-0) contains supplementarymaterial, which is available to authorized users.
L.-L. Cheng � Z.-F. Yang � L. Zeng � Y. Wang � Z.-H. Luo (&)
State Key Laboratory of Geological Processes and Mineral
Resources, China University of Geosciences, Beijing 100083,
China
e-mail: [email protected]
123
Contrib Mineral Petrol (2014) 167:971
DOI 10.1007/s00410-014-0971-0
with plagioclase phenocrysts up to 5 cm long are exposed
in the lowest subgroup, the Kalsubai, of the Deccan Traps.
The phenocrysts have compositions that range from An61
to An64 (An = Ca/[Ca ? Na]) and are generally weakly
zoned; plagioclase megacrysts are very tabular and com-
monly form clusters of subparallel crystals (Higgins and
Chandrasekharam 2007; Sen 2001). Quantitative textural
analyses suggest that GPBs are evidence of magma storage
in subvolcanic magma chambers at crustal depths. Thus,
GPBs may hold considerable promise for understanding the
storage, evolution, and plumbing of large-volume basaltic
lavas in LIPs. However, it is difficult to decipher the
physical processes of magma storage and eruption at
crustal depths, especially crystal nucleation and growth and
magma residence time by some traditional geochemical
and qualitative petrographic studies. The theory developed
of crystal size distributions (CSDs, e.g., Cashman and
Marsh 1988; Higgins 1996, 1998; Marsh 1988, 1998) has
been used to document igneous physical processes and
provides a method for determining the magma residence
time by assuming a crystal growth rate (e.g., Cashman and
Marsh 1988; Higgins and Chandrasekharam 2007; Morgan
and Jerram 2006; Zellmer et al. 1999). Some igneous
physical processes such as textural coarsening (Higgins
1998; Higgins 2009; Magee et al. 2010), compaction and
compaction-driven recrystallization, as well as other
physical parameters such as magma ascent rates (Armienti
et al. 2013), the crystallization and cooling rate of crystals
(Cashman 1993), and the volume of the magma chamber
(Higgins and Chandrasekharam 2007) have been examined
by quantitative textural studies. In recent years, the phys-
ical and chemical processes of magma reservoirs have been
investigated by combining quantitative textural analysis
with geochemical studies such as isotopic microanalysis
(Morgan et al. 2007), in situ chemical (major and trace
element and Sr isotope) data of plagioclase (Salisbury et al.
2008), and bulk-rock composition (Yang 2012). In samples
containing small plagioclase crystals, some clusters have
radiating textures that may have developed later in a static
environment (Higgins and Chandrasekharam 2007). How-
ever, GPBs with different texture and similar chemical
compositions that occur in the same section were found in
the Emeishan LIP.
To understand the physical and chemical processes of a
magmatic system, representative GPB samples from a Late
Permian basaltic section, called the Daqiao section, were
analyzed by combining field geology, geochemical studies,
and quantitative textural analysis. Here, we investigate the
evolution of the magma during its storage and derive
inferences about the magma residence time, magma
cycling time, and magma eruption rate.
Geological background
The Emeishan LIP is located on the western margin of
the Yangtze craton in southwest China. It covers an
estimated area of [2.5 9 105 km2 (Chung et al. 1998;
Xu et al. 2001) and has a total volume of
[0.3 9 106 km3 (Ali et al. 2005; Chung et al. 1998; Xu
et al. 2001). The Emeishan volcanism occurred at the
Middle-Late Permian boundary and was concurrent with
the end-Guadalupian (*260 Ma) mass extinction (Zhou
et al. 2002). The mafic–ultramafic intrusions of the
Emeishan LIP host world class Fe–Ti–V oxide deposits
and Ni–Cu–PGE sulfide deposits (Shellnutt et al. 2009,
2011; Zhou et al. 2005). The Emeishan volcanic suc-
cessions unconformably overlie the Late Middle Permian
carbonate formations (i.e., the Maokou limestone) and
are overlain by uppermost Permian units in the east and
Middle Triassic sediments in the west (Xu et al. 2001).
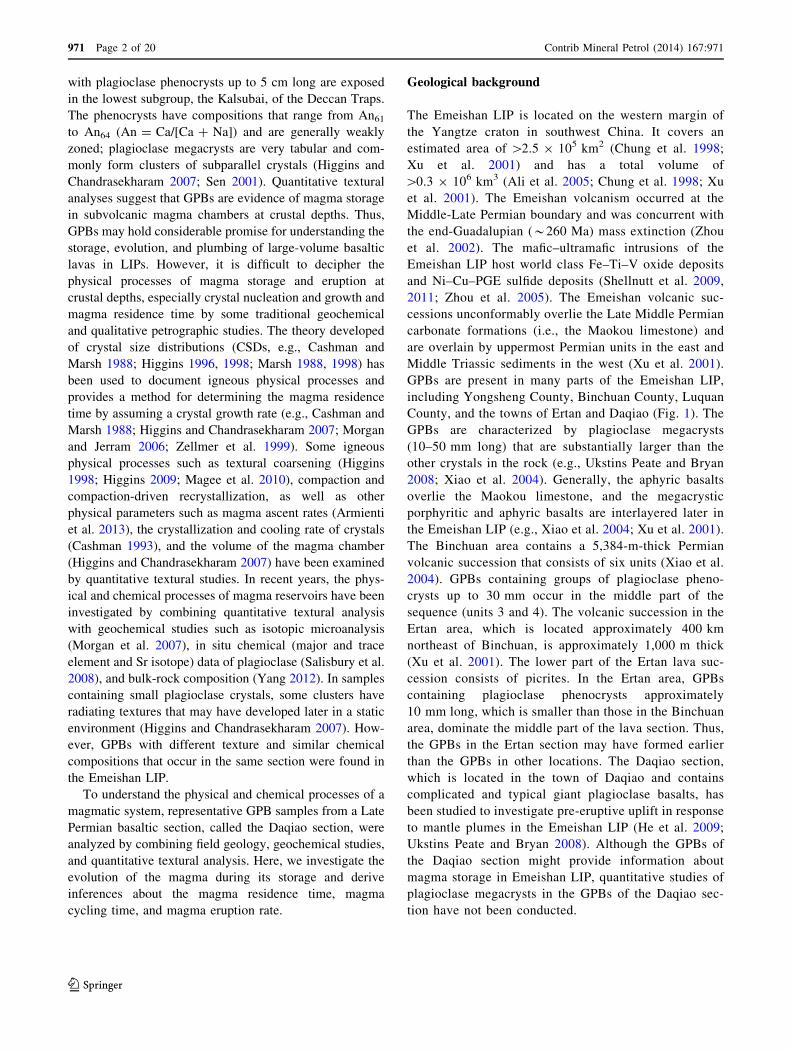
GPBs are present in many parts of the Emeishan LIP,
including Yongsheng County, Binchuan County, Luquan
County, and the towns of Ertan and Daqiao (Fig. 1). The
GPBs are characterized by plagioclase megacrysts
(10–50 mm long) that are substantially larger than the
other crystals in the rock (e.g., Ukstins Peate and Bryan
2008; Xiao et al. 2004). Generally, the aphyric basalts
overlie the Maokou limestone, and the megacrystic
porphyritic and aphyric basalts are interlayered later in
the Emeishan LIP (e.g., Xiao et al. 2004; Xu et al. 2001).
The Binchuan area contains a 5,384-m-thick Permian
volcanic succession that consists of six units (Xiao et al.
2004). GPBs containing groups of plagioclase pheno-
crysts up to 30 mm occur in the middle part of the
sequence (units 3 and 4). The volcanic succession in the
Ertan area, which is located approximately 400 km
northeast of Binchuan, is approximately 1,000 m thick
(Xu et al. 2001). The lower part of the Ertan lava suc-
cession consists of picrites. In the Ertan area, GPBs
containing plagioclase phenocrysts approximately
10 mm long, which is smaller than those in the Binchuan
area, dominate the middle part of the lava section. Thus,
the GPBs in the Ertan section may have formed earlier
than the GPBs in other locations. The Daqiao section,
which is located in the town of Daqiao and contains
complicated and typical giant plagioclase basalts, has
been studied to investigate pre-eruptive uplift in response
to mantle plumes in the Emeishan LIP (He et al. 2009;
Ukstins Peate and Bryan 2008). Although the GPBs of
the Daqiao section might provide information about
magma storage in Emeishan LIP, quantitative studies of
plagioclase megacrysts in the GPBs of the Daqiao sec-
tion have not been conducted.
971 Page 2 of 20 Contrib Mineral Petrol (2014) 167:971
123
Field relations and petrography
The town of Daqiao is located north-northeast of Kunming
in Huidong County, Sichuan Province (Fig. 1). A complete
Permian basaltic section is exposed along the river and
records the early stages of volcanic activity from the initial
aphyric basaltic lavas that overlie the Maokou limestone to
the main stage of megacrystic (2–50 mm) plag-phyric, and
glomerophyric basalts that contain CT- and SI-type
megacrysts. The top of the uppermost lava is filled with a
tan fine-grained basaltic ash with abundant accretionary
lapilli (Ukstins Peate and Bryan 2008). The GPBs in the
Daqiao section are heterogeneous and are composed of at
least two magmatic components: One is rich in plagioclase
megacrysts, and the other contains aphyric or sparsely
phyric megacrysts (Fig. 2a). Similar heterogeneity was
described in the Deccan Trap, and the spatial arrangement
of these components and their fabric suggests that they
originated by magma mixing (Higgins and Chandrasekha-
ram 2007). By measuring the plagioclase megacrysts in the
GPBs of the Daqiao section, the GPBs were texturally
divided into two types: (1) basalts with a clustered touching
phenocrysts texture (CT-type), which contain plagioclase
megacryst aggregations on the order of 10 mm long
(Fig. 2c) and (2) basalts with a single isolated phenocrysts
texture (SI-type), which contain isolated plagioclase
megacrysts on the order of 20 mm long (Fig. 2d). An
approximately 240-m-long profile that extends from the
lowermost aphyric basaltic lava that directly contacts the
Permian Maokou limestone to the top of the GPB lava was
carefully sampled, and compositions and quantitative tex-
tural analysis were obtained in the field. The GPB flows
contain no faults. The aphyric or nearly aphyric basaltic
lavas are 23.9 m thick in the lower part of the profile. The
upper GPB lava flows were preliminarily divided in the
field into five flows based on the two types of GPBs: flow
CT1, flow SI1, flow CT2, flow SI2, and flow CT3 (Fig. 3).
Flow CT1 is 85.5 m thick, and most of the plagioclase
megacrysts are of the clustered touching type. We mea-
sured the lengths of at least six largest euhedral tabular
plagioclase megacrysts in the flow CT1 with a measuring
tape and used the average length of 12.7 mm as repre-
sentative of the largest plagioclase of flow CT1. The
lengths of the largest plagioclases of the other flows were
determined using the same technique. A weathered horizon
is present between CT1 flow and SI1 flow and indicates a
Fig. 1 The Emeishan volcanic
province. The samples are from
the towns of Daqiao and Ertan,
which are located in the inner
zone and the middle zone of the
province, respectively (modified
from He et al. 2003
Contrib Mineral Petrol (2014) 167:971 Page 3 of 20 971
123
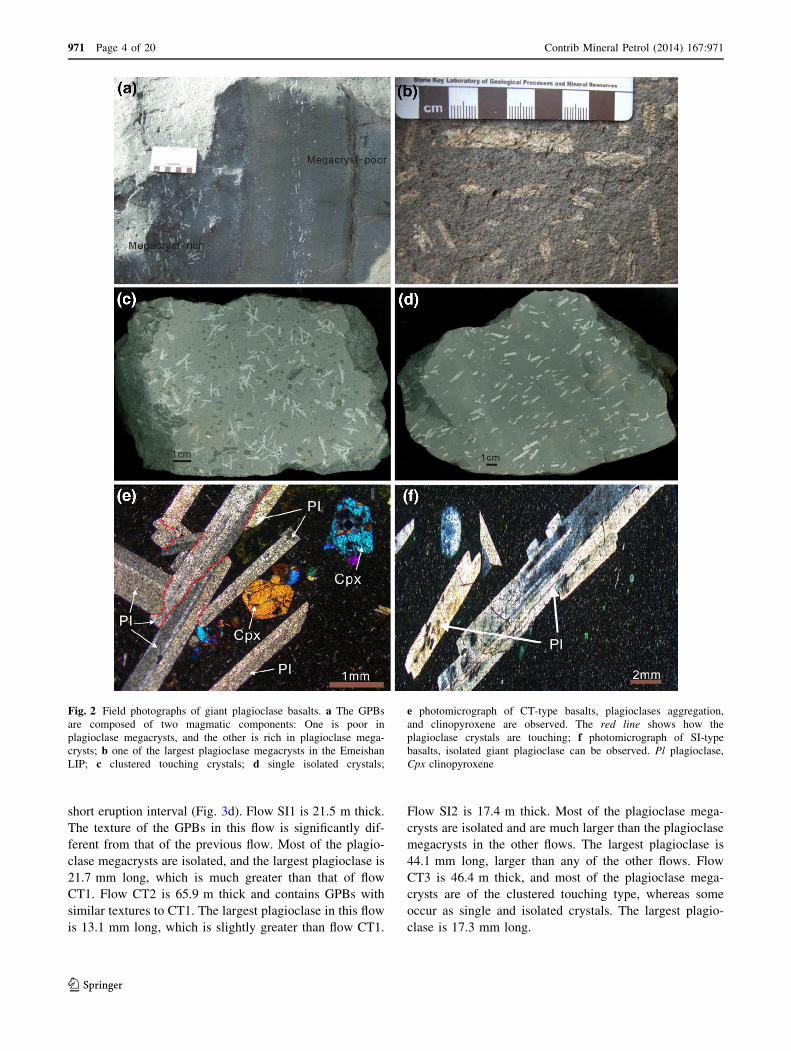
short eruption interval (Fig. 3d). Flow SI1 is 21.5 m thick.
The texture of the GPBs in this flow is significantly dif-
ferent from that of the previous flow. Most of the plagio-
clase megacrysts are isolated, and the largest plagioclase is
21.7 mm long, which is much greater than that of flow
CT1. Flow CT2 is 65.9 m thick and contains GPBs with
similar textures to CT1. The largest plagioclase in this flow
is 13.1 mm long, which is slightly greater than flow CT1.
Flow SI2 is 17.4 m thick. Most of the plagioclase mega-
crysts are isolated and are much larger than the plagioclase
megacrysts in the other flows. The largest plagioclase is
44.1 mm long, larger than any of the other flows. Flow
CT3 is 46.4 m thick, and most of the plagioclase mega-
crysts are of the clustered touching type, whereas some
occur as single and isolated crystals. The largest plagio-
clase is 17.3 mm long.
Fig. 2 Field photographs of giant plagioclase basalts. a The GPBs
are composed of two magmatic components: One is poor in
plagioclase megacrysts, and the other is rich in plagioclase mega-
crysts; b one of the largest plagioclase megacrysts in the Emeishan
LIP; c clustered touching crystals; d single isolated crystals;
e photomicrograph of CT-type basalts, plagioclases aggregation,
and clinopyroxene are observed. The red line shows how the
plagioclase crystals are touching; f photomicrograph of SI-type
basalts, isolated giant plagioclase can be observed. Pl plagioclase,
Cpx clinopyroxene
971 Page 4 of 20 Contrib Mineral Petrol (2014) 167:971
123
Sample and analytical methods
Whole-rock and mineral compositions
A total of 22 samples were collected from Daqiao section
for whole-rock analyses, and 11 samples were divided into
two parts for accuracy (Table 1). The samples were cru-
shed to a 200 mesh in an agate mill. Eleven samples for
CSD analysis were analyzed at the Beijing Research
Institute of Uranium Geology and China University of
Geosciences. Their whole-rock major and trace element
compositions were determined by XRF (PW2404) and
ICP-MS (ELEMENT XR). Whole-rock major and trace
element compositions of another 11 samples were analyzed
at the State Key Laboratory of Continental Dynamics in
Northwest University, China, using XRF (Rikagu RIX
2100) and ICP-MS (Agilent 7500a), respectively. USGS
and Chinese standards (BCR-2, GSR-1, and GSR-3) were
used to monitor the analytical precision and accuracy of the
major elements and were generally better than 5 %. For the
trace element analyses, sample powders were digested
using an HF ? HNO3 mixture in high-pressure Teflon
bombs at 190 �C for 48 h. The analytical precision was
better than 10 % for most of the trace elements.
The mineral compositions of selected samples were
measured by electron microprobe at the Beijing Research
Institute of Uranium Geology and the China University of
Geosciences. Samples YN-12-9 (SI2), YN-12-10(CT3),
and YN-12-13(CT3) were studied with an EPMA-1600 at
the China University of Geosciences Geological Labora-
tory Center with a focused electron beam (1–2 lm in
diameter), a specimen current of 20 nA, and an accelera-
tion voltage of 15 kV. EPMA-1600 made by Shimadzu
Corporation can perform highly sensitive elemental ana-
lysis of microareas of samples. The plagioclase megacrysts
were selected for detailed core-to-rim electron microprobe
analysis. Sample YN-11-191 (a CT boulder from the Da-
qiao section with clustered touching plagioclase mega-
crysts) was treated for accuracy. The microprobe analysis
was carried out using an electron probe model JXA-8100 at
Fig. 3 Textural stratigraphic
and sampling column of the
giant plagioclase basalt flows of
the Daqiao section. Five GPB
flows and the studied samples
from the volcanic section are
shown. The phenocryst contents
were estimated in the field
without quantitative statistics
and might not be accurate.
a Representative photograph of
GPBs in the flow CT3. b Single
isolated plagioclase megacrysts
show a good alignment of the
crystals in flow SI2. c GPBs
have the low crystal content and
clustered touching crystals in
flow CT2. d The contact is
curved between flow CT1 and
flow SI1, and volcanic
weathering crust can be found
along the contact. The coin for
scale is *2.5 cm in diameter
Contrib Mineral Petrol (2014) 167:971 Page 5 of 20 971
123
the Beijing Research Institute of Uranium Geology. The
probe had a focused electron beam (1–2 lm in diameter), a
specimen current of 20 nA, and an acceleration voltage of
15 kV. Five plagioclase megacrysts in these samples were
analyzed.
Crystal size distribution measurements
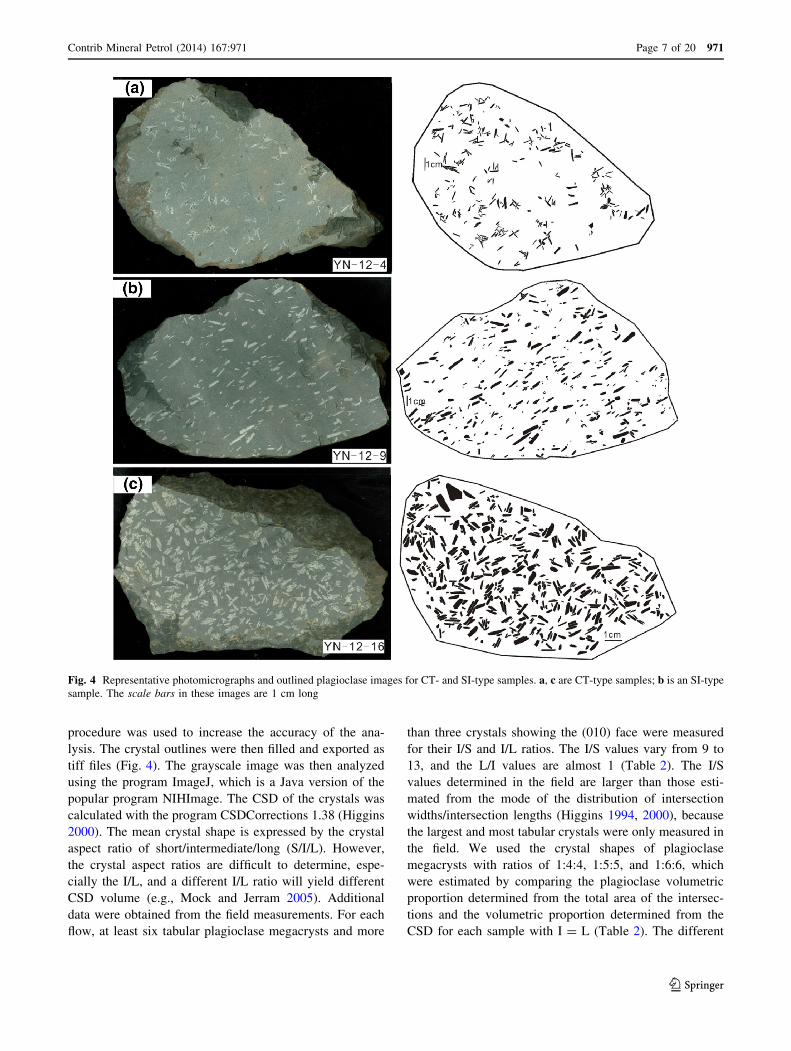
Eleven samples mainly from these five flows were col-
lected for quantitative textural analysis. Rock samples
10–20 cm squares were used for textural analysis following
the methods of Higgins and Chandrasekharam (2007). The
samples were slabbed normal to the foliation and polished.
The slabs were scanned using a conventional document
scanner, and the crystal margins were manually outlined
with a vector drafting program (CorelDraw). The smallest
megacrysts are typically 0.25–1.5 mm long, which is much
larger than the plagioclase in the matrix. The lower limit of
the CSD is approximately 0.25 mm, so it is not difficult to
distinguish between megacrysts and the matrix plagioclase.
For touching crystals in the CT-type samples, the complete
plagioclase megacrysts were identified by choosing the
larger or more euhedral crystal; the other touching crystals
were outlined as the incomplete megacrysts. This
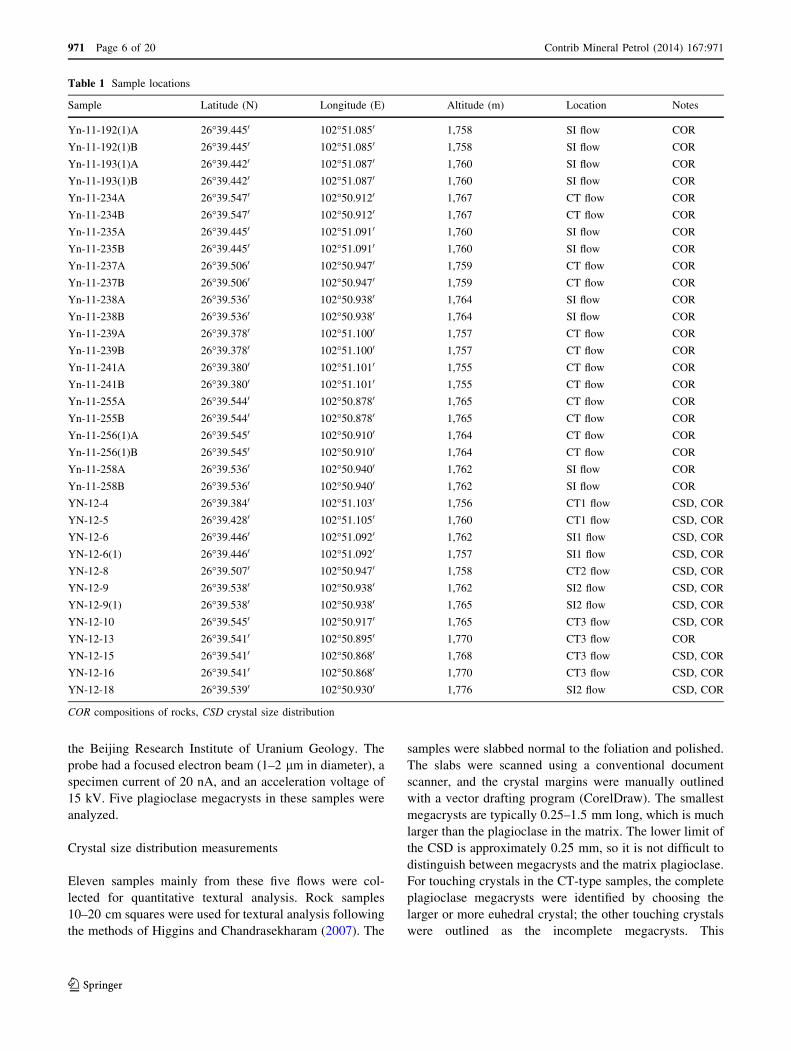
Table 1 Sample locations
Sample Latitude (N) Longitude (E) Altitude (m) Location Notes
Yn-11-192(1)A 26�39.4450 102�51.0850 1,758 SI flow COR
Yn-11-192(1)B 26�39.4450 102�51.0850 1,758 SI flow COR
Yn-11-193(1)A 26�39.4420 102�51.0870 1,760 SI flow COR
Yn-11-193(1)B 26�39.4420 102�51.0870 1,760 SI flow COR
Yn-11-234A 26�39.5470 102�50.9120 1,767 CT flow COR
Yn-11-234B 26�39.5470 102�50.9120 1,767 CT flow COR
Yn-11-235A 26�39.4450 102�51.0910 1,760 SI flow COR
Yn-11-235B 26�39.4450 102�51.0910 1,760 SI flow COR
Yn-11-237A 26�39.5060 102�50.9470 1,759 CT flow COR
Yn-11-237B 26�39.5060 102�50.9470 1,759 CT flow COR
Yn-11-238A 26�39.5360 102�50.9380 1,764 SI flow COR
Yn-11-238B 26�39.5360 102�50.9380 1,764 SI flow COR
Yn-11-239A 26�39.3780 102�51.1000 1,757 CT flow COR
Yn-11-239B 26�39.3780 102�51.1000 1,757 CT flow COR
Yn-11-241A 26�39.3800 102�51.1010 1,755 CT flow COR
Yn-11-241B 26�39.3800 102�51.1010 1,755 CT flow COR
Yn-11-255A 26�39.5440 102�50.8780 1,765 CT flow COR
Yn-11-255B 26�39.5440 102�50.8780 1,765 CT flow COR
Yn-11-256(1)A 26�39.5450 102�50.9100 1,764 CT flow COR
Yn-11-256(1)B 26�39.5450 102�50.9100 1,764 CT flow COR
Yn-11-258A 26�39.5360 102�50.9400 1,762 SI flow COR
Yn-11-258B 26�39.5360 102�50.9400 1,762 SI flow COR
YN-12-4 26�39.3840 102�51.1030 1,756 CT1 flow CSD, COR
YN-12-5 26�39.4280 102�51.1050 1,760 CT1 flow CSD, COR
YN-12-6 26�39.4460 102�51.0920 1,762 SI1 flow CSD, COR
YN-12-6(1) 26�39.4460 102�51.0920 1,757 SI1 flow CSD, COR
YN-12-8 26�39.5070 102�50.9470 1,758 CT2 flow CSD, COR
YN-12-9 26�39.5380 102�50.9380 1,762 SI2 flow CSD, COR
YN-12-9(1) 26�39.5380 102�50.9380 1,765 SI2 flow CSD, COR
YN-12-10 26�39.5450 102�50.9170 1,765 CT3 flow CSD, COR
YN-12-13 26�39.5410 102�50.8950 1,770 CT3 flow COR
YN-12-15 26�39.5410 102�50.8680 1,768 CT3 flow CSD, COR
YN-12-16 26�39.5410 102�50.8680 1,770 CT3 flow CSD, COR
YN-12-18 26�39.5390 102�50.9300 1,776 SI2 flow CSD, COR
COR compositions of rocks, CSD crystal size distribution
971 Page 6 of 20 Contrib Mineral Petrol (2014) 167:971
123
procedure was used to increase the accuracy of the ana-
lysis. The crystal outlines were then filled and exported as
tiff files (Fig. 4). The grayscale image was then analyzed
using the program ImageJ, which is a Java version of the
popular program NIHImage. The CSD of the crystals was
calculated with the program CSDCorrections 1.38 (Higgins
2000). The mean crystal shape is expressed by the crystal
aspect ratio of short/intermediate/long (S/I/L). However,
the crystal aspect ratios are difficult to determine, espe-
cially the I/L, and a different I/L ratio will yield different
CSD volume (e.g., Mock and Jerram 2005). Additional
data were obtained from the field measurements. For each
flow, at least six tabular plagioclase megacrysts and more
than three crystals showing the (010) face were measured
for their I/S and I/L ratios. The I/S values vary from 9 to
13, and the L/I values are almost 1 (Table 2). The I/S
values determined in the field are larger than those esti-
mated from the mode of the distribution of intersection
widths/intersection lengths (Higgins 1994, 2000), because
the largest and most tabular crystals were only measured in
the field. We used the crystal shapes of plagioclase
megacrysts with ratios of 1:4:4, 1:5:5, and 1:6:6, which
were estimated by comparing the plagioclase volumetric
proportion determined from the total area of the intersec-
tions and the volumetric proportion determined from the
CSD for each sample with I = L (Table 2). The different
Fig. 4 Representative photomicrographs and outlined plagioclase images for CT- and SI-type samples. a, c are CT-type samples; b is an SI-type
sample. The scale bars in these images are 1 cm long
Contrib Mineral Petrol (2014) 167:971 Page 7 of 20 971
123
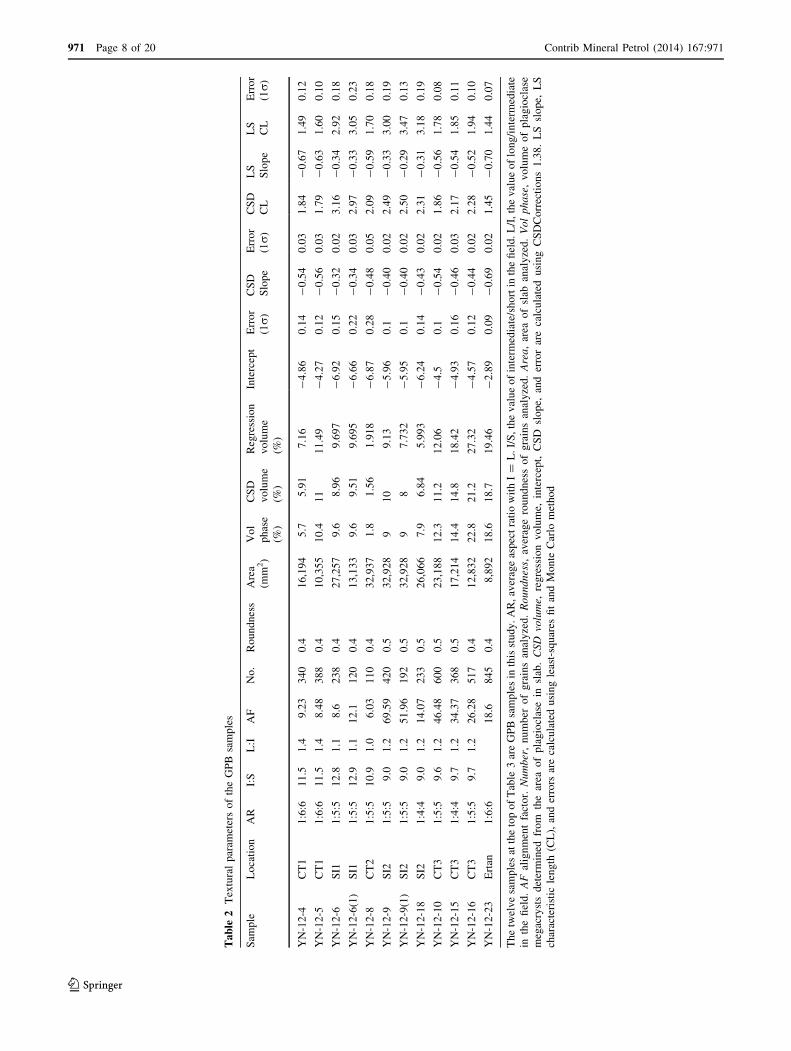
Ta
ble
2T
extu
ral
par
amet
ers
of
the
GP
Bsa
mp
les
Sam
ple
Lo
cati
on
AR
I:S
L:I
AF
No
.R
ou
nd
nes
sA
rea
(mm
2)
Vo
l
ph
ase
(%)
CS
D
vo
lum
e
(%)
Reg
ress
ion
vo
lum
e
(%)
Inte
rcep
tE
rro
r
(1r
)
CS
D
Slo
pe
Err
or
(1r
)
CS
D
CL
LS
Slo
pe
LS
CL
Err
or
(1r
)
YN
-12
-4C
T1
1:6
:61
1.5
1.4
9.2
33
40
0.4
16
,19
45
.75
.91
7.1
6-
4.8
60
.14
-0
.54
0.0
31
.84
-0
.67
1.4
90
.12
YN
-12
-5C
T1
1:6
:61
1.5
1.4
8.4
83
88
0.4
10
,35
51
0.4
11
11
.49
-4
.27
0.1
2-
0.5
60
.03
1.7
9-
0.6
31
.60
0.1
0
YN
-12
-6S
I11
:5:5
12
.81
.18
.62
38
0.4
27
,25
79
.68
.96
9.6
97
-6
.92
0.1
5-
0.3
20
.02
3.1
6-
0.3
42
.92
0.1
8
YN
-12
-6(1
)S
I11
:5:5
12
.91
.11
2.1
12
00
.41
3,1
33
9.6
9.5
19
.69
5-
6.6
60
.22
-0
.34
0.0
32
.97
-0
.33
3.0
50
.23
YN
-12
-8C
T2
1:5
:51
0.9
1.0
6.0
31
10
0.4
32
,93
71
.81
.56
1.9
18
-6
.87
0.2
8-
0.4
80
.05
2.0
9-
0.5
91
.70
0.1
8
YN
-12
-9S
I21
:5:5
9.0
1.2
69
.59
42
00
.53
2,9
28
91
09
.13
-5
.96
0.1
-0
.40
0.0
22
.49
-0
.33
3.0
00
.19
YN
-12
-9(1
)S
I21
:5:5
9.0
1.2
51
.96
19
20
.53
2,9
28
98
7.7
32
-5
.95
0.1
-0
.40
0.0
22
.50
-0
.29
3.4
70
.13
YN
-12
-18
SI2
1:4
:49
.01
.21
4.0
72
33
0.5
26
,06
67
.96
.84
5.9
93
-6
.24
0.1
4-
0.4
30
.02
2.3
1-
0.3
13
.18
0.1
9
YN
-12
-10
CT
31
:5:5
9.6
1.2
46
.48
60
00
.52
3,1
88
12
.31
1.2
12
.06
-4
.50
.1-
0.5
40
.02
1.8
6-
0.5
61
.78
0.0
8
YN
-12
-15
CT
31
:4:4
9.7
1.2
34
.37
36
80
.51
7,2
14
14
.41
4.8
18
.42
-4
.93
0.1
6-
0.4
60
.03
2.1
7-
0.5
41
.85
0.1
1
YN
-12
-16
CT
31
:5:5
9.7
1.2
26
.28
51
70
.41
2,8
32
22
.82
1.2
27
.32
-4
.57
0.1
2-
0.4
40
.02
2.2
8-
0.5
21
.94
0.1
0
YN
-12
-23
Ert
an1
:6:6
18
.68
45
0.4
8,8
92
18
.61
8.7
19
.46
-2
.89
0.0
9-
0.6
90
.02
1.4
5-
0.7
01
.44
0.0
7
Th
etw
elv
esa
mp
les
atth
eto
po
fT
able
3ar
eG
PB
sam
ple
sin
this
stu
dy
.A
R,
aver
age
asp
ect
rati
ow
ith
I=
L.
I/S
,th
ev
alu
eo
fin
term
edia
te/s
ho
rtin
the
fiel
d.
L/I
,th
ev
alu
eo
flo
ng
/in
term
edia
te
inth
efi
eld
.A
Fal
ign
men
tfa
cto
r.N
um
ber
,n
um
ber
of
gra
ins
anal
yze
d.
Ro
un
dn
ess,
aver
age
rou
nd
nes
so
fg
rain
san
aly
zed
.A
rea
,ar
eao
fsl
aban
aly
zed
.V
ol
ph
ase
,v
olu
me
of
pla
gio
clas
e
meg
acry
sts
det
erm
ined
fro
mth
ear
eao
fp
lag
iocl
ase
insl
ab.
CS
Dvo
lum
e,re
gre
ssio
nv
olu
me,
inte
rcep
t,C
SD
slo
pe,
and
erro
rar
eca
lcu
late
du
sin
gC
SD
Co
rrec
tio
ns
1.3
8.
LS
slo
pe,
LS
char
acte
rist
icle
ng
th(C
L),
and
erro
rsar
eca
lcu
late
du
sin
gle
ast-
squ
ares
fit
and
Mo
nte
Car
lom
eth
od
971 Page 8 of 20 Contrib Mineral Petrol (2014) 167:971
123

values of S/I only affect the tailing corrections (Higgins
2000). The crystals were considered to have a roundness of
0.4 or 0.5.
The orientations of the crystal outlines were also mea-
sured. The alignment factor (AF) of the plagioclase
megacrysts of all samples was used to describe the degree
of agreement of the crystal orientation, which was calcu-
lated on the 40 largest grains in each sample following
Boorman et al. (2004)) and Williams et al. (2006):. The AF
has a maximum value of 100 for perfectly aligned crystals,
whereas massive rocks have an AF value of zero.
Results
Bulk-rock major and trace element composition
A total of 445 whole-rock major content measurements of
Emeishan basalts, trachyte and 95 whole-rock major
content measurements of Emeishan picrites were extracted
from the GEOROC database (http://georoc.mpch-mainz.
gwdg.de). Most of the picrites are from the western part of
the Emeishan LIP, such as the Binchuan area and the Li-
jiang area (e.g., Kamenetsky et al. 2012; ZHANG et al.
2006). The MgO contents of the Emeishan basalts range
from 2.3 to 14.2 wt%, and the MgO contents of the GPBs
in this study range from 3.9 to 5.8 wt%, suggesting that the
GPBs of Emeishan LIP belong to low-Mg basalt (Fig. 5).
The TiO2 contents vary from 3.0 to 4.6 wt%, and the Ti/Y
ratios range from 508 to 691, indicating that they are high-
Ti basalts (HT; with Ti/Y [ 500 and TiO2 [ 2.6 wt%)
(Ukstins Peate and Bryan 2008; Xiao et al. 2004). The
GPBs have Fe2O3total contents of 11.5–15.2 wt% (ESM
Table 3). Figure 5 shows that the CT-type and SI-type
samples have similar major element compositions. Plots of
Al2O3, Fe2O3total, and Na2O ? K2O versus MgO illustrate
that these elements have the largest range of all the
Emeishan basalts. The data show that these two types of
Fig. 5 Variation of SiO2, TiO2,
Al2O3, Fe2O3total, CaO, and
Na2O ? K2O versus MgO for
the Emeishan GPBs. Offwhite
and gray areas represent
compositions for all the basalts,
trachyte and picritic,
respectively. The stars and
hexagons represent
compositions for CT- and SI-
type GPBs, respectively
Contrib Mineral Petrol (2014) 167:971 Page 9 of 20 971
123

GPBs might not be primary mantle melts and have com-
position that is far different from those expected of melts
that are in equilibrium with mantle peridotites. They are
significantly more evolved, but they could not have been
derived from the picrites through simple fraction processes.
The total rare earth element (REE) of the CT-type GPBs
ranges from 203 to 292 ppm, and the REE of the SI-type
GPBs ranges from 151 to 339 ppm. The La/Yb ratios of the
CT-type GPBs range from 7.5 to 9.3, while the SI-type
GPBs range from 8.1 to 9.0. The Eu/Eu* of the CT-type
GPBs ranges from 0.90 to 1.01, while the SI-type GPBs
range from 0.88 to 1.02. The REE patterns and primitive
mantle-normalized spider diagrams are shown in Fig. 6.
Some low MgO basalts (\6 wt%) containing high-Ti and
low-Ti basalts were collected, which are all from Binchuan
area in the western part of the Emeishan LIP (Xiao et al.
2004). The two types of GPBs have similar trace elements,
are strongly enriched with incompatible trace elements,
and display negative Sr anomaly, which are similar to the
high-Ti low-Mg basalts, rather than low-Ti low-Mg basalts
in Emeishan LIP (Fig. 6).
Mineral composition
The GPBs contain a major population of plagioclase
megacrysts, and most are weakly zoned or unzoned. SI-
type basalts contain abundant phenocrysts composed of
plagioclase megacrysts (9–15 vol%) and clinopyroxene
(1–3 vol%). Plagioclase (An52–55Ab42–45Or2–3) commonly
occurs as coarse-grained, tabular crystals between 10 and
20 mm long. The isolated plagioclase megacrysts of the SI-
type basalts are generally euhedral without significant
resorption zones. Clinopyroxene (En46Fs18Wo36) occurs as
anhedral crystals with diameters ranging from 0.2 to
Fig. 6 a Chondrite-normalized REE patterns of the CT-type GPBs.
b Chondrite-normalized REE patterns of the SI-type GPBs. c Prim-
itive mantle-normalized trace element patterns of the CT-type GPBs.
d Primitive mantle-normalized trace element patterns of the SI-type
GPBs. Normalization values are from Sun and McDonough (1989).
Offwhite and gray areas represent compositions for all the high-Ti and
low-Mg basalts (HL basalts) and low-Ti and low-Mg basalts (LL
basalts), respectively. The low basalt data were collected from Xiao
et al. (2004)
971 Page 10 of 20 Contrib Mineral Petrol (2014) 167:971
123
1.5 mm. The CT-type basalts also contain abundant
phenocrysts composed of plagioclase megacrysts
(9–25 vol%) and clinopyroxene (1–5 vol%). However,
most of the plagioclase (An52–59Ab39–45Or2–3) crystals that
are 2 to 5 mm touch each other; the touching lines can be
found in Fig. 2e. The clinopyroxene crystals are commonly
anhedral and vary in size from 0.2 to 1.5 mm. They occur
either between touching plagioclase crystals or as isolated
crystals. The groundmass is predominantly composed of
plagioclase (50–60 %), plagioclase microlites (35–45 %),
and Ti–Fe oxides (3–5 %). The plagioclase in the matrix is
much smaller than 1 mm. The inferred crystallization
sequence based on the textures is plagioclase ?plagioclase ? clinopyroxene.
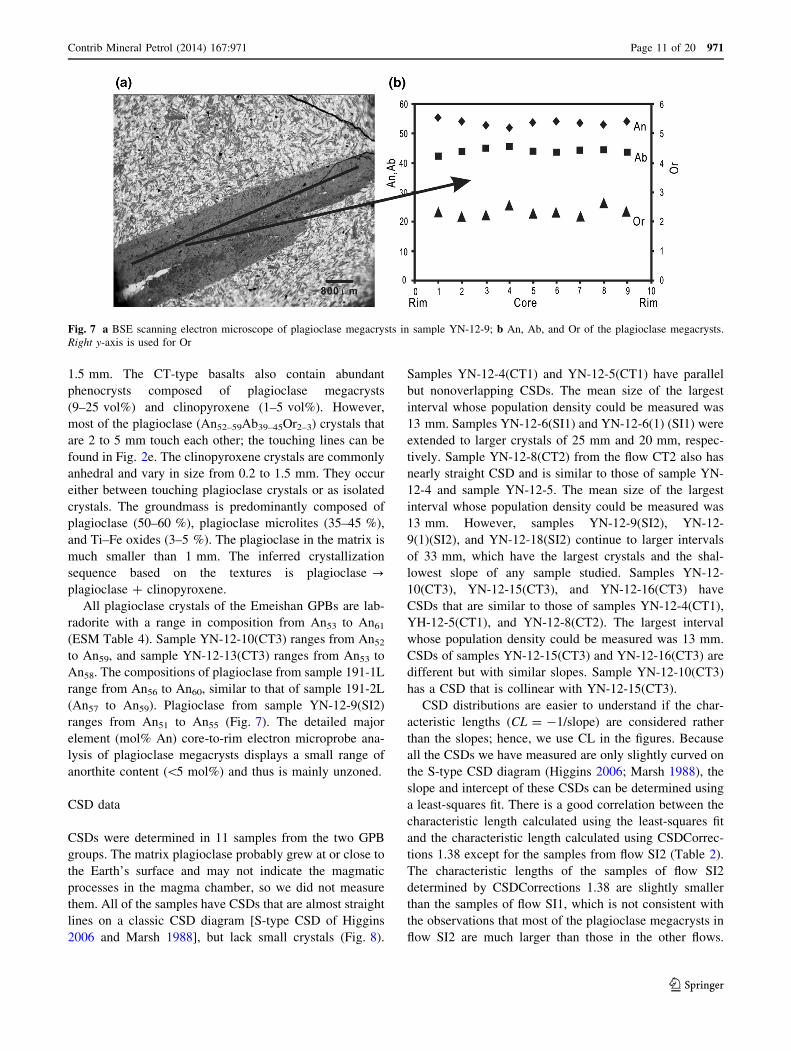
All plagioclase crystals of the Emeishan GPBs are lab-
radorite with a range in composition from An53 to An61
(ESM Table 4). Sample YN-12-10(CT3) ranges from An52
to An59, and sample YN-12-13(CT3) ranges from An53 to
An58. The compositions of plagioclase from sample 191-1L
range from An56 to An60, similar to that of sample 191-2L
(An57 to An59). Plagioclase from sample YN-12-9(SI2)
ranges from An51 to An55 (Fig. 7). The detailed major
element (mol% An) core-to-rim electron microprobe ana-
lysis of plagioclase megacrysts displays a small range of
anorthite content (\5 mol%) and thus is mainly unzoned.
CSD data
CSDs were determined in 11 samples from the two GPB
groups. The matrix plagioclase probably grew at or close to
the Earth’s surface and may not indicate the magmatic
processes in the magma chamber, so we did not measure
them. All of the samples have CSDs that are almost straight
lines on a classic CSD diagram [S-type CSD of Higgins
2006 and Marsh 1988], but lack small crystals (Fig. 8).
Samples YN-12-4(CT1) and YN-12-5(CT1) have parallel
but nonoverlapping CSDs. The mean size of the largest
interval whose population density could be measured was
13 mm. Samples YN-12-6(SI1) and YN-12-6(1) (SI1) were
extended to larger crystals of 25 mm and 20 mm, respec-
tively. Sample YN-12-8(CT2) from the flow CT2 also has
nearly straight CSD and is similar to those of sample YN-
12-4 and sample YN-12-5. The mean size of the largest
interval whose population density could be measured was
13 mm. However, samples YN-12-9(SI2), YN-12-
9(1)(SI2), and YN-12-18(SI2) continue to larger intervals
of 33 mm, which have the largest crystals and the shal-
lowest slope of any sample studied. Samples YN-12-
10(CT3), YN-12-15(CT3), and YN-12-16(CT3) have
CSDs that are similar to those of samples YN-12-4(CT1),
YH-12-5(CT1), and YN-12-8(CT2). The largest interval
whose population density could be measured was 13 mm.
CSDs of samples YN-12-15(CT3) and YN-12-16(CT3) are
different but with similar slopes. Sample YN-12-10(CT3)
has a CSD that is collinear with YN-12-15(CT3).
CSD distributions are easier to understand if the char-
acteristic lengths (CL = -1/slope) are considered rather
than the slopes; hence, we use CL in the figures. Because
all the CSDs we have measured are only slightly curved on
the S-type CSD diagram (Higgins 2006; Marsh 1988), the
slope and intercept of these CSDs can be determined using
a least-squares fit. There is a good correlation between the
characteristic length calculated using the least-squares fit
and the characteristic length calculated using CSDCorrec-
tions 1.38 except for the samples from flow SI2 (Table 2).
The characteristic lengths of the samples of flow SI2
determined by CSDCorrections 1.38 are slightly smaller
than the samples of flow SI1, which is not consistent with
the observations that most of the plagioclase megacrysts in
flow SI2 are much larger than those in the other flows.
Fig. 7 a BSE scanning electron microscope of plagioclase megacrysts in sample YN-12-9; b An, Ab, and Or of the plagioclase megacrysts.
Right y-axis is used for Or
Contrib Mineral Petrol (2014) 167:971 Page 11 of 20 971
123

Thus, the characteristic length calculated by the least-
squares fit will be used in this study.
Alignment factor
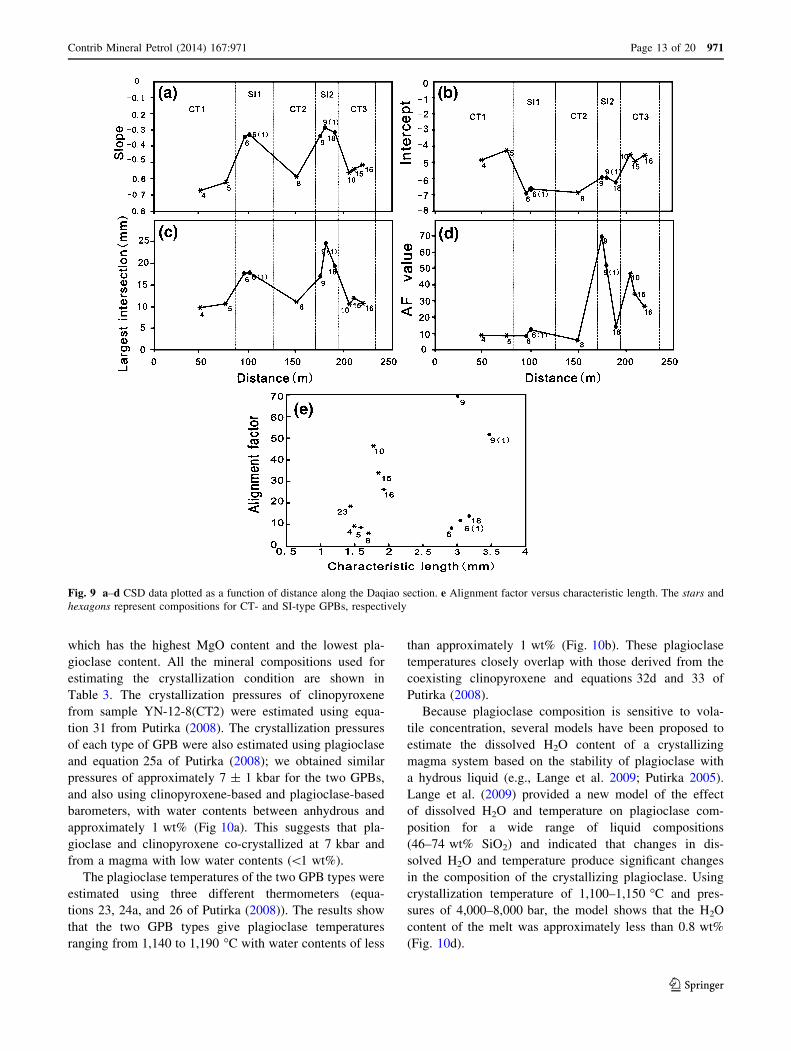
The alignment factor (AF) of all of the samples is shown in
Table 2. The AF data show a moderately well-developed
foliation of the larger crystals in most of the samples,
which may reflect magma transport and emplacement on
the Earth’s surface. However, if the crystal mush was
transported from the magma chamber by laminar flow, the
relative orientation of the crystals could be preserved. The
AF values of the CT-type and SI-type flows range from 6.0
to 46.5 and from 8.6 to 70.0, respectively. The samples
from the same flow can have significantly different align-
ment factors, such as samples YN-12-9(SI2), YN-12-
9(1)(SI2), and YN-12-18(SI2) (Fig. 9). However, sample
YN-12-8 from flow CT3 has the lowest plagioclase content
as well as the lowest alignment factor. The absence of a
significant correlation between crystal shape and AF value
suggests that the transport was turbulent. Moreover, there
are no correlations between the rare earth element (REE)
contents and the volume of plagioclase in the section (Vol
phase) or AF value, which indicates that the variation of
plagioclase volume fraction and magmatic flow does not
control the fractionation of these trace elements.
Discussion
P–T–H2O–Fo2 condition of crystallization
We assume that the composition of the melt is represented
by the bulk-rock composition of sample YN-12-8(CT2),
Fig. 8 Crystal size distributions of five flows of the Daqiao section. Most of the CSDs are nearly straight, and no crystals are smaller than
1.2 mm
971 Page 12 of 20 Contrib Mineral Petrol (2014) 167:971
123
which has the highest MgO content and the lowest pla-
gioclase content. All the mineral compositions used for
estimating the crystallization condition are shown in
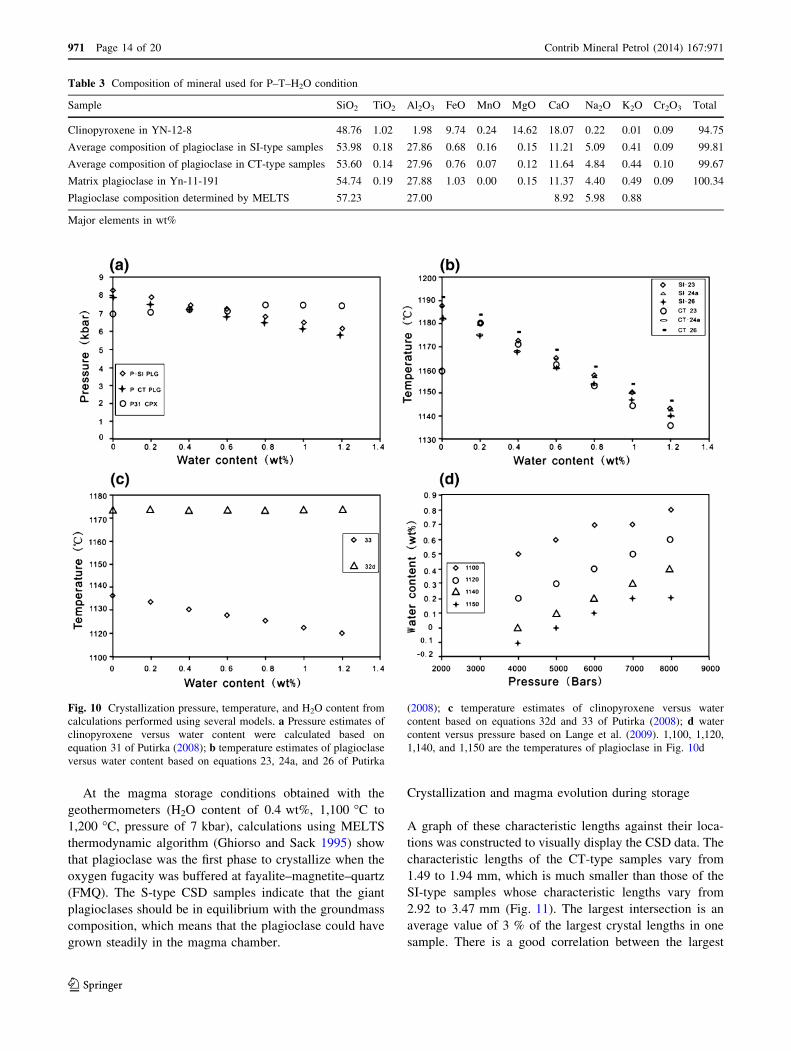
Table 3. The crystallization pressures of clinopyroxene
from sample YN-12-8(CT2) were estimated using equa-
tion 31 from Putirka (2008). The crystallization pressures
of each type of GPB were also estimated using plagioclase
and equation 25a of Putirka (2008); we obtained similar
pressures of approximately 7 ± 1 kbar for the two GPBs,
and also using clinopyroxene-based and plagioclase-based
barometers, with water contents between anhydrous and
approximately 1 wt% (Fig 10a). This suggests that pla-
gioclase and clinopyroxene co-crystallized at 7 kbar and
from a magma with low water contents (\1 wt%).
The plagioclase temperatures of the two GPB types were
estimated using three different thermometers (equa-
tions 23, 24a, and 26 of Putirka (2008)). The results show
that the two GPB types give plagioclase temperatures
ranging from 1,140 to 1,190 �C with water contents of less
than approximately 1 wt% (Fig. 10b). These plagioclase
temperatures closely overlap with those derived from the
coexisting clinopyroxene and equations 32d and 33 of
Putirka (2008).
Because plagioclase composition is sensitive to vola-
tile concentration, several models have been proposed to
estimate the dissolved H2O content of a crystallizing
magma system based on the stability of plagioclase with
a hydrous liquid (e.g., Lange et al. 2009; Putirka 2005).
Lange et al. (2009) provided a new model of the effect
of dissolved H2O and temperature on plagioclase com-
position for a wide range of liquid compositions
(46–74 wt% SiO2) and indicated that changes in dis-
solved H2O and temperature produce significant changes
in the composition of the crystallizing plagioclase. Using
crystallization temperature of 1,100–1,150 �C and pres-
sures of 4,000–8,000 bar, the model shows that the H2O
content of the melt was approximately less than 0.8 wt%
(Fig. 10d).
Fig. 9 a–d CSD data plotted as a function of distance along the Daqiao section. e Alignment factor versus characteristic length. The stars and
hexagons represent compositions for CT- and SI-type GPBs, respectively
Contrib Mineral Petrol (2014) 167:971 Page 13 of 20 971
123
At the magma storage conditions obtained with the
geothermometers (H2O content of 0.4 wt%, 1,100 �C to
1,200 �C, pressure of 7 kbar), calculations using MELTS
thermodynamic algorithm (Ghiorso and Sack 1995) show
that plagioclase was the first phase to crystallize when the
oxygen fugacity was buffered at fayalite–magnetite–quartz
(FMQ). The S-type CSD samples indicate that the giant
plagioclases should be in equilibrium with the groundmass
composition, which means that the plagioclase could have
grown steadily in the magma chamber.
Crystallization and magma evolution during storage
A graph of these characteristic lengths against their loca-
tions was constructed to visually display the CSD data. The
characteristic lengths of the CT-type samples vary from
1.49 to 1.94 mm, which is much smaller than those of the
SI-type samples whose characteristic lengths vary from
2.92 to 3.47 mm (Fig. 11). The largest intersection is an
average value of 3 % of the largest crystal lengths in one
sample. There is a good correlation between the largest
Table 3 Composition of mineral used for P–T–H2O condition
Sample SiO2 TiO2 Al2O3 FeO MnO MgO CaO Na2O K2O Cr2O3 Total
Clinopyroxene in YN-12-8 48.76 1.02 1.98 9.74 0.24 14.62 18.07 0.22 0.01 0.09 94.75
Average composition of plagioclase in SI-type samples 53.98 0.18 27.86 0.68 0.16 0.15 11.21 5.09 0.41 0.09 99.81
Average composition of plagioclase in CT-type samples 53.60 0.14 27.96 0.76 0.07 0.12 11.64 4.84 0.44 0.10 99.67
Matrix plagioclase in Yn-11-191 54.74 0.19 27.88 1.03 0.00 0.15 11.37 4.40 0.49 0.09 100.34
Plagioclase composition determined by MELTS 57.23 27.00 8.92 5.98 0.88
Major elements in wt%
Fig. 10 Crystallization pressure, temperature, and H2O content from
calculations performed using several models. a Pressure estimates of
clinopyroxene versus water content were calculated based on
equation 31 of Putirka (2008); b temperature estimates of plagioclase
versus water content based on equations 23, 24a, and 26 of Putirka
(2008); c temperature estimates of clinopyroxene versus water
content based on equations 32d and 33 of Putirka (2008); d water
content versus pressure based on Lange et al. (2009). 1,100, 1,120,
1,140, and 1,150 are the temperatures of plagioclase in Fig. 10d
971 Page 14 of 20 Contrib Mineral Petrol (2014) 167:971
123
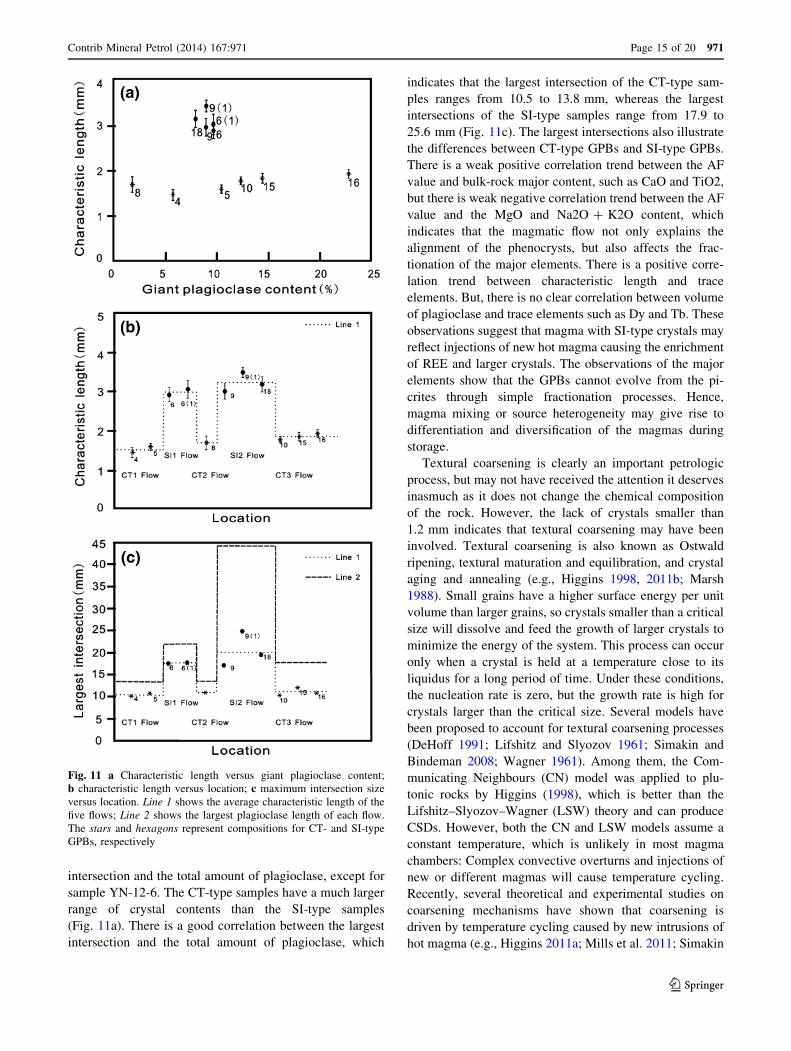
intersection and the total amount of plagioclase, except for
sample YN-12-6. The CT-type samples have a much larger
range of crystal contents than the SI-type samples
(Fig. 11a). There is a good correlation between the largest
intersection and the total amount of plagioclase, which
indicates that the largest intersection of the CT-type sam-
ples ranges from 10.5 to 13.8 mm, whereas the largest
intersections of the SI-type samples range from 17.9 to
25.6 mm (Fig. 11c). The largest intersections also illustrate
the differences between CT-type GPBs and SI-type GPBs.
There is a weak positive correlation trend between the AF
value and bulk-rock major content, such as CaO and TiO2,
but there is weak negative correlation trend between the AF
value and the MgO and Na2O ? K2O content, which
indicates that the magmatic flow not only explains the
alignment of the phenocrysts, but also affects the frac-
tionation of the major elements. There is a positive corre-
lation trend between characteristic length and trace
elements. But, there is no clear correlation between volume
of plagioclase and trace elements such as Dy and Tb. These
observations suggest that magma with SI-type crystals may
reflect injections of new hot magma causing the enrichment
of REE and larger crystals. The observations of the major
elements show that the GPBs cannot evolve from the pi-
crites through simple fractionation processes. Hence,
magma mixing or source heterogeneity may give rise to
differentiation and diversification of the magmas during
storage.
Textural coarsening is clearly an important petrologic
process, but may not have received the attention it deserves
inasmuch as it does not change the chemical composition
of the rock. However, the lack of crystals smaller than
1.2 mm indicates that textural coarsening may have been
involved. Textural coarsening is also known as Ostwald
ripening, textural maturation and equilibration, and crystal
aging and annealing (e.g., Higgins 1998, 2011b; Marsh
1988). Small grains have a higher surface energy per unit
volume than larger grains, so crystals smaller than a critical
size will dissolve and feed the growth of larger crystals to
minimize the energy of the system. This process can occur
only when a crystal is held at a temperature close to its
liquidus for a long period of time. Under these conditions,
the nucleation rate is zero, but the growth rate is high for
crystals larger than the critical size. Several models have
been proposed to account for textural coarsening processes
(DeHoff 1991; Lifshitz and Slyozov 1961; Simakin and
Bindeman 2008; Wagner 1961). Among them, the Com-
municating Neighbours (CN) model was applied to plu-
tonic rocks by Higgins (1998), which is better than the
Lifshitz–Slyozov–Wagner (LSW) theory and can produce
CSDs. However, both the CN and LSW models assume a
constant temperature, which is unlikely in most magma
chambers: Complex convective overturns and injections of
new or different magmas will cause temperature cycling.
Recently, several theoretical and experimental studies on
coarsening mechanisms have shown that coarsening is
driven by temperature cycling caused by new intrusions of
hot magma (e.g., Higgins 2011a; Mills et al. 2011; Simakin
Fig. 11 a Characteristic length versus giant plagioclase content;
b characteristic length versus location; c maximum intersection size
versus location. Line 1 shows the average characteristic length of the
five flows; Line 2 shows the largest plagioclase length of each flow.
The stars and hexagons represent compositions for CT- and SI-type
GPBs, respectively
Contrib Mineral Petrol (2014) 167:971 Page 15 of 20 971
123

and Bindeman 2008). In the CN coarsening model, when
the system is closed and the volumetric proportion of the
phase is constant, the plagioclase volume in samples of
different flows changes. These observations indicate that
the magma chamber was open and that magma mixing was
an important process in the Emeishan LIP. Hence, textural
coarsening of plagioclase megacrysts was likely driven by
temperature cycling.
Residence time, eruption duration, and eruption rate
Marsh (1988) showed that the CSDs of steady-state system
are S-type and that the mean residence time of a crystal can
be calculated using the characteristic length/growth rate.
Thus, the accuracy and error of the residence time depends
on that of the characteristic length and growth rate. The
errors of the characteristic lengths in this study are all less
than 0.23 mm, which means that the influence of charac-
teristic length on the residence time is limited (Table 2).
Experimental and CSD studies indicate that the growth
rates of plagioclase in undercooling conditions in magma
chambers are consistently between 10-11 and 10-9 mm/s
(e.g., Cashman 1993; Cashman and Marsh 1988; Higgins
2006). Conditions typical of lava flows would give a
growth rate of 10-9 mm/s, and conditions typical of a
subvolcanic magma chamber or magma at greater depths
would yield growth rates of 10-11 to 10-10 mm/s. A pla-
gioclase growth rate of 10-10 mm/s was selected as the
maximum value for a subvolcanic magma chamber in the
Deccan province (Higgins and Chandrasekharam 2007).
The growth rate will depend on the magma temperature
and the cooling rate. We suggest that the two types of
GPBs in this study have different growth rates because of
the different degrees of undercooling. Thus, the entire
range of growth rates for plagioclase megacrysts (10-11 to
10-10 mm/s) was used to calculate the residence times. The
results show that the residence times are 489–4,890 years,
947–9,470 years, 539–5,390 years, 1,020–10,200 years,
and 588–5,880 years. The plagioclase megacrysts of the
CT-type samples have residence times of approximately
489–5,880 years, and those of SI-type samples are
947–10,200 years, which is similar to the magma residence
times of 500–1,500 years that were suggested by quanti-
tative studies of plagioclase megacrysts in GPBs of the
Deccan Traps using a plagioclase growth rate of
10-10 mm/s (Higgins and Chandrasekharam 2007).
The largest plagioclase length and largest intersections
provide evidence for an increase in the characteristic length
of plagioclase megacrysts over time (Fig. 11). An eruption
cycle, or the time between two eruptions from a subvol-
canic magma chamber, is equal to the time for the pla-
gioclase megacrysts to grow from a characteristic length A
(CLA) to a characteristic length B (CLB). Assuming that
plagioclase grows at the same rate, the cycle time between
the two eruptions is equal to (CLB - CLA)/growth rate,
and the cycle time should be compatible with the longest-
duration eruption of the magma that forms the middle
flows. If the errors of the characteristic lengths are not
taken into account, the longest-duration eruptions of flow
SI1, flow CT2, and flow SI2 are 50–500, 73–730, and
49–490 years, respectively. Using the thicknesses of flow
SI1, flow CT2, and flow SI2, the relevant one-dimensional
eruption rates are 0.043–0.43, 0.018–0.18, and
0.036–0.36 m/year, respectively. As mentioned above,
Binchuan area has the 5,384-m-thick Permian volcanic
succession where the complete composite section consists
of six units (Xiao et al. 2004). The aphyric basalt may have
erupted directly without much residence in a subvolcanic
system and thus may have a faster eruption rate. Thus, if
the Permian basalts of Binchuan area erupt at one time, it
may form within 299,111 years using the lowest rate of
0.018 m/year.
Possible origin of crystal clusters and pulsatory magma
eruption in Emeishan LIP
The magmatic processes that occur in the crust can be
complex. Most large-volume flood basalt magmas are
stored at crustal levels to produce aphyric to plagioclase-
dominant basaltic and basaltic andesite lavas (Bryan et al.
2010). GPBs are present in many large volcanic provinces,
such as the Emeishan LIP and the Deccan Traps. An
emplacement model for the GPBs of the Deccan Traps was
proposed by Higgins and Chandrasekharam (2007). This
new study combines quantitative textural measurements
and geochemical data and allows us to propose the fol-
lowing magma storage including physical and chemical
processes in the Emeishan LIP.
Higgins and Chandrasekharam (2007) suggest that the
clustered touching plagioclase crystals may grow in a
higher-level static environment and nucleate much later
than SI-type GPBs (Higgins and Chandrasekharam 2007).
Our results show that the crystallization pressures of the
two types of GPBs are similar, although the estimate of
pressure may only be accurate to within 3 kbar (Putirka
2008). The two types of GPBs have very similar bulk-rock
compositions and mineral compositions, which are also not
in consistent with two-level volcanic magma chambers.
Plots of MgO and Ti2O versus the largest intersection show
that the CT-type GPBs are more evolved than SI-type
GPBs, which may mean that the CT-type GPBs should not
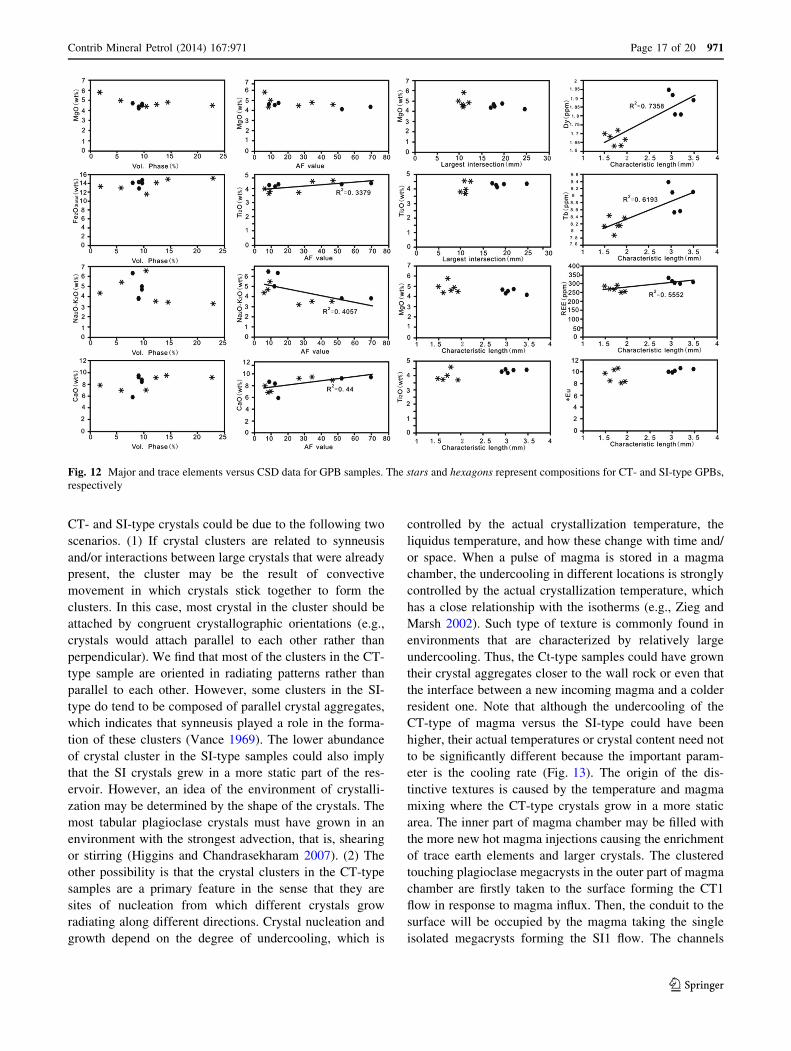
nucleate later than the SI-type GPBs (Fig. 12). A one-
chamber model may be able to explain the textural and
chemical characteristics of the growth rates of two GPB
types that are considered to be different. After magma
accumulates in the crust, the differences between the
971 Page 16 of 20 Contrib Mineral Petrol (2014) 167:971
123
CT- and SI-type crystals could be due to the following two
scenarios. (1) If crystal clusters are related to synneusis
and/or interactions between large crystals that were already
present, the cluster may be the result of convective
movement in which crystals stick together to form the
clusters. In this case, most crystal in the cluster should be
attached by congruent crystallographic orientations (e.g.,
crystals would attach parallel to each other rather than
perpendicular). We find that most of the clusters in the CT-
type sample are oriented in radiating patterns rather than
parallel to each other. However, some clusters in the SI-
type do tend to be composed of parallel crystal aggregates,
which indicates that synneusis played a role in the forma-
tion of these clusters (Vance 1969). The lower abundance
of crystal cluster in the SI-type samples could also imply
that the SI crystals grew in a more static part of the res-
ervoir. However, an idea of the environment of crystalli-
zation may be determined by the shape of the crystals. The
most tabular plagioclase crystals must have grown in an
environment with the strongest advection, that is, shearing
or stirring (Higgins and Chandrasekharam 2007). (2) The
other possibility is that the crystal clusters in the CT-type
samples are a primary feature in the sense that they are
sites of nucleation from which different crystals grow
radiating along different directions. Crystal nucleation and
growth depend on the degree of undercooling, which is
controlled by the actual crystallization temperature, the
liquidus temperature, and how these change with time and/
or space. When a pulse of magma is stored in a magma
chamber, the undercooling in different locations is strongly
controlled by the actual crystallization temperature, which
has a close relationship with the isotherms (e.g., Zieg and
Marsh 2002). Such type of texture is commonly found in
environments that are characterized by relatively large
undercooling. Thus, the Ct-type samples could have grown
their crystal aggregates closer to the wall rock or even that
the interface between a new incoming magma and a colder
resident one. Note that although the undercooling of the
CT-type of magma versus the SI-type could have been
higher, their actual temperatures or crystal content need not
to be significantly different because the important param-
eter is the cooling rate (Fig. 13). The origin of the dis-
tinctive textures is caused by the temperature and magma
mixing where the CT-type crystals grow in a more static
area. The inner part of magma chamber may be filled with
the more new hot magma injections causing the enrichment
of trace earth elements and larger crystals. The clustered
touching plagioclase megacrysts in the outer part of magma
chamber are firstly taken to the surface forming the CT1
flow in response to magma influx. Then, the conduit to the
surface will be occupied by the magma taking the single
isolated megacrysts forming the SI1 flow. The channels
Fig. 12 Major and trace elements versus CSD data for GPB samples. The stars and hexagons represent compositions for CT- and SI-type GPBs,
respectively
Contrib Mineral Petrol (2014) 167:971 Page 17 of 20 971
123
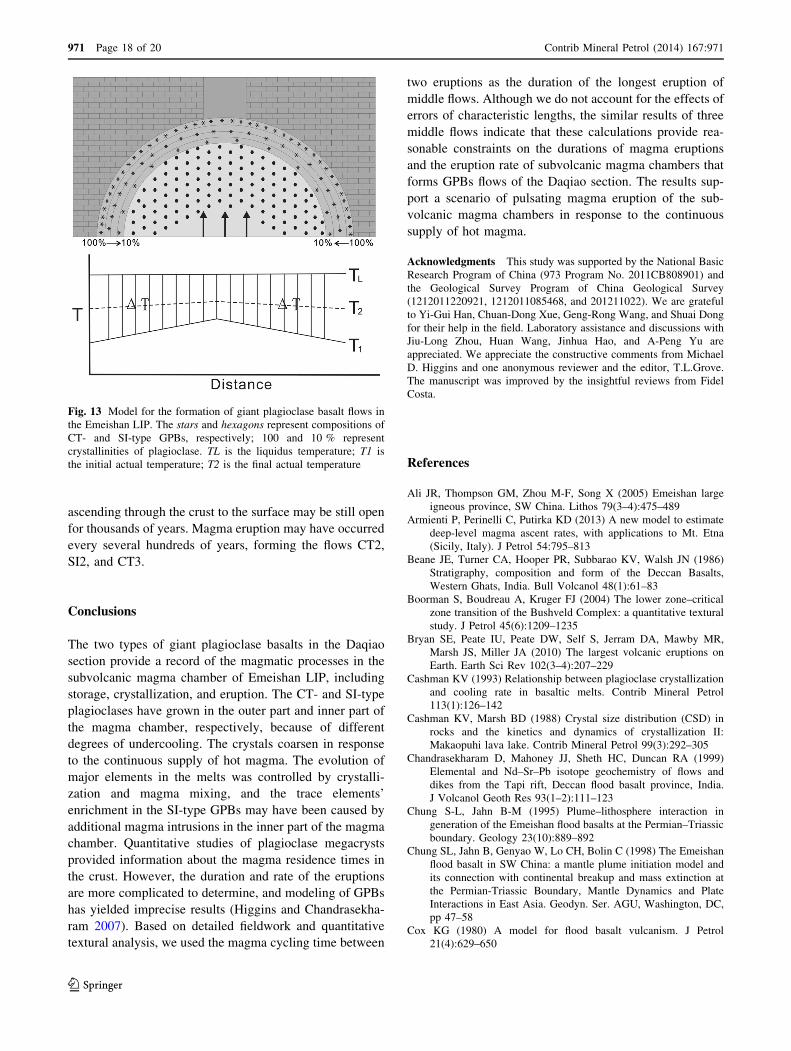
ascending through the crust to the surface may be still open
for thousands of years. Magma eruption may have occurred
every several hundreds of years, forming the flows CT2,
SI2, and CT3.
Conclusions
The two types of giant plagioclase basalts in the Daqiao
section provide a record of the magmatic processes in the
subvolcanic magma chamber of Emeishan LIP, including
storage, crystallization, and eruption. The CT- and SI-type
plagioclases have grown in the outer part and inner part of
the magma chamber, respectively, because of different
degrees of undercooling. The crystals coarsen in response
to the continuous supply of hot magma. The evolution of
major elements in the melts was controlled by crystalli-
zation and magma mixing, and the trace elements’
enrichment in the SI-type GPBs may have been caused by
additional magma intrusions in the inner part of the magma
chamber. Quantitative studies of plagioclase megacrysts
provided information about the magma residence times in
the crust. However, the duration and rate of the eruptions
are more complicated to determine, and modeling of GPBs
has yielded imprecise results (Higgins and Chandrasekha-
ram 2007). Based on detailed fieldwork and quantitative
textural analysis, we used the magma cycling time between
two eruptions as the duration of the longest eruption of
middle flows. Although we do not account for the effects of
errors of characteristic lengths, the similar results of three
middle flows indicate that these calculations provide rea-
sonable constraints on the durations of magma eruptions
and the eruption rate of subvolcanic magma chambers that
forms GPBs flows of the Daqiao section. The results sup-
port a scenario of pulsating magma eruption of the sub-
volcanic magma chambers in response to the continuous
supply of hot magma.
Acknowledgments This study was supported by the National Basic
Research Program of China (973 Program No. 2011CB808901) and
the Geological Survey Program of China Geological Survey
(1212011220921, 1212011085468, and 201211022). We are grateful
to Yi-Gui Han, Chuan-Dong Xue, Geng-Rong Wang, and Shuai Dong
for their help in the field. Laboratory assistance and discussions with
Jiu-Long Zhou, Huan Wang, Jinhua Hao, and A-Peng Yu are
appreciated. We appreciate the constructive comments from Michael
D. Higgins and one anonymous reviewer and the editor, T.L.Grove.
The manuscript was improved by the insightful reviews from Fidel
Costa.
References
Ali JR, Thompson GM, Zhou M-F, Song X (2005) Emeishan large
igneous province, SW China. Lithos 79(3–4):475–489
Armienti P, Perinelli C, Putirka KD (2013) A new model to estimate
deep-level magma ascent rates, with applications to Mt. Etna
(Sicily, Italy). J Petrol 54:795–813
Beane JE, Turner CA, Hooper PR, Subbarao KV, Walsh JN (1986)
Stratigraphy, composition and form of the Deccan Basalts,
Western Ghats, India. Bull Volcanol 48(1):61–83
Boorman S, Boudreau A, Kruger FJ (2004) The lower zone–critical
zone transition of the Bushveld Complex: a quantitative textural
study. J Petrol 45(6):1209–1235
Bryan SE, Peate IU, Peate DW, Self S, Jerram DA, Mawby MR,
Marsh JS, Miller JA (2010) The largest volcanic eruptions on
Earth. Earth Sci Rev 102(3–4):207–229
Cashman KV (1993) Relationship between plagioclase crystallization
and cooling rate in basaltic melts. Contrib Mineral Petrol
113(1):126–142
Cashman KV, Marsh BD (1988) Crystal size distribution (CSD) in
rocks and the kinetics and dynamics of crystallization II:
Makaopuhi lava lake. Contrib Mineral Petrol 99(3):292–305
Chandrasekharam D, Mahoney JJ, Sheth HC, Duncan RA (1999)
Elemental and Nd–Sr–Pb isotope geochemistry of flows and
dikes from the Tapi rift, Deccan flood basalt province, India.
J Volcanol Geoth Res 93(1–2):111–123
Chung S-L, Jahn B-M (1995) Plume–lithosphere interaction in
generation of the Emeishan flood basalts at the Permian–Triassic
boundary. Geology 23(10):889–892
Chung SL, Jahn B, Genyao W, Lo CH, Bolin C (1998) The Emeishan
flood basalt in SW China: a mantle plume initiation model and
its connection with continental breakup and mass extinction at
the Permian-Triassic Boundary, Mantle Dynamics and Plate
Interactions in East Asia. Geodyn. Ser. AGU, Washington, DC,
pp 47–58
Cox KG (1980) A model for flood basalt vulcanism. J Petrol
21(4):629–650
Fig. 13 Model for the formation of giant plagioclase basalt flows in
the Emeishan LIP. The stars and hexagons represent compositions of
CT- and SI-type GPBs, respectively; 100 and 10 % represent
crystallinities of plagioclase. TL is the liquidus temperature; T1 is
the initial actual temperature; T2 is the final actual temperature
971 Page 18 of 20 Contrib Mineral Petrol (2014) 167:971
123

DeHoff RT (1991) A geometrically general theory of diffusion
controlled coarsening. Acta Metall Mater 39(10):2349–2360
Ghiorso M, Sack R (1995) Chemical mass transfer in magmatic
processes IV. A revised and internally consistent thermodynamic
model for the interpolation and extrapolation of liquid-solid
equilibria in magmatic systems at elevated temperatures and
pressures. Contrib Mineral Petrol 119(2–3):197–212
He B, Xu Y-G, Chung S-L, Xiao L, Wang Y (2003) Sedimentary
evidence for a rapid, kilometer-scale crustal doming prior to the
eruption of the Emeishan flood basalts. Earth Planet Sci Lett
213(3–4):391–405
He B, Xu Y, Campbell I (2009) Pre-eruptive uplift in the Emeishan?
Nat Geosci 2(8):530–531
Higgins MD (1994) Determination of crystal morphology and size
from bulk measurements on thin sections: numerical modelling.
Am Mineral 79:113–119
Higgins MD (1996) Magma dynamics beneath Kameni volcano,
Thera, Greece, as revealed by crystal size and shape measure-
ments. J Volcanol Geoth Res 70(1–2):37–48
Higgins MD (1998) Origin of anorthosite by textural coarsening:
quantitative measurements of a natural sequence of textural
development. J Petrol 39(7):1307–1323
Higgins MD (2000) Measurement of crystal size distributions. Am
Mineral 85(9):1105–1116
Higgins MD (2006) Verification of ideal semi-logarithmic, lognormal
or fractal crystal size distributions from 2D datasets. J Volcanol
Geotherm Res 154:8–16
Higgins MD (2009) The Cascadia megathrust earthquake of 1700
may have rejuvenated an isolated basalt volcano in western
Canada: age and petrographic evidence. J Volcanol Geotherm
Res 179(1–2):149–156
Higgins MD (2011a) Quantitative petrological evidence for the origin
of K-feldspar megacrysts in dacites from Taapaca volcano,
Chile. Contrib Mineral Petrol 162(4):709–723
Higgins MD (2011b) Textural coarsening in igneous rocks. Int Geol
Rev 53(3–4):354–376
Higgins MD, Chandrasekharam D (2007) Nature of Sub-volcanic
Magma Chambers, Deccan Province, India: evidence from
quantitative textural analysis of plagioclase megacrysts in the
Giant Plagioclase Basalts. J Petrol 48(5):885–900
Hooper PR, Subbarao KV, Beane JE (1988) The giant plagioclase
basalts (GPBs) of the western Ghats, Deccan Traps. Geol Soc
India Memoir 10:135–144
Kamenetsky VS, Chung S-L, Kamenetsky MB, Kuzmin DV (2012)
Picrites from the Emeishan Large Igneous Province, SW China:
a Compositional Continuum in Primitive Magmas and their
Respective Mantle Sources. J Petrol 53(10):2095–2113
Lange RA, Frey HM, Hector J (2009) A thermodynamic model for the
plagioclase-liquid hygrometer/thermometer. Am Mineral
94(4):494–506
Li C, Tao Y, Qi L, Ripley EM (2012) Controls on PGE fractionation
in the Emeishan picrites and basalts: constraints from integrated
lithophile–siderophile elements and Sr–Nd isotopes. Geochim
Cosmochim Acta 90:12–32
Lifshitz IM, Slyozov VV (1961) The kinetics of precipitation from
supersaturated solid solutions. J Phys Chem Solids 19(1–2):35–50
Lightfoot PC, Hawkesworth CJ, Hergt J, Naldrett AJ, Gorbachev NS,
Fedorenko VA, Doherty W (1993) Remobilisation of the
continental lithosphere by a mantle plume: major-, trace-
element, and Sr-, Nd-, and Pb-isotope evidence from picritic
and tholeiitic lavas of the Noril’sk District, Siberian Trap,
Russia. Contrib Mineral Petrol 114(2):171–188
Magee C, O’Driscoll B, Chambers AD (2010) Crystallization and
textural evolution of a closed-system magma chamber: insights
from a crystal size distribution study of the Lilloise layered
intrusion, East Greenland. Geol Mag 147(03):363–379
Marsh BD (1988) Crystal size distribution (CSD) in rocks and the
kinetics and dynamics of crystallization. Contrib Mineral Petrol
99(3):277–291
Marsh BD (1998) On the interpretation of crystal size distributions in
magmatic systems. J Petrol 39(4):553–599
Mills RD, Ratner JJ, Glazner AF (2011) Experimental evidence for
crystal coarsening and fabric development during temperature
cycling. Geology 39(12):1139–1142
Mock A, Jerram DA (2005) Crystal size distributions (CSD) in three
dimensions: insights from the 3D reconstruction of a highly
porphyritic rhyolite. J Petrol 46(8):1525–1541
Morgan DJ, Jerram DA (2006) On estimating crystal shape for crystal
size distribution analysis. J Volcanol Geotherm Res
154(1–2):1–7
Morgan DJ, Jerram DA, Chertkoff DG, Davidson JP, Pearson DG,
Kronz A, Nowell GM (2007) Combining CSD and isotopic
microanalysis: magma supply and mixing processes at Stromboli
Volcano, Aeolian Islands, Italy. Earth Planet Sci Lett
260(3–4):419–431
Putirka KD (2005) Igneous thermometers and barometers based on
plagioclase ? liquid equilibria: tests of some existing models
and new calibrations. Am Mineral 90(2–3):336–346
Putirka KD (2008) Thermometers and barometers for volcanic
systems. Rev Mineral Geochem 69(1):61–120
Salisbury MJ, Bohrson WA, Clynne MA, Ramos FC, Hoskin P (2008)
Multiple plagioclase crystal populations identified by crystal size
distribution and in situ chemical data: implications for timescales
of magma chamber processes associated with the 1915 Eruption
of Lassen Peak, CA. J Petrol 49(10):1755–1780
Sen G (2001) Generation of Deccan Trap magmas. J Earth Syst Sci
110(4):409–431
Shellnutt JG, Zhou M-F, Zellmer GF (2009) The role of Fe–Ti oxide
crystallization in the formation of A-type granitoids with
implications for the Daly gap: an example from the Permian
Baima igneous complex, SW China. Chem Geol
259(3–4):204–217
Shellnutt JG, Wang K-L, Zellmer GF, Iizuka Y, Jahn B-M, Pang K-N,
Qi L, Zhou M-F (2011) Three Fe–Ti oxide ore-bearing gabbro-
granitoid complexes in the Panxi region of the Permian
Emeishan large igneous province, SW China. Am J Sci
311(9):773–812
Simakin AG, Bindeman IN (2008) Evolution of crystal sizes in the
series of dissolution and precipitation events in open magma
systems. J Volcanol Geotherm Res 177(4):997–1010
Sun S–S, McDonough WF (1989) Chemical and isotopic systematics
of oceanic basalts: implications for mantle composition and
processes. Geol Soc 42(1):313–345
Ukstins Peate I, Bryan SE (2008) Re-evaluating plume-induced uplift
in the Emeishan large igneous province. Nat Geosci
1(9):625–629
Vance J (1969) On synneusis. Contrib Mineral Petrol 24(1):7–29
Wagner C (1961) Theorie der Alterung von Niederschlagen durch
Umlosen (Ostwald-Reifung). Zeitschrift fur Elektrochemie,
Berichte der Bunsengesellschaft fur physikalische Chemie
65(7–8):581–591
Williams E, Boudreau AE, Boorman S, Kruger FJ (2006) Textures of
orthopyroxenites from the Burgersfort bulge of the eastern
Bushveld Complex, Republic of South Africa. Contrib Mineral
Petrol 151(4):480–492
Xiao L, Xu YG, Mei HJ, Zheng YF, He B, Pirajno F (2004) Distinct
mantle sources of low-Ti and high-Ti basalts from the western
Emeishan large igneous province, SW China: implications for
plume–lithosphere interaction. Earth Planet Sci Lett
228(3–4):525–546
Xu Y, Chung S-L, Jahn B-M, Wu G (2001) Petrologic and
geochemical constraints on the petrogenesis of Permian–Triassic
Contrib Mineral Petrol (2014) 167:971 Page 19 of 20 971
123
Emeishan flood basalts in southwestern China. Lithos
58(3–4):145–168
Yang Z-F (2012) Combining quantitative textural and geochemical
studies to understand the solidification processes of a granite
porphyry: Shanggusi, East Qinling, China. J Petrol
53(9):1807–1835
Zellmer GF, Blake S, Vance D, Hawkesworth C, Turner S (1999)
Plagioclase residence times at two island arc volcanoes (Kameni
Islands, Santorini, and Soufriere, St. Vincent) determined by Sr
diffusion systematics. Contrib Mineral Petrol 136(4):345–357
Zhang Z, Mahoney JJ, Mao J, Wang F (2006) Geochemistry of
Picritic and Associated Basalt Flows of the Western Emeishan
Flood Basalt Province, China. J Petrol 47(10):1997–2019
Zhang Z, Zhi X, Chen L, Saunders AD, Reichow MK (2008) Re–Os
isotopic compositions of picrites from the Emeishan flood basalt
province, China. Earth Planet Sci Lett 276(1–2):30–39
Zhou M-F, Malpas J, Song X-Y, Robinson PT, Sun M, Kennedy AK,
Lesher CM, Keays RR (2002) A temporal link between the
Emeishan large igneous province (SW China) and the end-
Guadalupian mass extinction. Earth Planet Sci Lett
196(3–4):113–122
Zhou M-F, Robinson PT, Lesher CM, Keays RR, Zhang C-J, Malpas J
(2005) Geochemistry, petrogenesis and metallogenesis of the
Panzhihua gabbroic layered intrusion and associated Fe–Ti–V
oxide deposits, Sichuan Province, SW China. J Petrol
46(11):2253–2280
Zieg MJ, Marsh BD (2002) Crystal size distributions and scaling laws
in the quantification of igneous textures. J Petrol 43(1):85–101
971 Page 20 of 20 Contrib Mineral Petrol (2014) 167:971
123