gi slide deck 2019 - esdo
TRANSCRIPT

Supported by Eli Lilly and Company.
Eli Lilly and Company has not influenced the content of this publication
2019 Gastrointestinal Cancers Symposium 17–19 January 2019 | San Francisco, USA
GI SLIDE DECK 2019 Selected abstracts from:

Letter from ESDO
DEAR COLLEAGUES
It is our pleasure to present this ESDO slide set which has been designed to highlight and summarise
key findings in digestive cancers from the major congresses in 2019. This slide set specifically focuses
on the 2019 Gastrointestinal Cancers Symposium and is available in English, French, Chinese and
Japanese.
The area of clinical research in oncology is a challenging and ever changing environment. Within this
environment, we all value access to scientific data and research which helps to educate and inspire
further advancements in our roles as scientists, clinicians and educators. I hope you find this review of
the latest developments in digestive cancers of benefit to you in your practice. If you would like to share
your thoughts with us we would welcome your comments. Please send any correspondence to
Finally, we are also very grateful to Lilly Oncology for their financial, administrative and logistical support
in the realisation of this activity.
Yours sincerely,
Eric Van Cutsem Ulrich Güller
Thomas Seufferlein Thomas Gruenberger
Côme Lepage Tamara Matysiak-Budnik
Wolff Schmiegel Jaroslaw Regula
Phillippe Rougier (hon.) Jean-Luc Van Laethem
(ESDO Governing Board)
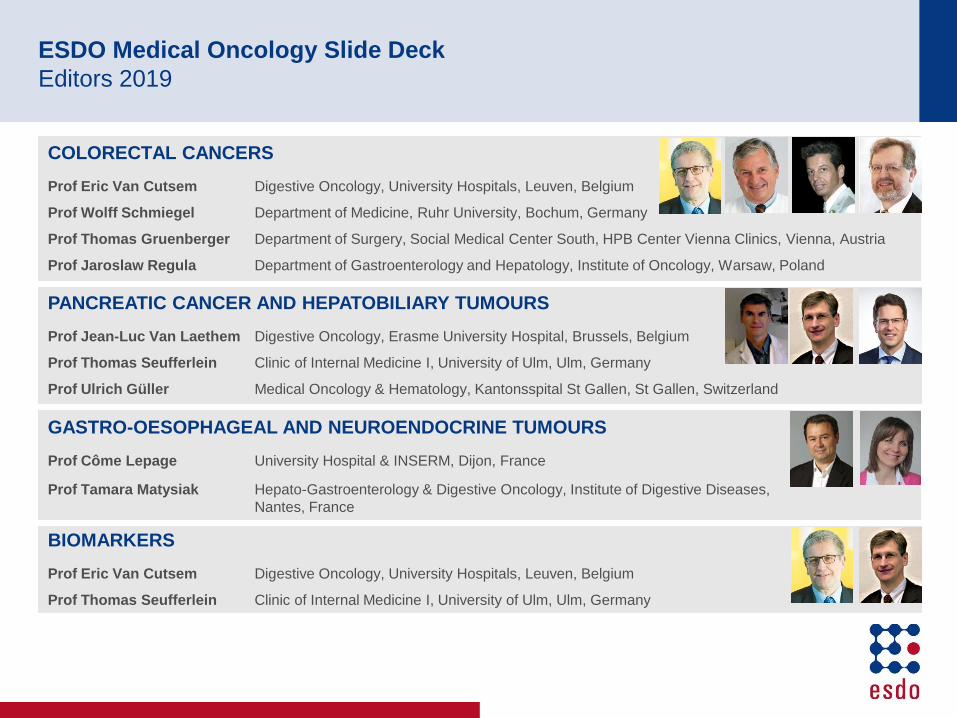
ESDO Medical Oncology Slide Deck
Editors 2019
BIOMARKERS
Prof Eric Van Cutsem Digestive Oncology, University Hospitals, Leuven, Belgium
Prof Thomas Seufferlein Clinic of Internal Medicine I, University of Ulm, Ulm, Germany
COLORECTAL CANCERS
Prof Eric Van Cutsem Digestive Oncology, University Hospitals, Leuven, Belgium
Prof Wolff Schmiegel Department of Medicine, Ruhr University, Bochum, Germany
Prof Thomas Gruenberger Department of Surgery, Social Medical Center South, HPB Center Vienna Clinics, Vienna, Austria
Prof Jaroslaw Regula Department of Gastroenterology and Hepatology, Institute of Oncology, Warsaw, Poland
PANCREATIC CANCER AND HEPATOBILIARY TUMOURS
Prof Jean-Luc Van Laethem Digestive Oncology, Erasme University Hospital, Brussels, Belgium
Prof Thomas Seufferlein Clinic of Internal Medicine I, University of Ulm, Ulm, Germany
Prof Ulrich Güller Medical Oncology & Hematology, Kantonsspital St Gallen, St Gallen, Switzerland
GASTRO-OESOPHAGEAL AND NEUROENDOCRINE TUMOURS
Prof Côme Lepage University Hospital & INSERM, Dijon, France
Prof Tamara Matysiak Hepato-Gastroenterology & Digestive Oncology, Institute of Digestive Diseases,
Nantes, France

Glossary
1L first-line
2L second-line
5FU 5-fluorouracil
AE adverse event
ADX andecaliximab
AFP alpha-fetoprotein
ALT alanine aminotransferase
AST aspartate aminotransferase
bid twice daily
BCLC Barcelona Clinic Liver Cancer
BOR best overall response
BSA body surface area
BSC best supportive care
BTC biliary tract carcinoma
BW body weight
CA19.9 cancer antigen 19.9
CAPOX capecitabine + oxaliplatin
CI confidence interval
CR complete response
CRC colorectal cancer
CRT chemoradiation
CPS combined positive score
D day
DCR disease control rate
DFS disease-free survival
DoR duration of response
ECOG Eastern Cooperative Oncology
Group
EHS extrahepatic spread
FISH fluorescence in situ hybridization
(m)FOLFOX (modified) leucovorin +
5-fluorouracil + oxaliplatin
GEJ gastroesophageal junction
Gy Gray
HBV hepatitis B virus
HCC hepatocellular carcinoma
HER2 human epidermal growth factor
receptor 2
HR hazard ratio
ICI immune checkpoint inhibition
IHC immunohistochemistry
iv intravenous
LN lymph node
mo months
MMP9 matrix metalloproteinase 9
MSI microsatellite instability
MSS microsatellite stable
MUC1 mucin 1
MVI macroscopic portal vein invasion
NA not available
NAR neoadjuvant rectal (score)
NE not evaluable
NET neuroendocrine tumor
NLR neutrophil-to-lymphocyte ratio
NR not reached
OR(R) objective response (rate)
OS overall survival
pCR pathological complete response
PD progressive disease
PD-(L)1 programmed death-(ligand) 1
PFS progression-free survival
PR partial response
PS performance status
q(2/3/4)w every (2/3/4) week(s)
R randomized
R0/1 resection 0/1
(m)RECIST (modified) Response Evaluation
Criteria In Solid Tumors
RFS relapse-free survival
SAE serious adverse event
SBRT stereotactic body radiation therapy
sc subcutaneous
SCC squamous cell carcinoma
SD stable disease
SLD sum of the longest diameters
SoC standard of care
SOX S-1 + oxaliplatin
TMB tumor mutation burden
TNM tumor, node, metastasis
TRAE treatment-related adverse event
TTP time to progression
UFT tegafur + uracil

Contents
• Cancers of the oesophagus and stomach 6
• Cancers of the pancreas, small bowel and hepatobiliary tract 31
– Pancreatic cancer 32
– Hepatocellular carcinoma 42
– Biliary tract cancer 54
– Neuroendocrine tumour 62
• Cancers of the colon, rectum and anus 70
Note: To jump to a section, right click on the number and ‘Open Hyperlink’

CANCERS OF THE
OESOPHAGUS AND STOMACH

2: Pembrolizumab versus chemotherapy as second-line therapy for
advanced esophageal cancer: Phase III KEYNOTE-181 study
– Kojima T, et al
Study objective
• To assess the efficacy and safety of pembrolizumab as a 2L treatment for patients with
advanced or metastatic SCC and esophageal or GEJ adenocarcinoma in KEYNOTE-181
*Paclitaxel 80–100 mg/m2 D1, 8, 15 q4w; docetaxel 75 mg/m2 q3w;
or irinotecan 180 mg/m2 q2w Kojima T, et al. J Clin Oncol 2019;37(Suppl):Abstr 2
PRIMARY ENDPOINT
• OS in PD-L1 CPS ≥10, SCC,
total population
R
1:1
PD
Stratification
• Histology (SCC vs. adenocarcinoma)
• Region (Asia vs. rest of world)
Pembrolizumab 200 mg iv q3w
for up to 2 years
(n=314)
Key patient inclusion criteria
• Advanced or metastatic SCC
or esophageal/GEJ
adenocarcinoma
• Progression on or after 1L
therapy
• ECOG PS 0–1
(n=628) PD
Chemotherapy
Investigator choice*
(n=314)
SECONDARY ENDPOINTS
• PFS, ORR (RECIST v1.1), safety

2: Pembrolizumab versus chemotherapy as second-line therapy for
advanced esophageal cancer: Phase III KEYNOTE-181 study
– Kojima T, et al
Key results
Kojima T, et al. J Clin Oncol 2019;37(Suppl):Abstr 2
OS in total population PFS in total population
Events, n Median, mo
(95%CI)
HRa
(95%CI) p-value
Pembrolizumab 314 7.1 (6.2, 8.1) 0.89 (0.75, 1.05) 0.0560
Chemotherapy 314 7.1 (6.3, 8.0) –
Time, months
OS
, %
100
80
60
40
20
0 0
314
314
4
224
226
8
143
139
12
100
75
16
63
41
20
28
18
26
10
6
30
1
3
34
0
0
2
275
280
6
176
181
10
116
98
14
73
56
18
46
26
24
14
9
22
20
13
28
5
5
32
0
1
No.
at risk
Pembro
Chemo
32%
24%
18%
10%
Median, mo
(95%CI)
HR
(95%CI)
Pembrolizumab 2.1 (2.1, 2.2) 1.11
(0.94, 1.31) Chemotherapy 3.4 (2.8, 3.9)
Time, months
PF
S, %
100
80
60
40
20
0 0
314
314
4
105
131
8
52
63
12
35
29
16
21
11
20
11
1
26
3
0
30
1
0
2
209
224
6
72
89
10
42
44
14
26
20
18
16
4
24
4
0
22
7
0
28
1
0
32
0
0
12%
10%
aBased on Cox regression model with treatment as a
covariate stratified by region and histology
2: Pembrolizumab versus chemotherapy as second-line therapy for
advanced esophageal cancer: Phase III KEYNOTE-181 study
– Kojima T, et al
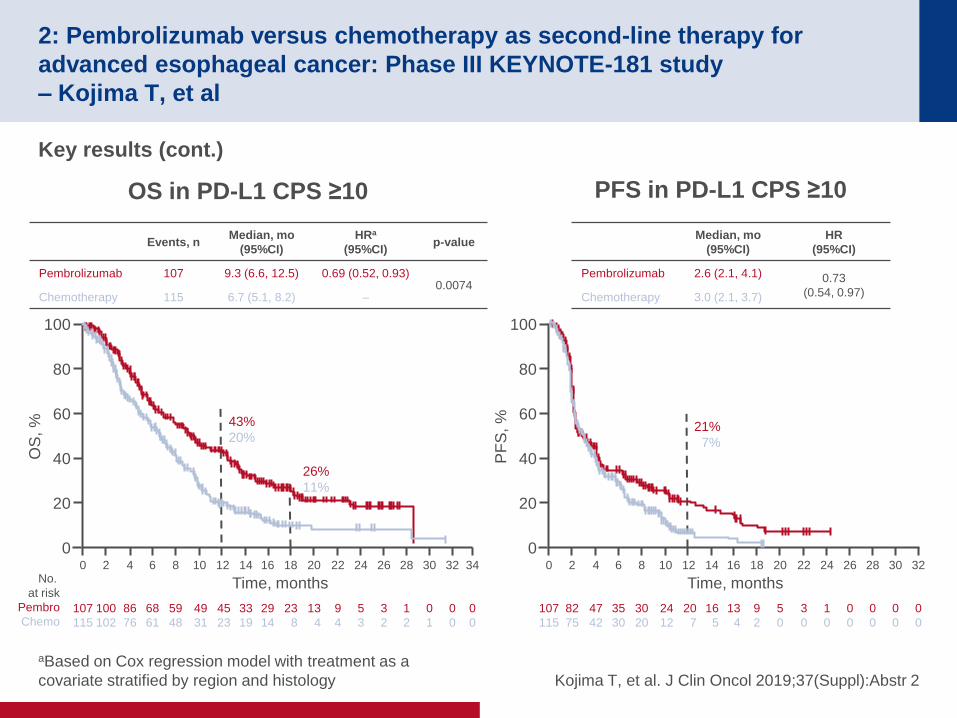
Key results (cont.)
aBased on Cox regression model with treatment as a
covariate stratified by region and histology Kojima T, et al. J Clin Oncol 2019;37(Suppl):Abstr 2
OS in PD-L1 CPS ≥10 PFS in PD-L1 CPS ≥10
Events, n Median, mo
(95%CI)
HRa
(95%CI) p-value
Pembrolizumab 107 9.3 (6.6, 12.5) 0.69 (0.52, 0.93) 0.0074
Chemotherapy 115 6.7 (5.1, 8.2) –
Median, mo
(95%CI)
HR
(95%CI)
Pembrolizumab 2.6 (2.1, 4.1) 0.73
(0.54, 0.97) Chemotherapy 3.0 (2.1, 3.7)
Time, months
OS
, %
100
80
60
40
20
0 0
107
115
4
86
76
8
59
48
12
45
23
16
29
14
20
13
4
26
3
2
30
0
1
34
0
0
2
100
102
6
68
61
10
49
31
14
33
19
18
23
8
24
5
3
22
9
4
28
1
2
32
0
0
No.
at risk
Pembro
Chemo
43%
20%
26%
11%
Time, months
PF
S, %
100
80
60
40
20
0 0
107
115
4
47
42
8
30
20
12
20
7
16
13
4
20
5
0
26
0
0
30
0
0
2
82
75
6
35
30
10
24
12
14
16
5
18
9
2
24
1
0
22
3
0
28
0
0
32
0
0
21%
7%

2: Pembrolizumab versus chemotherapy as second-line therapy for
advanced esophageal cancer: Phase III KEYNOTE-181 study
– Kojima T, et al
Key results (cont.)
aBased on Cox regression model with treatment as a
covariate stratified by region and histology; bnot significant
based on pre-specified statistical boundaries Kojima T, et al. J Clin Oncol 2019;37(Suppl):Abstr 2
OS in SCC PFS in SCC
Events, n Median, mo
(95%CI)
HRa
(95%CI) p-value
Pembrolizumab 198 8.2 (6.7, 10.3) 0.78 (0.63, 0.96) 0.0095b
Chemotherapy 203 7.1 (6.1, 8.2) –
Median, mo
(95%CI)
HR
(95%CI)
Pembrolizumab 2.2 (2.1, 3.2) 0.92
(0.75, 1.13) Chemotherapy 3.1 (2.2, 3.9)
Time, months
PF
S, %
100
80
60
40
20
0 0
198
203
4
80
77
8
41
38
12
28
18
16
17
8
20
9
1
26
3
0
30
1
0
2
140
137
6
53
51
10
33
26
14
21
14
18
13
4
24
3
0
22
5
0
28
1
0
32
0
0
15%
9%
Time, months
OS
, %
100
80
60
40
20
0 0
198
203
4
150
147
8
103
91
12
77
50
16
52
27
20
24
13
26
10
5
30
1
2
34
0
0
2
177
179
6
121
118
10
86
64
14
57
38
18
38
20
24
12
8
22
17
10
28
5
4
32
0
1
No.
at risk
Pembro
Chemo
39%
25%
23%
12%

2: Pembrolizumab versus chemotherapy as second-line therapy for
advanced esophageal cancer: Phase III KEYNOTE-181 study
– Kojima T, et al
Key results (cont.)
Conclusions
• In patients with metastatic esophageal cancer and PD-L1 CPS ≥10 who had
progressed after 1 prior therapy, pembrolizumab provided significant improvement
in OS and higher ORR when compared with chemotherapy
• The pembrolizumab safety profile was more favorable than chemotherapy
• In patients with metastatic esophageal cancer and PD-L1 CPS ≥10, pembrolizumab
may be a new 2L SoC
Kojima T, et al. J Clin Oncol 2019;37(Suppl):Abstr 2
TRAE, n (%) Pembrolizumab (n=314) Chemotherapy (n=296)
Treatment-related 202 (64.3) 255 (86.1)
Grade 3–5 57 (18.2) 121 (40.9)
Led to discontinuation 19 (6.1) 19 (6.4)
Led to death 5 (1.5) 5 (1.7)
ORR, % Pembrolizumab Chemotherapy p-value
Total population 13.1 6.7 0.0037
PD-L1 CPS ≥10 21.5 6.1 0.0006
SCC 16.7 7.4 0.0022

4: A phase 3, randomized, double-blind, placebo-controlled study to
evaluate the efficacy and safety of andecaliximab combined with
mFOLFOX6 as first-line treatment in patients with advanced gastric or
gastroesophageal junction adenocarcinoma (GAMMA-1) – Shah MA, et al
Study objective
• To assess the efficacy and safety of andecaliximab, an MMP9 inhibitor, combined with
mFOLFOX6 in patients with advanced gastric or GEJ adenocarcinoma
*Oxaliplatin D1, 15 followed by leucovorin + 5FU D1, 15 of
28-day cycle Shah MA, et al. J Clin Oncol 2019;37(Suppl):Abstr 4
PRIMARY ENDPOINT
• OS
R
1:1
PD/
toxicity/
death
Stratification
• ECOG PS
• Region (Latin America vs. rest of world)
• Primary tumor site (gastric vs. GEJ)
Andecaliximab 800 mg iv +
mFOLFOX6* D1, 15 q4w
(n=218) Key patient inclusion criteria
• Inoperable, locally advanced or
metastatic HER2-negative
gastric or GEJ adenocarcinoma
• Treatment naive
(n=432) Placebo +
mFOLFOX6* D1, 15 q4w
(n=214)
SECONDARY ENDPOINTS
• PFS, ORR (RECIST v1.1), safety
PD/
toxicity/
death

4: A phase 3, randomized, double-blind, placebo-controlled study to
evaluate the efficacy and safety of andecaliximab combined with
mFOLFOX6 as first-line treatment in patients with advanced gastric or
gastroesophageal junction adenocarcinoma (GAMMA-1) – Shah MA, et al
Key results
Shah MA, et al. J Clin Oncol 2019;37(Suppl):Abstr 4
OS OS by subgroup
Time, months
% a
live
100
80
60
40
20
0 0
218
214
4
191
180
8
148
143
12
108
97
16
68
59
20
27
19
26
1
0
30
1
2
205
197
6
167
161
10
127
116
14
89
83
18
45
37
24
5
1
22
10
9
28
1
32
0
No.
at risk
ADX +
mFOLFOX6
Placebo +
mFOLFOX6
Stratified HR (95%CI) of ADX vs. placebo: 0.93 (0.74, 1.18)
Stratified 2-sided p-value (log-rank test): p=0.56
ADX + mFOLFOX6
Placebo + mFOLFOX6
Median 12.5
(95%CI 11.2, 14.0)
Median 11.8
(95%CI 10.3, 13.5)
Favors ADX
Hazard ratio
0 1 2 3 4
Overall
Latin America
All other countries
ECOG PS 0
ECOG PS 1
Gastric
GEJ
Locally advanced
Metastatic
Male
Female
Age <65 years
Age ≥65 years
White
Non-white

4: A phase 3, randomized, double-blind, placebo-controlled study to
evaluate the efficacy and safety of andecaliximab combined with
mFOLFOX6 as first-line treatment in patients with advanced gastric or
gastroesophageal junction adenocarcinoma (GAMMA-1) – Shah MA, et al
Key results (cont.)
Shah MA, et al. J Clin Oncol 2019;37(Suppl):Abstr 4
PFS PFS by subgroup
Time, months
% a
live
100
80
60
40
20
0 0
218
214
4
152
129
8
86
69
12
46
34
16
27
12
20
5
6
26
1
0
30
1
2
180
166
6
125
101
10
60
50
14
34
28
18
13
10
24
2
0
22
3
1
28
1
32
0
No.
at risk
ADX +
mFOLFOX6
Placebo +
mFOLFOX6
Stratified HR (95%CI) of ADX vs. placebo: 0.84 (0.67, 1.04)
Stratified 2-sided p-value (log-rank test): p=0.10
ADX + mFOLFOX6
Placebo + mFOLFOX6
Median 7.5
(95%CI 7.3, 8.4)
Median 7.1
(95%CI 5.5, 7.5)
Favors ADX
Hazard ratio
0 1 2 3
Overall
Latin America
All other countries
ECOG PS 0
ECOG PS 1
Gastric
GEJ
Locally advanced
Metastatic
Male
Female
Age <65 years
Age ≥65 years
White
Non-white

4: A phase 3, randomized, double-blind, placebo-controlled study to
evaluate the efficacy and safety of andecaliximab combined with
mFOLFOX6 as first-line treatment in patients with advanced gastric or
gastroesophageal junction adenocarcinoma (GAMMA-1) – Shah MA, et al
Key results (cont.)
Conclusions
• In treatment-naïve patients with HER2-negative gastric or GEJ adenocarcinoma,
adding andecaliximab to mFOLFOX6 did not provide any improvement in survival
• The safety profile between the two treatment groups was similar
Shah MA, et al. J Clin Oncol 2019;37(Suppl):Abstr 4
Grade ≥3 TRAEs occurring in ≥5%, % Andecaliximab Placebo
Neutropenia 22 27
Anemia 8 11
Fatigue 5 8
Neutrophil count decreased 7 6
Pulmonary embolism 5 8
Vomiting 6 4
Abdominal pain 5 4

5: Safety and efficacy of durvalumab following trimodality therapy for
locally advanced esophageal and GEJ adenocarcinoma: Early efficacy
results from Big Ten Cancer Research Consortium study – Mamdani H, et al
Study objective
• To assess the efficacy and safety of durvalumab in patients with locally advanced
esophageal or GEJ adenocarcinoma
*Carboplatin/paclitaxel or cisplatin/5FU + definitive radiation; †durvalumab started within 1–3 months of surgery Mamdani H, et al. J Clin Oncol 2019;37(Suppl):Abstr 5
PRIMARY ENDPOINT
• 1-year RFS
Durvalumab 1500 mg iv†
q4w for up to 1 year
Key patient inclusion criteria
• Locally advanced
esophageal or GEJ
adenocarcinoma
• ECOG PS 0–1
(n=24)
Preoperative
CRT* followed
by surgery
(R0 resection)
SECONDARY ENDPOINTS
• Safety

5: Safety and efficacy of durvalumab following trimodality therapy for
locally advanced esophageal and GEJ adenocarcinoma: Early efficacy
results from Big Ten Cancer Research Consortium study – Mamdani H, et al
Key results
Mamdani H, et al. J Clin Oncol 2019;37(Suppl):Abstr 5
RFS R
ela
pse-f
ree
su
rviv
al, p
rob
ab
ility
Months to relapse
1.0
0.8
0.6
0.4
0.2
0
0
24
3
24
6
22
9
19
12
17
27
0
15
10
18
8
21
5
24
3 No. at risk
12-month RFS rate: 79.2%
26-month RFS rate: 67.9%

5: Safety and efficacy of durvalumab following trimodality therapy for
locally advanced esophageal and GEJ adenocarcinoma: Early efficacy
results from Big Ten Cancer Research Consortium study – Mamdani H, et al
Key results (cont.)
• Grade 3 AEs included hypoglycemia (n=1) and hyperglycemia (n=1)
• Grade 3 TRAEs leading to discontinuation occurred in 3 patients (1 pneumonitis, 1 hepatitis,
1 colitis)
Mamdani H, et al. J Clin Oncol 2019;37(Suppl):Abstr 5
AEs occurring in ≥10%, n (%) Grade 1 Grade 2
Fatigue 6 (25.0) 2 (8.3)
Nausea 6 (25.0) 0 (0)
Cough 3 (12.5) 2 (8.3)
Diarrhea 3 (12.5) 1 (4.2)
Pruritus 3 (12.5) 1 (4.2)
Dyspnea 1 (4.2) 2 (8.3)

5: Safety and efficacy of durvalumab following trimodality therapy for
locally advanced esophageal and GEJ adenocarcinoma: Early efficacy
results from Big Ten Cancer Research Consortium study – Mamdani H, et al
Conclusions
• In patients with locally advanced esophageal or GEJ adenocarcinoma, adjuvant
durvalumab was feasible and showed encouraging efficacy data
• Durvalumab demonstrated a safety profile similar to previous findings
Mamdani H, et al. J Clin Oncol 2019;37(Suppl):Abstr 5

8: Evaluation of efficacy of nivolumab by baseline factors from
ATTRACTION-2 – Kang YK, et al
Study objective
• To assess factors that might contribute to early disease progression after receiving
nivolumab – an exploratory analysis of ATTRACTION-2
Kang YK, et al. J Clin Oncol 2019;37(Suppl):Abstr 8
R
2:1
PD
Stratification
• Country (Japan vs. S. Korea vs. Taiwan)
• ECOG PS (0 vs. 1)
• No. of organs with metastases (<2 vs. ≥2)
Nivolumab 3 mg/kg iv
q2w
(n=330)
Key patient inclusion criteria
• Unresectable advanced or
recurrent gastric or GEJ
cancer
• Refractory to or intolerant of
≥2 standard therapy
regimens
• ECOG PS 0–1
(n=493)
PD Placebo q2w
(n=163)
EXPLORATORY ENDPOINT
• Clinical factors for early progression/death using
Bayesian additive regression trees

8: Evaluation of efficacy of nivolumab by baseline factors from
ATTRACTION-2 – Kang YK, et al
Key results
Kang YK, et al. J Clin Oncol 2019;37(Suppl):Abstr 8
OS
, %
100
80
60
40
20
0 0 3 6 9 12 15 18 21 30 24 27
Low sodium + high NLR
Nivolumab (n=31)
Placebo (n=18)
OS
, %
100
80
60
40
20
0 0 3 6 9 12 15 18 21 30 24 27
Other patients
Nivolumab (n=297)
Placebo (n=142)
Time, months
PF
S, %
100
80
60
40
20
0 0 3 6 9 12 15 18 21 30 24 27
Low sodium + high NLR
Nivolumab (n=31)
Placebo (n=18)
PF
S, %
100
80
60
40
20
0 0 3 6 9 12 15 18 21 30 24 27
Other patients
Nivolumab (n=297)
Placebo (n=142)
Time, months
PFS OS

8: Evaluation of efficacy of nivolumab by baseline factors from
ATTRACTION-2 – Kang YK, et al
Key results (cont.)
• Factors found to be associated with early progression or death on nivolumab treatment
included low sodium, high neutrophil-to-lymphocyte ratio (NLR), ECOG PS of 1 and no
prior ramucirumab treatment
• Biomarker analysis did not find any correlation between PD-L1 expression, TMB or MSI
status and the efficacy of nivolumab
Conclusions
• In patients with advanced gastric or GEJ cancer, the efficacy of nivolumab may be
reduced in those with factors suggestive of poorer overall condition such as low
sodium and high NLR
• However, these results are exploratory and need to be verified
Kang YK, et al. J Clin Oncol 2019;37(Suppl):Abstr 8

62: First-line pembrolizumab (P), trastuzumab (T), capecitabine (C) and
oxaliplatin (O) in HER2-positive metastatic esophagogastric
adenocarcinoma (mEGA) – Janjigian YY, et al
Study objective
• To assess the efficacy and safety of pembrolizumab combined with chemotherapy and
trastuzumab in patients with HER2-positive metastatic esophagogastric adenocarcinoma
Janjigian YY, et al. J Clin Oncol 2019;37(Suppl):Abstr 62
PRIMARY ENDPOINT
• 6-month PFS
Pembrolizumab 200 mg +
trastuzumab 6 mg/kg + CAPOX
(oxaliplatin 130 mg/m2 q3w +
capecitabine 850 mg/m2 D1–14)
(n=24)
Pembrolizumab
200 mg iv +
trastuzumab
8 mg/kg
1 cycle
Key patient inclusion criteria
• Stage IV esophagogastric
adenocarcinoma
• HER2 IHC 3+ or IHC 2+/
FISH >2.0 irrespective of
PD-L1 status
• Treatment naive
(n=37)
SECONDARY ENDPOINTS
• OS, ORR, DCR, safety, biomarker analysis

62: First-line pembrolizumab (P), trastuzumab (T), capecitabine (C) and
oxaliplatin (O) in HER2-positive metastatic esophagogastric
adenocarcinoma (mEGA) – Janjigian YY, et al
Key results
Janjigian YY, et al. J Clin Oncol 2019;37(Suppl):Abstr 62
Pro
gre
ssio
n-f
ree s
urv
iva
l,
pro
ba
bili
ty
Time, months
1.0
0.8
0.6
0.4
0.2
0
0
35
6
15
12
6
24
0
18
1 No. at risk
Censored
Median follow-up 6.6 months (range 0.03–23.5)
Median PFS 11.4 months (95%CI 6.0, 16.4)
6-month PFS rate 67%
PFS

62: First-line pembrolizumab (P), trastuzumab (T), capecitabine (C) and
oxaliplatin (O) in HER2-positive metastatic esophagogastric
adenocarcinoma (mEGA) – Janjigian YY, et al
Key results (cont.)
Janjigian YY, et al. J Clin Oncol 2019;37(Suppl):Abstr 62
Su
rviv
al, p
rob
ab
ility
Time, months
1.0
0.8
0.6
0.4
0.2
0
0
35
6
22
12
11
24
0
18
3 No. at risk
Median follow-up 6.6 months (range 0.03–23.5)
Median OS NR (95%CI 13.8, NR)
12-month OS rate 76% (95%CI 51, 89)
OS
Censored

62: First-line pembrolizumab (P), trastuzumab (T), capecitabine (C) and
oxaliplatin (O) in HER2-positive metastatic esophagogastric
adenocarcinoma (mEGA) – Janjigian YY, et al
Key results (cont.)
Conclusions
• In patients with HER2-positive metastatic esophagogastric adenocarcinoma,
pembrolizumab + trastuzumab + CAPOX provided encouraging responses and was
generally well tolerated
• A phase 3 study (KEYNOTE-811) is ongoing Janjigian YY, et al. J Clin Oncol 2019;37(Suppl):Abstr 62
TRAEs occurring in ≥10%, n (%) Grade 3 Grade 4
ALT/AST increased 1 (3)
Anemia 2 (6)
Diarrhea 1 (3)
Dry skin/maculopapular rash 1 (3)
Lymphocyte count decreased 3 (9) 1 (3)
Mucositis oral 1 (3)
Nausea 2 (6)
Immune-related
Colitis 1 (3) 0 (0)
Interstitial nephritis 0 (0) 2 (3)
AST/ALT elevation 4 (11) 1 (3)
66: MSI-GC-01: Individual patient data (IPD) meta-analysis of microsatellite
instability (MSI) and gastric cancer (GC) from four randomized clinical trials
(RCTs) – Pietrantonio F, et al
Study objective
• To assess the prognostic and predictive impact of MSI in patients with gastric cancer
Methods
• Data for patients with resectable gastric cancer (n=1522) were pooled from 4 clinical trials
– MAGIC, CLASSIC, ARTIST and ITACA-S
• The following data were collected: patient demographics (age, sex, and race), primary site
(stomach vs. junctional), histotype (intestinal vs. other), T/N stage (7th TNM), treatment
received (multimodal therapy vs. surgery alone) and MSI
• Univariate and multivariate associations with DFS and OS were assessed
• The predictive role of MSI according to treatment received was assessed overall and in the
2 clinical trials with a surgery alone arm (MAGIC and CLASSIC)
Pietrantonio F, et al. J Clin Oncol 2019;37(Suppl):Abstr 66

66: MSI-GC-01: Individual patient data (IPD) meta-analysis of microsatellite
instability (MSI) and gastric cancer (GC) from four randomized clinical trials
(RCTs) – Pietrantonio F, et al
Key results
Pietrantonio F, et al. J Clin Oncol 2019;37(Suppl):Abstr 66
DFS OS
Time, months
Ove
rall
su
rviv
al
1.0
0.8
0.6
0.4
0.2
0
0
121 (0)
1435 (0)
24
101 (4)
1089 (41)
48
72 (27)
699 (243)
72
24 (72)
248 (645)
12
107 (3)
1275 (18)
36
93 (8)
944 (66)
60
47 (51)
458 (441)
84
8 (93)
59 (851)
MSI-high
MSS/MSI-low
Time, months
Dis
ease-f
ree s
urv
iva
l
1.0
0.8
0.6
0.4
0.2
0
0
121 (0)
1435 (0)
24
93 (3)
933 (29)
48
67 (25)
616 (199)
72
21 (68)
226 (557)
12
102 (2)
1163 (14)
36
89 (6)
820 (45)
60
44 (47)
415 (373)
84
6 (87)
52 (745)
MSI-high
MSS/MSI-low
No. at risk No. at risk

66: MSI-GC-01: Individual patient data (IPD) meta-analysis of microsatellite
instability (MSI) and gastric cancer (GC) from four randomized clinical trials
(RCTs) – Pietrantonio F, et al
Key results (cont.)
Pietrantonio F, et al. J Clin Oncol 2019;37(Suppl):Abstr 66
Time, months 0
33(0)
88(0)
422(0)
1013(0)
MSI-high, surgery only
MSI-high, chemo
MSS/MSI-low, surgery only
MSS/MSI-low, chemo
Dis
ease
-fre
e s
urv
ival
1.0
0.8
0.6
0.4
0.2
0
MSI-high, surgery only
MSI-high, chemo
MSS/MSI-low, surgery only
MSS/MSI-low, chemo
12
27(2)
75(0)
318(6)
845(8)
24
26(3)
68(0)
238(13)
695(16)
36
23(4)
66(2)
192(20)
628(25)
48
19(7)
48(18)
163(34)
453(165)
60
15(12)
29(35)
115(72)
300(301)
72
4(22)
17(46)
68(119)
158(438)
84
1(26)
5(61)
16(172)
36(573)
Time, months 0
33(0)
28(0)
422(0)
428 (0)
MSI-high, surgery only
MSI-high, chemo
MSS/MSI-low, surgery only
MSS/MSI-low, chemo
Dis
ease-f
ree s
urv
ival
1.0
0.8
0.6
0.4
0.2
0
MSI-high, surgery only
MSI-high, chemo
MSS/MSI-low, surgery only
MSS/MSI-low, chemo
12
27(2)
23(0)
318(6)
358(5)
24
25(3)
20(0)
238(13)
281(10)
36
23(4)
18(2)
192(20)
252(17)
48
19(7)
16(3)
163(34)
211(43)
60
15(12)
12(7)
115(72)
164(83)
72
4(22)
7(11)
68(119)
105(142)
84
1(26)
3(18)
16(172)
31(232)
0
33(0)
88(0)
422(0)
1013(0)
Overa
ll surv
ival
1.0
0.8
0.6
0.4
0.2
0
MSI-high, surgery only
MSI-high, chemo
MSS/MSI-low, surgery only
MSS/MSI-low, chemo
12
29(2)
78(1)
361(7)
914(11)
24
27(3)
74(1)
299(20)
790(21)
36
25(5)
68(3)
245(31)
699(35)
48
20(8)
52(19)
197(56)
502(187)
60
15(14)
32(37)
138(101)
320(340)
72
4(24)
20(48)
77(157)
171(488)
84
1(28)
7(65)
18(219)
41(632)
0
33(0)
28(0)
422(0)
426(0)
Overa
ll surv
ival
1.0
0.8
0.6
0.4
0.2
0
MSI-high, surgery only
MSI-high, chemo
MSS/MSI-low, surgery only
MSS/MSI-low, chemo
12
29(2)
23(0)
361(7)
377(7)
24
27(3)
21(0)
299(20)
321(14)
36
25(5)
18(2)
245(31)
281(26)
48
20(8)
18(2)
197(56)
235(57)
60
15(14)
13(6)
138(101)
177(102)
72
4(24)
8(10)
77(157)
111(169)
84
1(28)
4(18)
18(219)
35(263)
DFS OS

66: MSI-GC-01: Individual patient data (IPD) meta-analysis of microsatellite
instability (MSI) and gastric cancer (GC) from four randomized clinical trials
(RCTs) – Pietrantonio F, et al
Conclusions
• In patients with resectable gastric cancer, MSI is an independent prognostic marker
and should be considered as a stratification factor in future trials
• In patients with gastric cancer who are MSI-high, further investigation is required on
chemotherapy omission and/or immune checkpoint blockade depending on the risk
of relapse
Pietrantonio F, et al. J Clin Oncol 2019;37(Suppl):Abstr 66

CANCERS OF THE PANCREAS,
SMALL BOWEL AND
HEPATOBILIARY TRACT

PANCREATIC CANCER
Cancers of the pancreas, small bowel and hepatobiliary tract

*Gemcitabine 1 g/m2 D1, 8 + oral S-1 40 mg/m2 bid D1–14
for 2 cycles; †S-1 for 6 months in patients with curative
resection and fully recovered within 10 weeks of surgery
189: Randomized phase II/III trial of neoadjuvant chemotherapy with
gemcitabine and S-1 versus upfront surgery for resectable pancreatic
cancer (Prep-02/JSAP-05) – Unno M, et al
Study objective
• To assess the efficacy and safety of neoadjuvant chemotherapy compared with upfront
surgery in patients with resectable pancreatic ductal adenocarcinoma
Unno M, et al. J Clin Oncol 2019;37(Suppl):Abstr 189
PRIMARY ENDPOINT
• OS
SECONDARY ENDPOINTS
• Resection rate, RFS, safety
Key patient inclusion criteria
• Pancreatic ductal
adenocarcinoma
• Treatment naïve
• R0/R1 resectable
• ECOG PS 0–1
(n=364)
R
1:1
Stratification
• CA19-9
• Institutions
Neoadjuvant chemotherapy
(gemcitabine + S-1)* +
surgery + adjuvant (S-1)†
(n=182)
Surgery + adjuvant (S-1)†
(n=180)

189: Randomized phase II/III trial of neoadjuvant chemotherapy with
gemcitabine and S-1 versus upfront surgery for resectable pancreatic
cancer (Prep-02/JSAP-05) – Unno M, et al
Key results
Unno M, et al. J Clin Oncol 2019;37(Suppl):Abstr 189
OS
Neoadjuvant chemotherapy:
36.7 months (95%CI 28.7, 43.3)
Upfront surgery:
26.7 months (95%CI 21.0, 31.3)
HR 0.72 (95%CI 0.55, 0.94);
log-rank test p=0.015
2-year OS: 63.7% vs. 52.5%
Ove
rall
su
rviv
al, %
Time, years
100
80
60
40
20
0
0
182
180
1
154
135
2
111
94
3
70
53
4
29
18
5
7
6
No. at risk
Neoadjuvant chemo
Upfront surgery
Neoadjuvant chemotherapy
Upfront surgery
189: Randomized phase II/III trial of neoadjuvant chemotherapy with
gemcitabine and S-1 versus upfront surgery for resectable pancreatic
cancer (Prep-02/JSAP-05) – Unno M, et al
Key results (cont.)
Unno M, et al. J Clin Oncol 2019;37(Suppl):Abstr 189
Recurrence, n (%) Neoadjuvant chemotherapy
(n=182)
Upfront surgery
(n=180) p-value
Local 30 (27.3) 27 (22.9) 0.54
Liver 33 (30.0) 56 (47.5) 0.01
Distant LN 18 (16.4) 28 (23.7) 0.22
Lung 20 (18.2) 16 (13.6) 0.44
Peritoneal dissemination 23 (20.9) 17 (14.4) 0.26
Others 8 (7.3) 13 (11.0) 0.46

189: Randomized phase II/III trial of neoadjuvant chemotherapy with
gemcitabine and S-1 versus upfront surgery for resectable pancreatic
cancer (Prep-02/JSAP-05) – Unno M, et al
Key results (cont.)
Conclusion
• In patients with pancreatic ductal adenocarcinoma, neoadjuvant chemotherapy
significantly improved survival over upfront surgery and may be a new SoC for
these patients
Unno M, et al. J Clin Oncol 2019;37(Suppl):Abstr 189
AEs with neoadjuvant chemotherapy, n (%) Grade 3 Grade 4
Total 84 (48.8) 41 (23.8)
Hematologic 71 (41.3) 41 (23.8)
Leukopenia 46 (26.7) 7 (4.1)
Neutrophilia 60 (34.9) 39 (22.7)
Anemia 7 (4.1) 1 (0.6)
Thrombocytopenia 6 (3.5) 4 (2.3)
Febrile neutropenia 11 (6.4) 0
Stomatitis 10 (5.8) 0
Appetite loss 13 (7.6) 0
Skin rash 15 (8.7) 0

192: Immune checkpoint inhibition (ICI) in combination with SBRT in
patients with advanced pancreatic adenocarcinoma – Brar G, et al
Study objective
• To assess the efficacy and safety of ICI + SBRT in patients with advanced pancreatic
adenocarcinoma
Brar G, et al. J Clin Oncol 2019;37(Suppl):Abstr 192
PRIMARY ENDPOINT
• Safety
SECONDARY ENDPOINTS
• ORR, PFS, OS
Durvalumab 1500 mg iv q4w
(n=14)
Key patient inclusion criteria
• Advanced pancreatic
adenocarcinoma
(n=51)
SBRT
8 Gy x 1
SBRT
5 Gy x 5
Durvalumab 1500 mg iv q4w +
tremelimumab 75 mg iv q4w x 4
(n=17)
Durvalumab 1500 mg iv q2w
(n=10)
Durvalumab 1500 mg iv q4w +
tremelimumab 75 mg iv q4w x 4
(n=10)

192: Immune checkpoint inhibition (ICI) in combination with SBRT in
patients with advanced pancreatic adenocarcinoma – Brar G, et al
Key results
Brar G, et al. J Clin Oncol 2019;37(Suppl):Abstr 192
Response, n (%)
ORR 3 (10.3)
CR 0
PR 3 (10.3)
SD 8 (27.6)
PD 18 (62.1)
8 Gy x 1 + durvalumab
5 Gy x 5 + durvalumab
8 Gy x 1 + durvalumab + tremelimumab
5 Gy x 5 + durvalumab + tremelimumab
Ma
xim
um
re
du
ctio
n fro
m b
ase
line
, %
200
150
100
50
0
–50
–100

192: Immune checkpoint inhibition (ICI) in combination with SBRT in
patients with advanced pancreatic adenocarcinoma – Brar G, et al
Key results (cont.)
Brar G, et al. J Clin Oncol 2019;37(Suppl):Abstr 192
Cohort PFS, months (95%CI)
8 Gy x 1 +
durvalumab 1.7 (0.7, 2.8)
5 Gy x 5 +
durvalumab 2.6 (2.1, 4.7)
8 Gy x 1 +
durvalumab +
tremelimumab
1.6 (0.5, 4.0)
5 Gy x 5 +
durvalumab +
tremelimumab
3.2 (1.5, 16.5)
8 Gy x 1 + durvalumab
5 Gy x 5 + durvalumab
8 Gy x 1 + durvalumab + tremelimumab
5 Gy x 5 + durvalumab + tremelimumab
Pro
gre
ssio
n-f
ree s
urv
iva
l, %
100
75
50
25
0 0 5 10 15 20
Time, months
PFS

192: Immune checkpoint inhibition (ICI) in combination with SBRT in
patients with advanced pancreatic adenocarcinoma – Brar G, et al
Key results (cont.)
Brar G, et al. J Clin Oncol 2019;37(Suppl):Abstr 192
Cohort OS, months (95%CI)
8 Gy x 1 +
durvalumab 3.4 (0.9, 11.4)
5 Gy x 5 +
durvalumab 9.1 (3.4, 18.7)
8 Gy x 1 +
durvalumab +
tremelimumab
3.0 (0.7, 6.6)
5 Gy x 5 +
durvalumab +
tremelimumab
6.4 (1.5, 17.6)
8 Gy x 1 + durvalumab
5 Gy x 5 + durvalumab
8 Gy x 1 + durvalumab + tremelimumab
5 Gy x 5 + durvalumab + tremelimumab
Ove
rall
su
rviv
al, %
100
75
50
25
0 0 5 10 15 20
Time, months
OS

192: Immune checkpoint inhibition (ICI) in combination with SBRT in
patients with advanced pancreatic adenocarcinoma – Brar G, et al
Key results (cont.)
• The most common grade 2 TRAEs were hypothyroidism (6.5%) and rash (3.2%) and
grade 3 TRAEs were hyperthyroidism (3.2%), lymphopenia (3.2%), diarrhea (3.2%) and
dysgeusia (3.2%)
Conclusion
• In patients with advanced pancreatic adenocarcinoma, combined SBRT with ICI was
generally well tolerated and provided some durable responses
Brar G, et al. J Clin Oncol 2019;37(Suppl):Abstr 192

HEPATOCELLULAR
CARCINOMA
Cancers of the pancreas, small bowel and hepatobiliary tract

185: Randomized, open-label, perioperative phase II study evaluating
nivolumab alone versus nivolumab plus ipilimumab in patients with
resectable HCC – Kaseb AO, et al
Study objective
• To assess the efficacy and safety of perioperative nivolumab + ipilimumab in patients with
HCC
Kaseb AO, et al. J Clin Oncol 2019;37(Suppl):Abstr 185
PRIMARY ENDPOINT
• Safety
R
Nivolumab
240 mg q2w
+ ipilimumab
1 mg/kg
for 6 weeks
(n=3) Key patient inclusion criteria
• Resectable HCC
(n=30) Nivolumab
240 mg q2w
for 6 weeks
(n=5)
SECONDARY ENDPOINTS
• ORR, pCR, TTP
Surgical
resection
within
4 weeks
of last
cycle
Continue
adjuvant
immunotherapy
for up to
2 years after
resection

185: Randomized, open-label, perioperative phase II study evaluating
nivolumab alone versus nivolumab plus ipilimumab in patients with
resectable HCC – Kaseb AO, et al
Key results
*Post therapy ‘surgical’ sample from 1 patient not available Kaseb AO, et al. J Clin Oncol 2019;37(Suppl):Abstr 185
Fre
qu
en
cy (
% o
f C
D4
5)
40
30
20
10
0
CD3+CD8+CD45RO+Eomes+
Fre
qu
en
cy (
% o
f C
D4
5)
15
10
5
0
CD
8 e
ffe
cto
r/C
D4
Tre
gs r
atio
25
20
10
5
0
15
3075
3169
3246
3075
3169
3246
3075
3169
3246
CD3+CD8+CD45RO+Eomes
+CD57+CD38low
CD8 effector T cell/CD4 Tregs in
tumor tissue

185: Randomized, open-label, perioperative phase II study evaluating
nivolumab alone versus nivolumab plus ipilimumab in patients with
resectable HCC – Kaseb AO, et al
Key results (cont.)
Kaseb AO, et al. J Clin Oncol 2019;37(Suppl):Abstr 185
CD3+CD8+CD45RO+Eomes+ 40
30
20
10
0 Pre Post IT
Responder n=3
Non-responder n=5
p = 0.003
Fre
qu
en
cy
(% o
f C
D4
5)
15
10
5
0 Responder Non-responder
Da
ta p
ost-
pre
(% o
f C
D4
5)
25
15
5
0 Responder Non-responder
20
10
p = 0.01448
CD3+CD8+CD45RO+Eomes
+CD57+CD38low 20
15
10
5
0 Pre Post IT
Responder n=3
Non-responder n=5
p = 0.001 15
10
5
0 Responder Non-responder
6
4
2
0 Responder Non-responder
p = 0.431

185: Randomized, open-label, perioperative phase II study evaluating
nivolumab alone versus nivolumab plus ipilimumab in patients with
resectable HCC – Kaseb AO, et al
Key results (cont.)
• pCR was demonstrated in 3 of the 8 patients
• The most common grade 3 AE preoperative was ALT/AST increase in 1 patient and
postoperative were colitis and amylase/lipase increase occurring in 1 patient each
Conclusion
• In patients with resectable HCC, perioperative nivolumab + ipilimumab demonstrated
encouraging responses and was generally well tolerated with no delays in surgical
resection in this interim analysis
Kaseb AO, et al. J Clin Oncol 2019;37(Suppl):Abstr 185

186: Analysis of survival and objective response (OR) in patients with
hepatocellular carcinoma in a phase III study of lenvatinib (REFLECT)
– Kudo M, et al
Study objective
• To assess the relationship between OR and OS in patients with HCC treated with
lenvatinib or sorafenib in the REFLECT trial
†Excluded patients with ≥50% liver occupation, clear bile duct
invasion, or portal vein invasion at the main portal vein Kudo M, et al. J Clin Oncol 2019;37(Suppl):Abstr 186
R
1:1
PD/
death
Stratification
• Region (Asia-Pacific vs. Western)
• MVI and/or EHS (yes vs. no)
• ECOG PS (0 vs. 1)
• BW (<60 kg vs. ≥60 kg)
Lenvatinib 8 mg/day
(BW <60 kg) or 12 mg/day
(BW ≥60 kg) (n=478)
Key patient inclusion criteria†
• No prior systemic therapy
for unresectable HCC
• ≥1 measurable target lesion
per mRECIST
• BCLC stage B or C
• Child-Pugh A
• ECOG PS ≤1
(n=954)
EXPLORATORY ENDPOINT
• OR and OS in responders (CR or PR) and
non-responders (SD, PD or unknown/NE)
PD/
death
Sorafenib 400 mg bid
(n=476)
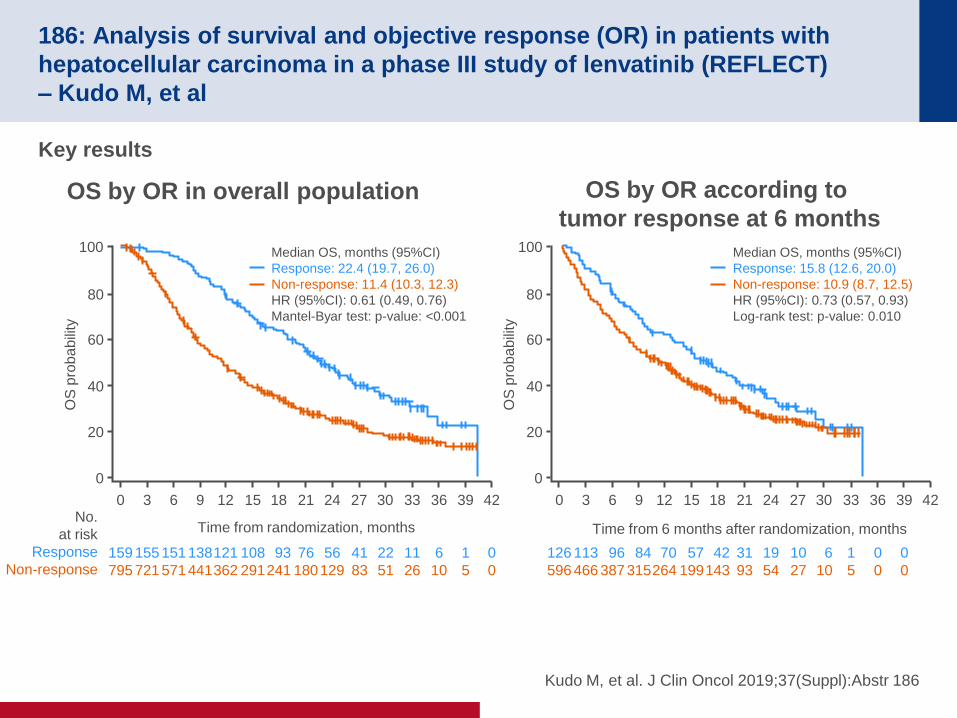
186: Analysis of survival and objective response (OR) in patients with
hepatocellular carcinoma in a phase III study of lenvatinib (REFLECT)
– Kudo M, et al
Key results
Kudo M, et al. J Clin Oncol 2019;37(Suppl):Abstr 186
OS by OR in overall population OS by OR according to
tumor response at 6 months
OS
pro
ba
bili
ty
Time from randomization, months
100
80
60
40
20
0
0
159
795
3
155
721
6
151
571
9
138
441
12
121
362
15
108
291
18
93
241
21
76
180
24
56
129
27
41
83
30
22
51
33
11
26
36
6
10
42
0
0
39
1
5
No.
at risk
Response
Non-response
Median OS, months (95%CI)
Response: 22.4 (19.7, 26.0)
Non-response: 11.4 (10.3, 12.3)
HR (95%CI): 0.61 (0.49, 0.76)
Mantel-Byar test: p-value: <0.001
OS
pro
ba
bili
ty
Time from 6 months after randomization, months
100
80
60
40
20
0
0
126
596
3
113
466
6
96
387
9
84
315
12
70
264
15
57
199
18
42
143
21
31
93
24
19
54
27
10
27
30
6
10
33
1
5
36
0
0
42
39
0
0
Median OS, months (95%CI)
Response: 15.8 (12.6, 20.0)
Non-response: 10.9 (8.7, 12.5)
HR (95%CI): 0.73 (0.57, 0.93)
Log-rank test: p-value: 0.010

186: Analysis of survival and objective response (OR) in patients with
hepatocellular carcinoma in a phase III study of lenvatinib (REFLECT)
– Kudo M, et al
Key results (cont.)
Conclusions
• In patients with HCC, mRECIST OR was an independent predictor of OS regardless
of treatment
• Those patients who have an OR are likely to have a longer survival
Kudo M, et al. J Clin Oncol 2019;37(Suppl):Abstr 186
Multivariate analysis of factors associated with OS HR (95%CI) p-value
Macroscopic portal vein invasion (yes vs. no) 1.366 (1.141, 1.636) 0.0007
Baseline AFP (<200 vs. ≥200 mg/mL) 0.564 (0.483, 0.659) <0.0001
No. of tumor sites at baseline (2 vs. 1) 1.400 (1.180, 1.662) <0.0001
No. of tumor sites at baseline (≥3 vs. 1) 2.024 (1.659, 2.469) <0.0001
Involved tumor site – liver (yes vs. no) 1.675 (1.203, 2.332) 0.0022
Etiology HBV (yes vs. no) 1.199 (1.031, 1.395) 0.0185
Prior procedure for HCC (yes vs. no) 0.844 (0.723, 0.986) 0.0323
Treatment (lenvatinib vs. sorafenib) 0.855 (0.734, 0.996) 0.0439
Objective response (yes vs. no) 0.611 (0.490, 0.762) <0.0001

*Sorafenib for HCC and chemotherapy for BTC
336: Combined immune checkpoint inhibition (ICI) with tremelimumab and
durvalumab in patients with advanced hepatocellular carcinoma (HCC) or
biliary tract carcinomas (BTC) – Floudas CS, et al
Study objective
• To assess the efficacy and safety of tremelimumab + durvalumab in patients with
advanced HCC or BTC
Floudas CS, et al. J Clin Oncol 2019;37(Suppl):Abstr 336
PRIMARY ENDPOINT
• 6-month PFS
PD/
toxicity
Tremelimumab 75 mg +
durvalumab 1500 mg
for 4 doses
Key patient inclusion criteria
• Advanced HCC or BTC
(intrahepatic, extrahepatic,
gallbladder or ampullary)
• Not amenable for
resection, transplantation
or ablation
• Progressed on ≥1 prior
therapy*
• ECOG PS 0–2
(n=22)
SECONDARY ENDPOINTS
• OS, DCR, safety
Durvalumab
1500 mg q4w

336: Combined immune checkpoint inhibition (ICI) with tremelimumab and
durvalumab in patients with advanced hepatocellular carcinoma (HCC) or
biliary tract carcinomas (BTC) – Floudas CS, et al
Key results
Floudas CS, et al. J Clin Oncol 2019;37(Suppl):Abstr 336
BTC: median 3.1 months (95%CI 0.8, 4.6)
Pro
gre
ssio
n-f
ree
su
rviv
al, %
Time, months
100
50
0 0 1 2 3 4 5
HCC: median 7.8 months (95%CI 2.6, 10.6)
Pro
gre
ssio
n-f
ree
su
rviv
al, %
Time, months
100
50
0 0 5 10 15 20 25
BTC: median 5.45 months (95%CI 4.6, 8.3)
Ove
rall
su
rviv
al, %
Time, months
100
50
0 0 5 10 15
HCC: median 15.9 months (95%CI 7.1, 16.3)
Ove
rall
su
rviv
al, %
Time, months
100
50
0 0 5 10 15 20 25
PFS OS

336: Combined immune checkpoint inhibition (ICI) with tremelimumab and
durvalumab in patients with advanced hepatocellular carcinoma (HCC) or
biliary tract carcinomas (BTC) – Floudas CS, et al
Key results (cont.)
Floudas CS, et al. J Clin Oncol 2019;37(Suppl):Abstr 336
Response HCC
(n=10)
BTC
(n=12)
BOR, n (%)
PR 2 (20.0) 1 (8.3)
SD 5 (50.0) 5 (41.7)
PD 2 (20.0) 5 (41.7)
NA 1 (10.0) 1 (8.3)
DCR, n (%) [95%CI] 7 (70.0) [39.6, 89.2] 6 (50.0) [25.3, 74.6]

336: Combined immune checkpoint inhibition (ICI) with tremelimumab and
durvalumab in patients with advanced hepatocellular carcinoma (HCC) or
biliary tract carcinomas (BTC) – Floudas CS, et al
Key results (cont.)
• Grade ≥3 TRAEs included hyponatremia, lymphopenia, bullous dermatitis,
hypophosphatemia, infection, oral mucositis, pain, maculopapular rash, anaphylaxis,
respiratory failure, pleural effusion and dyspnea
Conclusion
• In patients with HCC and BTC, tremelimumab + durvalumab provided encouraging
activity and was generally well tolerated
Floudas CS, et al. J Clin Oncol 2019;37(Suppl):Abstr 336

BILIARY TRACT CANCER
Cancers of the pancreas, small bowel and hepatobiliary tract

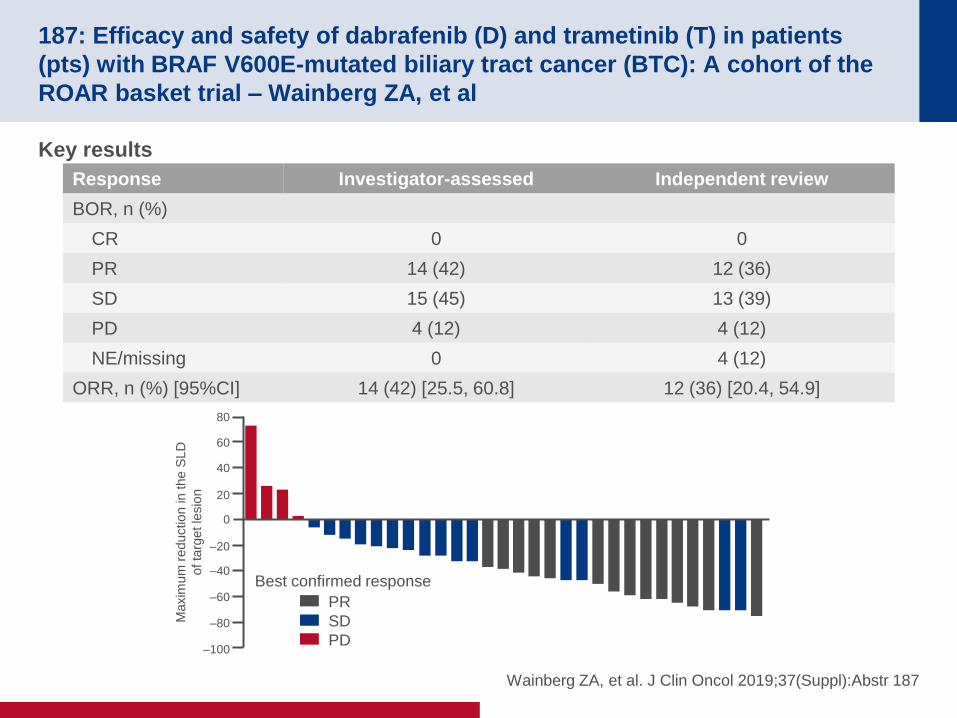
187: Efficacy and safety of dabrafenib (D) and trametinib (T) in patients
(pts) with BRAF V600E-mutated biliary tract cancer (BTC): A cohort of the
ROAR basket trial – Wainberg ZA, et al
Study objective
• To assess the efficacy and safety of dabrafenib (a BRAF inhibitor) + trametinib (a MEK
inhibitor) in the cohort of patients with BRAF V600E-mutated BTC in the ROAR basket trial
Wainberg ZA, et al. J Clin Oncol 2019;37(Suppl):Abstr 187
PRIMARY ENDPOINT
• ORR (RECIST v1.1)
PD/
toxicity/
death
Dabrafenib 150 mg bid +
trametinib 2 mg/day
Key patient inclusion criteria
• Advanced or metastatic BTC
• BRAF V600E mutated
• Progression on gemcitabine
• ECOG PS ≤2
(n=35)
SECONDARY ENDPOINTS
• DoR, PFS, OS, biomarkers, safety
187: Efficacy and safety of dabrafenib (D) and trametinib (T) in patients
(pts) with BRAF V600E-mutated biliary tract cancer (BTC): A cohort of the
ROAR basket trial – Wainberg ZA, et al
Key results
Wainberg ZA, et al. J Clin Oncol 2019;37(Suppl):Abstr 187
Response Investigator-assessed Independent review
BOR, n (%)
CR 0 0
PR 14 (42) 12 (36)
SD 15 (45) 13 (39)
PD 4 (12) 4 (12)
NE/missing 0 4 (12)
ORR, n (%) [95%CI] 14 (42) [25.5, 60.8] 12 (36) [20.4, 54.9]
Maxim
um
reduction in the S
LD
of ta
rget le
sio
n
80
60
40
20
0
–20
–40
–80
–100
–60 PR
SD
PD
Best confirmed response

187: Efficacy and safety of dabrafenib (D) and trametinib (T) in patients
(pts) with BRAF V600E-mutated biliary tract cancer (BTC): A cohort of the
ROAR basket trial – Wainberg ZA, et al
Key results (cont.)
Wainberg ZA, et al. J Clin Oncol 2019;37(Suppl):Abstr 187
PFS
OS
Pro
gre
ssio
n-f
ree
su
rviv
al
Treatment duration, weeks
1.0
0.8
0.6
0.4
0.2
0 0
33
10
28
20
21
30
14
40
8
50
5
60
5
70
5
80
3
90
2
100
1
110
1
120
1
130
1
140
1
150
0
160
0
170
0
180
0
190
0
200
0 No. at risk
Median PFS 9.2 months by investigator assessment
(95%CI 5.4, 10.1)
OS
Ove
rall
su
rviv
al
Treatment duration, weeks
1.0
0.8
0.6
0.4
0.2
0 0
33
10
32
20
28
30
20
40
13
50
9
60
7
70
6
80
3
90
3
100
3
110
2
120
2
130
1
140
1
150
0
160
0
170
0
180
0
190
0
200
0 No. at risk
Median OS 11.7 months
(95%CI 7.5, 17.7)

187: Efficacy and safety of dabrafenib (D) and trametinib (T) in patients
(pts) with BRAF V600E-mutated biliary tract cancer (BTC): A cohort of the
ROAR basket trial – Wainberg ZA, et al
Key results (cont.)
Conclusion
• In patients with BRAF V600E-mutated BTC, dabrafenib + trametinib provided clinical
benefit with efficacy similar to 1L gemcitabine + cisplatin
Wainberg ZA, et al. J Clin Oncol 2019;37(Suppl):Abstr 187
AEs, n (%) BTC cohort (n=35)
Any grade / grade 3–4 35 (100) / 20 (57)
TRAEs 32 (91)
Pyrexia 14 (40)
Rash 10 (29)
Nausea 8 (23)
Diarrhea 8 (23)
Fatigue 8 (23)
Chills 7 (20)
SAEs 14 (40)
Leading to dose reduction / dose interruption / discontinuation 13 (37) / 19 (54) / 1 (3)

345: Regorafenib after failure of gemcitabine and platinum-based
chemotherapy for locally advanced (nonresectable) and metastatic biliary
tumors: A randomized double-blinded placebo-controlled phase II trial
– Demols A, et al
Study objective
• To assess the efficacy and safety of regorafenib + BSC in previously treated patients with
unresectable or metastatic BTC
Demols A, et al. J Clin Oncol 2019;37(Suppl):Abstr 345
R
1:1
PD/
toxicity
Regorafenib 160 mg/day
(3 weeks on/1 week off) + BSC
(n=33) Key patient inclusion criteria
• Unresectable or metastatic BTC
• Progressed on gemcitabine and
platinum-based chemotherapy
• PS 0–1
(n=66) Placebo + BSC
(n=33)
PRIMARY ENDPOINT
• PFS
SECONDARY ENDPOINTS
• OS, ORR, safety
PD/
toxicity

345: Regorafenib after failure of gemcitabine and platinum-based
chemotherapy for locally advanced (nonresectable) and metastatic biliary
tumors: A randomized double-blinded placebo-controlled phase II trial
– Demols A, et al
Key results
Demols A, et al. J Clin Oncol 2019;37(Suppl):Abstr 345
OS PFS
Regorafenib Placebo HR (95%CI); p-value
Median PFS, months (95%CI) 3.0 (2.3, 4.9) 1.5 (1.2, 2.0) 0.49 (0.29, 0.81); 0.005
Estimated 6-month PFS rate, % (95%CI) 21 (7, 35) 3 (0, 12)
Median OS, months (95%CI) 5.3 (2.7, 10.5) 5.0 (3.0, 6.4) 0.76 (0.44, 1.30); 0.31
Estimated 6-month OS rate, % (95%CI) 48 (31, 65) 40 (22, 58)
DCR, % (95%CI) 70 (51, 84) 33 (18, 52) 0.002
Ra
te
Time, months
1.0
0.8
0.6
0.4
0.2
0
0
33
33
2.5
22
8
5.0
10
2
7.5
6
1
10.0
5
1
12.5
2
1
15.0
1
1
No. at risk
Regorafenib
Placebo
Regorafenib
Placebo
Ra
te
Time, months
1.0
0.8
0.6
0.4
0.2
0
0
33
33
2.5
24
24
5.0
17
16
7.5
11
8
10.0
9
5
12.5
6
3
15.0
6
3
Regorafenib
Placebo

345: Regorafenib after failure of gemcitabine and platinum-based
chemotherapy for locally advanced (nonresectable) and metastatic biliary
tumors: A randomized double-blinded placebo-controlled phase II trial
– Demols A, et al
Key results (cont.)
Conclusions
• In previously treated patients with unresectable or metastatic BTC, regorafenib
provided significant improvement in PFS and DCR but not OS
• Regorafenib was generally well tolerated with no new safety signals
Demols A, et al. J Clin Oncol 2019;37(Suppl):Abstr 345
Grade ≥3 AEs, n Regorafenib (n=33) Placebo (n=33)
Nausea 2 2
Vomiting 1 0
Fatigue 6 3
Diarrhea 1 0
Hypophosphatemia 1 0
Cutaneous toxicity 2 0
Mucositis 1 0
Anorexia 1 1
NEUROENDOCRINE TUMOUR
Cancers of the pancreas, small bowel and hepatobiliary tract

190: Pembrolizumab treatment of advanced neuroendocrine tumors:
Results from the phase II KEYNOTE-158 study – Strosberg JR, et al
Study objective
• To assess the efficacy and safety of pembrolizumab in patients with advanced
neuroendocrine tumors
Strosberg JR, et al. J Clin Oncol 2019;37(Suppl):Abstr 190
PRIMARY ENDPOINT
• ORR (RECIST v1.1)
SECONDARY ENDPOINTS
• DoR, PFS, OS, safety
Pembrolizumab 200 mg iv
q3w for up to 2 years
PD/
toxicity/
withdrawal
Key patient inclusion criteria
• Advanced neuroendocrine tumors of
lung, appendix, small intestine,
colon, rectum or pancreas
• Progression or intolerance to ≥1L of
standard therapy
• Tumor sample for biomarker
analysis
• ECOG PS 0–1
(n=107)

190: Pembrolizumab treatment of advanced neuroendocrine tumors:
Results from the phase II KEYNOTE-158 study – Strosberg JR, et al
Key results
*Includes 8 patients with unknown PD-L1 expression Strosberg JR, et al. J Clin Oncol 2019;37(Suppl):Abstr 190
Response Overall*
(n=107)
PD-L1 positive (CPS ≥1)
(n=17)
PD-L1 negative
(n=82)
ORR, % (95%CI) 3.7 (1.0, 9.3) 0 (0, 19.5) 4.9 (1.8, 12.0)
BOR, n (%)
CR 0 0 0
PR 4 (3.7) 0 4 (4.9)
SD 61 (57.0) 11 (64.7) 46 (56.1)
PD 33 (30.8) 6 (35.3) 23 (28.0)
NE 5 (4.7) 0 5 (6.1)
No assessment 4 (3.7) 0 4 (4.9)

190: Pembrolizumab treatment of advanced neuroendocrine tumors:
Results from the phase II KEYNOTE-158 study – Strosberg JR, et al
Key results (cont.)
Strosberg JR, et al. J Clin Oncol 2019;37(Suppl):Abstr 190
PFS OS
Events, n Median (95%CI)
83 4.1 (3.5, 5.4)
Pa
tie
nts
aliv
e a
nd
with
ou
t P
D, %
Time, months
1.0
0.8
0.6
0.4
0.2
0 0
107
4
55
8
23
12
13
16
4
20
1
24
0
No.
at risk
Pa
tie
nts
aliv
e, %
Time, months
1.0
0.8
0.6
0.4
0.2
0 0
107
4
92
8
79
12
70
16
59
20
15
24
0
No.
at risk
Events, n Median (95%CI)
40 NR (18.8, NR)

190: Pembrolizumab treatment of advanced neuroendocrine tumors:
Results from the phase II KEYNOTE-158 study – Strosberg JR, et al
Key results (cont.)
Conclusions
• In patients with advanced NETs, pembrolizumab demonstrated only 4 PRs although
the responses were durable
• The safety profile of pembrolizumab was consistent with previous findings
Strosberg JR, et al. J Clin Oncol 2019;37(Suppl):Abstr 190
TRAEs Immune-mediated AEs
0
5
10
15
20
25 Grade 1–2 Grade 3 Grade 1–2 Grade 3
Patients
, %
0
2
4
6
8
10
12
Patients
, %

332: Progression-free survival (PFS) and subgroup analyses of lenvatinib in
patients (pts) with G1/G2 advanced pancreatic (panNETs) and
gastrointestinal (giNETs) neuroendocrine tumors (NETS): Updated results
from the phase II TALENT trial (GETNE 1509) – Capdevila J, et al
Study objective
• To assess the efficacy and safety of lenvatinib in patients with advanced pancreatic or
gastrointestinal NETs – updated results from the TALENT trial
*For pancreatic NETs, PD to targeted agents was
mandatory regardless of prior therapy with somatostatin
analogs or chemotherapy; for gastrointestinal NETs, PD
on somatostatin analogs Capdevila J, et al. J Clin Oncol 2019;37(Suppl):Abstr 332
PRIMARY ENDPOINT
• ORR (RECIST v1.1)
SECONDARY ENDPOINTS
• PFS, OS, biomarkers, safety
R
PD/
toxicity
Cohort A: Pancreatic
Lenvatinib 24 mg/day
(n=55) Key patient inclusion criteria
• Advanced pancreatic or
gastrointestinal NETs
• Disease progression by
RECIST*
(n=110) Cohort B: Gastrointestinal
Lenvatinib 24 mg/day
(n=56)
PD/
toxicity

332: Progression-free survival (PFS) and subgroup analyses of lenvatinib in
patients (pts) with G1/G2 advanced pancreatic (panNETs) and
gastrointestinal (giNETs) neuroendocrine tumors (NETS): Updated results
from the phase II TALENT trial (GETNE 1509) – Capdevila J, et al
Key results
Capdevila J, et al. J Clin Oncol 2019;37(Suppl):Abstr 332
PFS
Su
rviv
al p
rob
ab
ility
Time to progression or exitus, months
1.0
0.8
0.6
0.4
0.2
0
0 5 10 15 20 25 30
Median 15.8 (95%CI 11.4, NA)
Pancreatic
Su
rviv
al p
rob
ab
ility
Time to progression or exitus, months
1.0
0.8
0.6
0.4
0.2
0
0 5 10 15 20 25 30
Median 15.4 (95%CI 11.5, 19.5)
Gastrointestinal
ORR, % (95%CI)
Pancreatic 40.4 (27.3, 54.9)
Gastrointestinal 18.5 (9.7, 31.9)

332: Progression-free survival (PFS) and subgroup analyses of lenvatinib in
patients (pts) with G1/G2 advanced pancreatic (panNETs) and
gastrointestinal (giNETs) neuroendocrine tumors (NETS): Updated results
from the phase II TALENT trial (GETNE 1509) – Capdevila J, et al
Key results (cont.)
Conclusion
• In patients with pancreatic or gastrointestinal NETs, lenvatinib demonstrated high
ORR and encouraging PFS data
Capdevila J, et al. J Clin Oncol 2019;37(Suppl):Abstr 332
Grade 3/4 AEs occurring
in ≥5%, n (%)
Pancreatic NETs
(n=55)
Gastrointestinal NETs
(n=56)
Asthenia/fatigue 4 (7.2) 11 (19.6)
Hypertension 10 (18.1) 13 (23.2)
Diarrhea 3 (5.4) 5 (8.9)
Vomiting 4 (7.2) 1 (1.8)
Abdominal pain 3 (5.4) 3 (5.3)

CANCERS OF THE COLON,
RECTUM AND ANUS

480: A randomized, double-blinded, placebo-controlled multicentre phase II
trial of adjuvant immunotherapy with tecemotide (L-BLP25) after R0/R1
hepatic colorectal cancer metastasectomy (LICC): Final results
– Schimanski CC, et al
Study objective
• To assess the efficacy and safety of tecemotide (an antigen-specific cancer vaccine
targeting MUC1) in patients with liver metastases limited to CRC
*Three days prior to tecemotide or placebo,
cyclophosphamide 300 mg/m2 or matching
saline was given IV, respectively Schimanski CC, et al. J Clin Oncol 2019;37(Suppl):Abstr 480
R
2:1
PD
Tecemotide* 930 μg weekly x8 sc
followed by 6-week maintenance
for up to 2 years
(n=79)
Key patient inclusion criteria
• Stage IV CRC limited to liver
metastases
• Resection (R0/R1) of all liver
metastases
• Metastasectomy with any
neoadjuvant therapy
• ECOG PS 0–1
(n=121)
PD Placebo*
(n=42)
CO-PRIMARY ENDPOINTS
• RFS, 3-year OS
SECONDARY ENDPOINTS
• RFS and OS by MUC1 expression,
safety

480: A randomized, double-blinded, placebo-controlled multicentre phase II
trial of adjuvant immunotherapy with tecemotide (L-BLP25) after R0/R1
hepatic colorectal cancer metastasectomy (LICC): Final results
– Schimanski CC, et al
Key results
Schimanski CC, et al. J Clin Oncol 2019;37(Suppl):Abstr 480
RFS OS
Outcome Tecemotide (n=79) Placebo (n=42) p-value
Median RFS, months (90%CI) 6.1 (5.8, 8.8) 11.4 (5.0, 20.3) 0.1754
Median OS, months (90%CI) 62.8 (45.1, NR) NA (53.6, NR) 0.2141
Su
rviv
al p
rob
ab
ility
Recurrence-free survival time, months
1.0
0.8
0.6
0.4
0.2
0 0
79
42
6
40
26
12
24
18
18
22
17
24
18
14
30
16
12
36
15
11
Tecemotide
Placebo
Tecemotide Placebo
Censored
Overall survival time, months
1.0
0.8
0.6
0.4
0.2
0
Tecemotide Placebo
0
79
42
12
64
37
24
54
34
36
40
29
48
24
16
60
10
8
72
0
0
Censored
6
72
38
18
62
34
30
48
32
42
31
24
54
17
9
66
4
2
No. at risk

480: A randomized, double-blinded, placebo-controlled multicentre phase II
trial of adjuvant immunotherapy with tecemotide (L-BLP25) after R0/R1
hepatic colorectal cancer metastasectomy (LICC): Final results
– Schimanski CC, et al
Key results (cont.)
Conclusion
• In patients with hepatic CRC metastasectomy, tecemotide did not provide any
benefit in survival over placebo
Schimanski CC, et al. J Clin Oncol 2019;37(Suppl):Abstr 480
Grade 3/4 AEs occurring in ≥2 patients, n (%) Tecemotide (n=79) Placebo (n=42)
Diarrhea 2 (2.5) 2 (4.8)
Back pain 2 (2.5) -
Anemia 2 (2.5) -
Cholestasis 1 (1.3) 2 (4.8)
Ileus 2 (2.5) -
Jaundice cholestatic 2 (2.5) -
Blood uric acid increased 2 (2.5) -

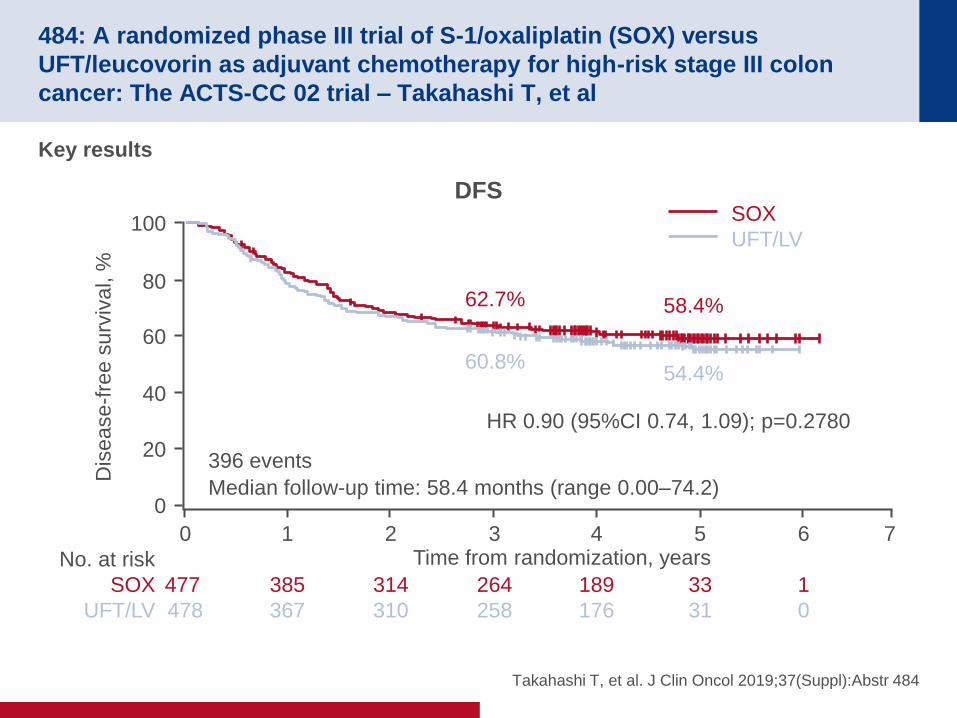
484: A randomized phase III trial of S-1/oxaliplatin (SOX) versus
UFT/leucovorin as adjuvant chemotherapy for high-risk stage III colon
cancer: The ACTS-CC 02 trial – Takahashi T, et al
Study objective
• To assess the efficacy and safety of S-1 + oxaliplatin (SOX) compared with UFT +
leucovorin in patients with high-risk stage III colon cancer
*S-1 80–120 mg/day according to BSA D1–14 + oxaliplatin
100 mg/m2 q3w for 8 course; †UFT 300–600 mg/day
according to BSA + leucovorin 75 mg/day D1–28 every
35 days for 5 courses Takahashi T, et al. J Clin Oncol 2019;37(Suppl):Abstr 484
R
1:1
PD
Stratification
• Tumor location (colon vs. upper rectum)
• Positive LNs (4–6 vs. ≥7)
• Institution
S-1 + oxaliplatin*
(n=477)
Key patient inclusion criteria
• High-risk stage III colon cancer
• Underwent curative resection
• ECOG PS 0–1
(n=966)
PD UFT + leucovorin†
(n=478)
PRIMARY ENDPOINT
• DFS
SECONDARY ENDPOINTS
• RFS, OS, safety
484: A randomized phase III trial of S-1/oxaliplatin (SOX) versus
UFT/leucovorin as adjuvant chemotherapy for high-risk stage III colon
cancer: The ACTS-CC 02 trial – Takahashi T, et al
Key results
Takahashi T, et al. J Clin Oncol 2019;37(Suppl):Abstr 484
DFS
Dis
ease
-fre
e s
urv
ival, %
Time from randomization, years
100
80
60
40
20
0
0
477
478
1
385
367
2
314
310
3
264
258
4
189
176
5
33
31
6
1
0
7
No. at risk
SOX
UFT/LV
SOX
UFT/LV
Median follow-up time: 58.4 months (range 0.00–74.2)
396 events
62.7% 58.4%
60.8% 54.4%
HR 0.90 (95%CI 0.74, 1.09); p=0.2780

484: A randomized phase III trial of S-1/oxaliplatin (SOX) versus
UFT/leucovorin as adjuvant chemotherapy for high-risk stage III colon
cancer: The ACTS-CC 02 trial – Takahashi T, et al
Key results (cont.)
Conclusion
• In patients with high-risk stage III colon cancer, SOX was not superior to UFT +
leucovorin, although in more advanced disease (stage IIIC, N2b) SOX may be effective
Takahashi T, et al. J Clin Oncol 2019;37(Suppl):Abstr 484
Grade ≥3 AEs occurring in ≥2%, n (%) SOX (n=459) UFT + leucovorin (n=472)
Neutropenia 79 (17.2) 7 (1.5)
Thrombocytopenia 13 (2.8) 3 (0.6)
AST 3 (0.7) 10 (2.1)
ALT 4 (0.9) 14 (3.0)
Nausea 9 (2.0) 4 (0.8)
Diarrhea 25 (5.4) 38 (8.1)
Anorexia 16 (3.5) 11 (2.3)
Peripheral sensory neuropathy 21 (4.6) 1 (0.2)

483: Does a longer waiting period after neoadjuvant radiochemotherapy
improve the oncological prognosis of rectal cancer? Three-year follow-up
results of the GRECCAR-6 randomized multicentre trial – Lefevre JH, et al
Study objective
• To assess whether a long waiting period between radiochemotherapy and resection in
patients with rectal cancer impacts the rate of cPR (ypT0N0) in the GRECCAR6 trial
Lefevre JH, et al. J Clin Oncol 2019;37(Suppl):Abstr 483
R
PD
7-week waiting period
after radiochemotherapy
45–50 Gy iv 5FU or
capecitabine (n=133) Key patient inclusion criteria
• Mid-low rectal cancer
• cT3-T4N0 or TxN+ M0
• ECOG PS 0–1
(n=265)
PD
11-week waiting period
after radiochemotherapy
45–50 Gy iv 5FU or
capecitabine (n=132)
PRIMARY ENDPOINT
• Pathologic complete response
(ypT0N0) rate
SECONDARY ENDPOINTS
• OS, DFS, rate of recurrence

483: Does a longer waiting period after neoadjuvant radiochemotherapy
improve the oncological prognosis of rectal cancer? Three-year follow-up
results of the GRECCAR-6 randomized multicentre trial – Lefevre JH, et al
Key results
• The pathologic complete response (ypT0N0) rate was 15% and 17.4% in the 7- and 11-week
groups, respectively (p=0.5983)
Lefevre JH, et al. J Clin Oncol 2019;37(Suppl):Abstr 483
OS DFS
Su
rviv
al p
rob
ab
ility
Time, months
1.0
0.8
0.6
0.4
0.2
0
7-week
11-week
Log rank p=0.8868
Censored
No. at risk
7-week
11-week
0
125
128
6
121
126
12
115
124
18
109
121
24
105
118
30
99
100
36
80
77
89.4% vs. 88.6%
Su
rviv
al p
rob
ab
ility
Time, months
1.0
0.8
0.6
0.4
0.2
0
7-week
11-week
Log rank p=0.8672
Censored
0
125
128
6
113
120
12
101
107
18
89
95
24
84
89
30
77
79
36
58
61
67.2% vs. 68.2%

483: Does a longer waiting period after neoadjuvant radiochemotherapy
improve the oncological prognosis of rectal cancer? Three-year follow-up
results of the GRECCAR-6 randomized multicentre trial – Lefevre JH, et al
Key results (cont.)
Conclusions
• In patients with rectal cancer, there was no difference on pathologic complete
response rate or survival and recurrence between a 7- or 11-week waiting period
after neoadjuvant radiochemotherapy
• It is suggested that surgery should be performed around 7–8 weeks after
radiochemotherapy in the absence of a rectal sparing strategy
Lefevre JH, et al. J Clin Oncol 2019;37(Suppl):Abstr 483
Outcomes at 3 years, % 7-week 11-week p-value
Metastatic recurrence 24.3 25.4 0.8589
Local recurrence 8.6 9.7 0.5780
In patients achieving ypT0N0 (n=43)
OS 89 95 0.2597
Metastatic recurrence 5 29 0.0045
Local recurrence 11 0 0.0357
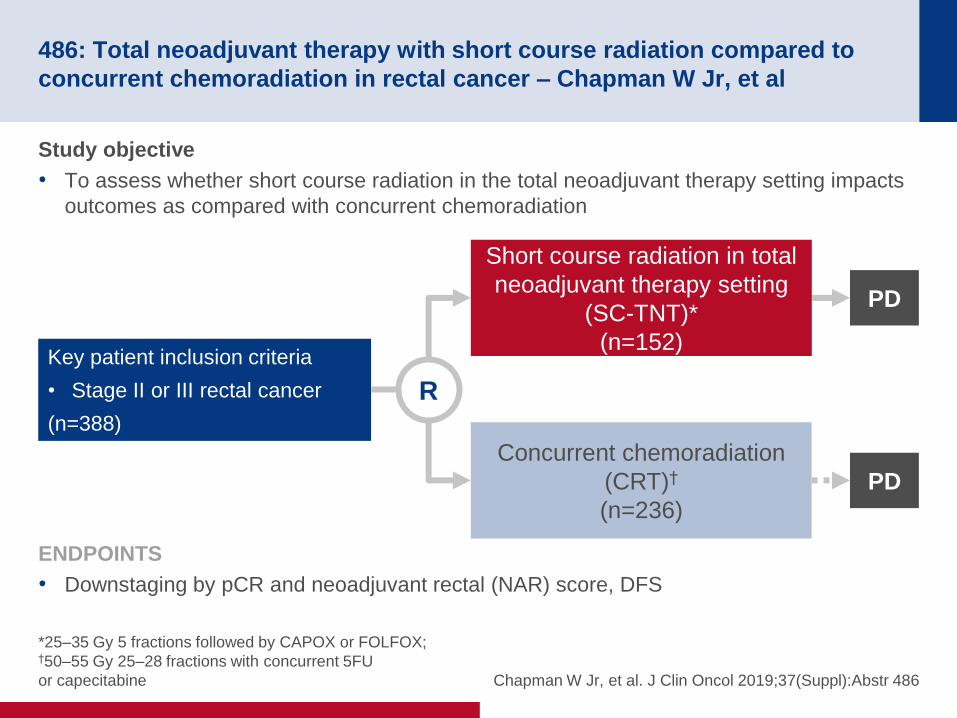
486: Total neoadjuvant therapy with short course radiation compared to
concurrent chemoradiation in rectal cancer – Chapman W Jr, et al
Study objective
• To assess whether short course radiation in the total neoadjuvant therapy setting impacts
outcomes as compared with concurrent chemoradiation
*25–35 Gy 5 fractions followed by CAPOX or FOLFOX; †50–55 Gy 25–28 fractions with concurrent 5FU
or capecitabine Chapman W Jr, et al. J Clin Oncol 2019;37(Suppl):Abstr 486
R
PD
Short course radiation in total
neoadjuvant therapy setting
(SC-TNT)*
(n=152) Key patient inclusion criteria
• Stage II or III rectal cancer
(n=388)
PD
Concurrent chemoradiation
(CRT)†
(n=236)
ENDPOINTS
• Downstaging by pCR and neoadjuvant rectal (NAR) score, DFS

486: Total neoadjuvant therapy with short course radiation compared to
concurrent chemoradiation in rectal cancer – Chapman W Jr, et al
Key results
Chapman W Jr, et al. J Clin Oncol 2019;37(Suppl):Abstr 486
Pro
babili
ty
Time, days
1.0
0.9
0.8
0.7
0.6
0.5 CRT
SC-TNT
Log-rank p=0.9911
DFS in total population
No. at risk
SC-TNT
CRT
0
138
223
300
108
172
600
73
136
900
56
114
1200
53
76
1500
47
54
1800
37
29
Pro
babili
ty
Time, days
1.0
0.9
0.8
0.7
0.6
0.5 CRT
SC-TNT
Log-rank p=0.1257
DFS in PROSPECT eligible subgroup
0
59
86
300
47
67
600
40
50
900
36
44
1200
35
29
1500
32
18
1800
26
10

486: Total neoadjuvant therapy with short course radiation compared to
concurrent chemoradiation in rectal cancer – Chapman W Jr, et al
Key results (cont.)
Conclusion
• In patients with rectal cancer, the use of short course radiation demonstrated
comparable effectiveness as concurrent chemoradiation with similar DFS although
short course radiation may provide better downstaging
Chapman W Jr, et al. J Clin Oncol 2019;37(Suppl):Abstr 486
Outcomes, % Short course radiation Concurrent chemoradiation p-value
Downstaging
pCR 38 (25) 45 (19) 0.16
NAR <8 55 (36) 65 (28) 0.07
Any recurrence 21 (14.9) 32 (14.3) 0.87